quasi-static and dynamic fracture behavior of particulate...
TRANSCRIPT

Composites: Part B 43 (2012) 3467–3481
Contents lists available at SciVerse ScienceDirect
Composites: Part B
journal homepage: www.elsevier .com/locate /composi tesb
Quasi-static and dynamic fracture behavior of particulate polymer composites:A study of nano- vs. micro-size filler and loading-rate effects
Kailash C. Jajam, Hareesh V. Tippur ⇑Department of Mechanical Engineering, Auburn University, Auburn, AL 36849, USA
a r t i c l e i n f o a b s t r a c t
Article history:Received 17 October 2011Received in revised form 21 December 2011Accepted 2 January 2012Available online 10 January 2012
Keywords:A. Polymer–matrix composites (PMCs)A. Particle-reinforcementB. FractureB. Impact behaviourMicro- vs. nano-composites
1359-8368/$ - see front matter � 2012 Elsevier Ltd. Adoi:10.1016/j.compositesb.2012.01.042
⇑ Corresponding author. Tel.: +1 334 844 3327; faxE-mail addresses: [email protected] (K.C. J
(H.V. Tippur).
The role of nano- vs. micro-filler particle size-scale on static and dynamic fracture behaviors of silica-filled epoxy is examined. Particulate composites of epoxy matrix are studied under quasi-static andstress-wave loading conditions. Mode-I crack initiation and crack growth behaviors are examined using2D digital image correlation method and high-speed photography in symmetrically impacted specimens.The measured displacement fields are analyzed using 2D crack-tip fields for dynamically propagatingcracks in brittle solids to extract stress intensity factor (Kd
I ) histories, and crack velocity histories (V).Kd
I –V plots for each type of composite are also presented. The quasi-static fracture tests show fracturetoughness enhancement in case of nanocomposites relative to micro-particle filled ones. On the otherhand, the dynamic crack-initiation toughness is consistently higher for micro-particle filled compositesrelative to the nano-filler counterparts. These counterintuitive results are supported by crack velocity his-tories in nanocomposites being significantly higher than that observed in micro-filler cases. The charac-teristic Kd
I –V profiles suggest higher terminal velocities and lower dynamic fracture toughness fornanocomposites. Also, the post-mortem analyses of fracture surfaces reveal greater surface ruggednessfor nanocomposites under quasi-static conditions. However, the opposite is evident under dynamic load-ing conditions. The qualitative and quantitative fractographic measurements correlate well with themeasured fracture parameters for both quasi-static and dynamic fracture tests.
� 2012 Elsevier Ltd. All rights reserved.
1. Introduction
Particulate polymer composites (PPCs) generally consist ofmicro- or nano-fillers of different sizes and shapes randomlydispersed in polymer matrices. Over the years there has been con-siderable interest in these materials since the dispersed fillers canbe used to easily control the overall stiffness, strength, fracturetoughness and impact energy absorption of the resulting compos-ite. Most reports to date deal with PPCs made of micron-size parti-cles. Recent advances in materials processing techniques, however,have made it possible to reduce particle dimensions to nano-scaleproviding high specific surface area. It has also been well estab-lished that rigid inorganic fillers provide macroscopic isotropy aswell as enhanced fracture toughness and high energy absorptioncapabilities to brittle polymers [1–4]. Past studies [5–9] onmicron-size particle filled composites suggest that fracture tough-ness is essentially governed by filler particle shape, size, volumefraction and filler–matrix interfacial strength. However, particlesize in the nano-scale could vary the mechanical response ingeneral and fracture behavior in particular depending upon the
ll rights reserved.
: +1 334 844 3307.ajam), [email protected]
nature of loading, quasi-static or dynamic. In view of this, the cur-rent work is aimed towards examining the role of filler size-scale(nano- vs. micro-) on fracture response of PPCs under quasi-staticand dynamic loading conditions.
Investigations pertaining to mechanical and fracture behaviorsof nanocomposites and associated toughening mechanisms re-ported in the literature are briefly reviewed in the following. Re-cently, Hsieh et al. [10] have studied the toughening mechanismsof epoxies modified with silica nanoparticles of mean diameter20 nm. They have reported steady increase in elastic modulus, qua-si-static fracture toughness, KIc, and fracture energy, GIc with parti-cle volume fraction (Vf) and identified localized shear bands anddebonding of particles leading to void growth as the main toughen-ing mechanisms. Reynaud et al. [11] used in situ polymerizationtechnique to produce nanocomposites consisting of nano-silica(12–50 nm) embedded in polyamide 6. They observed enhancedtensile yield strength with decreasing particle size and suggest thatmultiple debonding occurs throughout the clusters of 12 nm parti-cles, whereas 50 nm filler particles do not aggregate and each par-ticle undergoes a single debonding process. Boesl et al. [12] and Liuet al. [13] noted enhanced fracture response of nano-size ZnO(53 nm) and nano-silica (20 nm) modified epoxies, respectively.Rosso et al. [14] examined the effect of 5% Vf silica nanoparticles(�50 nm) on quasi-static fracture of Araldite-F epoxy and noted

1 The choice of the latter was based on the previous study [28] that offered thelargest gain in dynamic fracture toughness under dynamic loading conditions.
3468 K.C. Jajam, H.V. Tippur / Composites: Part B 43 (2012) 3467–3481
70% and 140% improvement in KIc and GIc, respectively. The incor-poration Al2O3 (13 nm) and TiO2 (200–500 nm) nanoparticles inepoxy by Wetzel et al. [15] showed improved flexural stiffnessand strength as well as quasi-static fracture toughness and fractureenergy. Their work pointed out crack-tip blunting, crack deflectionand crack pinning as major sources of toughening. Liang and Pear-son [16] incorporated two particle sizes of nanosilica (20 and80 nm) to study the size effect on toughening mechanisms ofepoxy–silica nanocomposites. They demonstrated that both parti-cle sizes improved KIc and GIc with volume fraction due to matrixplastic deformation led zone shielding toughening mechanismbut particle size showed negligible effect on variation of fracturetoughness. Tsai et al. [17] noted enhanced mechanical propertiesand fracture toughness for nanosilica (25 nm) reinforced epoxies.The fracture response of bidispersed nano- and micro-filler epoxiesexamined by Kwon et. al. [18] found to be dependent on the parti-cle–matrix interactions as well as on temperature. Johnsen et al.[19] carried out mechanical and fracture studies on nanosilica(20 nm) filled-epoxies up to 13% Vf and observed enhanced KIc
and GIc due to void growth and particle–matrix debonding. A re-view by Jordan et al. [20] on experimental trends in polymer nano-composites highlights issues associated with processing andmechanical responses of nano- vs. micron-sized particulate com-posites. They summarized that nanocomposites serve better insome mechanical aspects than the micron-sized counterparts.However, no universal trends were established as nanocompositesshowed large deviations in properties due to physical and chemicaldifferences between the constituent phases and fabrication chal-lenges. Similarly, more recent reviews by Sun et al. [21] and Fuet al. [22] suggest that energy absorption characteristics of nano-composites under quasi-static or impact loading conditionsdepends on key parameters such as shape, dimension of nano-particles, mechanical properties of the filler and the host matrix,filler-matrix interfacial strength, as well as volume fraction andparticle dispersion in the matrix.
A few comparative studies have also been carried out to under-stand the effects of size-scale and particle volume fraction on thefracture behavior and fracture toughness of nano- and micro-par-ticle-filled composites under quasi-static loading conditions. Forexample, Singh et al. [23] reinforced polyester resin with alumi-num particles of nano- (100 nm) and micron-sizes (3.5 and20 lm). They noted monotonic increase in KIc with volume fractionfor a given particle size and higher KIc in the case of nano-filledcomposites than the micron-sized ones up to a volume fractionof 2.3%. Adachi et al. [24] studied quasi-static fracture behaviorof nano- and micro-spherical silica-filled epoxies and observed im-proved KIc in the nano-filler cases than the micron-size counter-parts. In contrast, Hussain et al. [25] investigated fracturebehavior of particle-filled epoxy composites by varying TiO2 fillervolume fraction and particle size (20 nm and 1 lm). They foundthat composites with micron size particles exhibited higher frac-ture toughness with increasing volume fraction than the nanopar-ticle counterparts. Mechanical response of nano- and micron-sizeTiO2 (32 nm and 0.24 lm) particle loaded epoxies was comparedby Ng et al. [26,27]. They indicate that nano-particle filled epoxyshow higher stiffness, failure strain and toughness when comparedthe one with to micron-sized ones.
Among the few dynamic fracture investigations reported onparticulate composites include the study of filler particle size onthe mode-I fracture behavior of glass-filled epoxy studied by Kiteyand Tippur [28]. They have shown that micron-size spherical glassbeads of different mean diameter in the range of 11–200 lm im-proved the fracture toughness of epoxy and noted that fracturetoughness was the highest at an optimum particle size (35 lm)at a fixed volume fraction (10%). In regards to nanocomposites, dy-namic fracture work has been reported by Shukla et al. [29] using
TiO2 (35 nm) and Al2O3 (14 nm) nanoparticles. Their results indi-cate improved fracture toughness and higher crack velocity innano-filler cases when compared to the neat resin. Evora and Shu-kla [30] performed quasi-static and dynamic fracture studies onTiO2 (36 nm) nanoparticle filled-polyester nanocomposites and ob-served higher fracture toughness under dynamic loading comparedto the quasi-static cases. In a similar dynamic fracture work usingTiO2 (36 nm) nanoparticles in polyester resin, Evora et al. [31] re-ported a relationship between mode-I dynamic stress intensity fac-tor and crack velocity and noted higher crack velocity andenhanced crack arrest toughness for nanocomposites than the vir-gin polyester.
Note that much of the published research to date on fracturebehavior of particulate composites (nano- or micro-) has been per-formed quasi-statically and very limited data exists from the per-spective of dynamic crack growth caused by rapid loading. Thisgap needs to be bridged if nanocomposites are to find engineeringapplications such as aerospace and automotive structures, sportingequipment, and high speed trains where stress-wave loading oc-curs. Further, with regard to particle size, the aforementioned frac-ture works essentially suggest a need for comparatively studyingnano- and micron-size filled composites particularly under rapidloading conditions. Thus, in this research the effects of particlesize-scale (nano- vs. micro-) and filler volume fraction on the frac-ture behavior of particulate composites are experimentally investi-gated under both quasi-static and stress-wave dominant loadingconditions. In the following section, the details of material prepa-ration, characterization, and specimen geometry are provided.Next, the basic concept and the approach of the optical methodol-ogy, the experimental setup and testing procedure used in this re-search are briefly described. This is followed by a detaileddescription of experimental results in a comparative manner forall categories of specimens in terms of load–deflection responses,quasi-static fracture toughness, dynamic fracture parameters suchas crack velocity histories, mode-I SIF histories, Kd
I –V relationships.Subsequently, the results are supported qualitatively and quantita-tively by microscopic examination of fractured surfaces and rough-ness measurements. Lastly, the major conclusions of this work arediscussed and summarized.
2. Materials processing and characterization
2.1. Materials
Two sizes of spherical rigid fillers, one nano-sized silica parti-cles of average diameter 20 nm (Nanopox F400 from Nanoresins,Germany) and the other micron-sized glass particles of meandiameter 35 lm (Spheriglass�, Potters Industries Inc.) were usedin this study.1 The Nanopox F400 consisted of 40 wt.% (�26 vol.%[10,19]) silica nanoparticles supplied as colloidal silica gel in adiglycidyl ether of bis-phenol A (DGEBA) resin whereas the micro-filler particles were received in powder form. A low viscosity epoxysystem (Epo-Thin™ from Beuhler, Inc. USA) consisting of DGEBA re-sin and an amine-based hardener in the ratio of 100:39 was em-ployed as the matrix material. This epoxy system offers lowshrinkage and relatively long duration room temperature curingcharacteristics.
2.2. Particulate composites preparation
Prior to mixing the constituents, each type of filler was pre-heated in an oven at 70 �C for an hour in order to release any

K.C. Jajam, H.V. Tippur / Composites: Part B 43 (2012) 3467–3481 3469
trapped moisture and then cooled gradually to ambient tempera-ture. The nanocomposites and the micron-size particle filled com-posites were loaded with 3%, 5%, 7%, and 10% of fillers (by volume).Care was exercised to ensure uniform distribution of each type offiller throughout the matrix. It should be noted that the NanopoxF400 resin pre-loaded with silica nanoparticles was diluted firstby the required amount of DGEBA resin in such a way that theend product had the appropriate content of nanosilica for the de-sired volume fraction. The material was mixed using a magneticstirrer for 20 min at 50 �C to obtain a homogenous mixture. Whilethe mixture remained at a relatively low viscosity at 50 �C, degas-sing was done every 30 min for 2 h to remove any trapped bubblesgenerated during mixing. This ensured full degassing of the mix-ture. This also allowed sufficient time for the mixture to reachroom temperature. After degassing, the stoichiometric amount ofthe hardener was added to the mixture, which was again magnet-ically stirred for 5 min and degassed for 20 min. The mixture wasthen poured into molds coated with a release-agent. For the prep-aration of micro-particle filled composites, the predeterminedamounts of filler particle volume fractions were added into DGEBAepoxy resin followed by mixing and degassing steps as mentionedabove. However, in this case, after mixing of hardener and degas-sing, the mixture was continuously stirred until the mixtureshowed a tendency to gel before pouring into molds. This helpedto eliminate sedimentation of the filler particles during subsequentcuring. The poured mixtures were allowed to cure for 96 h at roomtemperature. The cured sheets were removed from the molds andfurther rested for a week prior to machining and testing.
2.3. Microstructural characterization
Microscopic studies were done to get an insight of the quality ofexfoliation of filler particles into epoxy matrix. The particle distri-
Fig. 1. Micrographs showing particle dispersion: (a) TEM image of 3% Vf nano-filler. (b) TEmicrograph of 10% Vf micro-filler.
bution in nano- and micro-particle filled composites was examinedusing transmission electron microscope (TEM) and optical micro-scope, respectively. In the case of nanocomposites, thin film slices(80–90 nm thick) for TEM were microtomed using Leica UltraCut TMicrotome. These slices were then mounted on carbon-filmed cop-per grids and the associated through-thickness morphologies wereviewed using a ZEISS EM10 transmission electron microscope at anaccelerating voltage of 70 kV. For micron-size particulate compos-ites, samples with cross-sectional area 15 mm � 8 mm were cutand polished sequentially using 600, 1000 and 2000 grit wet emerypapers. The polished surfaces of these samples were viewed usingNikon Eclipse L150 optical microscope.
Fig. 1 shows micrographs depicting particle distribution innano- and micro-particle filled composites. It can be seen that par-ticle agglomeration is absent in all micrographs. The TEM images inFig. 1a and b show a very uniform distribution of nanoparticlesthroughout the epoxy matrix with 3% and 10% Vf, respectively.Note that the bigger and darker spots in the TEM images indicateoverlapping of two or more particles in the thickness direction.As noted earlier, the TEM specimens were �90 nm thick, and hence,the apparent volume fraction of nanoparticles is higher than the truevolume fraction. The optical images in Fig. 1c and d show well-dis-persed micro-particles with 3% and 10% Vf, respectively. It shouldbe noted that unlike TEM images the optical micrographs showparticle distribution imaged only at zero thickness. The dark spotsin these micrographs are debris due to polishing and the dark linesare scratch marks.
2.4. Elastic characterization
The elastic and physical characteristics of filled composites as afunction of volume fraction of the dispersant were determined byindirect means of ultrasonic pulse-echo measurement at several
M image of 10% Vf nano-filler. (c) Optical micrograph of 3% Vf micro-filler. (d) Optical
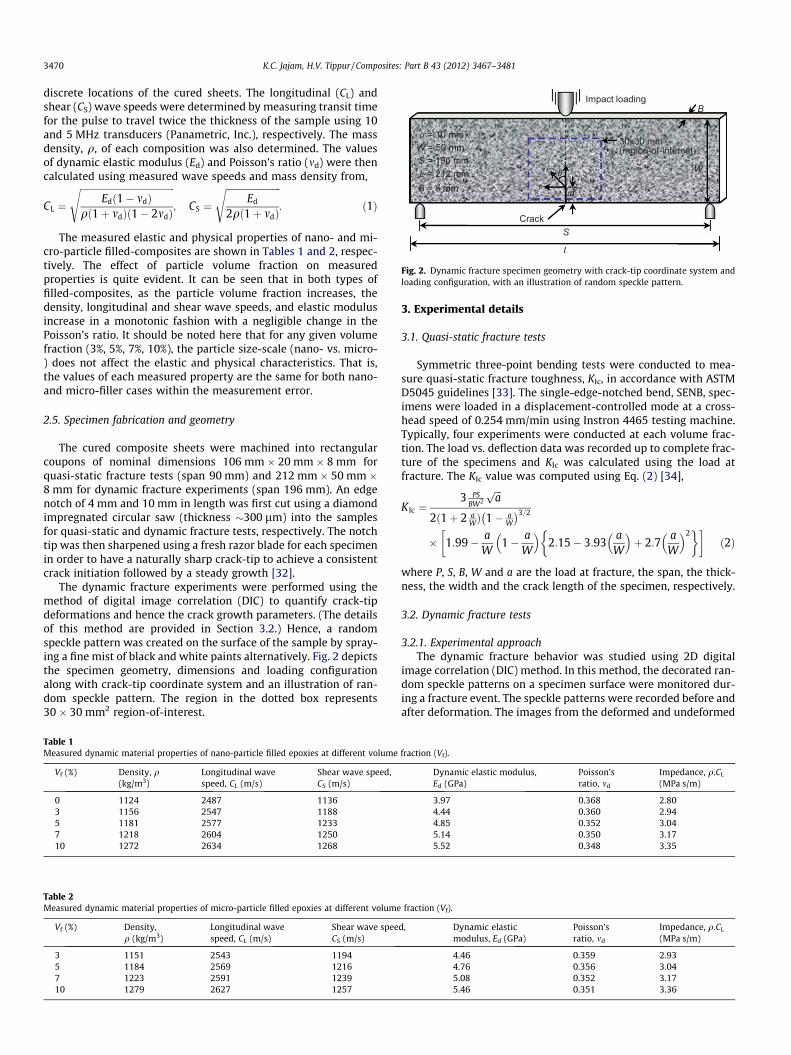
Fig. 2. Dynamic fracture specimen geometry with crack-tip coordinate system andloading configuration, with an illustration of random speckle pattern.
3470 K.C. Jajam, H.V. Tippur / Composites: Part B 43 (2012) 3467–3481
discrete locations of the cured sheets. The longitudinal (CL) andshear (CS) wave speeds were determined by measuring transit timefor the pulse to travel twice the thickness of the sample using 10and 5 MHz transducers (Panametric, Inc.), respectively. The massdensity, q, of each composition was also determined. The valuesof dynamic elastic modulus (Ed) and Poisson’s ratio (md) were thencalculated using measured wave speeds and mass density from,
CL ¼
ffiffiffiffiffiffiffiffiffiffiffiffiffiffiffiffiffiffiffiffiffiffiffiffiffiffiffiffiffiffiffiffiffiffiffiffiffiffiffiffiffiEdð1� mdÞ
qð1þ mdÞð1� 2mdÞ
s; CS ¼
ffiffiffiffiffiffiffiffiffiffiffiffiffiffiffiffiffiffiffiffiffiffiffiffiEd
2qð1þ mdÞ
s: ð1Þ
The measured elastic and physical properties of nano- and mi-cro-particle filled-composites are shown in Tables 1 and 2, respec-tively. The effect of particle volume fraction on measuredproperties is quite evident. It can be seen that in both types offilled-composites, as the particle volume fraction increases, thedensity, longitudinal and shear wave speeds, and elastic modulusincrease in a monotonic fashion with a negligible change in thePoisson’s ratio. It should be noted here that for any given volumefraction (3%, 5%, 7%, 10%), the particle size-scale (nano- vs. micro-) does not affect the elastic and physical characteristics. That is,the values of each measured property are the same for both nano-and micro-filler cases within the measurement error.
2.5. Specimen fabrication and geometry
The cured composite sheets were machined into rectangularcoupons of nominal dimensions 106 mm � 20 mm � 8 mm forquasi-static fracture tests (span 90 mm) and 212 mm � 50 mm �8 mm for dynamic fracture experiments (span 196 mm). An edgenotch of 4 mm and 10 mm in length was first cut using a diamondimpregnated circular saw (thickness �300 lm) into the samplesfor quasi-static and dynamic fracture tests, respectively. The notchtip was then sharpened using a fresh razor blade for each specimenin order to have a naturally sharp crack-tip to achieve a consistentcrack initiation followed by a steady growth [32].
The dynamic fracture experiments were performed using themethod of digital image correlation (DIC) to quantify crack-tipdeformations and hence the crack growth parameters. (The detailsof this method are provided in Section 3.2.) Hence, a randomspeckle pattern was created on the surface of the sample by spray-ing a fine mist of black and white paints alternatively. Fig. 2 depictsthe specimen geometry, dimensions and loading configurationalong with crack-tip coordinate system and an illustration of ran-dom speckle pattern. The region in the dotted box represents30 � 30 mm2 region-of-interest.
Table 1Measured dynamic material properties of nano-particle filled epoxies at different volume
Vf (%) Density, q(kg/m3)
Longitudinal wavespeed, CL (m/s)
Shear wave speed,CS (m/s)
0 1124 2487 11363 1156 2547 11885 1181 2577 12337 1218 2604 125010 1272 2634 1268
Table 2Measured dynamic material properties of micro-particle filled epoxies at different volume
Vf (%) Density,q (kg/m3)
Longitudinal wavespeed, CL (m/s)
Shear wave speeCS (m/s)
3 1151 2543 11945 1184 2569 12167 1223 2591 123910 1279 2627 1257
3. Experimental details
3.1. Quasi-static fracture tests
Symmetric three-point bending tests were conducted to mea-sure quasi-static fracture toughness, KIc, in accordance with ASTMD5045 guidelines [33]. The single-edge-notched bend, SENB, spec-imens were loaded in a displacement-controlled mode at a cross-head speed of 0.254 mm/min using Instron 4465 testing machine.Typically, four experiments were conducted at each volume frac-tion. The load vs. deflection data was recorded up to complete frac-ture of the specimens and KIc was calculated using the load atfracture. The KIc value was computed using Eq. (2) [34],
K Ic ¼3 PS
BW2
ffiffiffiap
2ð1þ 2 aWÞ 1� a
W
� �3=2
� 1:99� aW
1� aW
� �2:15� 3:93
aW
� �þ 2:7
aW
� �2� �
ð2Þ
where P, S, B, W and a are the load at fracture, the span, the thick-ness, the width and the crack length of the specimen, respectively.
3.2. Dynamic fracture tests
3.2.1. Experimental approachThe dynamic fracture behavior was studied using 2D digital
image correlation (DIC) method. In this method, the decorated ran-dom speckle patterns on a specimen surface were monitored dur-ing a fracture event. The speckle patterns were recorded before andafter deformation. The images from the deformed and undeformed
fraction (Vf).
Dynamic elastic modulus,Ed (GPa)
Poisson’sratio, md
Impedance, q.CL
(MPa s/m)
3.97 0.368 2.804.44 0.360 2.944.85 0.352 3.045.14 0.350 3.175.52 0.348 3.35
fraction (Vf).
d, Dynamic elasticmodulus, Ed (GPa)
Poisson’sratio, md
Impedance, q.CL
(MPa s/m)
4.46 0.359 2.934.76 0.356 3.045.08 0.352 3.175.46 0.351 3.36

K.C. Jajam, H.V. Tippur / Composites: Part B 43 (2012) 3467–3481 3471
sets were paired and analyzed using image correlation methodol-ogy. Conceptually, a sub-image in an undeformed image was se-lected and its location in the corresponding deformed image wassearched to find its local displacements. In this study, an approachdeveloped [35–37] on a MATLABTM platform was used to estimatein-plane surface displacement components. In the first step, dis-placements were estimated by performing a 2D cross-correlationof gray scales in the Fourier domain and the peak of the correlationfunction detected to a sub-pixel accuracy using bicubic interpola-tion. This process was repeated for the entire image to obtainfull-field in-plane displacements. In the second step, an iterativeapproach based on nonlinear least-squares minimization was usedto minimize the 2D cross-correlation function in the spatial do-main to refine the previously computed displacements as initialguess. Further details are avoided here for brevity.
3.2.2. Experimental setup and testing procedureThe schematic of the experimental set-up used is shown in
Fig. 3. It included a drop-tower (Instron-Dynatup 9250HV, USA)for impact loading the specimens and a Cordin 550 ultra high-speed digital framing camera (Cordin Scientific Imaging, USA) forrecording speckle images during the fracture event. The drop-tower was equipped with an instrumented tup (hemispherical pro-file) and a pair of instrumented anvils for recording force and sup-port reaction histories, respectively. The set-up also includedinstrumentation to produce a delayed trigger pulse when theimpactor contacted the specimen (t = 0). Two high-energy flashlamps, triggered by the camera and a pulse generator, were em-ployed to illuminate the sample surface. Also, two separate com-puters, one to record the impact force and anvil reactionhistories, and the other to control the high-speed camera and tostore the images were used. The light intensity from the specimensurface in the region of interest was recorded.
The Cordin 550 ultra high-speed digital framing camera is capa-ble of recording images on 32 individual 1000 � 1000 pixel (pixelsize: 7.4 lm square) CCD sensor array positioned circumferentiallyaround a five-facet rotating mirror which reflects and sweeps lightover these sensors. Additional details about the camera perfor-mance evaluation and optical calibration can be found in Refs.[35–37]. The specimen decorated with random speckles was ini-tially rested on two instrumented anvils and the camera was fo-cused on a 30 � 30 mm2 region-of-interest in the crack-tipvicinity. Prior to impacting the specimen, a set of 32 images wererecorded at a chosen framing rate. While keeping all camera set-tings same, a second set of 32 images was captured when the spec-
Fig. 3. Schematic of the experimental setup for dynamic fracture study.
imen was impacted at a velocity of 4.5 m/s. In order to capture theentire fracture event, the images in the case of micro-particle filledcomposites were recorded at a framing rate of 250,000 frames persecond whereas framing rates ranging from 250,000–300,000frames per second were used for nanocomposite specimens. A totalof 32 images were recorded for undeformed and deformed sets.The corresponding two images of each sensor were paired fromundeformed and deformed sets and analyzed.
3.2.3. Image analysis detailsAs noted earlier, the recorded speckle images corresponded to a
30 � 30 mm2 region on the specimen surface. The size of the dec-orated speckles and the optical magnification used were such thateach speckle occupied 4–6 pixels on the image plane. Care was alsoexercised regarding electronic gain setting of the high-speed cam-era sensors and intensity of the flash lamps to produce a nearGaussian distribution of gray scales for each image in the mid-range of 0–255 (8 bit) intensities. That is, saturation or underexpo-sure of pixels was avoided by trial and error prior to carrying outthe actual experiment. Each resulting image was segmented intosub-images consisting of 26 � 26 pixels for analysis. While analyz-ing images, no overlapping of sub-images was used. This resultedin 37 � 37 matrix of data points in the region-of-interest.
3.2.4. Evaluation of crack velocity and stress intensity factors (SIFs)The position of the current crack-tip from each digitized image
was used to measure the instantaneous values of crack length.However, the presence of digitizing errors often manifests in thecrack extension data. To minimize this error, the crack length dataat an instant i was smoothed using a quadratic Bézier curve [38],
aiðsÞ ¼ ð1� sÞ2di þ 2sð1� sÞdiþ1 þ s2diþ2; 0 6 s 6 1 ð3Þ
where s, d and a are the smoothing parameter, the digitized data,and the smoothed crack length data, respectively. In the aboveexpression di, di+1, di+2 are the control points of ai(s). A smoothingparameter of 0.5 was chosen so that the smoothed data point is lo-cated at midway from a data point to an adjacent point. Subse-quently, the crack velocity (V) was estimated from the smoothedcrack length histories using forward difference method,
Vi ¼dadt
� �i
¼ aiþ1 � ai
tiþ1 � tið4Þ
where a and t are crack length and time, respectively, at a given in-stant i.
The mode-I and mode-II stress intensity factors (SIFs) wereevaluated using an over-deterministic least-squares analysis ofcrack-opening and crack-sliding displacements, respectively. Thegoverning asymptotic expressions for crack-opening (v) and crack-sliding (u) displacement fields near the tip of a dynamically loadedstationary crack are expressed as follows:
uðr; hÞvðr; hÞ
� �¼X1n¼1
ðKdI Þn
2lrn=2ffiffiffiffiffiffiffi
2pp
�j cos n
2 h� n2 cos n
2� 2� �
hþ n2þ ð�1Þn �
cos n2 h
j sin n2 hþ n
2 sin n2� 2� �
h� fn2þ ð�1Þng sin n
2 h
( )
þX1n¼1
ðKdIIÞn
2lrn=2ffiffiffiffiffiffiffi
2pp
�j sin n
2 h� n2 sinðn2� 2Þhþ fn
2� ð�1Þng sin n2 h
�j cos n2 h� n
2 cos n2� 2� �
hþ fn2� ð�1Þng cos n
2 h
( )
ð5Þ
where r and h are the polar coordinates defined at the current crack-tip, j is ð3� mdÞ=ð1þ mdÞ for plane stress where md is the Poisson’s

δ (mm)0.0 0.3 0.6 0.9 1.2 1.5
P (N
)
specimen 1specimen 2specimen 3specimen 4
Nano-filler (10% Vf)
δ (mm)0.0 0.3 0.6 0.9 1.2 1.5
P (N
)
specimen 1specimen 2specimen 3specimen 4
Micro-filler (10% Vf)
0
200
400
600
800
1000
1200
1400
0
200
400
600
800
1000
1200
1400
(a)
(b)
Fig. 4. Experimental repeatability in quasi-static fracture tests: (a) Load–deflectionresponse of 10% Vf nano-filler modified epoxy. (b) Load–deflection response of 10%Vf micro-filler modified epoxy.
3472 K.C. Jajam, H.V. Tippur / Composites: Part B 43 (2012) 3467–3481
ratio and l is the shear modulus. In the above expressions, the coef-ficients ðKd
I Þn and ðKdIIÞn of the dominant terms (n = 1) are the so-
called mode-I and mode-II dynamic SIFs, respectively. The abovein-plane displacement fields implicitly assume that the inertia ef-fects are accounted for by the coefficients while maintaining thefunctional form of the quasi-static counterpart. However, whenthe crack initiates, the in-plane displacement components v and ufor a steadily growing crack are given by [39]:
uðr; hÞvðr; hÞ
� �¼X1n¼1
ðKdI ÞnBIðVÞ
2l
ffiffiffiffi2p
rðnþ 1Þ
�rn=2
1 cos n2 h1 � hðnÞrn=2
2 cos n2 h2
�b1rn=21 sin n
2 h1 þ hðnÞb2
rn=22 sin n
2 h2
( )
þX1n¼1
ðKdIIÞnBIIðVÞ
2l
ffiffiffiffi2p
rðnþ 1Þ
�rn=2
1 sin n2 h1 � hð�nÞrn=2
2 sin n2 h2
b1rn=21 cos n
2 h1 þ hð�nÞb2
rn=22 cos n
2 h2
( )ð6Þ
where
rm ¼ffiffiffiffiffiffiffiffiffiffiffiffiffiffiffiffiffiffiffiffiffix2 þ b2
my2q
; hm ¼ tan�1ðbmy=xÞ;m ¼ 1;2;
b1 ¼ffiffiffiffiffiffiffiffiffiffiffiffiffiffiffiffiffiffiffiffiffiffiffiffiffiffi1� ðV=CLÞ2
q; b2 ¼
ffiffiffiffiffiffiffiffiffiffiffiffiffiffiffiffiffiffiffiffiffiffiffiffiffiffi1� ðV=CSÞ2
q
CL ¼
ffiffiffiffiffiffiffiffiffiffiffiffiffiffiffiffiffiffiffiðjþ 1Þlðj� 1Þq
s;CS ¼
ffiffiffiffilq
r;j ¼
ð3� mÞ=ð1þ mdÞ : plane stressð3� 4mdÞ : plane strain
�
hðnÞ ¼2b1b2=ð1þ b2
2Þ : n odd
ð1þ b22Þ=2 : n even
(and hð�nÞ ¼ hðnþ 1Þ
BIðVÞ ¼ð1þ b2
2ÞD
; BIIðVÞ ¼2b2
D; D ¼ 4b1b2 � ð1þ b2
2Þ2: ð7Þ
In the above equations, (x, y) and (r, h) are the instantaneousCartesian and polar coordinates, respectively, aligned at the cur-rent crack-tip, V is the crack-tip velocity, CL and CS are homoge-nized longitudinal and shear wave speeds of the material, q isthe mass density, l and md are the shear modulus and the Poisson’sratio, respectively. Again, the coefficients ðKd
I Þn and ðKdIIÞn of the
dominant terms (n = 1) are the mode-I and mode-II dynamic SIFsrespectively. Further, Eq. (6) can be reduced to the form of adynamically loaded stationary crack in the limit the crack velocityV ? 0.
In order to extract SIF history, the crack-opening and crack-slid-ing displacement fields were digitized by identifying the currentcrack-tip location in the image. The displacement data used inthe analysis was collected in the vicinity of the crack-tip and lim-ited to the region 0.4 < r/B < 1.5 and (�150� � h� �90� and 90� � h� 150�) to minimize 3D effects on least-squares analysis [40]. Ateach data point, v and u displacement values as well as the locationof these points were stored. The digitized data were used in Eqs. (5)and (6) along with an over-deterministic least-squares analysisscheme to estimate the SIFs. This process was carried out for all im-age pairs and the SIF histories were generated.
4. Results
4.1. Experimental repeatability
In order to verify repeatability in fracture behaviors andmeasurements, multiple experiments were performed for bothnano- and micro-filler composites under quasi-static and dynamic
loading conditions. Fig. 4a and b show results for multiple quasi-statically fractured specimens. An excellent repeatability in load–deflection responses of four specimens can be seen at 10% volumefraction for each category. At this volume fraction, the nanocom-posite specimens fractured at a peak load of 1158 ± 45 N, whereasthe specimens with micro-filler failed at 687 ± 12 N. A noticeabledeparture from linearity of global load–deflection response closeto fracture is evident in Fig. 4a whereas the plots remain linear inFig. 4b up to fracture.
Figs. 5–7 show repeatability in dynamic fracture behavior interms of crack velocity, mode-I SIF and load histories at 10% Vf
for nano- as well as micro-filler composites. Fig. 5a and b depictrepeatability in crack growth histories in three specimens for eachtype of filler. Here ti denotes the time at crack initiation after im-pact. In all the cases it can be seen that following initiation, crackaccelerated and attained a steady state velocity. At 10% Vf, thenano-filler specimens show a steady state velocity of approxi-mately 570 m/s whereas it is about 220 m/s in the micro-fillercases. All the three specimens in each category show good repeat-ability in crack velocity profiles.
The mode-I SIF, KdI histories obtained using the method de-
scribed earlier for the same three specimens are shown in Fig. 6aand b for nano- as well as micro-filler composites, respectively.The Kd
I at crack initiation is indicated by an arrow for each speci-men. For nano-filler specimens the crack initiation (after impact)time range is 113–120 ls whereas for micro-filler ones it is 120–124 ls. From the perspective of dynamic fracture experiments, itis important to note that the Kd
I profiles show excellent repeatabil-ity of the entire fracture event for each type of filler. Again, for both

t - ti (μs)
V (m
/s)
specimen 1specimen 2specimen 3
Nano-filler (10% Vf)
t - ti (μs)
0 10 20 30 40 50
0 10 20 30 40 50 60 70
V (m
/s)
specimen 1specimen 2specimen 3
Micro-filler (10% Vf)
0
100
200
300
400
500
600
700
100
300
500
700
0
200
400
600
(a)
(b)
Fig. 5. Experimental repeatability in dynamic fracture tests: (a) Crack-tip velocityhistories of 10% Vf nano-filler modified epoxy. (b) Crack-tip velocity histories of 10%Vf micro-filler modified epoxy.
specimen 1specimen 2specimen 3
Nano-filler (10% Vf)
t (μs)60 80 100 120 140 160 180
0.0
0.5
1.0
1.5
2.0
2.5
3.0(a)
t (μs)60 80 100 120 140 160 180 200
K Id (MPa
m1/
2 )K Id (M
Pa m
1/2 )
specimen 1specimen 2specimen 3
Micro-filler (10% Vf)
0.0
0.5
1.0
1.5
2.0
2.5
3.0(b)
Fig. 6. Experimental repeatability in dynamic fracture tests: (a) Mode-I dynamic SIFhistories of 10% Vf nano-filler modified epoxy. (b) Mode-I dynamic SIF histories of10% Vf micro-filler modified epoxy. The crack-initiation value is indicated by anarrow for each specimen. Note that post-initiation Kd
I values are increasing moreslowly in nano-filler case compared to micro-filler counterpart.
K.C. Jajam, H.V. Tippur / Composites: Part B 43 (2012) 3467–3481 3473
types of composites, the SIF increases monotonically up to crackinitiation and pre-initiation SIF histories essentially coincide forall three specimens. For nano-filler specimens, the value of Kd
I atinitiation is �1.85 MPa m1/2 whereas it is �2.13 MPa m1/2 for mi-cro-filler specimens. Following crack initiation, a noticeable dropin Kd
I can be seen in each specimen for both filler categories dueto unloading near the initial notch tip. This is followed by a gradualincrease in Kd
I until the fracture is complete for both filler types.The rise in post-initiation Kd
I values is smaller in the nano-particlefilled epoxy ðdKd
I =dt � 5:3� 103 MPa m1=2=sÞ when compared tothe micron-size filler counterpart ðdKd
I =dt � 13� 103 MPa m1=2=sÞ.The tup and anvil load histories were recorded for each experi-
ment and are shown in Fig. 7a and b for the three nano- and micro-particle filled specimens with 10% Vf, respectively. In these plots,again an excellent repeatability in tup load as well as in left andright support reaction histories is quite evident for all three speci-mens. In these experiments, the complete fracture of the specimenoccurred within �200 ls after impact. Thus, only the dominantfirst peak of the tup load history is significant. Note that the peakimpact force (compressive) recorded by the tup in case of micro-filler specimens is slightly higher than the nano-filler counterparts,suggesting the role of particle size. It can also be seen that supportsregister the reaction force only after �300 ls by which time thecrack had already traversed the specimen width. This shows thatreaction forces from support anvils do not contribute to the crackinitiation and crack growth in the specimens, suggesting that afree-free cracked beam should suffice analytical or computationalmodeling of these experiments.
4.2. Quasi-static fracture behavior
The quasi-static fracture test results are summarized in Figs. 8and 9. The load vs. deflection responses at different volume frac-tions are plotted in Fig. 8a and b for nano- and micro-filler epoxies,respectively. It can be seen that for both filler loadings, the loadrises linearly (except 7% and 10% Vf nanocomposites showingnoticeable nonlinearity prior to fracture) up to a point at whichabrupt crack growth ensues causing a sudden drop in the load. Itcan also be observed that the peak loads and the correspondingload-point deflections show increasing trends, suggesting that thework needed for crack initiation (area under the load–deflectioncurve), increases with filler volume fraction. Further, note that inboth types of fillers the stiffness of the filled-composites generallyincrease with filler volume fraction. Moreover, for any given vol-ume fraction the nano-filler specimens sustained higher loads aswell as deflections up to failure when compared to micro-fillercounterparts.
The quasi-static fracture toughness, KIc, measured at the onsetof crack growth in each case and the variation of KIc as a functionof volume fraction of nano- and micro-fillers is plotted in Fig. 9.Each data point represents an average of four measured values ofKIc and the error bars indicate their standard deviations. For bothtypes of filler loadings, the fracture toughness increases relativeto neat epoxy as Vf increases. The observed trends in KIc for bothtypes of filler loadings are in agreement with previous works onmicro-particle filled [2–5] and nanosilica filled [12–17] epoxies.

t (μs)50 150 250 350
Load
(kN
)
specimen 1specimen 2specimen 3
Nano-filler (10% Vf)
Tup
Left and right anvils
t (μs)50 150 250 350
0 100 200 300
0 100 200 300
Load
(kN
)
-2
-1
0
1
2
3
4
specimen 1specimen 2specimen 3
Micro-filler (10% Vf)
Tup
Left and right anvils
-2
-1
0
1
2
3
4(a)
(b)
Fig. 7. Experimental repeatability of load histories for dynamic fracture tests: (a)10% Vf nano-particle filled epoxy. (b) 10% Vf micro-particle filled epoxy. (Note thatthe tup loads are plotted as positive values for compression.)
δ (mm)
δ (mm)
P (N
)
10%7%5%3%0%
Nano-filler (Vf)
Vf
0.0 0.3 0.6 0.9 1.2 1.5
0.0 0.3 0.6 0.9 1.2 1.5
P (N
)
10%7%5%3%0%
Micro-filler (Vf)
Vf
0
200
400
600
800
1000
1200
1400
0
200
400
600
800
1000
1200
1400
(a)
(b)
Fig. 8. Load–deflection response for quasi-static fracture tests at different volumefractions: (a) Nano-filler modified epoxies. (b) Micro-filler modified epoxies.
Vf (%)1 3 5 7 9 110 2 4 6 8 10
K Ic (M
Pa m
1/2 )
nano-fillermicro-filler
1
2
3
4
5
6
Fig. 9. Variation of quasi-static fracture toughness (KIc) with filler volume fraction(Vf) for nano- and micro-filler modified epoxies.
3474 K.C. Jajam, H.V. Tippur / Composites: Part B 43 (2012) 3467–3481
Fig. 9 also shows that the fracture toughness of nano-particle filledspecimens increases dramatically with volume fraction relative tothe micro-filler counterparts. Furthermore, the enhancement in KIc
is significantly higher than the micro-filler cases for any given vol-ume fraction. For example, a �42% and �78% enhancement in KIc
values at 5% and 10% volume fraction, respectively, for nano-sizedfiller relative to micro-filler case is evident.
4.3. Dynamic fracture response
4.3.1. Surface deformation historiesA sequential arrangement of a few selected speckle images of
30 � 30 mm2 region-of-interest where surface deformations weremonitored optically during the dynamic fracture of specimens with10% volume fraction for nano- and micro-filler cases is shown inFig. 10. The first and second rows of speckle images are for nano-and micro-filler specimens, respectively. The specimens were sub-jected to symmetric impact loading and the initial notch as well asthe sharp growing crack is visible. The time instant (t) after impactat which the images were recorded is also shown and the currentcrack-tip is indicated by an arrow. In order to compare the effectof particle size-scale on the extent of crack growth, the speckleimages in each column for nano- and micro-fillers are shown herefor nearly same time instants. It can be seen that at approximatelysame time instant, crack propagation in the nano-filler specimen ismore than the micro-filler counterpart. Further, the crack exten-sion is about twice in the former compared to the latter.
As described earlier, a sub-image size of 26 � 26 pixels was cho-sen for image correlation analysis and displacements fields were
obtained as 37 � 37 data points for each pair. Subsequently,full-field in-plane displacement contours with 5 lm per contourinterval were generated. A few representative speckle images withcorresponding crack-opening (v-field or displacement along the y-axis) and crack-sliding (u-field or displacement along the x-axis)displacement contours for nano-filler (10% Vf), micro-filler (10%Vf) and neat epoxy specimens are presented in Fig. 11. Here, at aparticular time instant, t � 160 ls, crack extension in nano-fillerspecimen is larger than neat epoxy and micro-filler specimens,

Fig. 10. Few selected speckle images of nano- and micro-filler modified epoxy specimens with 10% Vf at approximately same time instants. Each image represents30 � 30 mm2 region-of-interest recorded by the high-speed digital framing camera at framing rates of 300,000 and 250,000 frames per second for nano- and micro-fillermodified epoxies, respectively. The moving crack-tip is indicated by an arrow and the dark line is the initial crack in the photographed images.
K.C. Jajam, H.V. Tippur / Composites: Part B 43 (2012) 3467–3481 3475
whereas the slowest crack growth is evident in the micro-fillerspecimen. The v- and u-fields show that contour lines and magni-tude of displacement (in lm shown by color-bars) are nearly sym-metric relative to the crack path suggesting dominant mode-Ifracture. The contour lines in the u-field show a set of isolinesemerging from right-hand side of the contour plots due to impactloading on the edge of the specimen facing the initial crack-tip.
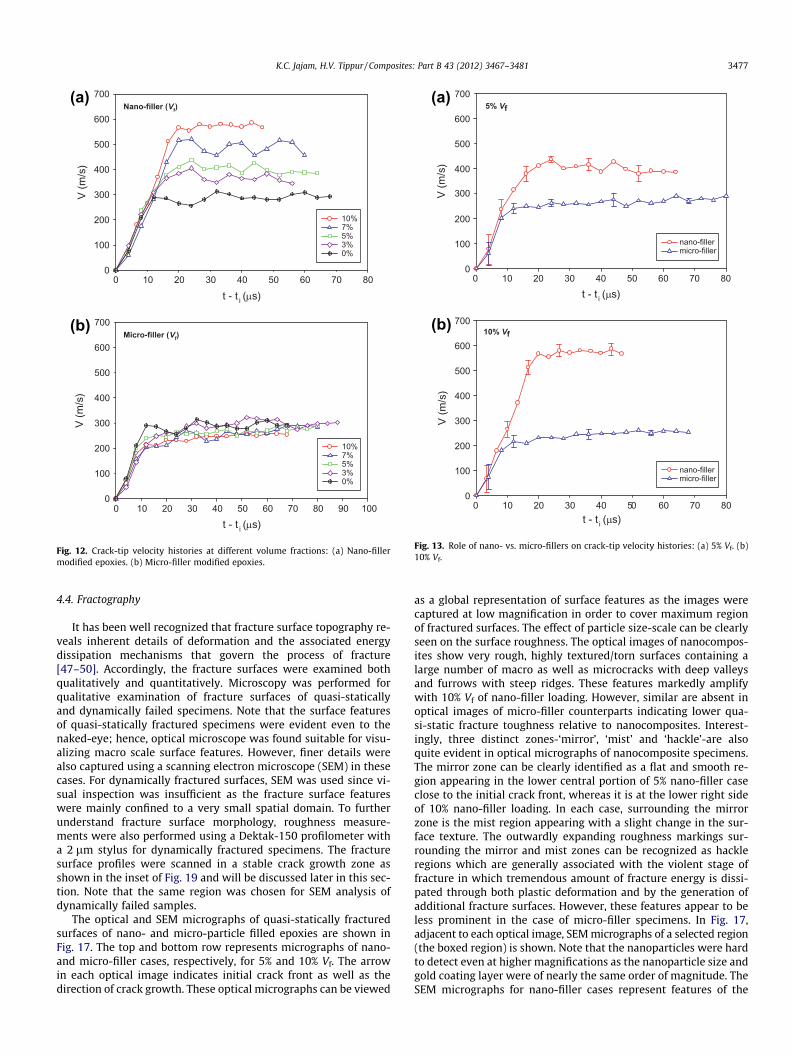
4.3.2. Crack-tip velocity historiesThe crack-tip velocity histories were estimated from the
smoothed values of instantaneous crack extension data for nano-and micro-filler cases for different volume fractions and are shownin Fig. 12a and b, respectively. It can be seen that following initia-tion the crack accelerated to a maximum value followed by a mod-est oscillatory behavior due to the transient nature of impactinduced fracture. For nano-particle filled epoxies, as shown inFig. 12a, the crack-tip velocity shows increasing steady state valuesas the particle volume fraction increases and the crack propagatesat an average velocity of approximately 300, 370, 400, 490, 570 m/sfor 0% (neat epoxy), 3%, 5%, 7%, 10% Vf cases, respectively. On theother hand, the velocity trends are the opposite in micro-particlefilled epoxies as shown in Fig. 12b. It can be noticed that theaverage crack velocity decreases slightly as the volume fractionof micron-size particles increases. The effect of particle size-scaleon the crack-tip velocity can be consistently compared by plottingcrack velocity histories for each volume fraction separately andtwo representative cases for 5% and 10% Vf are shown in Fig. 13aand b, respectively. The average crack-tip velocities in the nano-composites are approximately 60%, 160% higher than that observedin the micro-filler cases for 5%, 10% volume fractions, respectively.
4.3.3. Stress intensity factor (SIF) historiesThe optically measured mode-I SIF histories for specimens with
nano- and micro-fillers at various volume fractions are shown inFig. 14a and b, respectively. In these plots, the crack-initiation timeis denoted by t � ti = 0 ls so that the negative and positive valuescorrespond to the pre-initiation and post-initiation periods,respectively. The pre-initiation data for each specimen in bothtypes of fillers show that the mode-I dynamic SIF, Kd
I , increases
gradually until it reaches a threshold value for crack-initiation.Furthermore, the Kd
I values in the pre-initiation regime showincreasing trends as the particle volume fraction increases in bothnano- and micro-filler specimens. Following initiation, a distinctdrop in Kd
I is evident in all specimens (nano- and micro-filler)and it increases subsequently in a nearly steady-state fashion.
For clarity, consistency, and to avoid data clutter, the mode-I SIFbehavior for nano- and micro-fillers cases can be systematicallycompared by plotting SIF histories for two representative cases of5% and 10% Vf, as shown in Fig. 15a and b. These plots clearly reflectthe effect of particle size (nano- vs. micro-) on the dynamic frac-ture toughness of particulate composites at crack-initiation as wellas in the pre- and post-initiation regimes. For each volume fraction,it can be seen that in the pre-initiation period, the Kd
I values are inagreement within the measurement accuracy. However, unlikequasi-static counterparts the dynamic crack-initiation toughnessvalues for nanocomposites are lower than the micro-filler counter-parts. Also note that the post-initiation Kd
I values for nanocompos-ites are also lower than the micro-filler cases for the volumefractions shown. Hence, it is noteworthy that, under identicalimpact loading conditions, the micro-filler particulate compositesoutperform nano-filler ones at crack-initiation as well as in the post-initiation regimes. Further note that these observed trends of Kd
I
for nano- and micro-fillers are consistent with crack-tip velocityhistories shown in Fig. 13a and b, as it can be seen that the appar-ent macro scale crack growth is the slowest in micro-filler casessuggesting higher crack growth resistance, resulting in higherapparent Kd
I values.The quasi-static crack-initiation toughness (KIc) and dynamic
crack-initiation toughness (KdIi) values for nano- and micro-filler
epoxies are tabulated in Table 3. It can be seen that the fracturebehavior for both types of fillers is loading-rate sensitive. For qua-si-static loading, nano-filler epoxies show higher crack-initiationtoughness than the micro-filler ones and the opposite is seen underdynamic loading conditions.
4.3.4. KdI –V relationship
The existence of KdI –V relationship as a dynamic material charac-
teristic has been a subject of interest [41–46] in the past few
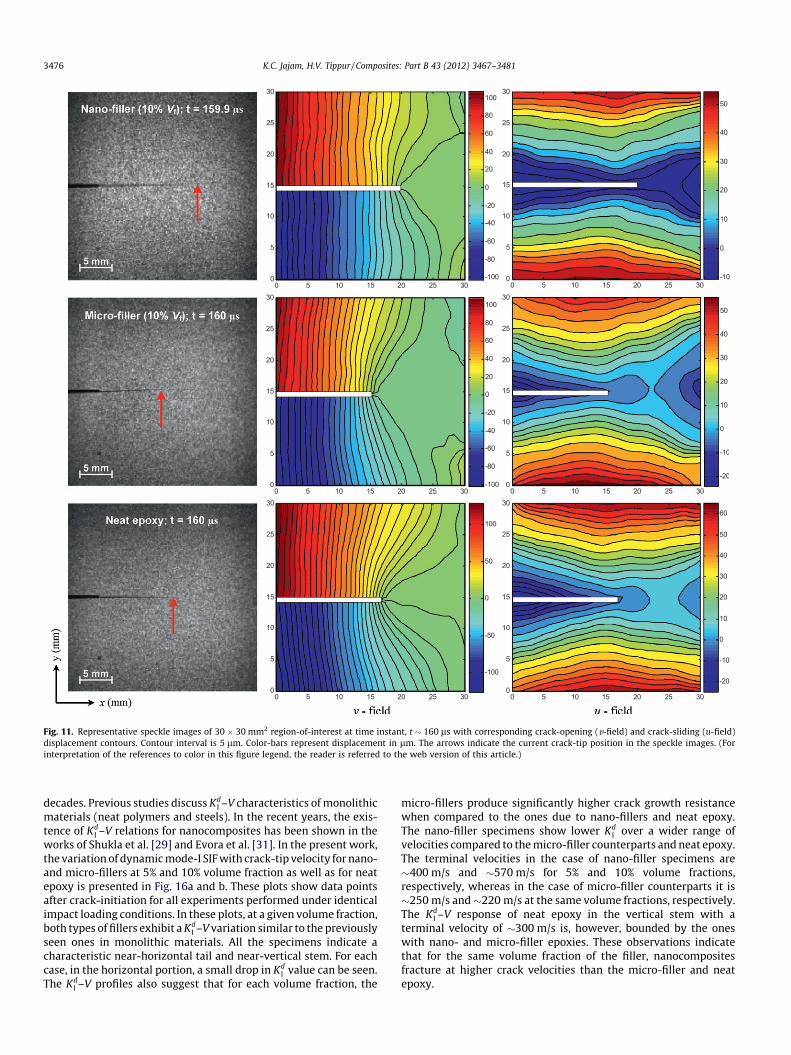
Fig. 11. Representative speckle images of 30 � 30 mm2 region-of-interest at time instant, t � 160 ls with corresponding crack-opening (v-field) and crack-sliding (u-field)displacement contours. Contour interval is 5 lm. Color-bars represent displacement in lm. The arrows indicate the current crack-tip position in the speckle images. (Forinterpretation of the references to color in this figure legend, the reader is referred to the web version of this article.)
3476 K.C. Jajam, H.V. Tippur / Composites: Part B 43 (2012) 3467–3481
decades. Previous studies discuss KdI –V characteristics of monolithic
materials (neat polymers and steels). In the recent years, the exis-tence of Kd
I –V relations for nanocomposites has been shown in theworks of Shukla et al. [29] and Evora et al. [31]. In the present work,the variation of dynamic mode-I SIF with crack-tip velocity for nano-and micro-fillers at 5% and 10% volume fraction as well as for neatepoxy is presented in Fig. 16a and b. These plots show data pointsafter crack-initiation for all experiments performed under identicalimpact loading conditions. In these plots, at a given volume fraction,both types of fillers exhibit a Kd
I –V variation similar to the previouslyseen ones in monolithic materials. All the specimens indicate acharacteristic near-horizontal tail and near-vertical stem. For eachcase, in the horizontal portion, a small drop in Kd
I value can be seen.The Kd
I –V profiles also suggest that for each volume fraction, the
micro-fillers produce significantly higher crack growth resistancewhen compared to the ones due to nano-fillers and neat epoxy.The nano-filler specimens show lower Kd
I over a wider range ofvelocities compared to the micro-filler counterparts and neat epoxy.The terminal velocities in the case of nano-filler specimens are�400 m/s and �570 m/s for 5% and 10% volume fractions,respectively, whereas in the case of micro-filler counterparts it is�250 m/s and�220 m/s at the same volume fractions, respectively.The Kd
I –V response of neat epoxy in the vertical stem with aterminal velocity of �300 m/s is, however, bounded by the oneswith nano- and micro-filler epoxies. These observations indicatethat for the same volume fraction of the filler, nanocompositesfracture at higher crack velocities than the micro-filler and neatepoxy.
t - t i (μs)
V (m
/s)
10%7%5%3%0%
Nano-filler (Vf)
t - t i (μs)
10 30 50 700 20 40 60 80
10 30 50 70 900 20 40 60 80 100
V (m
/s)
10%7%5%3%0%
Micro-filler (Vf)
0
100
200
300
400
500
600
700
100
300
500
700
0
200
400
600
(a)
(b)
Fig. 12. Crack-tip velocity histories at different volume fractions: (a) Nano-fillermodified epoxies. (b) Micro-filler modified epoxies.
t - t i (μs)
t - t i (μs)
V (m
/s)
nano-fillermicro-filler
5% Vf
10 30 50 700 20 40 60 80
10 30 50 700 20 40 60 80
V (m
/s)
nano-fillermicro-filler
10% Vf
100
300
500
700
0
200
400
600
0
100
200
300
400
500
600
700
(a)
(b)
Fig. 13. Role of nano- vs. micro-fillers on crack-tip velocity histories: (a) 5% Vf. (b)10% Vf.
K.C. Jajam, H.V. Tippur / Composites: Part B 43 (2012) 3467–3481 3477
4.4. Fractography
It has been well recognized that fracture surface topography re-veals inherent details of deformation and the associated energydissipation mechanisms that govern the process of fracture[47–50]. Accordingly, the fracture surfaces were examined bothqualitatively and quantitatively. Microscopy was performed forqualitative examination of fracture surfaces of quasi-staticallyand dynamically failed specimens. Note that the surface featuresof quasi-statically fractured specimens were evident even to thenaked-eye; hence, optical microscope was found suitable for visu-alizing macro scale surface features. However, finer details werealso captured using a scanning electron microscope (SEM) in thesecases. For dynamically fractured surfaces, SEM was used since vi-sual inspection was insufficient as the fracture surface featureswere mainly confined to a very small spatial domain. To furtherunderstand fracture surface morphology, roughness measure-ments were also performed using a Dektak-150 profilometer witha 2 lm stylus for dynamically fractured specimens. The fracturesurface profiles were scanned in a stable crack growth zone asshown in the inset of Fig. 19 and will be discussed later in this sec-tion. Note that the same region was chosen for SEM analysis ofdynamically failed samples.
The optical and SEM micrographs of quasi-statically fracturedsurfaces of nano- and micro-particle filled epoxies are shown inFig. 17. The top and bottom row represents micrographs of nano-and micro-filler cases, respectively, for 5% and 10% Vf. The arrowin each optical image indicates initial crack front as well as thedirection of crack growth. These optical micrographs can be viewed
as a global representation of surface features as the images werecaptured at low magnification in order to cover maximum regionof fractured surfaces. The effect of particle size-scale can be clearlyseen on the surface roughness. The optical images of nanocompos-ites show very rough, highly textured/torn surfaces containing alarge number of macro as well as microcracks with deep valleysand furrows with steep ridges. These features markedly amplifywith 10% Vf of nano-filler loading. However, similar are absent inoptical images of micro-filler counterparts indicating lower qua-si-static fracture toughness relative to nanocomposites. Interest-ingly, three distinct zones-‘mirror’, ‘mist’ and ‘hackle’-are alsoquite evident in optical micrographs of nanocomposite specimens.The mirror zone can be clearly identified as a flat and smooth re-gion appearing in the lower central portion of 5% nano-filler caseclose to the initial crack front, whereas it is at the lower right sideof 10% nano-filler loading. In each case, surrounding the mirrorzone is the mist region appearing with a slight change in the sur-face texture. The outwardly expanding roughness markings sur-rounding the mirror and mist zones can be recognized as hackleregions which are generally associated with the violent stage offracture in which tremendous amount of fracture energy is dissi-pated through both plastic deformation and by the generation ofadditional fracture surfaces. However, these features appear to beless prominent in the case of micro-filler specimens. In Fig. 17,adjacent to each optical image, SEM micrographs of a selected region(the boxed region) is shown. Note that the nanoparticles were hardto detect even at higher magnifications as the nanoparticle size andgold coating layer were of nearly the same order of magnitude. TheSEM micrographs for nano-filler cases represent features of the

K Id (MPa
m1/
2 )
nano-fillermicro-filler
5% Vf
K Id (MPa
m1/
2 )
nano-fillermicro-filler
10% Vf
0.0
0.5
1.0
1.5
2.0
2.5
3.0
t - ti (μs)-60 -40 -20 0 20 40 60 80
t - ti (μs)-60 -40 -20 0 20 40 60 80
0.0
0.5
1.0
1.5
2.0
2.5
3.0
(a)
(b)
Fig. 15. Role of nano- vs. micro-fillers on mode-I dynamic SIF histories: (a) 5% Vf. (b)10% Vf. (Time base is shifted such that t � ti = 0 corresponds to crack-initiation asshown by the vertical dashed line.)
t - ti (μs)
t - ti (μs)
K Id (MPa
m1/
2 )
10%7%5%3%0%
Nano-filler (Vf)
-60 -40 -20 0 20 40 60 80
-60 -40 -20 0 20 40 60 80 100
K Id (MPa
m1/
2 )
10%7%5%3%0%
Micro-filler (Vf)
0.0
0.5
1.0
1.5
2.0
2.5
3.0
0.0
0.5
1.0
1.5
2.0
2.5
3.0
(a)
(b)
Fig. 14. Mode-I dynamic SIF histories at different volume fractions: (a) Nano-particle filled epoxies. (b) Micro- particle filled epoxies. (Time base is shifted suchthat t � ti = 0 corresponds to crack-initiation as shown by the vertical dashed line.)
Table 3Loading-rate effects on crack-initiation toughness of nano- and micro-filler reinforcedepoxies.
Vf (%) Quasi-static crack-initiationtoughness KIc (MPa m1/2)
Dynamic crack-initiation
toughness KdIi (MPa m1/2)
Nano-filler Micro-filler Nano-filler Micro-filler
0 1.92 1.92 1.38 1.383 2.99 2.43 1.45 1.545 3.67 2.59 1.59 1.727 3.92 2.63 1.74 1.89
10 5.22 2.95 1.85 2.13
3478 K.C. Jajam, H.V. Tippur / Composites: Part B 43 (2012) 3467–3481
‘mist’ region. The micrograph for nano-filler with 5% Vf indicates anonlinearly deformed (or torn) surface. Furthermore, the surfacefeatures resemble microscopic shear bands, seen as a narrow zoneof intense slipping and tearing in the inset. The SEM micrograph for10% nano-filler loading indicates the presence of parabolic mark-ings in addition to all the features seen in the 5% filler case. Theseparabolic markings are possibly generated by sequential nucle-ation, growth and coalescence of microcracks (and/or slip bands)resulting in a rougher surface since microcracks or microcrackclusters form far ahead of the main crack and coalesce with it. Aclose-up view of the zone inside the parabolic marking can be seenin the inset showing microcracking and tearing. On the other hand,the SEM micrographs for 5% and 10% Vf micro-filler loadings showfeatures such as tail lines and particle–matrix debonding. The frac-ture surface features from optical and SEM micrographs clearlyindicate that nanocomposites showed extensive surface featurescompared to the corresponding micron-filler counterparts. Fur-thermore, nonlinear deformation and formation of microcracksaround the crack-tip reduce the crack-tip stress concentrationleading to shielding of the crack-tip. Therefore, the presence of ahigh concentration of macro and microcracks, slip bands, parabolicmarkings and high surface roughness suggest greater energy dissi-pation in the case of nano-filler modified epoxies, consistent withhigher fracture toughness when compared to the ones with mi-cro-filler under quasi-static loading conditions.
Fig. 18a and b show SEM micrographs of dynamically fracturedsurfaces (x–z plane) of nano- and micro-filler epoxies at 10% vol-ume fraction, respectively. The arrow in these micrographs indi-cates crack propagation direction. The differences between the
surface roughness features are rather striking. The surface rough-ness and ruggedness in Fig. 18a for nano-particle filled epoxy islower than the micro-filler one. Some features such as crack frontbowing and pinning can be seen but are less prominent than themicro-filler modified epoxy. A higher magnification view of thefracture surface morphology can be seen in the inset. The micro-graph in Fig. 18b reveals particle–matrix debonding (see close-upview in the inset) and particle pullout which results in crack fronttrapping. It can also be noticed that the crack bows between mi-cron-size particles indicating crack pinning. As micro-cracks leavethe pinned positions, tail lines as well as step patterns in the direc-tion of crack propagation appear.
Fig. 19 shows fractured surface profiles for nano- and micro-filler cases (10% Vf) and neat epoxy with an inset depicting crackgrowth and scanned region (x–z plane). In Fig. 19, x- represents

V (m/s)
KId (M
Pa m
1/2 )
(MPa
m1/
2 )
nano-fillermicro-fillerneat epoxy
5% Vf
V (m/s)
0 100 200 300 400 500 600 700
0 100 200 300 400 500 600 7001.2
1.4
1.6
1.8
2.0
2.2
2.4
2.6
2.8
3.0
nano-fillermicro-fillerneat epoxy
10% Vf
1.2
1.4
1.6
1.8
2.0
2.2
2.4
2.6
2.8
3.0(a)
(b)
KId
Fig. 16. KdI –V relationships for particle filled epoxies: (a) 5% Vf nano- and micro-
filler. (b) 10% Vf nanoand micro-filler.
K.C. Jajam, H.V. Tippur / Composites: Part B 43 (2012) 3467–3481 3479
scanning length and y- denotes the asperity height. A scanninglength of x = 15 mm was chosen in the stable crack growth region.
Fig. 17. Optical and SEM micrographs of quasi-static fracture surfaces of nano- and micimages indicates the initial crack-front as well as the direction of crack growth. The ‘mirr
The data was recorded at 3–4 different scan lines at differentz-locations on either side of the centerline within the regions ofinterest. The scanned data obtained from the surface profiler wasprocessed to get average roughness, Ra, using,
Ra ¼1N
XN
1
jyðxÞj ¼ 1L
Z L
0ydx ð8Þ
where N is the total number of data points collected, L is the scanlength.
The surface profile of micro-filler case shows longer wave-lengths and larger amplitudes relative to the nano-filler counter-part. The nano-particle filled epoxy and neat epoxy, on the otherhand, show the least surface amplitude. The fracture-induced sur-face roughness (after discounting the roughness due to filler parti-cle foot prints or bumps; see Kitey and Tippur [51]) was evaluatedand found to be approximately 0.78 lm, 12.93 lm, 0.74 lm fornano-filler, micro-filler, and neat epoxy, respectively. Hence, itshould be noted that for the same volume percentage of fillersembedded in epoxy, the fracture-induced roughness is higher incase of micro-filler under dynamic conditions. Thus, the qualitativeas well as quantitative measurements show higher surface rough-ness for micro-particle filled epoxy than the nano-filler case sug-gesting higher energy dissipation and improved dynamic fractureperformance in the former relative to the latter.
4.5. Discussion
The striking differences in quasi-static and dynamic fracturebehaviors and parameters of nano- and micro-size silica filledepoxies are evident from the results presented above. As the macroscale fracture behaviors are related to events in the process zone[46] in the crack-tip vicinity, plausible explanations for these dif-ferences can be offered.
Under quasi-static loading conditions, a relatively smallercrack-tip process zone exists since all material points experiencethe applied load simultaneously. In case of nano-particle filledepoxy, the net interfacial surface area between the filler particle
ro-filler modified epoxies at 5% and 10% volume fractions (Vf). The arrow in opticalor’, ‘mist’ and ‘hackle’ zones are clearly visible in optical images of nanocomposites.

10 µm
(a) (b)
Fig. 18. SEM micrographs of dynamically fractured surfaces (x–z plane): (a) Nano-particle filled epoxy (10% Vf). (b) Micro-particle filled epoxy (10% Vf). The arrows indicatethe direction of crack propagation.
Fig. 19. Fracture surface profiles of dynamically fractured nano-particle filledepoxy (10% Vf), micro-particle filled epoxy (10% Vf) and neat epoxy specimens (insetshows schematic representation of crack growth and scanning region chosen forroughness measurements (x–z plane)).
3480 K.C. Jajam, H.V. Tippur / Composites: Part B 43 (2012) 3467–3481
and the matrix is �3.3 � 105 times that of the micron-size particlesat the same volume fraction. Hence, for similar bond strength be-tween the matrix and the filler, average interfacial stress is sub-stantially lower in case of nanocomposites. The matrixreinforcement offered by the nano-particles, further mitigate crackinitiation. On the other hand, the micro-fillers, due to the highereffective interfacial stress (due to lower interfacial area), would lo-cally debond resulting in micro defects ahead of the crack-tip caus-ing fracture at a lower far-field stress. Also, the average inter-particle spacing [52] l ¼ 2Dð1� V f Þ=3V f , for a given volume frac-tion Vf with mean particle diameter D, is three orders of magnitudelower for the nano-filler case compared to the micro-filler counter-parts. This results in lower interstitial gap reducing stress concen-tration effects in nano-particle filled epoxy when compared to themicron-size fillers, resulting in improved crack initiation toughnessunder quasi-static loading conditions.
Under dynamic loading conditions, however, the lower interfa-cial surface area and higher stress concentration effects present inmicro-filler case produces filler-matrix interfacial debonding asstress waves propagate. Moreover, a propagating crack front is at-tracted and trapped by the weakened particle–matrix interfacesresulting in momentary deceleration and arrest [32]. This requiresadditional energy for reinitiation and further growth, producing
higher apparent dynamic fracture toughness. In the nano-particlecase, on the other hand, the lower matrix-filler interfacial stressespromote crack from deflecting away from interfaces producingsustained matrix crack growth (with the exception of crack pinningsites) at a relatively lower energy expenditure.
5. Conclusions
The role of nano- and micro-fillers (particle size-scale) on quasi-static and dynamic fracture behavior of particulate epoxy compos-ites has been studied. The full-field method of 2D digital imagecorrelation coupled with high-speed digital photography was usedto evaluate dynamic fracture parameter histories. The results weresupplemented by conducting fractographic examination and sur-face roughness measurements. The following are some of the ma-jor observations of this study:
� The particle size-scale did not produce discernible influence onelastic and physical properties at a given volume fraction inboth nano- and micro-filler composites for all volume percent-ages (3–10%) studied.� Both nano- and micro-fillers improved fracture toughness of
epoxy under quasi-static loading. The quasi-static fracturetoughness of nanocomposites was significantly higher thanthe micro-particle filled epoxies for any given volume fraction.Nanocomposite specimens containing 10% volume fraction filleryielded the greatest enhancement of fracture toughness (byabout 78%) compared to the micro-filler counterparts at thesame volume percentage.� Dynamic fracture tests showed that with respect to neat epoxy
the crack-tip velocities showed increasing and decreasingtrends in nano- and micro-filler composites, respectively, withparticle volume fractions. The average crack-tip velocities innanocomposites were approximately 35%, 60%, 90%, 160%higher than that observed in the micro-filled specimens forthe 3%, 5%, 7%, 10% volume fractions, respectively.� Dynamic fracture toughness improved consistently with filler
volume fraction for both nano- as well as micro-fillers whencompared to neat epoxy. However, contrary to quasi-static frac-ture tests, the nanocomposites showed relatively lowerdynamic crack-initiation toughness than the micro-particlefilled ones with the same volume fraction of fillers.� The Kd
I –V characteristics for both types of fillers were obtained.Nano-filler composites resulted in lower Kd
I over a wider rangeof velocities compared to the micro-filler counterparts. The ter-

K.C. Jajam, H.V. Tippur / Composites: Part B 43 (2012) 3467–3481 3481
minal velocities seen in the case of nano-filler specimens weresignificantly higher than the micro-filler ones under similarimpact loading conditions.� Fracture surfaces of quasi-statically failed nanocomposites
showed very rough, highly textured surfaces containing mirror,mist and hackle zones, and these features markedly amplifiedwith filler volume fraction. On the other hand, such featureswere muted in the case of micro-filler cases.� Micrographs of dynamically fractured surfaces of micro-particle
filled epoxy revealed higher surface roughness and ruggednessthan the nanocomposites with features consistent with micro-cracks, crack front bowing, tails lines and crack pinning indicat-ing improved crack growth resistance for micro-filler epoxiesrelative to nano-filler counterparts.� Quantitative surface measurements showed that the fracture
induced surface roughness was significantly higher in micro-fil-ler composites than the nano-filler counterparts producingenhanced dynamic fracture toughness in the former case thanin the latter case.
Acknowledgements
The authors would like to thank the National Science Founda-tion for supporting this research through a grant NSF-CMMI-0653816. Financial support from US Army Research Office for thehigh-speed digital camera purchase through a Grant DAAD19-02-10126 (DURIP) is also gratefully acknowledged.
References
[1] Lavengood RE, Nicolais L, Narkis M. A deformational mechanism in particulate-filled glassy polymers. J Appl Polym Sci 1973;17(4):1173–85.
[2] Mallick PK, Broutman LJ. Mechanical and fracture behaviour of glass bead filledepoxy composites. Mater Sci Eng 1975;18(1):63–73.
[3] Moloney AC, Kausch HH, Stieger HR. The fracture of particulate-filled epoxideresins. J Mater Sci 1983;18(1):208–16.
[4] Moloney A, Kausch H, Kaiser T, Beer H. Parameters determining the strengthand toughness of particulate filled epoxide resins. J Mater Sci1987;22(2):381–93.
[5] Spanoudakis J, Young RJ. Crack propagation in a glass particle-filled epoxyresin. J Mater Sci 1984;19(2):473–86.
[6] Roulin-Moloney AC, Cantwell WJ, Kausch HH. Parameters determining thestrength and toughness of particulate-filled epoxy resins. Polym Compos1987;8(5):314–23.
[7] Nakamura Y, Yamaguchi M, Okubo M, Matsumoto T. Effects of particle size onmechanical and impact properties of epoxy resin filled with spherical silica. JAppl Polym Sci 1992;45(7):1281–9.
[8] Nakamura Y, Okabe S, Iida T. Effects of particle shape, size and interfacialadhesion on the fracture strength of silica-filled epoxy resin. Polym PolymCompos 1999;7(3):177–86.
[9] Spanoudakis J, Young RJ. Crack propagation in a glass particle-filled epoxyresin. J Mater Sci 1984;19(2):487–96.
[10] Hsieh TH, Kinloch AJ, Masania K, Taylor AC, Sprenger S. The mechanisms andmechanics of the toughening of epoxy polymers modified with silicananoparticles. Polymer 2010;51(26):6284–94.
[11] Reynaud E, Jouen T, Gauthier C, Vigier G, Varlet J. Nanofillers in polymericmatrix: a study on silica reinforced PA6. Polymer 2001;42(21):8759–68.
[12] Boesl BP, Bourne GR, Sankar BV. Insitu multiscale analysis of fracturemechanisms in nanocomposites. Compos Part B: Eng 2011;42(5):1157–63.
[13] Liu H-Y, Wang G-T, Mai Y-W, Zeng Y. On fracture toughness of nano-particlemodified epoxy. Compos Part B: Eng 2011;42(8):2170–5.
[14] Rosso P, Ye L, Friedrich K, Sprenger S. A toughened epoxy resin by silicananoparticle reinforcement. J Appl Polym Sci 2006;100(3):1849–55.
[15] Wetzel B, Rosso P, Haupert F, Friedrich K. Epoxy nanocomposites – fractureand toughening mechanisms. Eng Fract Mech 2006;73(16):2375–98.
[16] Liang YL, Pearson RA. Toughening mechanisms in epoxy-silica nanocomposites(ESNs). Polymer 2009;50(20):4895–905.
[17] Tsai JL, Hsiao H, Cheng YL. Investigating mechanical behaviors of silicananoparticle reinforced composites. J Compos Mater 2010;44(4):505–24.
[18] Kwon S-C, Adachi T, Araki W. Temperature dependence of fracture toughnessof silica/epoxy composites: related to microstructure of nano- and micro-particles packing. Compos Part B: Eng 2008;39(5):773–81.
[19] Johnsen BB, Kinloch AJ, Mohammed RD, Taylor AC, Sprenger S. Tougheningmechanisms of nanoparticle-modified epoxy polymers. Polymer2007;48(2):530–41.
[20] Jordan J, Jacob KI, Tannenbaum R, Sharaf MA, Jasiuk I. Experimental trends inpolymer nanocomposites – a review. Mater Sci Eng A 2005;393(1–2):1–11.
[21] Sun L, Gibson RF, Gordaninejad F, Suhr J. Energy absorption capability ofnanocomposites: a review. Compos Sci Technol 2009;69(14):2392–409.
[22] Fu S-Y, Feng X-Q, Lauke B, Mai Y-W. Effects of particle size, particle/matrixinterface adhesion and particle loading on mechanical properties ofparticulate–polymer composites. Compos Part B: Eng 2008;39(6):933–61.
[23] Singh RP, Zhang M, Chan D. Toughening of a brittle thermosetting polymer:effects of reinforcement particle size and volume fraction. J Mater Sci2002;37(4):781–8.
[24] Adachi T, Osaki M, Araki W, Kwon S-C. Fracture toughness of nano- and micro-spherical silica-particle-filled epoxy composites. Acta Mater2008;56(9):2101–9.
[25] Hussain M, Nakahira A, Nishijima S, Niihara K. Fracture behavior and fracturetoughness of particulate filled epoxy composites. Mater Lett 1996;27(1–2):21–5.
[26] Ng CB, Ash BJ, Schadler LS, Siegel RW. A study of the mechanical andpermeability properties of nano- and micron-TiO2 filled epoxy composites.Adv Compos Lett 2001;10(3):101–11.
[27] Ng CB, Schadler LS, Siegel RW. Synthesis and mechanical properties of TiO2–epoxy nanocomposites. Nanostruct Mater 1999;12(1–4):507–10.
[28] Kitey R, Tippur HV. Role of particle size and filler-matrix adhesion on dynamicfracture of glass-filled epoxy. I. Macromeasurements. Acta Mater2005;53(4):1153–65.
[29] Shukla A, Parameswaran V, Du Y, Evora V. Dynamic crack initiation andpropagation in nanocomposite materials. Rev Adv Mater Sci 2006;13(1):47–58.
[30] Evora VMF, Shukla A. Fabrication, characterization, and dynamic behavior ofpolyester/TiO2 nanocomposites. Mater Sci Eng A 2003;361(1–2):358–66.
[31] Evora VMF, Jain N, Shukla A. Stress intensity factor and crack velocityrelationship for polyester/TiO2 nanocomposites. Exp Mech 2005;45(2):153–9.
[32] Jajam KC, Tippur HV. An experimental investigation of dynamic crack growthpast a stiff inclusion. Eng Fract Mech 2011;78(6):1289–305.
[33] ASTM, D5045-96. Standard test methods for plane-strain fracture toughnessand strain energy release rate of plastic materials. Annual Book of ASTMStandard1996. p. 325–33.
[34] Sanford RJ. Principles of Fracture Mechanics. Upper Saddle River, NJ,USA: Prentice Hall; 2003.
[35] Kirugulige MS, Tippur HV, Denney TS. Measurement of transient deformationsusing digital image correlation method and high-speed photography:application to dynamic fracture. Appl Opt 2007;46(22):5083–96.
[36] Kirugulige MS, Tippur HV. Measurement of fracture parameters for a mixed-mode crack driven by stress waves using image correlation technique andhigh-speed digital photography. Strain 2009;45(2):108–22.
[37] Lee D, Tippur H, Kirugulige M, Bogert P. Experimental study of dynamic crackgrowth in unidirectional graphite/epoxy composites using digital imagecorrelation method and high-speed photography. J Compos Mater2009;43(19):2081–108.
[38] Prautzsch H, Boehm W, Paluszny M. Bézier and B-spline techniques. BerlinHeidelberg New York: Springer-Verlag; 2002.
[39] Nishioka T, Atluri SN. Path-independent integrals, energy release rates, andgeneral solutions of near-tip fields in mixed-mode dynamic fracturemechanics. Eng Fract Mech 1983;18(1):1–22.
[40] Tippur HV, Krishnaswamy S, Rosakis AJ. Optical mapping of crack tipdeformations using the mehods of transmission and reflection coherentgradient sensing: a study of crack tip <ceitalic>K</ceitalic> -dominance. Int JFract 1991;52(2):91–117.
[41] Irwin G, Dally J, Kobayashi T, Fourney W, Etheridge M, Rossmanith H. On thedetermination of the <ceitalic>å-K</ceitalic> relationship for birefringentpolymers. Exp Mech 1979;19(4):121–8.
[42] Kobayashi T, Dally JW. Dynamic photoelastic determination of the å–K relationfor 4340 alloy steel. Crack Arrest Methodology and Applications, ASTM STP711, GT Hann and MF Kanninen, editors, American Society for TestingMaterials. 1980:189-210.
[43] Dally JW, Fourney WL, Irwin GR. On the uniqueness of the stress intensityfactor — crack velocity relationship. Int J Fract 1985;27(3):159–68.
[44] Knauss WG, Ravi-Chandar K. Some basic problems in stress wave dominatedfracture. Int J Fract 1985;27(3):127–43.
[45] Shukla A, Nigam H. A note on the stress intensity factor and crack velocityrelationship for homalite 100. Eng Fract Mech 1986;25(1):91–102.
[46] Broberg KB. Crack and fracture. Cambridge: Academic Press; 1999.[47] Arakawa K, Takahashi K. Relationships between fracture parameters and
fracture surface roughness of brittle polymers. Int J Fract 1991;48(2):103–14.[48] Takahashi K, Kido M, Arakawa K. Fracture roughness evolution during mode i
dynamic crack propagation in brittle materials. Int J Fract 1998;90(1):119–31.[49] Sharon E, Gross SP, Fineberg J. Energy dissipation in dynamic fracture. Phys
Rev Lett 1996;76(12):2117.[50] Lampman S. Characterization and failure analysis of plastics. USA: ASM
International, Materials Park, OH; 2003.[51] Kitey R, Tippur HV. Role of particle size and filler-matrix adhesion on dynamic
fracture of glass-filled epoxy. II. Linkage between macro- and micro-measurements. Acta Mater 2005;53(4):1167–78.
[52] Fullman RL. Measurement of particle sizes in opaque bodies. Trans Am InstMining Metall Eng 1953;197(3):447–52.