quarterly report for amchina a-shares · manager’s report dear unitholders, we are pleased to...
TRANSCRIPT

Quarterly Report for
AmChina A-Shares 30 April 2020

AmChina A-Shares
TRUST DIRECTORY
Manager AmFunds Management Berhad
9th & 10th Floor, Bangunan AmBank Group 55 Jalan Raja Chulan 50200 Kuala Lumpur
Board of Directors Jeyaratnam A/L Tamotharam Pillai
Dato’ Mustafa Bin Mohd Nor Tai Terk Lin
Sum Leng Kuang Goh Wee Peng
Investment Committee Sum Leng Kuang
Tai Terk Lin Dato’ Mustafa Bin Mohd Nor
Zainal Abidin Bin Mohd Kassim Goh Wee Peng
Trustee Deutsche Trustees Malaysia Berhad
Auditors and Reporting Accountants Ernst & Young PLT
Taxation Adviser Deloitte Tax Services Sdn Bhd

AmChina A-Shares
CONTENTS
1 Manager’s Report
9 Condensed Statement of Financial Position
10 Condensed Statement of Comprehensive Income
11 Condensed Statement of Changes in Equity
12 Condensed Statement of Cash Flows
13 Statement by the Manager
14 Directory

1
MANAGER’S REPORT Dear Unitholders, We are pleased to present you the Manager’s report and the unaudited quarterly accounts of AmChina A-Shares (“Fund”) for the financial period from 1 February 2020 to 30 April 2020. Salient Information of the Fund
Name AmChina A-Shares (“Fund”)
Category/ Type
Wholesale (Feeder Fund) / Growth
Name of Target Fund
Allianz China A-Shares
Objective The Fund seeks to provide long-term capital growth by investing in the Target Fund which invests primarily in the A-Shares equity market of the People’s Republic of China. Note: Any material change to the investment objective of the Fund would require Unit Holders’ approval.
Duration The Fund was established on 18 May 2010 and shall exist for as long as it appears to the Manager and the Trustee that it is in the interests of the unitholders for it to continue. In some circumstances, the unitholders can resolve at a meeting to terminate the Fund.
Performance Benchmark
MSCI China A Onshore Total Return (Net) [formerly known as MSCI China A Total Return (Net)] (obtainable from www.aminvest.com / www.msci.com) Note: The risk profile of the Fund may not be the same as the risk profile of the performance benchmark. The performance benchmark is only a measurement of the Fund’s performance and there is no guarantee it will be achieved. The above benchmark may be changed to reflect any material change to the Fund’s asset allocation range as permitted by the prevailing regulations. Source: MSCI. The MSCI information may only be used for your internal use, may not be reproduced or redisseminated in any form and may not be used as a basis for or a component of any financial instruments or products or indices. None of the MSCI information is intended to constitute investment advice or a recommendation to make (or refrain from making) any kind of investment decision and may not be relied on as such. Historical data and analysis should not be taken as an indication or guarantee of any future performance analysis, forecast or prediction. The MSCI information is provided on an “as is” basis and the user of this information assumes the entire risk of any use made of this information. MSCI, each of its affiliates and each other person involved in or related to compiling, computing or creating any MSCI information (collectively, the “MSCI Parties”) expressly disclaims all warranties (including, without limitation, any warranties of originality, accuracy, completeness, timeliness, non-infringement, merchantability and fitness for a particular purpose) with respect to this information. Without limiting any of the foregoing, in no event shall any MSCI Party have any liability for any direct, indirect, special, incidental, punitive, consequential (including, without limitation, lost profits) or any other damages. (www.msci.com).

2
Income Distribution Policy
RM & RM-Hedged Classes Subject to availability of income, distribution (if any) is incidental. Other Classes except for RM and RM-Hedged Classes Subject to availability of income, distribution (if any) is incidental and will be reinvested into the respective Class.
Breakdown of Unit Holdings by Size
For the financial period under review, the size of the Fund for RM Class stood at 28,363,437 units and for RM-Hedged Class stood at 62,725,533 units. RM Class
Size of holding As at 30 April 2020 As at 31 January 2020
No of units held
Number of unitholders
No of units held
Number of unitholders
5,000 and below - - - -
5,001-10,000 - - 9,475 1
10,001-50,000 15,679 1 - -
50,001-500,000 - - - -
500,001 and above 28,347,758 6 30,489,013 6
RM-Hedged Class
Size of holding As at 30 April 2020 As at 31 January 2020
No of units held
Number of unitholders
No of units held
Number of unitholders
5,000 and below - - - -
5,001-10,000 - - - -
10,001-50,000 - - 41,758 1
50,001-500,000 - - - -
500,001 and above 62,725,533 6 30,969,731 4
Fund Performance Data
Portfolio Composition
Details of portfolio composition of the Fund for the financial period as at 30 April 2020 and three financial years as at 31 January are as follows:
As at 30.4.2020
%
FY 2020
%
FY 2019
%
FY 2018
%
Foreign collective investment scheme 97.40 93.94 96.80 94.07
Forward contract 0.17 0.38 - -
Money market deposit 2.77 3.43 1.91 3.83
Cash, other assets & liabilities -0.34 2.25 1.29 2.10
Total 100.00 100.00 100.00 100.00
Note: The abovementioned percentages are calculated based on total net asset value.
Performance Details
Performance details of the Fund for the financial period as at 30 April 2020 and three financial years ended 31 January are as follows: (Forward)

3
3 months ended
30.4.2020 FY
2020 FY
2019 FY
2018
Net asset value (RM)*
- RM Class 93,232,259 95,695,337 78,316,801 51,492,998
- RM-Hedged Class(4) 76,940,849 38,308,530 - -
Units in circulation*
- RM Class 28,363,437 30,498,488 35,761,812 19,421,085
- RM-Hedged Class(4) 62,725,533 31,011,489 - -
Net asset value per unit (RM)*
- RM Class 3.2871 3.1377 2.1900 2.6514
- RM-Hedged Class(4) 1.2266 1.2353 - -
Highest net asset value per unit (RM)*
- RM Class 3.3852 3.2521 2.7296 2.7820
- RM-Hedged Class(4) 1.3130 1.2931 - -
Lowest net asset value per unit (RM)*
- RM Class 2.8879 2.1900 1.9778 2.0873
- RM-Hedged Class(4) 1.0598 0.9617 - -
Benchmark performance (%)
- RM Class 1.50 26.45 -28.70 10.96
- RM-Hedged Class(4) 1.50 1.28 - -
Total return (%)(1)
- RM Class 6.42 42.52 -17.40 26.32
- RM-Hedged Class(4) -0.82 23.62 - -
- Capital growth (%)
- RM Class 6.42 42.52 -17.40 26.32
- RM-Hedged Class(4) -0.82 23.62 - -
- Income distribution (%)
- RM Class - - - -
- RM-Hedged Class(4) - - - -
Gross distribution (sen per unit)
- RM Class - - - -
- RM-Hedged Class(4) - - - -
Net distribution (sen per unit)
- RM Class - - - -
- RM-Hedged Class(4) - - - -
Management expense ratio (%)(2) 0.20 0.21 0.19 0.30
Portfolio turnover ratio (times)(3) 0.26 1.00 0.31 1.09
* Above prices and net asset value per unit are not shown as ex-distribution. Note: (1) Total return is the actual/annualised return of the Fund for the respective financial
period/years computed based on the net asset value per unit and net of all fees. (2) Management expense ratio (“MER”) is calculated based on the total fees and
expenses incurred by the Fund divided by the average fund size calculated on a daily basis. The MER decreased by 0.01% as compared to 0.21% per annum for the financial year ended 31 January 2020 mainly due to decrease in expenses.
(Forward)

4
(3) Portfolio turnover ratio (“PTR”) is calculated based on the average of the total acquisitions and total disposals of investment securities of the Fund divided by the average fund size calculated on a daily basis. The PTR decreased by 0.74 times (74.0%) as compared to 1.00 times for the financial year ended 31 January 2020 mainly due to decrease in investing activities.
(4) RM-Hedged class was launched on 25 April 2019. Average Total Return (as at 30 April 2020)
AmChina
A-Shares(a) %
MSCI China A Onshore Total Return
(Net)(b) %
One year
- RM Class 23.86 3.73
- RM-Hedged Class 22.61 3.73
Three years
- RM Class 15.44 1.14
Five years
- RM Class 10.02 -4.27
Since launch
- RM Class (18 May 2010) 12.85 6.49
- RM-Hedged Class (25 April 2019) 22.27 2.75
Annual Total Return
Financial Years Ended (31 January) AmChina
A-Shares(a) %
MSCI China A Onshore Total Return
(Net)(b) %
2020
- RM Class 42.52 26.45
- RM-Hedged Class(c) 23.62 1.28
2019
- RM Class -17.40 -28.70
2018
- RM Class 26.32 10.96
2017
- RM Class 29.57 17.79
2016
- RM Class 3.71 -6.37
(a) Source: Novagni Analytics and Advisory Sdn Bhd. (b) MSCI China A Onshore Total Return (Net)
(obtainable from www.aminvest.com / www.msci.com) (c) Total actual return for the financial period from 25 April 2019 (date of launch) to 31
January 2020. The Fund performance is calculated based on the net asset value per unit of the Fund. Average total return of the Fund and its benchmark for a period is computed based on the absolute return for that period annualised over one year. Note: Past performance is not necessarily indicative of future performance and that unit prices and investment returns may go down, as well as up.

5
Fund Performance
RM Class For the financial period under review, the Fund registered a return of 6.42% which was entirely capital growth in nature. Thus, the Fund’s return of 6.42% has outperformed the benchmark’s return of 1.50% by 4.92%. As compared with the financial year ended 31 January 2020, the net asset value (“NAV”) per unit of the Fund increased by 4.76% from RM3.1377 to RM3.2871, while units in circulation decreased by 7.00% from 30,498,488 units to 28,363,437 units. The line chart below shows comparison between the annual performances of AmChina A-Shares (RM Class) and its benchmark, MSCI China A Onshore Total Return (Net), for the financial years ended 31 January.
RM-Hedged Class For the financial period under review, the Fund registered a negative return of 0.82% which was entirely capital growth in nature. Thus, the Fund’s negative return of 0.82% has underperformed the benchmark’s return of 1.50% by 2.32%. As compared with the financial year ended 31 January 2020, the net asset value (“NAV”) per unit of the Fund decreased by 0.70% from RM1.2353 to RM1.2266, while units in circulation increased by >100.00% from 31,011,489 units to 62,725,533 units. Note: Past performance is not necessarily indicative of future performance and that unit prices and investment returns may go down, as well as up.

6
Performance of the Target Fund
Fund Performance Review of the Target Fund – Allianz China A-Shares (“the Target Fund”) For the 3 month performance ending 30th April 2020, the Target Fund returned 0.36%1, outperforming the benchmark MSCI China A-Shares Onshore Index by -2.96%. Stock selection within industrials and healthcare contributed the most; while stock selection in energy detracted slightly. Given that we adopt a disciplined portfolio construction approach with limited sector deviation against the benchmark, sector allocation effect was minimal during the reporting period. The top contributor was China’s leading hydraulic component maker. Despite of all the ongoing uncertainties regarding working resumption and potential order cancelation during the coronavirus outbreak, this company performed strong. This is a reflection of superior execution capability which allowed the company to continue its market share gain story, as well as expectation of rising infrastructure spending in mainland China. On the other hand, the top detractor was China’s No.1 white liquor brand. The entire white liquor sector performed very well during the reporting period, which signals the sustainable demand for mid to high end brands in China. While we suffered from not owning the industry No. 1, our positions in other brands helped offset the detraction. Source: Allianz Global Investors Asia Pacific Limited (the Target Fund’s investment manager) 1Target Fund performance calculated using share class AT USD, NAV-NAV basis with gross dividends reinvested. Benchmark: MSCI China A Onshore Total Return (Net)
Strategies and Policies Employed
Strategies and Policies of the Target Fund The Target Fund focuses on bottom-up stock selection to generate alpha and typically does not deviate significantly from the benchmark in terms of sector allocation. We adopt a growth at reasonable valuation approach, and look to identify stocks with sustainable long-term growth prospects that are underestimated by the market. Currently, our preferred long-term investment themes include consumption upgrade, advances in manufacturing, as well as technology and innovation. These themes are typically domestic-driven and less vulnerable to external shocks. Source: Allianz Global Investors Asia Pacific Limited (the Target Fund’s investment manager). Benchmark: MSCI China A Onshore Total Return (Net) Strategies and Policies of the Fund For the financial period under review, the Fund seeks to achieve its investment objective by investing a minimum of 95% of the Fund’s net asset value (“NAV”) in the Allianz China A-Shares (the “Target Fund”).
Portfolio Structure
This table below is the asset allocation of the Fund for the financial period/year under review.
As at 30.4.2020
%
As at 31.1.2020
%
Changes
%
Foreign collective investment scheme 97.40 93.94 3.46
Forward contract 0.17 0.38 -0.21
Money market deposit 2.77 3.43 -0.66
Cash, other assets & liabilities -0.34 2.25 -2.59
Total 100.00 100.00

7
As at 30 April 2020, the Fund has invested 97.40% of its NAV in the foreign collective investment scheme, 0.17% in forward contract, 2.77% in money market deposit and the balance of -0.34% in cash, other assets & liabilities.
Cross Trade
There were no cross trades undertaken during the financial period under review.
Distribution/ Unit Splits
There was no income distribution and unit split declared for the financial period under review.
State of Affairs
There has been neither significant changes to the state of affairs of the Fund nor any circumstances that materially affect any interests of the unitholders during the financial period under review.
Rebates and Soft Commission
Soft commissions received from brokers/dealers are retained by the Manager only if the goods and services provided are in the form of research services that assist in the decision-making process relating to the Fund’s investments. During the financial period under review, the Manager had received on behalf of the Fund, soft commissions as allowed under regulatory requirements to carry out investment management functions for the Fund. These soft commissions received by the Manager are deemed to be beneficial to the unitholders of the Fund.
Market Review
During the reporting period, Chinese stocks declined amid growing concerns that the COVID-19 pandemic would result in a global recession. However, they fared better than the broader region, helped in part by stimulus measures and cuts in rates from the People’s Bank of China, as well as the effective containment of the Covid-19 outbreak in mainland China. Towards end April, most businesses have returned to work, and quarantine measures in the province of Hubei were also gradually lifted. China’s official purchasing managers’ index of manufacturing activity rebounded to a stronger-than-expected reading of 52.0 in March, a sharp jump from a record low of 35.7 recorded in February, indicating that the sector was expanding once more. In addition, global oil price slumped as OPEC failed to strike a deal about oil production cut, while concerns over liquidity crunch raised along with market sell off. Source: Allianz Global Investors Asia Pacific Limited (the Target Fund’s investment manager)
Market Outlook
As we are moving towards the end of the Q1 results season in China A-shares, we have seen mixed results so far. Over the earnings growth outlook for 2020 has been adjusted down from mid to high single digit growth to now a flat year on year growth. However, a number of our holdings within the portfolio actually delivered positive surprises relative to market expectations. These include white liquor companies, where consumption and pricing has remained resilient. And areas related to infrastructure spending such as construction machinery have also been strong.
Now the focus of the market has shifted from the containment of virus into the recovery of economic growth. From our perspective, the key question to ask is whether we can continue to find long term structural growth trends within China which can help generate good investment opportunities. The answer is yes. While the distrust between China and US continued to escalate during the coronavirus outbreak, one clear outcome is China’s accelerated need to achieve self-sufficiency in key strategic areas such as energy supply and semiconductors. Both these areas provide investment opportunities as China invests

8
heavily in technology-led solutions, including electric vehicles, alternative energy, domestic semiconductor design and manufacturing, etc. This also echoes China’s recent support for building out ‘new infrastructure’, including 5G, smart city, automation, to position for the next wave of growth while cushioning near term economic downside. We believe these long lasting trends should continue to provide good investment opportunities for active managers within China A-Shares. Source: Allianz Global Investors Asia Pacific Limited (the Target Fund’s investment manager)
Additional Information
The following information has been updated: 1. The Second Replacement Information Memorandum supersedes/replaces the
Information Memorandum for AmChina A-Shares dated 18 May 2010 and Replacement Information Memorandum for AmChina A-Shares dated 1 December 2014.
Kuala Lumpur, Malaysia AmFunds Management Berhad 17 June 2020

AmChina A-Shares
CONDENSED STATEMENT OF FINANCIAL POSITION
AS AT 30 APRIL 2020
30.4.2020 31.1.2020
(unaudited) (audited)
RM RM
ASSETS
Investment 160,883,659 125,278,743
Derivative assets 1,168,629 17,848
Amount due from Target Fund Manager 6,894,093 -
Amount due from Manager 2,805,792 -
Deposit with financial institutions 7,073,494 6,352,487
Cash at banks 2,396,346 2,742,029
TOTAL ASSETS 181,222,013 134,391,107
LIABILITIES
Derivative liability 39,620 336,780
Amount due to Target Fund Manager 4,322,796 -
Amount due to Manager 6,662,492 22,713
Amount due to Trustee 6,501 5,660
Sundry payables and accrued expenses 17,496 22,087
TOTAL LIABILITIES 11,048,905 387,240
EQUITY
Unitholders’ capital 132,601,939 101,177,262
Retained earnings 37,571,169 32,826,605
TOTAL EQUITY 170,173,108 134,003,867
TOTAL EQUITY AND LIABILITIES 181,222,013 134,391,107
NET ASSETS ATTRIBUTABLE TO UNITHOLDERS
− RM Class 93,232,259 95,695,337
− RM-Hedged Class 76,940,849 38,308,530
170,173,108 134,003,867
UNITS IN CIRCULATION
− RM Class 28,363,437 30,498,488
− RM-Hedged Class 62,725,533 31,011,489
NET ASSET VALUE PER UNIT IN RM
− RM Class 328.71 sen 313.77 sen
− RM-Hedged Class 122.66 sen 123.53 sen
The accompanying notes form an integral part of the financial statements.
9

AmChina A-Shares
CONDENSED STATEMENT OF COMPREHENSIVE INCOME (Unaudited)
FOR THE FINANCIAL PERIOD FROM 1 FEBRUARY 2020 TO 30 APRIL 2020
1.2.2020 to 1.2.2019 to
30.4.2020 30.4.2019
RM RM
INVESTMENT INCOME
Interest income 30,671 19,918
Net gain from investment:
− Financial assets at fair value through profit or
loss (“FVTPL”) 4,788,219 18,090,581
4,818,890 18,110,499
EXPENDITURE
Manager’s fee (51,617) (29,497)
Trustee’s fee (18,597) (11,538)
Auditors’ remuneration (1,598) (1,585)
Tax agent’s fee (812) (805)
Custodian’s fee (559) -
Other expenses (1,143) (1,862)
(74,326) (45,287)
Net income before tax 4,744,564 18,065,212
Less: Income tax - -
Net income after tax 4,744,564 18,065,212
Other comprehensive income - -
Total comprehensive income for the
financial period 4,744,564 18,065,212
Total comprehensive income comprises the following:
Realised (loss)/income (883,533) 2,297,320
Unrealised gain 5,628,097 15,767,892
4,744,564 18,065,212
The accompanying notes form an integral part of the financial statements.
10

AmChina A-Shares
CONDENSED STATEMENT OF CHANGES IN EQUITY (Unaudited)
FOR THE FINANCIAL PERIOD FROM 1 FEBRUARY 2020 TO 30 APRIL 2020
Unitholders’ Retained Total
capital earnings equity
RM RM RM
At 1 February 2019 81,584,689 (3,267,888) 78,316,801
Total comprehensive income for
the financial period - 18,065,212 18,065,212
Creation of units
− RM Class 29,132,920 - 29,132,920
Cancellation of units
− RM Class (22,699,922) - (22,699,922)
Balance at 30 April 2019 88,017,687 14,797,324 102,815,011
At 1 February 2020 101,177,262 32,826,605 134,003,867
Total comprehensive income for
the financial period - 4,744,564 4,744,564
Creation of units
− RM Class 20,672,128 - 20,672,128
− RM-Hedged Class 63,588,041 - 63,588,041
Cancellation of units
− RM Class (26,396,131) - (26,396,131)
− RM-Hedged Class (26,439,361) - (26,439,361)
Balance at 30 April 2020 132,601,939 37,571,169 170,173,108
The accompanying notes form an integral part of the financial statements.
11
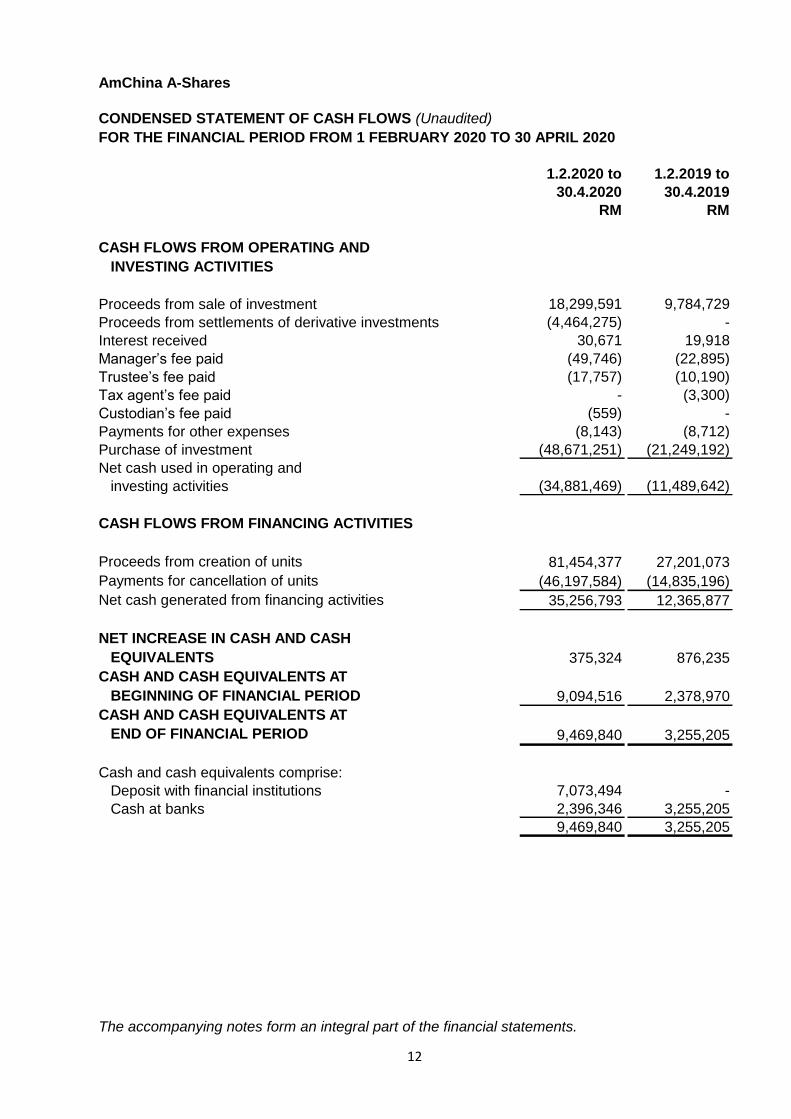
AmChina A-Shares
CONDENSED STATEMENT OF CASH FLOWS (Unaudited)
FOR THE FINANCIAL PERIOD FROM 1 FEBRUARY 2020 TO 30 APRIL 2020
1.2.2020 to 1.2.2019 to
30.4.2020 30.4.2019
RM RM
CASH FLOWS FROM OPERATING AND
INVESTING ACTIVITIES
Proceeds from sale of investment 18,299,591 9,784,729
Proceeds from settlements of derivative investments (4,464,275) -
Interest received 30,671 19,918
Manager’s fee paid (49,746) (22,895)
Trustee’s fee paid (17,757) (10,190)
Tax agent’s fee paid - (3,300)
Custodian’s fee paid (559) -
Payments for other expenses (8,143) (8,712)
Purchase of investment (48,671,251) (21,249,192)
Net cash used in operating and
investing activities (34,881,469) (11,489,642)
CASH FLOWS FROM FINANCING ACTIVITIES
Proceeds from creation of units 81,454,377 27,201,073
Payments for cancellation of units (46,197,584) (14,835,196)
Net cash generated from financing activities 35,256,793 12,365,877
NET INCREASE IN CASH AND CASH
EQUIVALENTS 375,324 876,235
CASH AND CASH EQUIVALENTS AT
BEGINNING OF FINANCIAL PERIOD 9,094,516 2,378,970
CASH AND CASH EQUIVALENTS AT
END OF FINANCIAL PERIOD 9,469,840 3,255,205
Cash and cash equivalents comprise:
Deposit with financial institutions 7,073,494 -
Cash at banks 2,396,346 3,255,205
9,469,840 3,255,205
The accompanying notes form an integral part of the financial statements.
12

AmChina A-Shares
STATEMENT BY THE MANAGER
AmFunds Management Berhad
Kuala Lumpur, Malaysia
17 June 2020
Chief Executive Officer
For and on behalf of the Manager
I, Goh Wee Peng, for and on behalf of the Manager, AmFunds Management Berhad, for
AmChina A-Shares (the “Fund”) do hereby state that in the opinion of the Manager, the
accompanying condensed statement of financial position, condensed statement of
comprehensive income, condensed statement of changes in equity and condensed statement of
cash flows are drawn up so as to give a true and fair view of the financial position of the Fund as
at 30 April 2020 and the comprehensive income, the changes in equity and cash flows of the
Fund for the quarter then ended.
GOH WEE PENG
13

14
DIRECTORY
Head Office 9th & 10th Floor, Bangunan AmBank Group 55, Jalan Raja Chulan, 50200 Kuala Lumpur Tel: (03) 2032 2888 Facsimile: (03) 2031 5210 Email: [email protected]
Postal Address AmFunds Management Berhad P.O Box 13611, 50816 Kuala Lumpur
For enquiries about this or any of the other Funds offered by AmFunds Management Berhad Please call 2032 2888 between 8.45 a.m. to 5.45 p.m. (Monday to Thursday),
Friday (8.45 a.m. to 5.00 p.m.)
