quarterly newsletter of the federal planning · pdf filequarterly newsletter of the federal...
TRANSCRIPT
............................................................................................................................................................................................................................................................................................................
Quarterly Newsletter of the Federal Planning Bureau
Short Term Update (STU) is the quarterly newsletter of the Federal Planning Bureau. It is published four times a year in English.It contains the main conclusions from the publications of the FPB, as well as information on new publications, together with ananalysis of the most recent economic indicators.
Editorial Board
Henri Bogaert
Michel Englert
Bart Hertveldt
Valérie Lemaigre
Etienne Rohaert
Joost Verlinden
DTP & Web Publishing
Geert Bryon
Dominique van der Wal
Printed by
Ministry ofEconomic Affairs
The Federal Planning Bureau (FPB) is a public agency under the authority of the Prime Min-ister and the Minister of Economic Affairs. The FPB has a legal status that gives it an auton-omy and intellectual independence within the Belgian Federal public sector.
FPB activities are primarily focused on macro-economic forecasting, analysing and assessingpolicies in the economic, social and environmental fields.
..................................................................................................................................................................................................
H E A D L I N E S B E L G I A N E C O N O M Y
An improvement in the most recent economic indicators and a better outlook for the Europeaneconomy have prompted the FPB to revise its growth forecasts. GDP is now expected to grow by 2.4%in 1997 and 2.7% in 1998, compared to the previous forecasts of 2.1% and 2.5% respectively.
Higher growth rates are forecast for domestic as well as external demand. The revision, however, ismainly based on external factors. Exporters are benefiting with a certain time lag from a stronger USD
and UKP. The combined expected depreciation of the BEF over 1997-98 is now 4.5%. As it concernsessentially a depreciation of the currencies of the whole DEM-zone, not only Belgian exporters benefitfrom this, but the impact on the economies of the other continental European countries is also positive.This, in turn, improves market opportunities for Belgian exporters.
The recent import price increases are linked to the exchange rate evolution. Consumer price inflation,however, remains subdued and is expected to amount to 1.65% in 1997 and 1.7% in 1998. The recentand expected rises in short term interest rates on the European continent should not have a significanteffect on economic activity.
There are a few small signs of an improving labour market. In 1998, employment should increase by44,000, taking into account specific programmes targeting unemployed people. This should thereforelead to increased private consumption and higher tax receipts.
The macroeconomic impact of the 1998-Budget is small. The government deficit should be well below3% of GDP in 1997 and 1998. The deficit figures of 2.5% and 2.3% for 1997 and 1998 respectively,announced by the FPB in April, should be achieved without difficulty. The expected economic growthand the measures set out in the 1998-Budget should even enable the deficit to be reduced further.

............................................................................................................................................................................................................................................................................................................
Table of Contents
Special Topic.......................................................................................................... 3Labour costs in industry and market services
Economic Forecasts............................................................................................... 5Economic forecasts 1997-98
Summary of Economic Forecasts .......................................................................... 7Economic Forecasts by the Federal Planning BureauEconomic forecasts for Belgium by different institutions
Recent Economic Evolution ................................................................................... 8General economic activityPrivate consumptionBusiness investmentHousing investmentStockbuildingForeign TradeLabour marketPricesInterest RatesExchange ratesFiscal indicators
Summaries ........................................................................................................... 19Budgetary cost of an unemployed person, from 1983 to 1997Forty years evolution of working time in BelgiumSpecification and estimation of an allocation system for private consumption in Europe.The Rocard proposal to reduce working hours: a micro-macro analysisRelocation and internationalisation
News .................................................................................................................... 22Recent PublicationsForthcoming PublicationsForthcoming Events
Economic Policy Measures .................................................................................. 23Recent history of major economic policy measures
Abbreviations ....................................................................................................... 24Abbreviations for names of institutions used in this publicationOther Abbreviations

3
SP
EC
IAL
TO
PIC
Special Topic
The competitiveness laws of 1989 and 1996 referrespectively to past and expected developments oflabour costs on a macroeconomic level in the main trad-ing partner countries. In this analysis the recent evolu-tion of a number of indicators for cost-competitiveness ofBelgian firms is assessed. It is based on the most rudi-mentary sectorial breakdown possible: industry on theone hand and market services on the other hand. Theissue of the importance of working time in the assess-ment of competitiveness is also addressed. Given theimportant delays in the availability of sectorial data, thisexercise can only be performed in a reliable way for the1987-94 period.
Legal framework
The 1989 ‘Competitiveness Law’ authorizes governmentintervention if the average overall wage increasesproves (ex post) to result in an upsurge of relative labourcosts per head in common currency (vis-à-vis Belgium’sseven most important trading partners), and in a deteri-orating external performance of enterprises in the pri-vate sector.
The 1989 law was extended in 1996 so as to enable thegovernment to shape and monitor even more closely thewage bargaining process. The most important changeswith respect to the 1989 law consisted in a shift from anex-post to an ex-ante assessment of labour costs and alsoin the fact that the number of countries used as a bench-mark was reduced to three. The forecasted weightedgrowth of foreign hourly labour costs in national cur-rency (to be understood as a weighted average forFrance, Germany and The Netherlands) now acts as anupper limit for wage negotiations at all levels (macro;sector; firm), the lower limit remaining, as before, theautomatic price indexation of wages, plus wage drift.
Both the 1989 and the 1996 laws were profoundlymacroeconomic in nature. Nevertheless, both laws mayalso be seen as contributing to a uniform evolution ofrelative wages and labour costs across sectors, firms andworkers.
Macroeconomic labour cost evolution
Graph 1 clearly reveals the origin of the 1995-96 realwage freeze. Accumulated over the period 1987-94, Bel-gian labour costs per head in common currency hadrisen 9% faster than in France, Germany and The Neth-erlands on average.
Graph 1 - Relative labour costs for the market sector
This relative labour cost disadvantage also holds true interms of hourly labour costs in common currency, whichis a more relevant concept from a competitiveness pointof view. However, due to the fact that average workingtime per head for wage and salary earners decreasedconsiderably more abroad, the accumulated labour costdisadvantage over the period according to this indicatorfalls to 6.7%. The faster reductions of average workingtime abroad occurred entirely in the period 1987-90,when both Germany and The Netherlands witnessedconsiderable reductions in average working time; since1990 working time reductions both in Belgium andabroad have been extremely moderate.
Graph 1 also indicates that by the standards of the new"Wage Norm", which uses relative hourly labour costsin national currency to measure cost competitiveness,the accumulated disadvantage over the period reducesfurther to 5%, due to the effective appreciation of the BEF
vis-à-vis the three trading partners over the period inquestion. In the future, whether measuring in nationalor in common currency will probably be irrelevant,given that all countries involved in the comparison arelikely to participate in European Monetary Union. Forthe period under consideration, however, it seems thatrelative hourly labour costs in common currency shouldbe regarded as the more relevant indicator.
Productivity growth for the aggregate market sectorwas slightly faster in Belgium over the given period thanabroad (graph 3). This means that Belgium’s accumu-lated cost disadvantage of 6.7% in terms of relativehourly labour costs in common currency reduces to4.6%, if relative unit labour costs in common currency(graph 4) are used as an indicator for cost competitive-ness.
Labour costs in industry and market services
1987 1988 1989 1990 1991 1992 1993 1994
100
105
110
Per head in common currencyPer hour in common currencyPer hour in national currency

4
SP
EC
IAL
TO
PIC
Sectorial labour cost evolution
The market sector as a whole can be broken down intotwo major sectors: industry (i.e. manufacturing indus-try, energy and construction) and market services.Hourly labour costs in common currency have risenfaster in Belgium than abroad in the total market sector,but more so in industry than in market services (seegraph 2), even though the accumulated differencesbetween the two sectors are not very important. Therather similar evolution of relative labour costs contrastswith major differences in relative productivity growth(graph 3) and, consequently, relative unit labour costs(graph 4) for industry on the one hand and market serv-ices on the other hand.
Graph 2 - Relative hourly labour costs in common currency
Productivity growth in Belgian industry was markedlyfaster than abroad and stood at an accumulated pre-mium of 8.5% at the end of the period (graph 3), whereasfor market services productivity growth was slightlyless rapid in Belgium than abroad. This divergency insectorial productivity growth seems to confirm a spe-cific feature which goes back many years in Belgium,applying in fact to the whole post-1974 period. If any-thing, the slower productivity growth in Belgian marketservices has been slightly less pronounced than before;since 1990 productivity growth in Belgian market serv-ices has even been marginally higher than abroad.
Graph 3 - Relative productivity growth
Graph 4 - Relative unit labour costs in common currency
For market services, labour productivity growth in Bel-gium and in the three trading partners over the periodin question has been rather similar. Value added growthand employment growth, however, have been smallerin Belgium than in the neighbouring countries. In indus-try, the picture is different. With employment in Bel-gium evolving in line with the three neighbouring coun-tries, Belgium has been able to attain higher value addedgrowth rates, corresponding to higher labour productiv-ity growth.
For sectorial relative unit labour costs (graph 4) thismeans that over the period in question a considerable5.2% disadvantage was accumulated in market services,whereas for industry the faster domestic increase in pro-ductivity more than compensates the higher increase indomestic labour costs, corresponding to an accumulatedrelative cost competitiveness advantage of 0.8% for Bel-gian industry.
For industry as for market services, a negative correla-tion between relative activity and relative unit labourcosts is apparent. Belgium has experienced higher out-put growth and lower unit labour costs than its tradingpartners in the industrial sector. The opposite (i.e. loweroutput growth and higher unit labour costs) holds formarket services.
The preceding analysis, however, does not allow anyclearcut conclusions to be drawn concerning the availa-ble margins for wage increases per sector. It is indeeddifficult to asses to what extent higher productivitygrowth rates in industry (and hence lower unit labourcosts) are caused by higher wages or by other factors. Toavoid this problem, the wage norm defined in the 1996Law focuses prudently on comparisons for labour costsper hour.
1987 1988 1989 1990 1991 1992 1993 199495
100
105
110
IndustryMarket servicesAggregate market sector
1987 1988 1989 1990 1991 1992 1993 199495
100
105
110
IndustryMarket servicesAggregate market sector
1987 1988 1989 1990 1991 1992 1993 199495
100
105
IndustryMarket servicesAggregate market sector
5
EC
ON
OM
IC F
OR
EC
AS
TS
Economic Forecasts
The forecasts (presented on page 7) are an up-date ofthe ‘Economic forecasts 1998 - Budget 1998’ of July 97.In particular, the latest economic data for Belgium, the1998-Budget as well as a clearer picture of the interna-tional outlook for the current year and next year areincorporated. Available data up to 27 October are used.
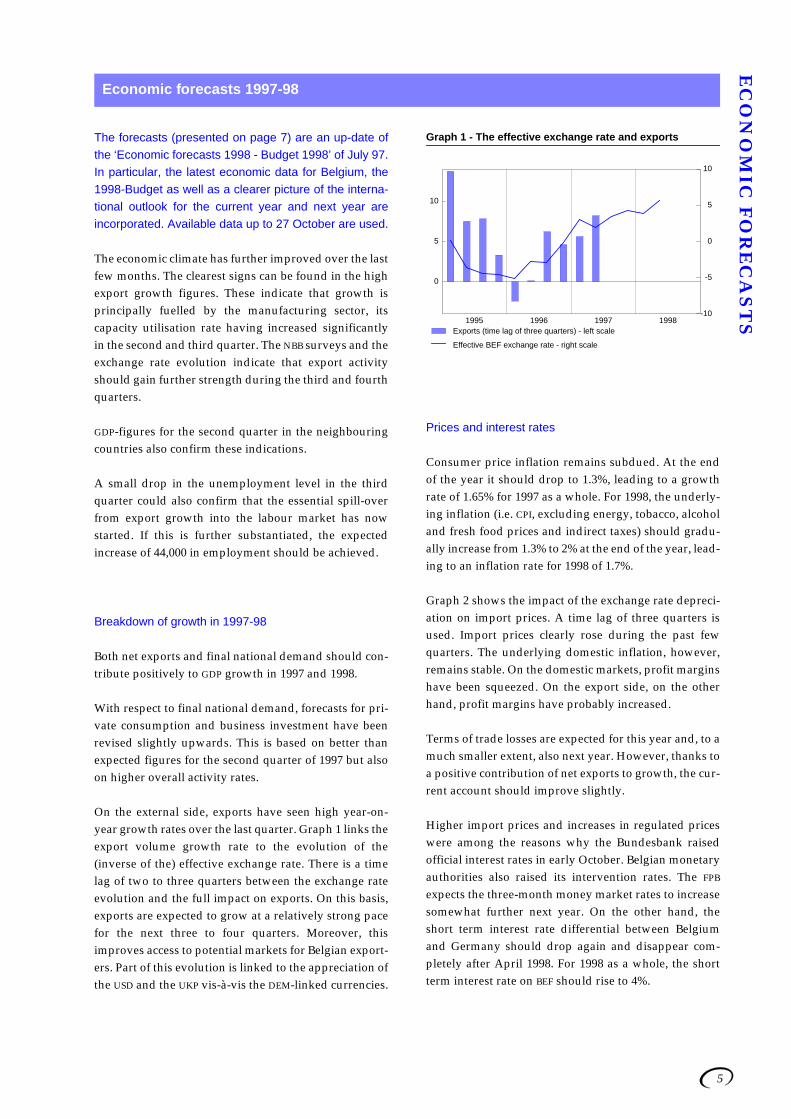
The economic climate has further improved over the lastfew months. The clearest signs can be found in the highexport growth figures. These indicate that growth isprincipally fuelled by the manufacturing sector, itscapacity utilisation rate having increased significantlyin the second and third quarter. The NBB surveys and theexchange rate evolution indicate that export activityshould gain further strength during the third and fourthquarters.
GDP-figures for the second quarter in the neighbouringcountries also confirm these indications.
A small drop in the unemployment level in the thirdquarter could also confirm that the essential spill-overfrom export growth into the labour market has nowstarted. If this is further substantiated, the expectedincrease of 44,000 in employment should be achieved.
Breakdown of growth in 1997-98
Both net exports and final national demand should con-tribute positively to GDP growth in 1997 and 1998.
With respect to final national demand, forecasts for pri-vate consumption and business investment have beenrevised slightly upwards. This is based on better thanexpected figures for the second quarter of 1997 but alsoon higher overall activity rates.
On the external side, exports have seen high year-on-year growth rates over the last quarter. Graph 1 links theexport volume growth rate to the evolution of the(inverse of the) effective exchange rate. There is a timelag of two to three quarters between the exchange rateevolution and the full impact on exports. On this basis,exports are expected to grow at a relatively strong pacefor the next three to four quarters. Moreover, thisimproves access to potential markets for Belgian export-ers. Part of this evolution is linked to the appreciation ofthe USD and the UKP vis-à-vis the DEM-linked currencies.
Graph 1 - The effective exchange rate and exports
Prices and interest rates
Consumer price inflation remains subdued. At the endof the year it should drop to 1.3%, leading to a growthrate of 1.65% for 1997 as a whole. For 1998, the underly-ing inflation (i.e. CPI, excluding energy, tobacco, alcoholand fresh food prices and indirect taxes) should gradu-ally increase from 1.3% to 2% at the end of the year, lead-ing to an inflation rate for 1998 of 1.7%.
Graph 2 shows the impact of the exchange rate depreci-ation on import prices. A time lag of three quarters isused. Import prices clearly rose during the past fewquarters. The underlying domestic inflation, however,remains stable. On the domestic markets, profit marginshave been squeezed. On the export side, on the otherhand, profit margins have probably increased.
Terms of trade losses are expected for this year and, to amuch smaller extent, also next year. However, thanks toa positive contribution of net exports to growth, the cur-rent account should improve slightly.
Higher import prices and increases in regulated priceswere among the reasons why the Bundesbank raisedofficial interest rates in early October. Belgian monetaryauthorities also raised its intervention rates. The FPB
expects the three-month money market rates to increasesomewhat further next year. On the other hand, theshort term interest rate differential between Belgiumand Germany should drop again and disappear com-pletely after April 1998. For 1998 as a whole, the shortterm interest rate on BEF should rise to 4%.
Economic forecasts 1997-98
1995 1996 1997 1998
0
5
10
-10
-5
0
5
10
Exports (time lag of three quarters) - left scale
Effective BEF exchange rate - right scale

6
EC
ON
OM
IC F
OR
EC
AS
TS Graph 2 - The effective exchange rate and inflation
The effects of higher short term rates on real activityshould be negligible. Long term interest rates, which aremore important for real activity, should rise moderately,in line with the July forecasts.
Labour market
With higher activity growth rates, the employment situ-ation should also improve. The small decline in theunemployment level observed in the third quarter of1997 might be a harbinger of this. Hourly labour pro-ductivity should increase by about 2.25% per year.
Further cuts in employers’ social security contributionswere announced in the 1998-Budget (see below). Eventhough the impact of these measures in 1998 will besmall, the government has been able to eliminate uncer-tainty about the future evolution of employers’ contri-butions by repeating its commitment to further cuts.
The number of jobs created (measured by the differ-ences between June figures) remains small in 1997 butshould be substantial in 1998 (+44,000 for total employ-ment). It should be emphasised that a third of the 1998improvement in employment figures should be attrib-uted to the inclusion of people who were previouslyconsidered as unemployed. The unemployment rate(Eurostat standardised definition) should drop by 0.5%-point in 1998 to 9.3%.
Competitiveness
In the technical report of September 1997 on the availa-ble margins for labour cost increases, the Central Eco-nomic Council (CRB/CCE) stated that labour costs in1997-98 should remain within the limits set by the Gov-ernment (6.1%). In that case, the competitive position ofBelgium vis-à-vis its three main trading partners shouldslightly improve.
The most recent indications on the wage evolution in theneighbouring countries show that wage inflation in TheNetherlands and France might this year be somewhatmore important than previously expected. For nextyear, wage forecasts are unchanged. The wage costhandicap in Belgium might therefore be somewhatreduced in 1997.
The 1998-Budget
The Prime Minister unveiled the main points of the1998-Budget on 7 October 1997. As regards publicfinances, the Budget is based on the (new) ConvergencePlan. The primary surplus of the combined accounts ofthe Federal Government and Social security should notbe lower than the Government’s estimates of the 1997-level, i.e. 5.3% of GDP.
On the expenditure side, the health insurance budget isexpected to grow by 2.7%, excluding inflation. On therevenue side, three items increase receipts by around 12billion - all one-off measures: +8 billion from the licenceto be granted to a third mobile phone operator; an exten-sion of levies paid by pharmaceutical companies (+2.4billion) and by electricity producers (+1.5 billion).
To promote employment, social security contributionsare to be further reduced. The Government has contin-ued to stress its commitment to reducing social contri-butions to a level comparable to the average of such con-tributions in France, Germany and The Netherlandsover a 5 to 6 year period. In 1998, employers contribu-tions’ to Social security should fall by around 15 billion:9 billion through an extension of Maribel (of which 2.8billion for ´Social Maribel’) and 6 billion through a fur-ther reduction in contributions, the details of whichshould be discussed among the social partners by themiddle of 1998. This last measure should cost 12 billionfrom 1999 onwards.
An extra 4.2 billion will be allocated in 1998 for the mod-ernisation of the Ministry of Justice.
All in all, the macroeconomic impact of the Budget israther small. On the other hand, the impact on the Gov-ernment account will be mainly positive in 1998. The fig-ures announced by the FPB in April of this year for thegovernment deficit (2.5% for 97 and 2.3% for 98) shouldbe achieved without difficulty. The expected economicgrowth and the measures set out in the 1998-Budgetshould even enable the deficit to be reduced further.
1995 1996 1997 1998
-5
0
5
0
1
2
3
4
5
6
Exchange rate (left scale)Import price (right scale)Underlying inflation (right scale)
7
SU
MM
AR
Y O
F E
CO
NO
MIC
FO
RE
CA
ST
SSummary of Economic Forecasts
Economic Forecasts by the Federal Planning Bureau
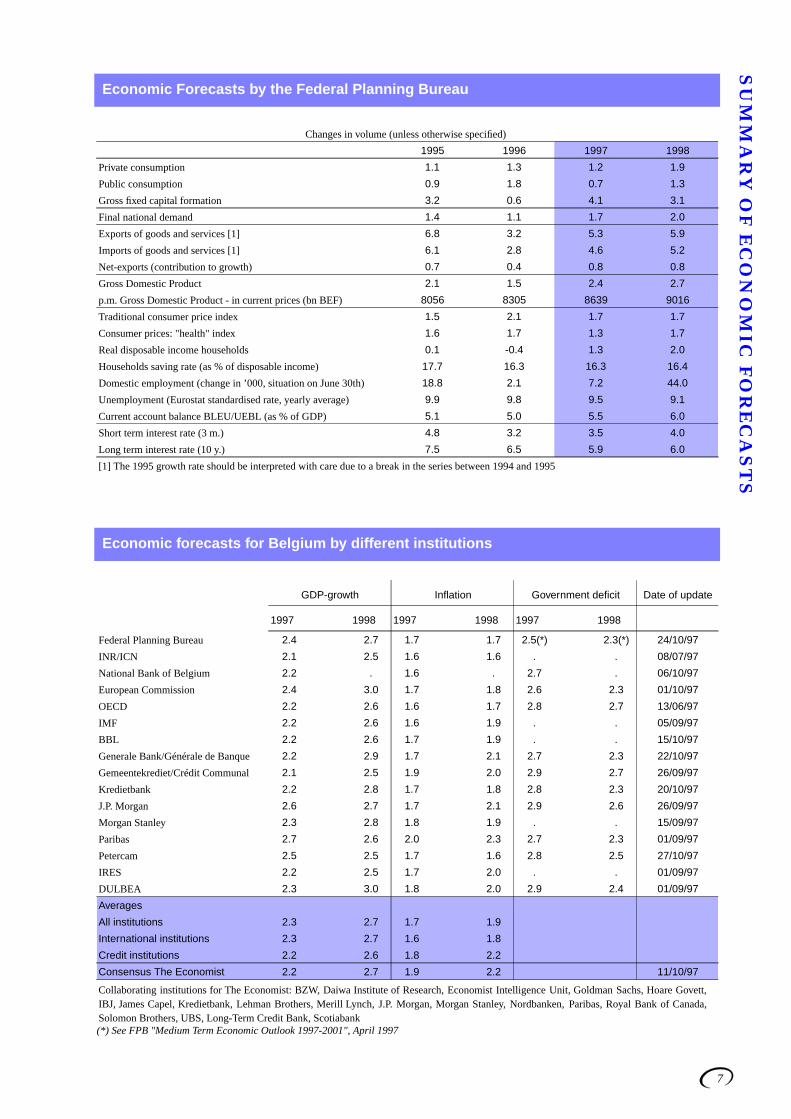
Changes in volume (unless otherwise specified)
1995 1996 1997 1998
Private consumption 1.1 1.3 1.2 1.9
Public consumption 0.9 1.8 0.7 1.3
Gross fixed capital formation 3.2 0.6 4.1 3.1
Final national demand 1.4 1.1 1.7 2.0
Exports of goods and services [1] 6.8 3.2 5.3 5.9
Imports of goods and services [1] 6.1 2.8 4.6 5.2
Net-exports (contribution to growth) 0.7 0.4 0.8 0.8
Gross Domestic Product 2.1 1.5 2.4 2.7
p.m. Gross Domestic Product - in current prices (bn BEF) 8056 8305 8639 9016
Traditional consumer price index 1.5 2.1 1.7 1.7
Consumer prices: "health" index 1.6 1.7 1.3 1.7
Real disposable income households 0.1 -0.4 1.3 2.0
Households saving rate (as % of disposable income) 17.7 16.3 16.3 16.4
Domestic employment (change in ’000, situation on June 30th) 18.8 2.1 7.2 44.0
Unemployment (Eurostat standardised rate, yearly average) 9.9 9.8 9.5 9.1
Current account balance BLEU/UEBL (as % of GDP) 5.1 5.0 5.5 6.0
Short term interest rate (3 m.) 4.8 3.2 3.5 4.0
Long term interest rate (10 y.) 7.5 6.5 5.9 6.0
[1] The 1995 growth rate should be interpreted with care due to a break in the series between 1994 and 1995
Economic forecasts for Belgium by different institutions
GDP-growth Inflation Government deficit Date of update
1997 1998 1997 1998 1997 1998
Federal Planning Bureau 2.4 2.7 1.7 1.7 2.5(*) 2.3(*) 24/10/97
INR/ICN 2.1 2.5 1.6 1.6 . . 08/07/97
National Bank of Belgium 2.2 . 1.6 . 2.7 . 06/10/97
European Commission 2.4 3.0 1.7 1.8 2.6 2.3 01/10/97
OECD 2.2 2.6 1.6 1.7 2.8 2.7 13/06/97
IMF 2.2 2.6 1.6 1.9 . . 05/09/97
BBL 2.2 2.6 1.7 1.9 . . 15/10/97
Generale Bank/Générale de Banque 2.2 2.9 1.7 2.1 2.7 2.3 22/10/97
Gemeentekrediet/Crédit Communal 2.1 2.5 1.9 2.0 2.9 2.7 26/09/97
Kredietbank 2.2 2.8 1.7 1.8 2.8 2.3 20/10/97
J.P. Morgan 2.6 2.7 1.7 2.1 2.9 2.6 26/09/97
Morgan Stanley 2.3 2.8 1.8 1.9 . . 15/09/97
Paribas 2.7 2.6 2.0 2.3 2.7 2.3 01/09/97
Petercam 2.5 2.5 1.7 1.6 2.8 2.5 27/10/97
IRES 2.2 2.5 1.7 2.0 . . 01/09/97
DULBEA 2.3 3.0 1.8 2.0 2.9 2.4 01/09/97
Averages
All institutions 2.3 2.7 1.7 1.9
International institutions 2.3 2.7 1.6 1.8
Credit institutions 2.2 2.6 1.8 2.2
Consensus The Economist 2.2 2.7 1.9 2.2 11/10/97
Collaborating institutions for The Economist: BZW, Daiwa Institute of Research, Economist Intelligence Unit, Goldman Sachs, Hoare Govett,IBJ, James Capel, Kredietbank, Lehman Brothers, Merill Lynch, J.P. Morgan, Morgan Stanley, Nordbanken, Paribas, Royal Bank of Canada,Solomon Brothers, UBS, Long-Term Credit Bank, Scotiabank(*) See FPB "Medium Term Economic Outlook 1997-2001", April 1997
8
RE
CE
NT
EC
ON
OM
IC E
VO
LU
TIO
NRecent Economic Evolution
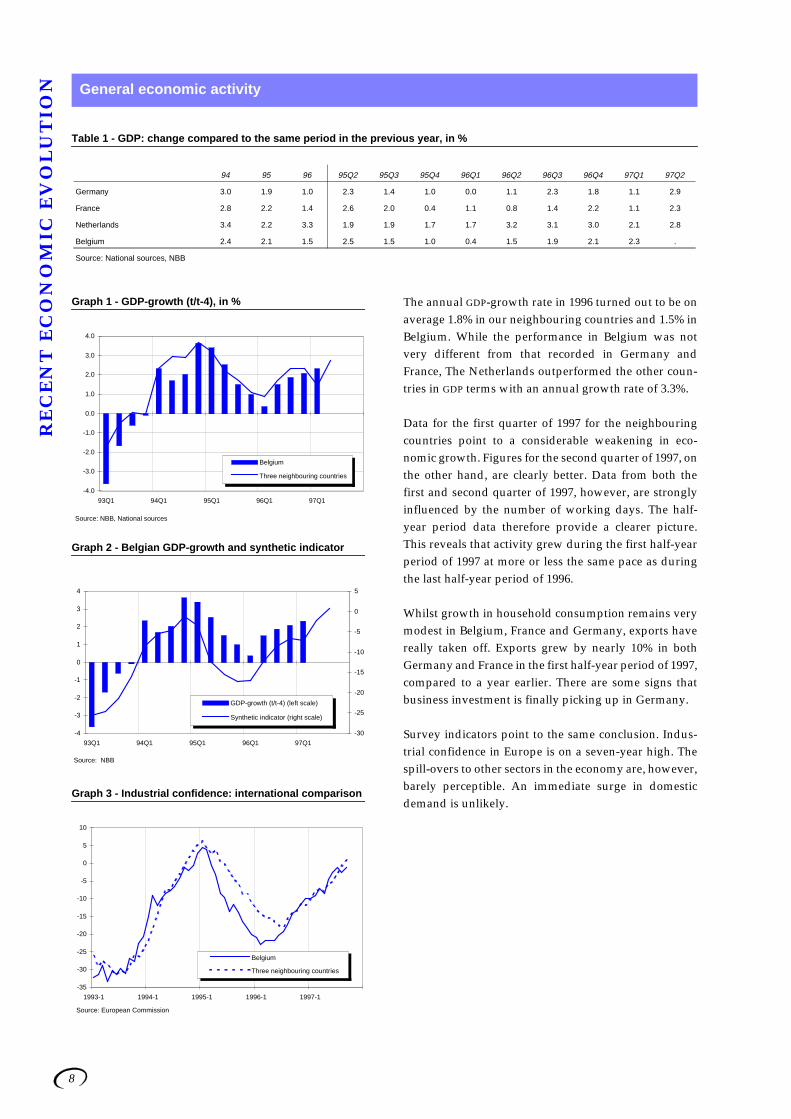
Table 1 - GDP: change compared to the same period in the previous year, in %
Graph 1 - GDP-growth (t/t-4), in %
Graph 2 - Belgian GDP-growth and synthetic indicator
Graph 3 - Industrial confidence: international comparison
The annual GDP-growth rate in 1996 turned out to be onaverage 1.8% in our neighbouring countries and 1.5% inBelgium. While the performance in Belgium was notvery different from that recorded in Germany andFrance, The Netherlands outperformed the other coun-tries in GDP terms with an annual growth rate of 3.3%.
Data for the first quarter of 1997 for the neighbouringcountries point to a considerable weakening in eco-nomic growth. Figures for the second quarter of 1997, onthe other hand, are clearly better. Data from both thefirst and second quarter of 1997, however, are stronglyinfluenced by the number of working days. The half-year period data therefore provide a clearer picture.This reveals that activity grew during the first half-yearperiod of 1997 at more or less the same pace as duringthe last half-year period of 1996.
Whilst growth in household consumption remains verymodest in Belgium, France and Germany, exports havereally taken off. Exports grew by nearly 10% in bothGermany and France in the first half-year period of 1997,compared to a year earlier. There are some signs thatbusiness investment is finally picking up in Germany.
Survey indicators point to the same conclusion. Indus-trial confidence in Europe is on a seven-year high. Thespill-overs to other sectors in the economy are, however,barely perceptible. An immediate surge in domesticdemand is unlikely.
General economic activity
94 95 96 95Q2 95Q3 95Q4 96Q1 96Q2 96Q3 96Q4 97Q1 97Q2
Germany 3.0 1.9 1.0 2.3 1.4 1.0 0.0 1.1 2.3 1.8 1.1 2.9
France 2.8 2.2 1.4 2.6 2.0 0.4 1.1 0.8 1.4 2.2 1.1 2.3
Netherlands 3.4 2.2 3.3 1.9 1.9 1.7 1.7 3.2 3.1 3.0 2.1 2.8
Belgium 2.4 2.1 1.5 2.5 1.5 1.0 0.4 1.5 1.9 2.1 2.3 .
Source: National sources, NBB
-4.0
-3.0
-2.0
-1.0
0.0
1.0
2.0
3.0
4.0
93Q1 94Q1 95Q1 96Q1 97Q1
Belgium
Three neighbouring countries
Source: NBB, National sources
-4
-3
-2
-1
0
1
2
3
4
93Q1 94Q1 95Q1 96Q1 97Q1
-30
-25
-20
-15
-10
-5
0
5
GDP-growth (t/t-4) (left scale)
Synthetic indicator (right scale)
Source: NBB
-35
-30
-25
-20
-15
-10
-5
0
5
10
1993-1 1994-1 1995-1 1996-1 1997-1
Belgium
Three neighbouring countries
Source: European Commission

9
RE
CE
NT
EC
ON
OM
IC E
VO
LU
TIO
NTable 2 - Monthly business surveys [1]
Graph 4 - Business cycle: sectoral evolution
Graph 5 - Manufacturing industry: order books
Graph 6 - Manufacturing industry: different types of goods
The recovery continues to be mainly fuelled by the man-ufacturing sector. One of the main factors behind therecovery has been the appreciation of the US dollar andthe UK pound since the beginning of 1996. After someerratic movements towards the end of 1996, the NBB sur-vey indicators for the manufacturing sector are againimproving. Foreign orders in the manufacturing sectorhave clearly picked up more than domestic orders. Thisis clearly in line with earlier observations regardingexport-led growth, and the key role of the exchange rateevolution in the recovery in continental Europe.
Semi-finished manufacturing goods remain the mostbuoyant part of the manufacturing sector. The invest-ment goods component of the manufacturing sector hasrecently also gained some strength. This is in line withthe first signs of a business investment recovery in Ger-many and France.
The most worrying evolution concerns the manufactur-ing of consumer goods. The spill-over of an export-ledrecovery into domestic demand remains weak. Eventhough domestic orders have somewhat recovered, thisindicator remains rather flat.
A similar evolution can be observed from the top graph.The synthetic survey indicator of the NBB can be brokendown into three indicators, covering the business cyclein the manufacturing, industry, the construction sectorand the trade sector. While the improvement and thestrength of the manufacturing industry is beyond doubt,it is equally clear that there has been no real improve-ment in the other two sectors. Indeed the opposite canbe said to be true for the trade sector.
95 96 96Q4 97Q1 97Q2 97Q3 97M4 97M5 97M6 97M7 97M8 97M9
Synthetic indicator -12.2 -11.2 -6.7 -7.3 -2.3 0.8 -2.0 -3.8 -1.0 -0.6 -1.0 3.9
Manufacturing industry -11.3 -13.3 -7.9 -7.8 -0.2 2.9 -0.4 -1.6 1.4 1.5 0.3 6.8
Construction sector -13.1 -7.0 -5.0 -4.8 -7.1 -5.1 -6.4 -8.4 -6.6 -8.9 -4.0 -2.3
Trade sector -15.1 -5.8 -2.8 -7.6 -7.0 -3.3 -5.0 -9.7 -6.3 -1.8 -4.3 -3.7
[1] Qualitative data
Source: NBB, FPB
-30
-25
-20
-15
-10
-5
0
5
10
93M1 94M1 95M1 96M1 97M1
Manufacturing industry
Construction sector
Trade sector
-30
-20
-10
0
10
20
30
93M1 94M1 95M1 96M1 97M1
Foreign order books
Domestic order books
-35
-30
-25
-20
-15
-10
-5
0
5
10
93M1 94M1 95M1 96M1 97M1
Semifinished goodsConsumer goodsInvestment goods
Source: Business cycle survey NBB
10
RE
CE
NT
EC
ON
OM
IC E
VO
LU
TIO
N
Table 3 - Private consumption indicators
Graph 7 - Private consumption at constant prices
Graph 8 - Private consumption and related survey indicator
Graph 9 - Consumer confidence and unemployment
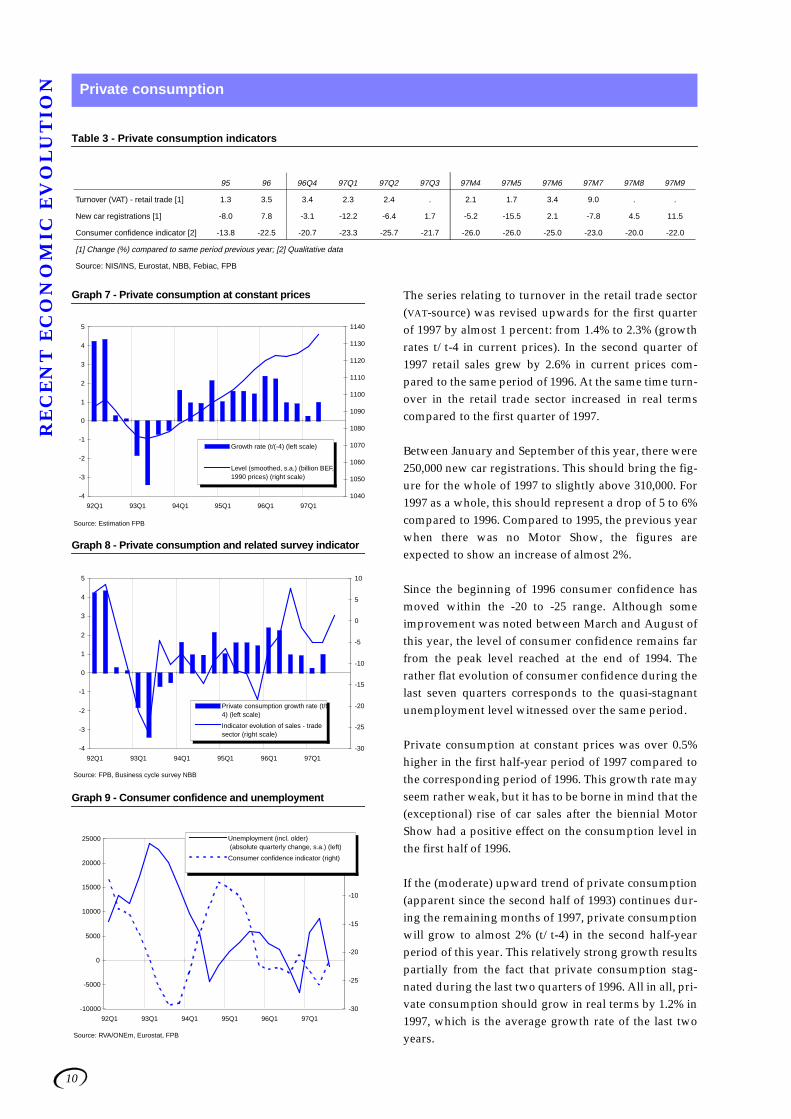
The series relating to turnover in the retail trade sector(VAT-source) was revised upwards for the first quarterof 1997 by almost 1 percent: from 1.4% to 2.3% (growthrates t/t-4 in current prices). In the second quarter of1997 retail sales grew by 2.6% in current prices com-pared to the same period of 1996. At the same time turn-over in the retail trade sector increased in real termscompared to the first quarter of 1997.
Between January and September of this year, there were250,000 new car registrations. This should bring the fig-ure for the whole of 1997 to slightly above 310,000. For1997 as a whole, this should represent a drop of 5 to 6%compared to 1996. Compared to 1995, the previous yearwhen there was no Motor Show, the figures areexpected to show an increase of almost 2%.
Since the beginning of 1996 consumer confidence hasmoved within the -20 to -25 range. Although someimprovement was noted between March and August ofthis year, the level of consumer confidence remains farfrom the peak level reached at the end of 1994. Therather flat evolution of consumer confidence during thelast seven quarters corresponds to the quasi-stagnantunemployment level witnessed over the same period.
Private consumption at constant prices was over 0.5%higher in the first half-year period of 1997 compared tothe corresponding period of 1996. This growth rate mayseem rather weak, but it has to be borne in mind that the(exceptional) rise of car sales after the biennial MotorShow had a positive effect on the consumption level inthe first half of 1996.
If the (moderate) upward trend of private consumption(apparent since the second half of 1993) continues dur-ing the remaining months of 1997, private consumptionwill grow to almost 2% (t/t-4) in the second half-yearperiod of this year. This relatively strong growth resultspartially from the fact that private consumption stag-nated during the last two quarters of 1996. All in all, pri-vate consumption should grow in real terms by 1.2% in1997, which is the average growth rate of the last twoyears.
Private consumption
95 96 96Q4 97Q1 97Q2 97Q3 97M4 97M5 97M6 97M7 97M8 97M9
Turnover (VAT) - retail trade [1] 1.3 3.5 3.4 2.3 2.4 . 2.1 1.7 3.4 9.0 . .
New car registrations [1] -8.0 7.8 -3.1 -12.2 -6.4 1.7 -5.2 -15.5 2.1 -7.8 4.5 11.5
Consumer confidence indicator [2] -13.8 -22.5 -20.7 -23.3 -25.7 -21.7 -26.0 -26.0 -25.0 -23.0 -20.0 -22.0
[1] Change (%) compared to same period previous year; [2] Qualitative data
Source: NIS/INS, Eurostat, NBB, Febiac, FPB
Source: Estimation FPB
-4
-3
-2
-1
0
1
2
3
4
5
92Q1 93Q1 94Q1 95Q1 96Q1 97Q1
1040
1050
1060
1070
1080
1090
1100
1110
1120
1130
1140
Growth rate (t/(-4) (left scale)
Level (smoothed, s.a.) (billion BEF,1990 prices) (right scale)
Source: FPB, Business cycle survey NBB
-4
-3
-2
-1
0
1
2
3
4
5
92Q1 93Q1 94Q1 95Q1 96Q1 97Q1
-30
-25
-20
-15
-10
-5
0
5
10
Private consumption growth rate (t/t-4) (left scale)
Indicator evolution of sales - tradesector (right scale)
Source: RVA/ONEm, Eurostat, FPB
-10000
-5000
0
5000
10000
15000
20000
25000
92Q1 93Q1 94Q1 95Q1 96Q1 97Q1
-30
-25
-20
-15
-10
-5
0Unemployment (incl. older) (absolute quarterly change, s.a.) (left)
Consumer confidence indicator (right)
11
RE
CE
NT
EC
ON
OM
IC E
VO
LU
TIO
N
Table 4 - Business investment indicators
Graph 10 - Business investment at constant prices
Graph 11 - Business investment rate (in % of GDP)
Graph 12 - Business investment indicators
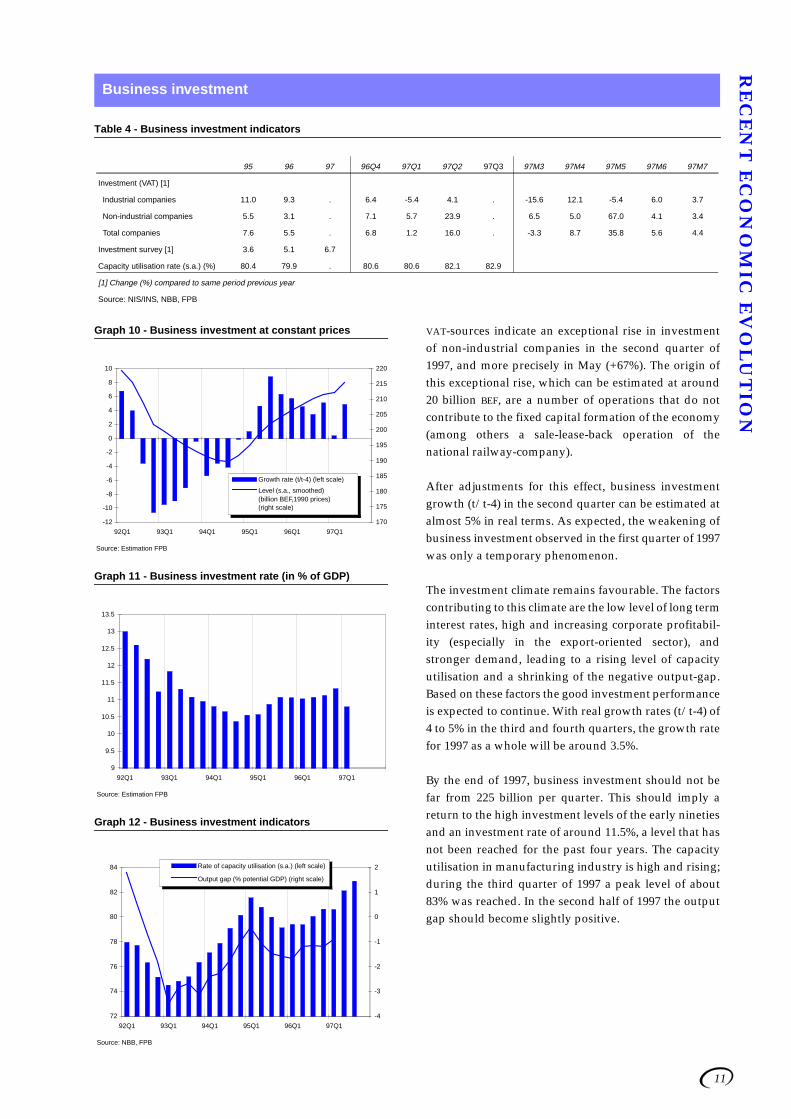
VAT-sources indicate an exceptional rise in investmentof non-industrial companies in the second quarter of1997, and more precisely in May (+67%). The origin ofthis exceptional rise, which can be estimated at around20 billion BEF, are a number of operations that do notcontribute to the fixed capital formation of the economy(among others a sale-lease-back operation of thenational railway-company).
After adjustments for this effect, business investmentgrowth (t/t-4) in the second quarter can be estimated atalmost 5% in real terms. As expected, the weakening ofbusiness investment observed in the first quarter of 1997was only a temporary phenomenon.
The investment climate remains favourable. The factorscontributing to this climate are the low level of long terminterest rates, high and increasing corporate profitabil-ity (especially in the export-oriented sector), andstronger demand, leading to a rising level of capacityutilisation and a shrinking of the negative output-gap.Based on these factors the good investment performanceis expected to continue. With real growth rates (t/t-4) of4 to 5% in the third and fourth quarters, the growth ratefor 1997 as a whole will be around 3.5%.
By the end of 1997, business investment should not befar from 225 billion per quarter. This should imply areturn to the high investment levels of the early ninetiesand an investment rate of around 11.5%, a level that hasnot been reached for the past four years. The capacityutilisation in manufacturing industry is high and rising;during the third quarter of 1997 a peak level of about83% was reached. In the second half of 1997 the outputgap should become slightly positive.
Business investment
95 96 97 96Q4 97Q1 97Q2 97Q3 97M3 97M4 97M5 97M6 97M7
Investment (VAT) [1]
Industrial companies 11.0 9.3 . 6.4 -5.4 4.1 . -15.6 12.1 -5.4 6.0 3.7
Non-industrial companies 5.5 3.1 . 7.1 5.7 23.9 . 6.5 5.0 67.0 4.1 3.4
Total companies 7.6 5.5 . 6.8 1.2 16.0 . -3.3 8.7 35.8 5.6 4.4
Investment survey [1] 3.6 5.1 6.7
Capacity utilisation rate (s.a.) (%) 80.4 79.9 . 80.6 80.6 82.1 82.9
[1] Change (%) compared to same period previous year
Source: NIS/INS, NBB, FPB
Source: Estimation FPB
-12
-10
-8
-6
-4
-2
0
2
4
6
8
10
92Q1 93Q1 94Q1 95Q1 96Q1 97Q1
170
175
180
185
190
195
200
205
210
215
220
Growth rate (t/t-4) (left scale)
Level (s.a., smoothed)(billion BEF,1990 prices)(right scale)
Source: Estimation FPB
9
9.5
10
10.5
11
11.5
12
12.5
13
13.5
92Q1 93Q1 94Q1 95Q1 96Q1 97Q1
Source: NBB, FPB
72
74
76
78
80
82
84
92Q1 93Q1 94Q1 95Q1 96Q1 97Q1
-4
-3
-2
-1
0
1
2Rate of capacity utilisation (s.a.) (left scale)
Output gap (% potential GDP) (right scale)
12
RE
CE
NT
EC
ON
OM
IC E
VO
LU
TIO
N
Graph 13 - Activity in the residential housing sector
Graph 14 - Mortgage rate (in %)
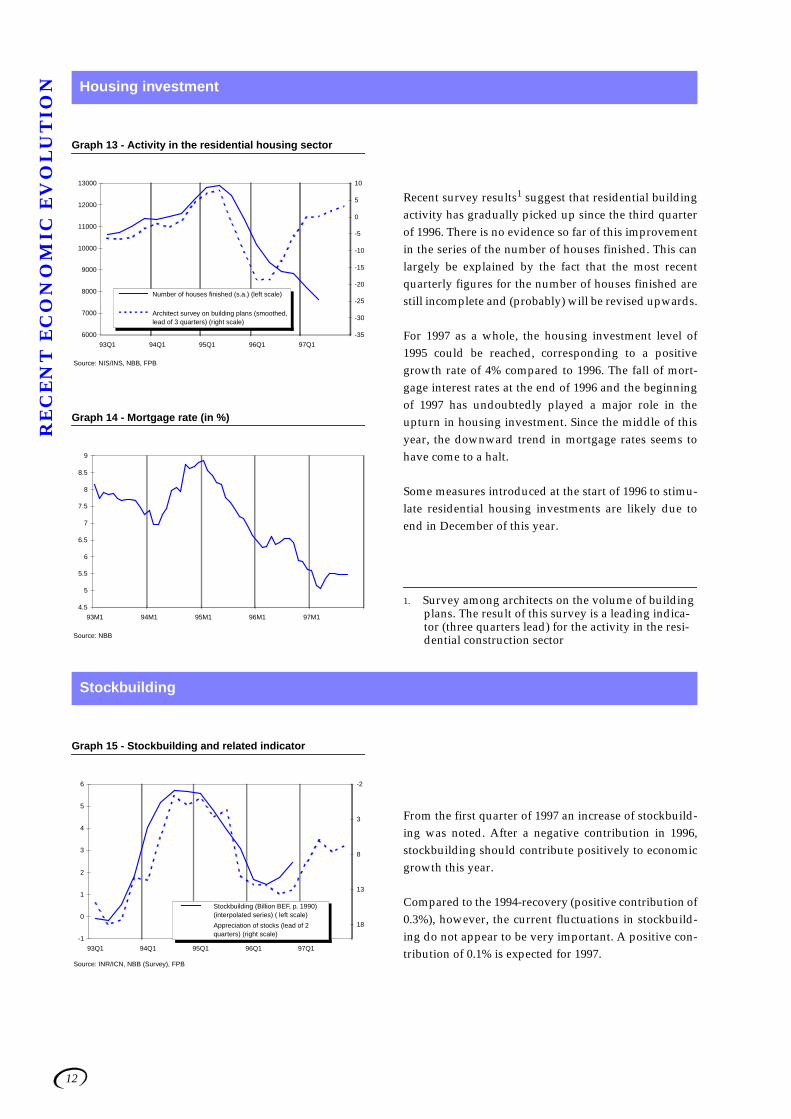
Recent survey results1 suggest that residential buildingactivity has gradually picked up since the third quarterof 1996. There is no evidence so far of this improvementin the series of the number of houses finished. This canlargely be explained by the fact that the most recentquarterly figures for the number of houses finished arestill incomplete and (probably) will be revised upwards.
For 1997 as a whole, the housing investment level of1995 could be reached, corresponding to a positivegrowth rate of 4% compared to 1996. The fall of mort-gage interest rates at the end of 1996 and the beginningof 1997 has undoubtedly played a major role in theupturn in housing investment. Since the middle of thisyear, the downward trend in mortgage rates seems tohave come to a halt.
Some measures introduced at the start of 1996 to stimu-late residential housing investments are likely due toend in December of this year.
1. Survey among architects on the volume of buildingplans. The result of this survey is a leading indica-tor (three quarters lead) for the activity in the resi-dential construction sector
Graph 15 - Stockbuilding and related indicator
From the first quarter of 1997 an increase of stockbuild-ing was noted. After a negative contribution in 1996,stockbuilding should contribute positively to economicgrowth this year.
Compared to the 1994-recovery (positive contribution of0.3%), however, the current fluctuations in stockbuild-ing do not appear to be very important. A positive con-tribution of 0.1% is expected for 1997.
Housing investment
Source: NIS/INS, NBB, FPB
6000
7000
8000
9000
10000
11000
12000
13000
93Q1 94Q1 95Q1 96Q1 97Q1
-35
-30
-25
-20
-15
-10
-5
0
5
10
Number of houses finished (s.a.) (left scale)
Architect survey on building plans (smoothed,lead of 3 quarters) (right scale)
Source: NBB
4.5
5
5.5
6
6.5
7
7.5
8
8.5
9
93M1 94M1 95M1 96M1 97M1
Stockbuilding
Source: INR/ICN, NBB (Survey), FPB
-1
0
1
2
3
4
5
6
93Q1 94Q1 95Q1 96Q1 97Q1
-2
3
8
13
18
Stockbuilding (Billion BEF, p. 1990)(interpolated series) ( left scale)
Appreciation of stocks (lead of 2quarters) (right scale)

13
RE
CE
NT
EC
ON
OM
IC E
VO
LU
TIO
N
Table 5 - BLEU/UEBL Trade statistics (intra/extrastat) [*]
Table 6 - BLEU/UEBL Balance of payments statistics
Graph 16 - Growth of exports and related indicator
Graph 17 - Foreign balances (4 quarters cumulated, % of GDP)
Real export growth accelerated during the second quar-ter of the year, and should continue to grow at the samepace during the second half-year period of 1997, giventhe depreciation of the BEF in real terms and the prospectof further increases in foreign demand. It is worth not-ing that after a slow start at the beginning of the year,exports to EU countries have picked up recently,although exports to non-EU countries still remain moredynamic.
The progressive increase of import prices, as a laggedconsequence of exchange rate movements, is confirmedby most recent data. Terms of trade losses are observedfor the first half-year period of 1997.
Despite the higher import prices, the trade balance sur-plus showed a significant improvement during the lastquarter thanks to export performances.
Foreign Trade
95 96 96Q3 96Q4 97Q1 97Q2 97M2 97M3 97M4 97M5 97M6 97M7
Exports - value [1] 8.0 4.0 7.3 7.0 9.2 12.1 8.8 9.6 17.4 4.7 14.2 14.8
Imports - value [1] 7.7 6.8 7.8 7.9 5.4 11.8 5.7 5.7 15.6 6.7 13.1 12.6
Exports - volume [1] 8.0 2.0 6.2 4.6 5.9 8.7 5.9 6.0 13.3 0.5 12.2 9.3
Imports - volume [1] 5.5 4.3 5.6 4.3 1.5 6.4 1.1 0.8 10.5 1.1 7.9 5.5
Exports - price [1] 0.0 2.0 1.2 2.4 3.1 3.2 2.7 3.3 3.6 4.2 1.8 5.0
Imports - price [1] 2.1 2.4 2.2 3.4 3.9 5.0 4.6 4.9 4.6 5.5 4.8 6.7
[1] Change (%) compared to same period previous year[*] Methodological changes in the beginning of 1997 make comparisons with the past difficult. This table shows estimates to facilitate the analysis.Source: INR/ICN, FPB
95 96 96Q3 96Q4 97Q1 97Q2 97M1 97M2 97M3 97M4 97M5 97M6
Exports - goods [1] 11.8 4.9 5.0 6.8 4.7 9.0 6.2 5.5 2.4 11.6 5.0 10.3
Imports - goods [1] 10.6 5.5 5.4 8.9 7.2 7.6 8.0 8.6 5.1 12.1 2.0 8.7
Trade balance [2] 296 283 62 72 57 91 34 12 11 31 36 24
Exports - goods and services [1] 3.1 5.2 5.5 6.4 5.4 8.7 6.2 5.9 4.2 10.5 4.1 11.6
Imports - goods and services [1] 3.3 5.6 5.1 8.6 6.6 8.5 6.6 7.7 5.4 12.4 2.6 10.4
Goods and services balance [2] 360 361 70 86 100 108 53 28 19 35 40 33
Exports - current transactions [1] -6.9 0.3 1.0 -1.3 4.4 6.6 4.9 4.7 3.6 8.0 3.4 8.3
Imports - current transactions [1] -7.4 0.1 0.3 -0.4 5.4 6.1 6.2 6.0 4.0 9.0 2.4 6.8
Current account [2] 433 445 102 112 104 131 50 24 30 45 51 35
[1] Change (%) compared to same period previous year; [2] Level in Billion BEFSource: NBB, FPB
-5
0
5
10
15
20
92Q1 93Q1 94Q1 95Q1 96Q1 97Q1
-30
-20
-10
0
10
20
30Exports goods and services (current p.) (t/t-4) (left scale)
Exports of goods (volume) (t/t-4) (left scale)
Foreign order books (right scale)
Source: NBB (BoP, Survey), INR/ICN (Trade Stat.), FPB
0
1
2
3
4
5
6
92Q1 93Q1 94Q1 95Q1 96Q1 97Q1
Trade balance (goods)
Goods and services balance
Current account balance
Source: NBB (BoP), FPB

14
RE
CE
NT
EC
ON
OM
IC E
VO
LU
TIO
N
Table 7 - Labour market indicators
Graph 18 - Evolution of unemployment (incl. older)
Graph 19 - Evolution of employment
Analyses of the figures relating to the labour market hasbeen made more complex since 1996 by changes in theadministrative treatment of various categories of work-ers and unemployed people. No definitive conclusionscan therefore be drawn from the monthly figures.
The RSZ/ONSS has recently started publishing quarterlydata on employment with a delay of around six months.Two quarters (96Q4 and 97Q1) of these statistics arenow available. More use of these data will probably bemade in the future.
The seasonally adjusted unemployment level, inclusiveof the ‘older unemployed’ (see graph 18), has evolvedrather erratically since the beginning of 1996. Part of thiscan be attributed to the evolution in the number ofexclusions. In particular, the drop in unemployment inthe second half of 1996 can certainly be explained in partby a tightening of the conditions whereby unemployedpeople can claim unemployment allowances.
The underlying reality may be that the labour market isable to absorb the increase in the labour force, leavingthe number of unemployed little changed. This couldresult in an annualised increase in employment of 0.3%.
Labour market
95 96 96Q4 97Q1 97Q2 97Q3 97M4 97M5 97M6 97M7 97M8 97M9
Unemployment (excl. older) [1] 596.9 588.3 582.9 570.5 542.9 598.1 551.4 536.8 540.6 588.2 607.0 599.0
Unemployment (incl. older) [1] 669.3 679.9 684.6 678.4 654.5 714.1 661.4 647.9 654.3 703.6 722.9 715.8
Unemployment rate-FMTA/MfET[2] 13.9 13.7 13.6 13.3 12.6 13.9 12.8 12.5 12.6 13.7 14.1 13.9
Unemployment rate-Eurostat [3] 9.9 9.8 9.5 9.5 9.6 9.6 9.6 9.6 9.6 9.6 9.6 9.5
[1] Level in thousands; [2] In % of labour force of June 1995, not seasonally adjusted
[3] Seasonally adjusted, in % of labour force (Eurostat standard); recent figures of unemployment rate are based on administrative data and can be revised.
Source: RVA/ONEm, FMTA/MfET, Eurostat, FPB
Source: RVA/ONEm, FPB
-10000
-5000
0
5000
10000
15000
20000
25000
30000
92Q1 93Q1 94Q1 95Q1 96Q1 97Q1
450000
500000
550000
600000
650000
700000
Absolute quarterly change (s.a.) (left scale)Level (s.a.) (right scale)
Source: RSZ/ONSS, FPB
-30000
-25000
-20000
-15000
-10000
-5000
0
5000
10000
15000
20000
92Q1 93Q1 94Q1 95Q1 96Q1 97Q1
294000
296000
298000
300000
302000
304000
306000
308000
310000Quarterly change (s.a.): enterprises (left scale)
Quarterly change (s.a.): enterprises and public sector
Level - enterprises and public sector (s.a.) (right scale)

15
RE
CE
NT
EC
ON
OM
IC E
VO
LU
TIO
N
Table 8 - Inflation rates: change compared to the same period in the previous year, in %
Table 9 - Monthly inflation forecasts
Graph 20 - Monthly inflation evolution in % (t/t-12)
Graph 21 - Inflation rates in % (t/t-12): decomposition
As expected, the pivot index for the public sector wasreached in August 1997. Public wages and social bene-fits were consequently increased (by 2%) in October.Over the first nine months of 1997, inflation (measuredby the rise of the general CPI) amounted to 1.74%,whereas the health index over the same period onlyincreased by 1.36%. Underlying inflation fluctuatedwithin the 1.2-1.4%-range, with an average of 1.3% overthe first three quarters. Assuming unchanged underly-ing inflation (i.e. around 1.3%) and in the absence ofmajor energy price movements or dollar fluctuationsduring the remaining months of 1997, inflation isexpected to be low during the last quarter of 1997(around 1.3% for the general CPI and 1.1 to 1.2% for thehealth index). For 1997 as a whole general consumerprice inflation should be around 1.65%, compared to2.06% in 1996. The health index should grow by 1.3% in1997, which is also less than last year (1.65%).
The effective depreciation of the currencies of the DEM-zone seems (with a certain delay) to have provokedincreases in import prices, but domestic price inflationremains very low. This would imply that domesticprofit margins are being compressed. As the shrinkingof profit margins is expected to end soon, underlyinginflation is expected to increase slightly from the begin-ning of 1998 (from 1.3% to nearly 2.0% at the end of1998). Taking into account this outlook for the underly-ing inflation both the general CPI and the health indexshould increase by 1.7% in 1998. Next year, publicwages should be adjusted for price changes in Novem-ber.
Prices
95 96 96Q4 97Q1 97Q2 97Q3 97M5 97M6 97M7 97M8 97M9 97M10
Consumer prices: all items 1.47 2.06 2.45 1.91 1.53 1.79 1.58 1.74 1.89 1.85 1.62 1.30
Food prices 1.21 0.62 0.81 0.97 1.26 3.27 1.36 2.10 3.39 2.51 3.94 3.46
Non food prices 0.81 2.37 3.25 2.47 1.55 1.55 1.64 1.76 1.50 2.06 1.11 0.47
Services 2.01 2.35 2.45 1.78 1.59 1.36 1.59 1.56 1.66 1.37 1.05 1.13
Rent 2.88 2.48 2.13 1.80 1.71 1.59 1.74 1.73 1.60 1.49 1.67 1.61
"Health" index 1.56 1.65 1.88 1.44 1.22 1.42 1.29 1.39 1.61 1.38 1.27 1.13
Brent oil price in USD (level) 17.1 20.6 23.6 21.6 19.1 19.2 20.1 18.7 18.9 19.3 19.3 20.1
Source: MEZ/MAE, IWH
97M1 97M2 97M3 97M4 97M5 97M6 97M7 97M8 97M9 97M10 97M11 97M12
Consumer prices: all items 124.65 124.50 123.94 123.91 124.09 124.30 125.30 125.55 125.01 124.99 125.27 125.49
Consumer prices: "health" index 122.09 121.88 121.31 121.33 121.45 121.67 122.78 122.84 122.34 122.37 122.67 122.91
Moving average "health" index 121.38 121.60 121.64 121.65 121.49 121.44 121.81 122.19 122.41 122.58 122.55 122.57
98M1 98M2 98M3 98M4 98M5 98M6 98M7 98M8 98M9 98M10 98M11 98M12
Consumer prices: all items 126.18 126.21 125.91 126.03 126.22 126.46 127.55 127.52 127.12 127.19 127.53 127.80
Consumer prices: "health" index 123.64 123.66 123.33 123.40 123.59 123.85 125.01 124.97 124.54 124.61 124.97 125.26
Moving average "health" index 122.90 123.22 123.39 123.51 123.49 123.54 123.96 124.35 124.59 124.78 124.78 124.85
Source: Observations (up to 97M10): MEZ/MAE; forecasts: FPB
0.8
1
1.2
1.4
1.6
1.8
2
2.2
2.4
2.6
95M1 96M1 97M1
General price index
"Health" index
Underlying inflation
Source: MEZ/MAE
-0.5
0
0.5
1
1.5
2
2.5
3
3.5
4
95M1 96M1 97M1
Food Non food
Services Rent
Source: MEZ/MAE

16
RE
CE
NT
EC
ON
OM
IC E
VO
LU
TIO
N
Table 10 - Interest rates
Graph 22 - Interest rate levels in Belgium, in %
Graph 23 - Interest rate differentials with Germany(in basis points)
As in previous years, the financial markets were turbu-lent in August. While the dollar strongly appreciated,European monetary and capital markets came underpressure. In fact, the depreciation of the mark againstthe dollar and its effect on import prices led to uncer-tainty as to the orientation of German monetary policy.German inflation peaked at 2.1% in August, as a resultof pressures on import and regulated prices.
Monetary and capital markets reflected this concern.Short and long term interest rates registered a slightincrease, no doubt in anticipation of a tightening of theBundesbank’s monetary policy. Finally, the Germanauthorities followed by other European central banks,raised official interest rates on the 9th of October by 30basis points. Despite the drop in long term interest ratessince mid-September, monetary markets expected aminor increase of intervention rates, as reflected in theslope of the yield curve. The timing of the monetarytightening came, however, as a surprise.
The National Bank of Belgium also followed the move-ment and raised the central rate by 30 points and the dis-count rate by 25 points. This was an opportunity to tryto reduce the spread between Belgian and German shortterm interest rates on the money market, whichappeared in the first quarter of this year as political trou-bles put the Belgian franc under pressure. The spread,however, has increased to more than 40 basis points.Different reasons may have influenced this outcome: theuncertainty surrounding the countries which will par-ticipate in the future euro and the tendency of traders totest different currencies in the System; the sharp DEM/USD exchange rate fluctuations put pressure on the othercurrencies in the System.
Interest Rates
95 96 96Q4 97Q1 97Q2 97Q3 97M4 97M5 97M6 97M7 97M8 97M9
Short-term rates (3 months)
Belgium 4.77 3.21 3.04 3.20 3.25 3.54 3.24 3.24 3.28 3.44 3.58 3.59
Germany 4.41 3.21 3.10 3.12 3.11 3.18 3.16 3.10 3.06 3.08 3.21 3.25
Long-term rates
Belgium: traditional bonds (6+ y) 7.37 6.30 5.81 5.61 5.70 5.50 5.81 5.68 5.61 5.42 5.55 5.52
Belgium: 10 y benchmark OLO 7.48 6.49 6.00 5.80 5.92 5.69 6.02 5.90 5.83 5.64 5.75 5.69
Germany (7-15 y) 6.81 6.10 5.8 5.6 5.6 5.5 5.7 5.6 5.6 5.4 5.5 5.5
Germany: 10 y benchmark 6.85 6.22 5.89 5.69 5.78 5.60 5.87 5.76 5.72 5.56 5.66 5.59
Source: NBB, Frankfurter Allgemeine Zeitung
2
3
4
5
6
7
8
9
10
11
92M1 93M1 94M1 95M1 96M1 97M1
3-month Treasury certificates
Benchmark OLO 10 years
Source: NBB
Short-term rates
-100
0
100
200
300
400
95M1 96M1 97M1
Belgium
France
Netherlands
Long-term rates
-80
-40
0
40
80
120
95M1 96M1 97M1
Source: NBB, Frankfurter Allgemeine Zeitung, Crédit Lyonnais

17
RE
CE
NT
EC
ON
OM
IC E
VO
LU
TIO
N
Table 11 - Exchange rate (Belgian Francs per ...)
Table 12 - Nominal effective exchange rate of the Belgian Franc
Graph 24 - Effective exchange rate (jan. 92=100) and dollar rate
Graph 25 - Belgian Francs per French Franc and Deutsche Mark
Financial markets focused on the dollar. The dollar pur-sued its correction, based on economic fundamentals,against the deutschemark and the yen. Moreover, thedollar also benefited from a new bout of uncertaintyconcerning the future euro participants and the methodof exchange rate fixation. The USD peaked at 1.9 DEM inAugust. Nevertheless, as mentioned above, the uncer-tainties concerning a possible monetary tightening bythe Bundesbank put a brake on the strong appreciationof the dollar.
Whilst in the United States activity is progressivelyslowing, the correction of the dollar, based on economicfundamentals, appears to be built into the current levelof the currency. Nevertheless, until the final selection ofthe countries participating in the euro, concern aboutthe project will probably enhance the dollar's role of"refuge currency" and cause it to appreciate temporarily.
In Belgium, the monetary authorities had to intervene tosupport the BEF/DEM exchange rate. However, as theconsumer prices do not reflect the pressure on importprice, Belgian exporters benefit from the depreciation ofthe effective exchange rate, without adverse effects.
Exchange rates
95 96 96Q4 97Q1 97Q2 97Q3 97M4 97M5 97M6 97M7 97M8 97M9
German Mark 20.58 20.58 20.61 20.63 20.64 20.64 20.63 20.64 20.64 20.64 20.65 20.64
French Franc 5.91 6.05 6.09 6.11 6.12 6.13 6.13 6.12 6.11 6.12 6.13 6.14
Dutch Guilder 18.37 18.37 18.37 18.35 18.35 18.33 18.35 18.35 18.34 18.33 18.33 18.33
Italian Lira 1.81 2.01 2.07 2.09 2.09 2.12 2.08 2.09 2.10 2.12 2.11 2.12
British Pound 46.53 48.38 51.66 55.76 57.85 60.61 57.51 57.42 58.61 61.80 60.94 59.09
American Dollar 29.51 30.96 31.54 34.21 35.36 37.31 35.30 35.15 35.64 36.98 38.01 36.94
ECU 38.12 38.77 39.59 40.04 40.27 40.61 40.25 40.23 40.32 40.71 40.63 40.49
Source: NBB
95 96 97 96Q4 97Q1 97Q2 97Q3 97M5 97M6 97M7 97M8 97M9
Level (Jan.92=100) 107.3 105.2 103.9 102.2 101.2 99.6 101.3 100.7 99.4 99.3 100.0
Growth rate [1] 4.0 -2.0 -3.4 -4.1 -3.7 -5.3 -3.4 -3.9 -5.3 -6.0 -4.8
Id. with constant rate till year end -4.2
[1] Change (%) compared to same period previous year
Source: NBB, FPB
Source: NBB, FPB
92
94
96
98
100
102
104
106
108
110
92M1 93M1 94M1 95M1 96M1 97M125
27
29
31
33
35
37
39
Nominal effective exchange rate of BEF (left scale)Exchange rate of BEF vis-à-vis DEM,FRF,NLG (left scale)BEF per USD (right scale)
Source: NBB
20
20.5
21
21.5
22
92M1 93M1 94M1 95M1 96M1 97M15.6
5.7
5.8
5.9
6
6.1
6.2
6.3
BEF per DEM (left scale)
BEF per FRF (right scale)
18
RE
CE
NT
EC
ON
OM
IC E
VO
LU
TIO
N
Table 13 - Fiscal receipts (1)
Graph 26 - Real total fiscal receipts (2)
Graph 27 - Real withholding earned income tax (2)
Graph 28 - Real advance payments (2)
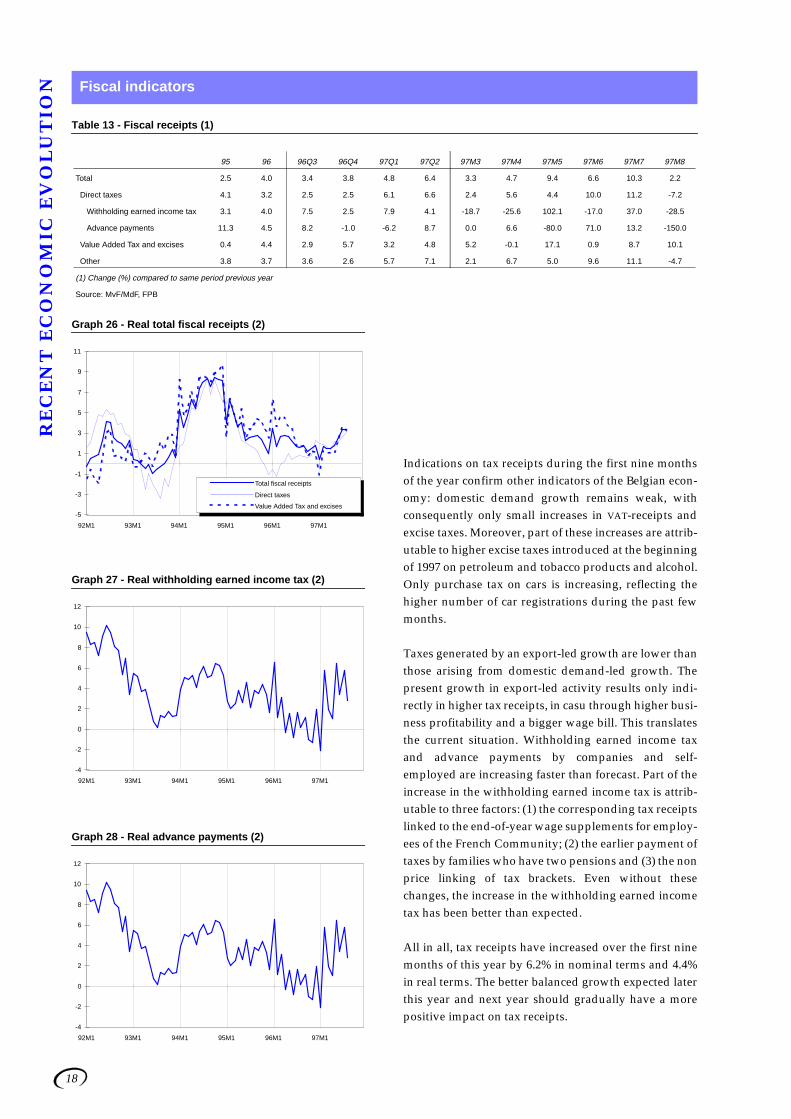
Indications on tax receipts during the first nine monthsof the year confirm other indicators of the Belgian econ-omy: domestic demand growth remains weak, withconsequently only small increases in VAT-receipts andexcise taxes. Moreover, part of these increases are attrib-utable to higher excise taxes introduced at the beginningof 1997 on petroleum and tobacco products and alcohol.Only purchase tax on cars is increasing, reflecting thehigher number of car registrations during the past fewmonths.
Taxes generated by an export-led growth are lower thanthose arising from domestic demand-led growth. Thepresent growth in export-led activity results only indi-rectly in higher tax receipts, in casu through higher busi-ness profitability and a bigger wage bill. This translatesthe current situation. Withholding earned income taxand advance payments by companies and self-employed are increasing faster than forecast. Part of theincrease in the withholding earned income tax is attrib-utable to three factors: (1) the corresponding tax receiptslinked to the end-of-year wage supplements for employ-ees of the French Community; (2) the earlier payment oftaxes by families who have two pensions and (3) the nonprice linking of tax brackets. Even without thesechanges, the increase in the withholding earned incometax has been better than expected.
All in all, tax receipts have increased over the first ninemonths of this year by 6.2% in nominal terms and 4.4%in real terms. The better balanced growth expected laterthis year and next year should gradually have a morepositive impact on tax receipts.
Fiscal indicators
95 96 96Q3 96Q4 97Q1 97Q2 97M3 97M4 97M5 97M6 97M7 97M8
Total 2.5 4.0 3.4 3.8 4.8 6.4 3.3 4.7 9.4 6.6 10.3 2.2
Direct taxes 4.1 3.2 2.5 2.5 6.1 6.6 2.4 5.6 4.4 10.0 11.2 -7.2
Withholding earned income tax 3.1 4.0 7.5 2.5 7.9 4.1 -18.7 -25.6 102.1 -17.0 37.0 -28.5
Advance payments 11.3 4.5 8.2 -1.0 -6.2 8.7 0.0 6.6 -80.0 71.0 13.2 -150.0
Value Added Tax and excises 0.4 4.4 2.9 5.7 3.2 4.8 5.2 -0.1 17.1 0.9 8.7 10.1
Other 3.8 3.7 3.6 2.6 5.7 7.1 2.1 6.7 5.0 9.6 11.1 -4.7
(1) Change (%) compared to same period previous year
Source: MvF/MdF, FPB
-5
-3
-1
1
3
5
7
9
11
92M1 93M1 94M1 95M1 96M1 97M1
Total fiscal receipts
Direct taxes
Value Added Tax and excises
-4
-2
0
2
4
6
8
10
12
92M1 93M1 94M1 95M1 96M1 97M1
-4
-2
0
2
4
6
8
10
12
92M1 93M1 94M1 95M1 96M1 97M1
19
SU
MM
AR
IES
Summaries
The evolution of the budgetary cost of an unemployedperson for the period 1983-1997 is presented. Unem-ployment implies budgetary costs not only due to unem-ployment benefits but also because of reduced socialsecurity contributions and tax losses as the conse-quence of a lower level of employment.
The losses in receipts taken into account are: social secu-rity contributions, direct income taxes (on unemploy-ment benefits and labour income) and indirect taxes onconsumption. Budgetary losses due to induced macro-economic effects - on employment, wages, ... - are notincluded in the estimation.
Compared with the former 1993 edition, importantmethodological changes have been made, by taking intoaccount the existing reductions in social security contri-butions and effective marginal income tax rates.
The budgetary cost of an unemployed person in 1997 is909 400 BEF, of which 43% is due to losses in social secu-rity contributions. The unemployment benefits compo-nent amounts to 32%; the losses in direct and indirect
taxes represent 25% of the budgetary cost of the unem-ployed.
Figures are also presented in constant prices. In realterms, the total budgetary cost of unemployed peopleincreased slightly (+ 7.4%) between 1983 and 1997, whilethe average unemployment benefit declined (- 7.7%).
The unemployment benefits, labour income and taxpressure used in the calculations are average values forthe whole economy and are therefore not appropriate tomeasure budgetary losses or gains produced by specificcases of job losses or creation respectively; the impactwill indeed depend very much on the characteristics ofthe labour market segment where the job losses or crea-tion occur.
Budgettaire kost van een werkloze van 1983 tot 1997, M.-J.Festjens, M. Lambrecht, L. Masure, S. Schüttringer, Plan-ning Paper 79, september 1997.Coût budgétaire d’un chômeur de 1983 à 1997, M.-J. Festjens,M. Lambrecht, L. Masure, S. Schüttringer, Planning Paper79, septembre 1997.
With the help of various Ministries and other public insti-tutions - notably the Ministry of Employment and theNational Institute of Statistics - the FPB regularly collectsdata about working time in Belgium, processing andusing these data in its modelling of the labour market.Detailed statistical information concerning the long termhistorical evolution of yearly working time is presented.The statistical data are up-dated yearly.
The first part of the study consists in a methodologicalintroduction and an analysis of the evolution of workingtime; the second part presents the statistical data, for theperiod 1955-95.
Three different kinds of data are presented.
• Yearly contractual working time by economic sectorfor blue- and white-collar workers. These statisticsare based on provisions made in collective bargain-ing agreements, and represent the legal standardagreed by social partners.
• Yearly effective working time. Long term historicaldata for blue-collar workers in manufacturingindustry, provided by the National Institute of Sta-tistics. Moreover, data provided by Eurostat, which
are based on the Labour Force Survey, concern allwage-earners but are only available since 1983 andprovide little detail as far as the sectorial desegrega-tion is concerned.
• Statistics on part-time work by economic sector. Itallows to calculate a yearly average contractualworking time which includes the effect of part-timework.
The data show that the contractual working time of afull-time worker fell by 25% between 1955 and 1995 andby 30% for an average (full-time/part-time) worker.Two sub-periods can be distinguished.
Before 1974-75, the average yearly working time fell rap-idly and almost exclusively on account of the reductionof the conventional working time for both white- andblue-collars in the whole economy. The evolution bene-fited from the synergy between macroeconomic per-formance and social progress, characterized by fullemployment, rapid productivity gains, strong wageincreases and rapid progress in living standards.
After 1975, poor macroeconomic performance resultedin a slackening of the pace of the reduction of conven-
Budgetary cost of an unemployed person, from 1983 to 1997
Forty years evolution of working time in Belgium

20
SU
MM
AR
IES tional working time, which has practically stabilized
since the beginning of the eighties.
Since then reductions in working time have been due tothe progress of part-time labour and concern almostexclusively female workers in the market services sec-tor. Working time reduction policy has come to be seenas a means of distributing available labour.
Quarante années d’évolution de la durée du travail enBelgique, K. Hendrickx, L. Masure, S. Schüttringer, Plan-ning Paper 80, septembre 1997.Veertig jaar evolutie van arbeidsduur in België, K. Hendrickx,L. Masure, S. Schüttringer, Planning Paper 80, september1997.
Under the Non-Nuclear Energy Programme Joule III ofthe DGXII of the European Commission, five Europeanteams collaborate on the construction of an Energy-Environment-Economy Model for Europe (E3ME). E3ME
is a multi-sector, multi-country model which provides aframework for the evaluation of policies promoting sus-tainable energy use. This Working Paper presents partof the contribution of the FPB to the E3ME project.
The Working Paper presents an econometric modeldescribing household demand for consumer goods in 11European countries. The model describes how totalaggregate consumption is allocated over its differentcomponents as a function of predetermined prices, totalincome, and demographic changes. The starting point ofthe modelling strategy is the assumption that thereexists a long run equilibrium, but that rigidities preventimmediate adjustment to this long run equilibrium.First, a specification of the long run equilibrium is pre-sented. Here the CBS version of an econometric alloca-tion system is introduced, which explains quantities interms of a scale effect and relative prices, and whichallows us to impose the various restrictions derivedfrom the theory of rational consumer behaviour in a
rather flexible way. Next, an error correction mecha-nism for our allocation problem is derived, and someeconometric issues estimating this error correctionmechanism are discussed, i.e., imposing the negativitycondition, the Two-Step Engle-Granger estimator andgroupwise separability.
In the empirical section the point estimates of the overalllong and short run income elasticities and overall longand short run compensated and uncompensated ownprice elasticities are shown for 11 European countries.The results indicate, for example, that, taking the aver-age of the 11 countries, the income elasticities of furni-ture and transport equipment are highest, while theoverall long run income elasticity of recreation is lowest.Most of the overall compensated and uncompensatedlong run own price elasticities are situated between -0.5and -1.0. On average, the compensated own price elas-ticity is the lowest (i.e. closest to zero) for food, expend-iture in restaurants and cafes, clothing, rent, and therunning of transport equipment.
Specification and estimation of an allocation system for pri-vate consumption in Europe, I. Bracke, E. Meyermans, Work-ing Paper 3-97, October 1997.
The Working Paper analyses the impact, from a micro-and macroeconomic point of view, of the introduction ofthe "Rocard proposal" on the Belgian economy.
This proposal aims at encouraging employers andemployees to reduce their working time by cuttingemployers’ social security contributions in respect of thefirst 32 hours worked per week and by increasing con-tributions on the remaining ones. The originality of theproposal lies in its flexibility, which enables workingtime to be reduced on an individual basis, and on thelump-sum aspect of the reduction in contributions,which favours lower skilled workers.
Starting from two constraints (no increase in unit labourcost and 1% decrease in gross income for employeesabove the minimum wage), the authors have built amicroeconomic model which makes it possible to calcu-late for each wage level the optimal working time reduc-tion and the increase in hourly gross salary. For workersreceiving the minimum wage or less, working time isreduced to 32 hours per week without loss of revenue,and for employees above this minimum wage, workingtime reductions become smaller with increases in wagelevels.
Applied to Belgian sectorial data on salary distribution,the model gives the following results: working time isreduced by 3.2% and employment increases by 3%
Specification and estimation of an allocation system for private consumption in Europe.
The Rocard proposal to reduce working hours: a micro-macro analysis

21
SU
MM
AR
IES
(which means some 71,000 new jobs after 7 years). Whenthe overall macroeconomic effects are taken intoaccount some 8,000 extra jobs could be generated. GDP isslightly higher (+0.1%) and prices increase only margin-ally (+0.1%). The total cost for the public finances is esti-mated at about 60 billion BEF, which means a cost of750,000 BEF per job created. However, some practicalproblems could arise when the system is implemented:
difficulties for firms in managing individual workinghours and difficulties for the authorities to verify worktime declarations (risk of fraud).
La proposition Rocard de réduction du temps de travail: uneévaluation micro-macro, T. Bréchet, I. Lebrun., Working Pa-per 4-97, novembre 1997.
The motives for and consequences of internationalisa-tion and globalisation for the Belgian economy are ana-lysed using six different approaches. The first one isbased on a detailed examination of the inflow and out-flow of foreign direct investment (FDI), and outsourcingdata from the balance of payments, giving an insightinto the evolution of FDI importance and of host andguest-countries.
The second approach is mainly based on a new surveysent to foreign subsidiaries of Belgian firms, with thehelp of Belgian embassies. The information gatheredmakes an assessment of the types of Belgian firmsabroad, differentiating between: "relocation in the strictsense" (i.e. the destruction of activities in Belgium),“expansion”, “diversification”, and “presence inherentin activities or local distribution”.
Third, using the same sources, the reasons for Belgianinvestments abroad are investigated.
A fourth approach consists in studying the degree towhich the import penetration by economic sector islinked to the transfer of specific activities to foreigncountries.
A fifth approach links recent data on gross and net jobcreation and losses in Belgium to the degree of importpenetration and risk of relocation in different sectors.
A sixth approach based on a questionnaire sent out tothe main trade unions in each instance of mass redun-dancies, tries to establish the link between redundanciesand the transfer of activities to foreign countries. About20% of the mass redundancies in Belgium are linked tothe transfer of activities to a foreign country.
Some of the main conclusions of the study are the fol-lowing.
• Relocation in the strict sense (i.e. the destruction ofactivities in Belgium) remains limited to 10% of Bel-gian firms abroad. This percentage, however,increases in certain countries and in certain indus-trial sectors.
• Foreign affiliates of Belgian firms are mainly situ-ated in Western Europe. Recently, however, Central-and Eastern European countries have gained inimportance. Belgian direct investments in emergingcountries in the Far East and Central- and SouthAmerica are extremely limited.
• Sixty-five percent of the sectors involved in the glo-balisation belong to the service sector. Some Belgianindustrial segments could be considered sensitive toimports from low-wage countries. Others, reactingto international competition, were obliged to reduceemployment levels in order to improve productiv-ity, or had to relocate or subcontract abroad.
• Low-priced "job-threatening" imports from fourselected world-relocation zones, only account for7.6% of total industrial imports and moreover theBelgian trade balance with these zones is positiveand growing.
• The motive for direct investment in a foreign coun-try remains mainly market-driven and is not prima-rily a result of high wage-costs in Belgium. On theother hand, relocation in the strict sense is muchmore affected by high wage cost differentials.Motives such as "advantages in guest-countries""competitive devaluations" and "environmental reg-ulations" are obviously of minor importance.
• The inflow of FDI in Belgium remains more impor-tant than the outflow. French companies in Belgiumfollowed by Americans are the biggest job providers.Productivity at foreign affiliates in Belgium is higherthan in Belgian firms and is growing faster.
Delokalisatie - Mondialisering, een actualisatierapport overBelgië, P. Bernard, H. Van Sebroeck,H. Spinnewyn, P. Vandenhove, B. Van Den Cruyce, 1997.Delocalisation - Mondialisation, un rapport d’actualisationconcernant la Belgique, P. Bernard, H.Van Sebroeck,H. Spinnewyn, P. Vandenhove, B. Van Den Cruyce, 1997.
Relocation and internationalisation
22
NE
WS
News
Medium Term Economic Outlook 1997-2001, April 1997(available in Dutch and in French).
Economic Forecasts 1998, July 1997(available in Dutch and in French).
Planning Paper 78, September 1996.Bossier F., Englert M., Streel C., “Effets macroé-conomiques de diverses modalités d’accroissement des re-cettes et de réduction des dépenses des administrationspubliques”- “De macro-economische impact van diversemodaliteiten betreffende de verhoging van de ontvangstenen de daling van de overheidsuitgaven”.
Working Paper 1-97, February 1997.Lebrun I., Masure L., “Loi de Robien” - Effets macro-économiques et budgétaires d’une application en Belgique.
Working Paper 2-97, June 1997.Hendrickx K., Hertveldt B., Masure L.: “Doorlichtingvan verscheidene alternatieven ter herformulering van deMARIBEL - bijdrageverminderingen”.
First national communication of Belgium in accordance with ar-
ticles 4 and 12 of the United Nations Framework Conven-
Climate Change, January 1997. Ministry of Social
Affairs, Public Health and Environment.
Financing the Social security system in the long run, Decem-ber 1997. Long term financial prospects for the Bel-gian Social security system are presented, takingnew demographic projections and the pension re-form for the private sector into account. A sensitivityanalysis of demographic, macroeconomic and socialpolicy variables is included.
Demographic prospects 1996-2050, December 1997. Thisstudy focuses on the evolution of fertility rates, lifeexpectancy, migration flows and dependency ratesfrom 1950 to 2050. Alternative scenarios are dis-cussed.
Long term implications of the pension reform on social security
schemes, December 1997. The pension reform decid-ed in 1996 concerns wage-earners and independentworkers. The rules for calculating new pensions aremodified. Long term financial implications for thedifferent branches of the Belgian Social security sys-tem are analysed.
(These three studies will be presented during the two-dayConference of December 2 and 3. See "forthcomingevents").
Modelling the Essen Employment Priorities, January 1998(funded by the European Commission). Using themacrosectorial and international model HERMES-LINK, policy measures corresponding to the so-called"Essen Employment Priorities" are tested for Bel-
gium, France and Germany. The analysis focuses onthe macroeconomic consequences of labour cost re-duction policies.
The supply-side of the Belgian economy, January 1998. Themacroeconomic factors determining the supply ofproduction factors and of goods and services in theBelgian economy are scrutinized. The determinationof employment, investment and prices and wages isdiscussed. Comparisons with other European econ-omies are made.
ExternE project: case study, December 1997. Project fund-ed by the European Commission. A methodologyfor quantifying external environmental costs for dif-ferent fuel cycles in electricity generation is present-ed. The objective of the small policy case studyelaborated by the FPB was to provide some insightinto ExternE damage costs for the Belgian electricitysector in relation to the structuring of electricity tax-es.
The sustainable development project: five years after the Earth
Summit: Five years after RIO, December 1997. Thisstudy looks at progress made in the project of sus-tainable development on an international basis. Thepurpose is to inform the public authorities, politi-cians as well as the general public about the ´globalapproach’ notion. The study is based on informationregarding the evolution of the Action 21 programmefor sustainable development.
The financing of social expenditure in the long run. The FPB isorganising a two-day Conference on demographicchanges and social expenditure in the long term.Calculations by the FPB have been made using new
demographic projections and the pension reform.The Conference will take place on December 2 and 3,1997, in Brussels.
Recent Publications
Forthcoming Publications
Forthcoming Events
23
EC
ON
OM
IC P
OL
ICY
ME
AS
UR
ES
Economic Policy Measures
Recent history of major economic policy measures
October 1997The 1998-Budget was presented to the Parliament. Employers' contributions are to be cut by a further 6billion BEF in 1998, and by 12 billion in 1999. The Justice Department is to receive an extra 4 billion BEF.Three one-off receipts: 8 billion from a third telephone operator; 2.4 billion from pharmaceutical compa-nies and 1.5 billion from electricity producers.
July 1997• Changes in the pension system for the private sector were introduced. Men and women will gradually
be treated equally in the calculation of their pension. Consequently, the legal retirement age for femaleworkers will rise to 65. Anticipated retirement between 60 and 65 will henceforth only be allowed toworkers with a career of minimum 20 years. This condition will be progressively increased to 35 yearsin 2005. A minimum pension right for every year worked was also introduced. The savings for gov-ernment of these changes are evaluated by the FPB to be limited in the near future but will amount to0.25% of GDP in 2010.
• The EU-Amsterdam Summit extended the “Stability and Growth Pact” to include an employmentchapter. Countries with budget deficits above 3% of GDP could receive fines between 0.2% and 0.5%of GDP unless there are exceptional circumstances (e.g. an economic recession).
• The Federal Government extended and changed the criteria for Maribel: reduction of employers’ so-cial security contributions are based on the ́ blue-collar intensityª of each company; the total reductionof contributions is increased from 18 to 25 billion.
December 1996 The Federal Government decided that the maximum increase of the wage cost rate (per hour) would be6.1% over 1997-98, as the Social partners were unable to reach an agreement earlier.
October 1996 The Federal budget 1997 was presented to Parliament. The major measures were:
• Increase in excise taxes on petroleum and tobacco products and alcohol - expected impact (excise taxesand VAT on excise taxes included): 1.2 billion in 96 and 13.2 billion in 97-;
• Non-indexation of tax brackets in 97 and 98 - expected impact: 5.4 billion BEF in 97-.
• Taxes on the delivery of financial products - expected impact: 4 billion BEF in 97-.
August 1996 Three framework laws gave the Government extensive powers to encourage employment and competi-tiveness, as well as in the area of budgetary policy with a view to joining EMU and modernising the socialsecurity system. One of the laws defined a wage norm providing for a minimum and maximum increaseof the hourly compensation.
October 1995 Federal Budget 1996 was presented with the main measures as follows:
• Excise taxes on petroleum products were increased (expected impact: 8.6 billion in 96, VAT included);
• The 20.5% VAT rate was increased to 21% (expected impact: 12 billion in 1996) from January 96 on-wards;
• "Tax" on diesel cars (expected impact: 8 billion in 1996);
• The withholding tax rate was increased to 15% from January 1996 onwards (after increases from 10%- see January 90 - to 10.3% in July 1993 and 13.39% in the beginning of 1994);
• Extension of the number of "low paid workers" entitled to benefit from lower social security contribu-tions to workers with a gross wage of up to 60,000 BEF per month (applied from April 96 onwards).
Januari 1994 The 19.5% VAT rate was increased to 20.5%. Excise duties on petroleum and tobacco products were alsoincreased.
November 1993 The Federal Government presented its 'Global plan'. The main measures were as follows:
• A new price-index was defined (the so-called 'health-index') as the CPI excluding: petroleum and to-bacco products, alcohol and a new tax on household energy consumption. This price index would beused to link wages, house rents and social expenditure to prices;
• A real wage-freeze in 1995-96;
• Increase in indirect taxes (see January 1994);
• Reduction of social security contributions.
August 1993 • The EMS fluctuation bands were widened.
• Reduction of employers contributions to social security in the "open sector" (so-called Maribel bis).
• Several measures to encourage employment by reducing employers contributions to social security(e.g. the "Youth employment plan" - August 93 -, a measure aimed at low wage earners, leading to areduction of labour costs by up to 12% for the lowest paid employees - April 94- and the “Advantageplan” - January 95 -.)
April 1992 VAT rates were aligned with EU norms
June 1990 The National Bank of Belgium announced that the BEF would be more closely linked with the stronger cur-rencies of the EMS.
January 1990 The withholding tax rate on fixed income investments was reduced from 25% to 10% from March 90 on-wards.

24
AB
BR
EV
IAT
ION
SAbbreviations
Abbreviations for names of institutions used in this publication
BLEU/UEBL Belgisch-Luxemburgse Economische Unie / Union Economique Belgo-Luxembourgeoise
DULBEA Département d’Economie Appliquée de l’Université Libre de Bruxelles
FEBIAC Fédération Belge des Industries de l'Automobile et du Cycle "reunies"
FMTA/MfET Federaal Ministerie van Tewerkstelling en Arbeid / Ministère fédéral de l’Emploi et du Travail
FPB Federal Planning Bureau
IMF International Monetary Fund
INR/ICN Instituut voor de Nationale Rekeningen / Institut des Comptes Nationaux
IRES Université Catholique de Louvain - Institut de Recherches Economiques et Sociales
IWH Institut für Wirtschaftsforschung Hamburg
MEZ/MAE Ministerie van Economische Zaken / Ministère des Affaires Economiques
MvF/MdF Ministerie van Financiën / Ministère des Finances
NBB National Bank of Belgium
NIS/INS Nationaal Instituut voor de Statistiek / Institut National de Statistique
OECD Organisation for Economic Cooperation and Development
RSZ/ONSS Rijksdienst voor Sociale Zekerheid / Office national de la Sécurité Sociale
RVA/ONEm Rijksdienst voor Arbeidsvoorziening / Office National de l’Emploi
Other Abbreviations
BEF Belgian Franc
BoP Balance of Payments
CPI Consumer Price Index
DEM Deutsche Mark
ECU European Currency Unit
EMS European Monetary System
EMU European Monetary Union
FRF French Franc
GDP Gross Domestic Product
OLO Obligations linéaires / Lineaire obligaties
s.a. seasonally adjusted
t/t-4 growth rate between present quarter and the corresponding quarter previous year
t/t-12 growth rate between present month and the corresponding month previous year
UKP United Kingdom Pound
USD United States Dollar
VAT Value Added Tax