quarterly investment report - 80237
TRANSCRIPT

Quarterly Investment Report - 80237For the Period 01 Apr 2021 to 30 Jun 2021
Middlesbrough Borough Council
Middlesbrough Borough Council
Report ID: 2981631.1 Published: 12 Jul 2021

Table of Contents
Accounting Summary. 1 Performance Summary. 2 Passive Equity Portfolio 4
Europe ex UK ESG Screened Index Equity Sub-Fund 4
North America ESG Screened Index Equity Sub-Fund 7
Japan ESG Screened Index Equity Sub-Fund 10
Asia Pacific ex Japan ESG Screened Index Equity Sub-Fund 13 Relationship Management Team 16 Important Information 17
Quarterly Investment Report - 80237As of 30 Jun 2021Middlesbrough Borough Council

Accounting Summary (expressed in GBP) As of 30 Jun 2021
Middlesbrough Borough CouncilMarket Value 01 Apr 2021 Contributions Withdrawals Change in Market Value
Market Value 30 Jun 2021
Passive Equity Portfolio
North America ESG Screened Index Equity Sub-Fund
467,716,328 37.86% 0 441,148,868 9,515,679 36,083,139 5.86%
Europe ex UK ESG Screened Index Equity Sub-Fund
207,819,269 16.82% 0 95,396,731 12,279,611 124,702,149 20.26%
Japan ESG Screened Index Equity Sub-Fund 108,265,619 8.76% 0 0 (624,889) 107,640,730 17.49%
Asia Pacific ex Japan ESG Screened Index Equity Sub-Fund
451,647,945 36.56% 0 123,454,401 18,977,779 347,171,324 56.40%
Total 1,235,449,161 100.00% 0 660,000,000 40,148,181 615,597,342 100.00%
Page 1 of 20
Quarterly Investment Report - 80237As of 30 Jun 2021Middlesbrough Borough Council
State Street Global Advisors Report ID: 2981631.1 Published: 12 Jul 2021

Performance Summary (expressed in GBP) As of 30 Jun 2021
Middlesbrough Borough Council1 Month 3 Months YTD 1 Year 3 Years 5 Years 10 Years Inception
Passive Equity Portfolio
North America ESG Screened Index Equity Sub-Fund 21 Sep 2018
Total Returns 5.72% 8.80% 13.96% 27.36% N/A N/A N/A 15.80%
FTSE NORTH AMERICA EX CONTROVERSIES EX CW INDEX
5.69% 8.71% 13.71% 27.05% N/A N/A N/A 15.65%
Difference 0.03% 0.09% 0.25% 0.31% N/A N/A N/A 0.15%
Total Returns (Net) 5.72% 8.80% 13.95% 27.34% N/A N/A N/A N/A
FTSE NORTH AMERICA EX CONTROVERSIES EX CW INDEX
5.69% 8.71% 13.71% 27.05% N/A N/A N/A N/A
Difference 0.03% 0.09% 0.24% 0.29% N/A N/A N/A N/A
Europe ex UK ESG Screened Index Equity Sub-Fund 26 Sep 2018
Total Returns 1.76% 8.30% 10.98% 22.60% N/A N/A N/A 9.16%
FTSE DEVELOPED EUROPE EX UK EX CONTROVERSIES EX CW INDEX
1.75% 8.13% 10.75% 22.54% N/A N/A N/A 9.16%
Difference 0.01% 0.17% 0.23% 0.06% N/A N/A N/A 0.00%
Total Returns (Net) 1.76% 8.30% 10.97% 22.58% N/A N/A N/A N/A
FTSE DEVELOPED EUROPE EX UK EX CONTROVERSIES EX CW INDEX
1.75% 8.13% 10.75% 22.54% N/A N/A N/A N/A
Difference 0.01% 0.17% 0.22% 0.04% N/A N/A N/A N/A
Japan ESG Screened Index Equity Sub-Fund 01 Jun 2001
Total Returns 2.62% -0.58% 0.57% 11.81% 5.67% 9.84% 9.27% 4.41%
FTSE JAPAN EX CONTROVERSIES EX CW INDEX
2.61% -0.61% 0.36% 11.57% 5.58% 9.79% 9.24% 4.27%
Difference 0.01% 0.03% 0.21% 0.24% 0.09% 0.05% 0.03% 0.14%
Page 2 of 20
Quarterly Investment Report - 80237As of 30 Jun 2021Middlesbrough Borough Council
State Street Global Advisors Report ID: 2981631.1 Published: 12 Jul 2021

Middlesbrough Borough Council1 Month 3 Months YTD 1 Year 3 Years 5 Years 10 Years Inception
Total Returns (Net) 2.62% -0.58% 0.57% 11.80% N/A N/A N/A N/A
FTSE JAPAN EX CONTROVERSIES EX CW INDEX
2.61% -0.61% 0.36% 11.57% N/A N/A N/A N/A
Difference 0.01% 0.03% 0.21% 0.23% N/A N/A N/A N/A
Asia Pacific ex Japan ESG Screened Index Equity Sub-Fund 01 Jun 2001
Total Returns 2.32% 4.86% 7.66% 29.05% 9.05% 11.91% 7.66% 10.35%
FTSE DEVELOPED ASIA PACIFIC EX JAPAN EX CONTROVERSIES EX CW INDEX
2.38% 4.88% 7.74% 29.12% 9.04% 11.88% 7.64% 10.29%
Difference -0.06% -0.02% -0.08% -0.07% 0.01% 0.03% 0.02% 0.06%
Total Returns (Net) 2.32% 4.85% 7.65% 29.03% N/A N/A N/A N/A
FTSE DEVELOPED ASIA PACIFIC EX JAPAN EX CONTROVERSIES EX CW INDEX
2.38% 4.88% 7.74% 29.12% N/A N/A N/A N/A
Difference -0.06% -0.03% -0.09% -0.09% N/A N/A N/A N/A
For information regarding performance data, including net performance data, please refer to the section entitled "Important Information" at the end of the report.
Page 3 of 20
Quarterly Investment Report - 80237As of 30 Jun 2021Middlesbrough Borough Council
State Street Global Advisors Report ID: 2981631.1 Published: 12 Jul 2021

R-FactorTM Summary As of 30 Jun 2021
Europe ex UK ESG Screened Index Equity Sub-Fund
Benchmark: FTSE DEVELOPED EUROPE EX UK EX CONTROVERSIES EX CW INDEX
R-Factor Summary Fund Benchmark DifferenceR-Factor 71.86 71.87 -0.01ESG 72.68 72.69 -0.01Corporate Governance 44.11 44.12 -0.01Source: SSGA. Holdings as of 30 Jun 2021, R-Factor data as of 31 May 2021.
What is R-Factor?R-FactorTM is built off a transparent scoring methodology that leverages the Sustainability Accounting Standards Board (SASB) Materiality Map, corporate governance codes, and inputs from four best-inclass ESG data providers. R-Factor supports the development of sustainable capital markets by giving investors the ability to invest in solutions that integrate financially material ESG data while incentivizing companies to improve their ESG practices and disclosure in areas that matter.
Fund Coverage Count Percent of Total
Securities
Percent of Total Market Value
R-Factor Securities Coverage 442 98.88% 99.81%Total Number of Securities in Portfolio 447Source: Factset/SSGA. Holdings as of 30 Jun 2021, R-Factor data as of 31 May 2021.
Fund R-Factor Profile
Not Available 0.19%
Laggard 0.18%
Underperformer 1.30%
Average Performer 9.53%
Outperformer 24.25%
Leader 64.55%
Source: Factset/SSGA. Holdings as of 30 Jun 2021, R-Factor data as of 31 May 2021.
Top 10 Positions Fund Weight Benchmark Weight
Difference R-Factor Rating
Nestle S.A. 4.20% 4.20% -0.01% 87.43ASML Holding NV 3.25% 3.25% -0.01% 76.95Roche Holding Ltd 3.23% 3.13% 0.10% 66.24LVMH Moet Hennessy Louis... 2.34% 2.34% 0.00% 79.02SAP SE 1.87% 1.87% 0.00% 82.69Novo Nordisk A/S Class B 1.63% 1.62% 0.01% 73.46Siemens AG 1.43% 1.42% 0.01% 76.60Sanofi 1.36% 1.36% 0.00% 81.58TotalEnergies SE 1.31% 1.31% -0.01% 77.26L'Oreal SA 1.29% 1.28% 0.01% 89.98Source: Factset/SSGA. Holdings as of 30 Jun 2021, R-Factor data as of 31 May 2021.
Top 5 R-Factor RatingsUnibail-Rodamco-Westfield... 0.14% 0.14% 0.00% 97.22Covivio SA 0.05% 0.05% 0.00% 94.16Henkel AG & Co. KGaA 0.11% 0.11% 0.00% 93.64Henkel AG & Co. KGaA Pref 0.22% 0.22% 0.00% 93.64Industria de Diseno Textil S.... 0.44% 0.44% 0.00% 93.16Source: Factset/SSGA. Holdings as of 30 Jun 2021, R-Factor data as of 31 May 2021.
Bottom 5 R-Factor RatingsSofina SA 0.08% 0.08% 0.00% 26.94EXOR N.V. 0.10% 0.10% 0.00% 27.20CTS Eventim AG & Co. KGa... 0.05% 0.04% 0.00% 32.42EMS-CHEMIE HOLDING AG 0.09% 0.08% 0.00% 32.98PSP Swiss Property AG 0.07% 0.07% 0.00% 33.60Source: Factset/SSGA. Holdings as of 30 Jun 2021, R-Factor data as of 31 May 2021.
The R-Factor summary reflects certain ESG characteristics only, and does not reflect the portfolio’s performance. Certain instruments such as cash & derivatives are excluded. ESG analytics data reported on a one month lag relative to monthly performance reporting period. Please see Important Information section for more information and definitions of the ESG Metrics presented.
Page 4 of 20
Quarterly Investment Report - 80237As of 30 Jun 2021Middlesbrough Borough Council
State Street Global Advisors Report ID: 2981631.1 Published: 12 Jul 2021

Climate Profile As of 30 Jun 2021
Europe ex UK ESG Screened Index Equity Sub-Fund
Benchmark: FTSE DEVELOPED EUROPE EX UK EX CONTROVERSIES EX CW INDEX
Carbon Intensity
Source: SSGA Holdings as of 30 Jun 2021. Trucost data as of 31 May 2021.
Scope 1+2 Carbon Emissions
Source: SSGA Holdings as of 30 Jun 2021. Trucost data as of 31 May 2021.
Weighted Average Carbon Intensity
Source: SSGA Holdings as of 30 Jun 2021. Trucost data as of 31 May 2021.
Total Reserves Carbon Emissions
Source: SSGA Holdings as of 30 Jun 2021. Trucost data as of 31 May 2021.
Page 5 of 20
Quarterly Investment Report - 80237As of 30 Jun 2021Middlesbrough Borough Council
State Street Global Advisors Report ID: 2981631.1 Published: 12 Jul 2021

Stewardship Profile As of 30 Jun 2021
Europe ex UK ESG Screened Index Equity Sub-Fund
Benchmark: FTSE DEVELOPED EUROPE EX UK EX CONTROVERSIES EX CW INDEX
Stewardship Profile Q1 2021
Number of Meetings Voted 469
Number of Countries 14
Management Proposals 1,591
Votes for 91.89%
Votes Against 8.11%
Shareholder Proposals 36
With Management 88.89%
Against Management 11.11%
Source: SSGA as of 31 Mar 2021
Figures are based on State Street Global Advisors’ general approach to voting at the companies held by the Fund at quarter end. This information is not a substitute for a proxy voting report, which can be requested through your relationship manager.
State Street Global Advisors' (SSGA) asset stewardship program is aimed at engaging with our portfolio companies on issues that impact long-term value creation across environmental, social and governance (ESG) considerations. In the recent past, SSGA has issued extensive guidance on key governance matters such as effective, independent board leadership. SSGA's current focus is on helping boards think about the possible impacts of environmental and social issues and incorporating a sustainability lens into boards' oversight of long-term strategy as a sound business practice.
Gender Diversity
Women on Board Number of Securities
0 10
1 27
2 59
3 92
4 83
5 66
6 56
7 33
8 10
9 8
10 2
10+ 1
Not Available 0
Total 447
Source: Factset/SSGA. Holdings as of 30 Jun 2021, Factset data as of 31 May 2021.
Page 6 of 20
Quarterly Investment Report - 80237As of 30 Jun 2021Middlesbrough Borough Council
State Street Global Advisors Report ID: 2981631.1 Published: 12 Jul 2021

R-FactorTM Summary As of 30 Jun 2021
North America ESG Screened Index Equity Sub-Fund
Benchmark: FTSE NORTH AMERICA EX CONTROVERSIES EX CW INDEX
R-Factor Summary Fund Benchmark DifferenceR-Factor 63.60 63.55 0.05ESG 62.23 62.18 0.05Corporate Governance 64.24 64.17 0.07Source: SSGA. Holdings as of 30 Jun 2021, R-Factor data as of 31 May 2021.
What is R-Factor?R-FactorTM is built off a transparent scoring methodology that leverages the Sustainability Accounting Standards Board (SASB) Materiality Map, corporate governance codes, and inputs from four best-inclass ESG data providers. R-Factor supports the development of sustainable capital markets by giving investors the ability to invest in solutions that integrate financially material ESG data while incentivizing companies to improve their ESG practices and disclosure in areas that matter.
Fund Coverage Count Percent of Total
Securities
Percent of Total Market Value
R-Factor Securities Coverage 640 98.92% 99.86%Total Number of Securities in Portfolio 647Source: Factset/SSGA. Holdings as of 30 Jun 2021, R-Factor data as of 31 May 2021.
Fund R-Factor Profile
Not Available 0.14%
Laggard 2.56%
Underperformer 4.86%
Average Performer 16.50%
Outperformer 37.74%
Leader 38.20%
Source: Factset/SSGA. Holdings as of 30 Jun 2021, R-Factor data as of 31 May 2021.
Top 10 Positions Fund Weight Benchmark Weight
Difference R-Factor Rating
Apple Inc. 5.57% 5.56% 0.01% 85.70Microsoft Corporation 5.30% 5.28% 0.02% 73.68Amazon.com Inc. 3.88% 3.86% 0.02% 65.35Facebook Inc. Class A 2.17% 2.15% 0.02% 58.91Alphabet Inc. Class A 1.92% 1.90% 0.02% 58.54Alphabet Inc. Class C 1.84% 1.84% 0.00% 58.54Tesla Inc 1.37% 1.36% 0.00% 62.42NVIDIA Corporation 1.24% 1.24% 0.00% 77.65JPMorgan Chase & Co. 1.22% 1.21% 0.01% 72.52Visa Inc. Class A 1.03% 1.02% 0.01% 71.45Source: Factset/SSGA. Holdings as of 30 Jun 2021, R-Factor data as of 31 May 2021.
Top 5 R-Factor RatingsHP Inc. 0.10% 0.10% 0.01% 100Cisco Systems Inc. 0.59% 0.58% 0.01% 96.24Host Hotels & Resorts Inc. 0.03% 0.03% 0.00% 89.53Ball Corporation 0.07% 0.07% 0.00% 89.32Accenture Plc Class A 0.48% 0.48% -0.01% 87.73Source: Factset/SSGA. Holdings as of 30 Jun 2021, R-Factor data as of 31 May 2021.
Bottom 5 R-Factor RatingsLennar Corporation Class A 0.07% 0.07% 0.00% 9.52Lennar Corporation Class B 0.00% 0.00% 0.00% 9.52Roku Inc. Class A 0.13% 0.14% -0.01% 11.26Constellation Software Inc. 0.07% 0.07% 0.00% 12.12D.R. Horton Inc. 0.08% 0.08% 0.00% 13.25Source: Factset/SSGA. Holdings as of 30 Jun 2021, R-Factor data as of 31 May 2021.
The R-Factor summary reflects certain ESG characteristics only, and does not reflect the portfolio’s performance. Certain instruments such as cash & derivatives are excluded. ESG analytics data reported on a one month lag relative to monthly performance reporting period. Please see Important Information section for more information and definitions of the ESG Metrics presented.
Page 7 of 20
Quarterly Investment Report - 80237As of 30 Jun 2021Middlesbrough Borough Council
State Street Global Advisors Report ID: 2981631.1 Published: 12 Jul 2021

Climate Profile As of 30 Jun 2021
North America ESG Screened Index Equity Sub-Fund
Benchmark: FTSE NORTH AMERICA EX CONTROVERSIES EX CW INDEX
Carbon Intensity
Source: SSGA Holdings as of 30 Jun 2021. Trucost data as of 31 May 2021.
Scope 1+2 Carbon Emissions
Source: SSGA Holdings as of 30 Jun 2021. Trucost data as of 31 May 2021.
Weighted Average Carbon Intensity
Source: SSGA Holdings as of 30 Jun 2021. Trucost data as of 31 May 2021.
Total Reserves Carbon Emissions
Source: SSGA Holdings as of 30 Jun 2021. Trucost data as of 31 May 2021.
Page 8 of 20
Quarterly Investment Report - 80237As of 30 Jun 2021Middlesbrough Borough Council
State Street Global Advisors Report ID: 2981631.1 Published: 12 Jul 2021

Stewardship Profile As of 30 Jun 2021
North America ESG Screened Index Equity Sub-Fund
Benchmark: FTSE NORTH AMERICA EX CONTROVERSIES EX CW INDEX
Stewardship Profile Q1 2021
Number of Meetings Voted 617
Number of Countries 7
Management Proposals 556
Votes for 92.45%
Votes Against 7.55%
Shareholder Proposals 16
With Management 87.50%
Against Management 12.50%
Source: SSGA as of 31 Mar 2021
Figures are based on State Street Global Advisors’ general approach to voting at the companies held by the Fund at quarter end. This information is not a substitute for a proxy voting report, which can be requested through your relationship manager.
State Street Global Advisors' (SSGA) asset stewardship program is aimed at engaging with our portfolio companies on issues that impact long-term value creation across environmental, social and governance (ESG) considerations. In the recent past, SSGA has issued extensive guidance on key governance matters such as effective, independent board leadership. SSGA's current focus is on helping boards think about the possible impacts of environmental and social issues and incorporating a sustainability lens into boards' oversight of long-term strategy as a sound business practice.
Gender Diversity
Women on Board Number of Securities
0 1
1 33
2 150
3 230
4 146
5 57
6 20
7 5
8 2
9 0
10 0
10+ 0
Not Available 3
Total 647
Source: Factset/SSGA. Holdings as of 30 Jun 2021, Factset data as of 31 May 2021.
Page 9 of 20
Quarterly Investment Report - 80237As of 30 Jun 2021Middlesbrough Borough Council
State Street Global Advisors Report ID: 2981631.1 Published: 12 Jul 2021

R-FactorTM Summary As of 30 Jun 2021
Japan ESG Screened Index Equity Sub-Fund
Benchmark: FTSE JAPAN EX CONTROVERSIES EX CW INDEX
R-Factor Summary Fund Benchmark DifferenceR-Factor 60.59 60.58 0.01ESG 58.95 58.93 0.02Corporate Governance 66.30 66.29 0.01Source: SSGA. Holdings as of 30 Jun 2021, R-Factor data as of 31 May 2021.
What is R-Factor?R-FactorTM is built off a transparent scoring methodology that leverages the Sustainability Accounting Standards Board (SASB) Materiality Map, corporate governance codes, and inputs from four best-inclass ESG data providers. R-Factor supports the development of sustainable capital markets by giving investors the ability to invest in solutions that integrate financially material ESG data while incentivizing companies to improve their ESG practices and disclosure in areas that matter.
Fund Coverage Count Percent of Total
Securities
Percent of Total Market Value
R-Factor Securities Coverage 480 95.05% 98.73%Total Number of Securities in Portfolio 505Source: Factset/SSGA. Holdings as of 30 Jun 2021, R-Factor data as of 31 May 2021.
Fund R-Factor Profile
Not Available 1.27%
Laggard 2.38%
Underperformer 9.61%
Average Performer 21.14%
Outperformer 42.42%
Leader 23.18%
Source: Factset/SSGA. Holdings as of 30 Jun 2021, R-Factor data as of 31 May 2021.
Top 10 Positions Fund Weight Benchmark Weight
Difference R-Factor Rating
Toyota Motor Corp. 4.86% 4.86% -0.01% 66.60Sony Group Corporation 2.74% 2.72% 0.01% 82.20SoftBank Group Corp. 2.15% 2.15% 0.00% 56.97Keyence Corporation 2.05% 2.05% 0.00% 41.68Shin-Etsu Chemical Co Ltd 1.51% 1.50% 0.01% 61.13Mitsubishi UFJ Financial Gr... 1.51% 1.51% 0.00% 60.49Recruit Holdings Co. Ltd. 1.48% 1.49% 0.00% 67.59Tokyo Electron Ltd. 1.44% 1.44% -0.01% 73.76Nintendo Co. Ltd. 1.41% 1.40% 0.01% 64.03Honda Motor Co. Ltd. 1.24% 1.23% 0.01% 77.86Source: Factset/SSGA. Holdings as of 30 Jun 2021, R-Factor data as of 31 May 2021.
Top 5 R-Factor RatingsKonica Minolta Inc. 0.06% 0.06% 0.01% 88.56Kao Corp. 0.65% 0.64% 0.01% 83.02Sony Group Corporation 2.74% 2.72% 0.01% 82.20Japan Real Estate Investme... 0.18% 0.18% 0.00% 81.26Nippon Paper Industries Co.... 0.03% 0.02% 0.00% 80.72Source: Factset/SSGA. Holdings as of 30 Jun 2021, R-Factor data as of 31 May 2021.
Bottom 5 R-Factor RatingsRelo Group Inc. 0.05% 0.05% 0.00% 5.25ABC-MART INC. 0.04% 0.03% 0.00% 14.30Japan Airport Terminal Co.... 0.05% 0.05% 0.00% 19.09Zensho Holdings Co. Ltd. 0.05% 0.06% 0.00% 19.51Iida Group Holdings Co. Ltd. 0.08% 0.08% 0.00% 19.65Source: Factset/SSGA. Holdings as of 30 Jun 2021, R-Factor data as of 31 May 2021.
The R-Factor summary reflects certain ESG characteristics only, and does not reflect the portfolio’s performance. Certain instruments such as cash & derivatives are excluded. ESG analytics data reported on a one month lag relative to monthly performance reporting period. Please see Important Information section for more information and definitions of the ESG Metrics presented.
Page 10 of 20
Quarterly Investment Report - 80237As of 30 Jun 2021Middlesbrough Borough Council
State Street Global Advisors Report ID: 2981631.1 Published: 12 Jul 2021
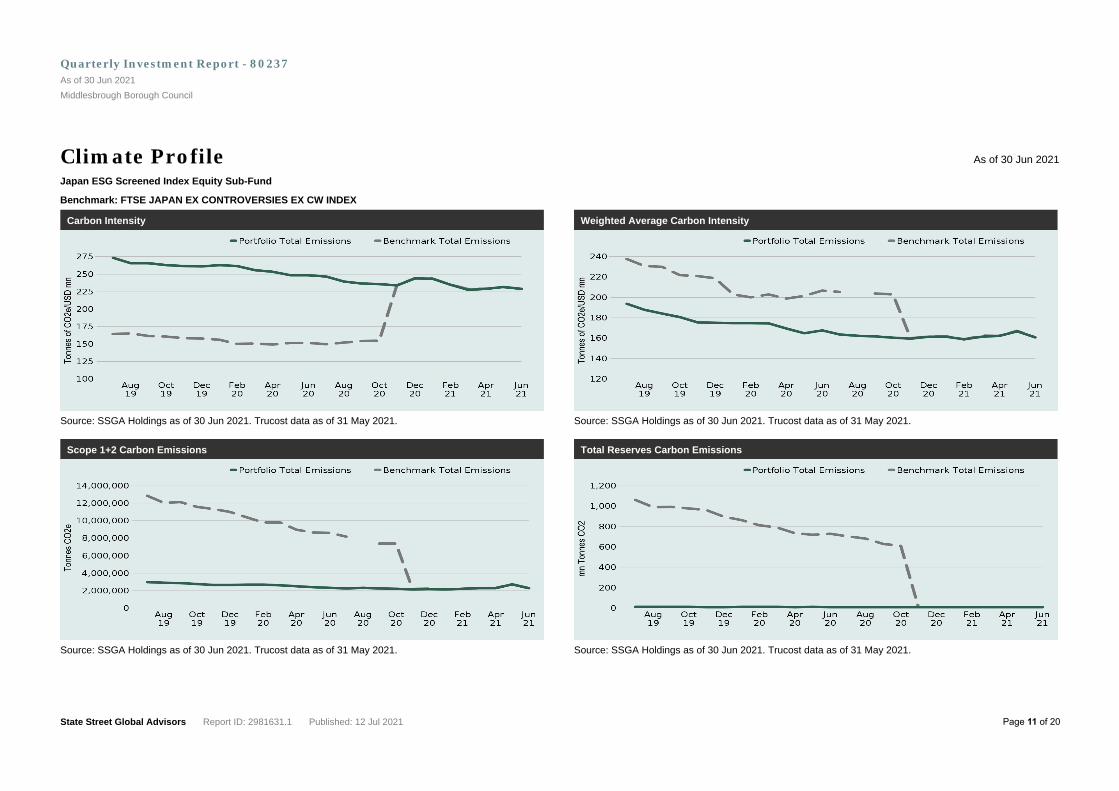
Climate Profile As of 30 Jun 2021
Japan ESG Screened Index Equity Sub-Fund
Benchmark: FTSE JAPAN EX CONTROVERSIES EX CW INDEX
Carbon Intensity
Source: SSGA Holdings as of 30 Jun 2021. Trucost data as of 31 May 2021.
Scope 1+2 Carbon Emissions
Source: SSGA Holdings as of 30 Jun 2021. Trucost data as of 31 May 2021.
Weighted Average Carbon Intensity
Source: SSGA Holdings as of 30 Jun 2021. Trucost data as of 31 May 2021.
Total Reserves Carbon Emissions
Source: SSGA Holdings as of 30 Jun 2021. Trucost data as of 31 May 2021.
Page 11 of 20
Quarterly Investment Report - 80237As of 30 Jun 2021Middlesbrough Borough Council
State Street Global Advisors Report ID: 2981631.1 Published: 12 Jul 2021

Stewardship Profile As of 30 Jun 2021
Japan ESG Screened Index Equity Sub-Fund
Benchmark: FTSE JAPAN EX CONTROVERSIES EX CW INDEX
Stewardship Profile Q1 2021
Number of Meetings Voted 525
Number of Countries 1
Management Proposals 721
Votes for 93.76%
Votes Against 6.24%
Shareholder Proposals 0
With Management 0%
Against Management 0%
Source: SSGA as of 31 Mar 2021
Figures are based on State Street Global Advisors’ general approach to voting at the companies held by the Fund at quarter end. This information is not a substitute for a proxy voting report, which can be requested through your relationship manager.
State Street Global Advisors' (SSGA) asset stewardship program is aimed at engaging with our portfolio companies on issues that impact long-term value creation across environmental, social and governance (ESG) considerations. In the recent past, SSGA has issued extensive guidance on key governance matters such as effective, independent board leadership. SSGA's current focus is on helping boards think about the possible impacts of environmental and social issues and incorporating a sustainability lens into boards' oversight of long-term strategy as a sound business practice.
Gender Diversity
Women on Board Number of Securities
0 175
1 227
2 82
3 18
4 3
5 0
6 0
7 0
8 0
9 0
10 0
10+ 0
Not Available 0
Total 505
Source: Factset/SSGA. Holdings as of 30 Jun 2021, Factset data as of 31 May 2021.
Page 12 of 20
Quarterly Investment Report - 80237As of 30 Jun 2021Middlesbrough Borough Council
State Street Global Advisors Report ID: 2981631.1 Published: 12 Jul 2021

R-FactorTM Summary As of 30 Jun 2021
Asia Pacific ex Japan ESG Screened Index Equity Sub-Fund
Benchmark: FTSE DEVELOPED ASIA PACIFIC EX JAPAN EX CONTROVERSIES EX CW INDEX
R-Factor Summary Fund Benchmark DifferenceR-Factor 61.27 61.32 -0.05ESG 60.93 60.98 -0.05Corporate Governance 54.27 54.29 -0.02Source: SSGA. Holdings as of 30 Jun 2021, R-Factor data as of 31 May 2021.
What is R-Factor?R-FactorTM is built off a transparent scoring methodology that leverages the Sustainability Accounting Standards Board (SASB) Materiality Map, corporate governance codes, and inputs from four best-inclass ESG data providers. R-Factor supports the development of sustainable capital markets by giving investors the ability to invest in solutions that integrate financially material ESG data while incentivizing companies to improve their ESG practices and disclosure in areas that matter.
Fund Coverage Count Percent of Total
Securities
Percent of Total Market Value
R-Factor Securities Coverage 371 94.88% 98.04%Total Number of Securities in Portfolio 391Source: Factset/SSGA. Holdings as of 30 Jun 2021, R-Factor data as of 31 May 2021.
Fund R-Factor Profile
Not Available 1.96%
Laggard 3.78%
Underperformer 5.36%
Average Performer 25.65%
Outperformer 33.68%
Leader 29.55%
Source: Factset/SSGA. Holdings as of 30 Jun 2021, R-Factor data as of 31 May 2021.
Top 10 Positions Fund Weight Benchmark Weight
Difference R-Factor Rating
Samsung Electronics Co. Lt... 10.27% 10.26% 0.02% 80.77AIA Group Limited 4.59% 4.59% 0.00% 68.68Commonwealth Bank of Aus... 4.06% 4.07% -0.01% 66.56CSL Limited 2.97% 2.97% -0.01% 64.02Hong Kong Exchanges & Cl... 2.31% 2.31% 0.00% 64.81Westpac Banking Corporati... 2.17% 2.17% -0.01% 66.43National Australia Bank Limi... 1.98% 1.98% -0.01% 68.22Australia and New Zealand... 1.83% 1.84% -0.01% 70.82SK hynix Inc 1.78% 1.78% 0.00% 68.60Samsung Electronics Co Ltd... 1.64% 1.64% 0.00% 80.77Source: Factset/SSGA. Holdings as of 30 Jun 2021, R-Factor data as of 31 May 2021.
Top 5 R-Factor RatingsDexus 0.26% 0.26% 0.00% 95.44GPT Group 0.22% 0.22% 0.00% 91.64COWAY Co. Ltd. 0.12% 0.12% 0.00% 82.02Lenovo Group Limited 0.26% 0.26% 0.00% 81.63Samsung Electronics Co Ltd... 1.64% 1.64% 0.00% 80.77Source: Factset/SSGA. Holdings as of 30 Jun 2021, R-Factor data as of 31 May 2021.
Bottom 5 R-Factor RatingsKOREA INVESTMENT HOLD... 0.11% 0.11% 0.00% 0HOTEL SHILLA CO. LTD. 0.08% 0.08% 0.00% 9.78Medy-Tox Inc. 0.03% 0.03% 0.00% 10.88Hanssem Co. Ltd 0.03% 0.03% 0.00% 11.08LS Corp. 0.03% 0.03% 0.00% 12.42Source: Factset/SSGA. Holdings as of 30 Jun 2021, R-Factor data as of 31 May 2021.
The R-Factor summary reflects certain ESG characteristics only, and does not reflect the portfolio’s performance. Certain instruments such as cash & derivatives are excluded. ESG analytics data reported on a one month lag relative to monthly performance reporting period. Please see Important Information section for more information and definitions of the ESG Metrics presented.
Page 13 of 20
Quarterly Investment Report - 80237As of 30 Jun 2021Middlesbrough Borough Council
State Street Global Advisors Report ID: 2981631.1 Published: 12 Jul 2021

Climate Profile As of 30 Jun 2021
Asia Pacific ex Japan ESG Screened Index Equity Sub-Fund
Benchmark: FTSE DEVELOPED ASIA PACIFIC EX JAPAN EX CONTROVERSIES EX CW INDEX
Carbon Intensity
Source: SSGA Holdings as of 30 Jun 2021. Trucost data as of 31 May 2021.
Scope 1+2 Carbon Emissions
Source: SSGA Holdings as of 30 Jun 2021. Trucost data as of 31 May 2021.
Weighted Average Carbon Intensity
Source: SSGA Holdings as of 30 Jun 2021. Trucost data as of 31 May 2021.
Total Reserves Carbon Emissions
Source: SSGA Holdings as of 30 Jun 2021. Trucost data as of 31 May 2021.
Page 14 of 20
Quarterly Investment Report - 80237As of 30 Jun 2021Middlesbrough Borough Council
State Street Global Advisors Report ID: 2981631.1 Published: 12 Jul 2021

Stewardship Profile As of 30 Jun 2021
Asia Pacific ex Japan ESG Screened Index Equity Sub-Fund
Benchmark: FTSE DEVELOPED ASIA PACIFIC EX JAPAN EX CONTROVERSIES EX CW INDEX
Stewardship Profile Q1 2021
Number of Meetings Voted 393
Number of Countries 6
Management Proposals 972
Votes for 79.42%
Votes Against 20.58%
Shareholder Proposals 6
With Management 100%
Against Management 0%
Source: SSGA as of 31 Mar 2021
Figures are based on State Street Global Advisors’ general approach to voting at the companies held by the Fund at quarter end. This information is not a substitute for a proxy voting report, which can be requested through your relationship manager.
State Street Global Advisors' (SSGA) asset stewardship program is aimed at engaging with our portfolio companies on issues that impact long-term value creation across environmental, social and governance (ESG) considerations. In the recent past, SSGA has issued extensive guidance on key governance matters such as effective, independent board leadership. SSGA's current focus is on helping boards think about the possible impacts of environmental and social issues and incorporating a sustainability lens into boards' oversight of long-term strategy as a sound business practice.
Gender Diversity
Women on Board Number of Securities
0 119
1 79
2 77
3 81
4 25
5 6
6 0
7 0
8 1
9 0
10 0
10+ 0
Not Available 3
Total 391
Source: Factset/SSGA. Holdings as of 30 Jun 2021, Factset data as of 31 May 2021.
Page 15 of 20
Quarterly Investment Report - 80237As of 30 Jun 2021Middlesbrough Borough Council
State Street Global Advisors Report ID: 2981631.1 Published: 12 Jul 2021

Relationship Management Team
Christopher TimmsSr Relationship Mgr II
Phone:Fax:
442033956617
Kian Gheissari
Phone:Fax:
442033956754
Page 16 of 20
Quarterly Investment Report - 80237As of 30 Jun 2021Middlesbrough Borough Council
State Street Global Advisors Report ID: 2981631.1 Published: 12 Jul 2021

Important Information
R-Factor™ is an ESG scoring system that leverages commonly accepted materiality frameworks to generate a unique ESG score for listed companies. The score is powered by ESG data from four different providers in an effort to improve overall coverage and remove biases inherent in existing scoring methodologies. R-Factor™ is designed to put companies in the driver's seat to help create sustainable markets.
R-Factor™ Scores are comparable across industries. The ESG and Corporate Governance (CorpGov) scores are designed to be based on issues that are material to a company's industry and regulatory region. A uniform grading scale allows for interpretation of the final company level score to allow for comparison across companies.
Responsible-Factor (R Factor) scoring is designed by State Street to reflect certain ESG characteristics and does not represent investment performance. Results generated out of the scoring model is based on sustainability and corporate governance dimensions of a scored entity.
The returns on a portfolio of securities which exclude companies that do not meet the portfolio's specified ESG criteria may trail the returns on a portfolio of securities which include such companies. A portfolio's ESG criteria may result in the portfolio investing in industry sectors or securities which underperform the market as a whole.
The R-Factor™ scoring process comprises two underlying components. The first component is based on the framework published by the Sustainability Accounting Standards Board ("SASB"), which is used for all ESG aspects of the score other than those relating to corporate governance issues. The SASB framework attempts to identify ESG risks that are financially material to the issuer-based on its industry classification. This component of the R-Factor™ score is determined using only those metrics from the ESG data providers that specifically address ESG risks identified by the SASB framework as being financially material to the issuer-based on its industry classification.
The second component of the score, the CorpGov score, is generated using region-specific corporate governance codes developed by investors or regulators. The governance codes describe minimum corporate governance expectations of a particular region and typically address topics such as shareholder rights, board independence and executive compensation. This component of the R-Factor™ uses data provided by ISS Governance to assign a governance score to issuers according to these governance codes.
Within each industry group, issuers are classified into five distinct ESG performance groups based on which percentile their R-Factor™ scores fall into. A company is classified in one of the five ESG performance classes (Laggard - 10% of universe, Underperformer - 20% of universe, Average Performer - 40% of universe, Outperformer - 20% of universe or Leader - 10% of universe) by comparing the company's R-Factor™ score against a band. R-Factor™ scores are normally distributed using normalized ratings on a 0-100 rating scale.
Discrepancy between the number of holdings in the R-Factor™ Summary versus the number of holdings in the regular reporting package may arise as the R-Factor™ Summary is counted based on number of issuers rather than number of holdings in the portfolio.
For examples of public language regarding R-Factor see the ELR Registration Statement here: https://www.sec.gov/Archives/edgar/data/1107414/000119312519192334/d774617d497.html
Carbon Intensity - Measured in Metric tons CO2e/USD millions revenues. The aggregation of operational and first-tier supply chain carbon footprints of index constituents per USD (equal weighted).
Weighted Average Carbon Intensity - Measured in Metric tons CO2e/USD millions revenues. The weighted average of individual company intensities (operational and first-tier supply chain emissions over
Page 17 of 20
Quarterly Investment Report - 80237As of 30 Jun 2021Middlesbrough Borough Council
State Street Global Advisors Report ID: 2981631.1 Published: 12 Jul 2021

revenues), weighted by the proportion of each constituent in the index.
Scope 1+2 Carbon Emissions- Measured in Metric Tons of CO2e.The GHG emissions from operations that are owned or controlled by the company, as well as GHG emissions from consumption of purchased electricity, heat or steam, by the company
Total Reserves CO2 Emissions - Measured in Metric tons of CO2. The carbon footprint that could be generated if the proven and probable fossil fuel reserves owned by index constituents were burned per USD million invested. Unlike carbon intensity and carbon emissions, the S&P Trucost Total Reserves Emissions metric is a very specific indicator that is only applicable to a very selected number of companies in extractive and carbon-intensive industries. Those companies are assigned Total Reserves Emissions numerical results by Trucost, whereas the rest of the holdings in other industries do not have numerical scores and are instead displaying "null", blank values. In order to present a more comprehensive overview of a portfolio's overall weighted average fossil fuel reserves, State Street Global Advisors replaces blank results with "zeros". While that might slightly underestimate the final weighted average volume, it provides a more realistic result, given that most companies in global indices have no ownership of fossil fuel reserves.
We are currently using FactSet's own "People" dataset to disclose the number of women on the board, for each company in the Fund's portfolio.
Data and metrics have been sourced as follows from the following contributors as of the date of this report, and are subject to their disclosures below. All other data has been sourced by SSGA.
Trucost Sections: Carbon Intensity, Weighted Average Carbon Intensity, Scope 1+2 Carbon Emissions, Total Reserves Carbon Emissions - Trucost® is a registered trademark of S&P Trucost Limited ("Trucost") and is used under license. The ESG Report is/are not in any way sponsored, endorsed, sold or promoted by Trucost or its affiliates (together the "Licensor Parties") and none of the Licensor Parties make any claim, prediction, warranty or representation whatsoever, expressly or impliedly, either as to (i) the results to be obtained from the use of Trucost data with the report, or (ii) the suitability of the Trucost data for the purpose to which it is being put in connection with the report. None of the Licensor Parties provide any financial or investment advice or recommendation in relation to the report. None of the Licensor Parties shall be liable (whether in negligence or otherwise) to any person for any error in the Trucost data or under any obligation to advise any person of any error therein.
FactSet Sections: Gender Diversity - This publication may contain FactSet proprietary information ("FactSet Information") that may not be reproduced, used, disseminated, modified nor published in any manner without the express prior written consent of FactSet. The FactSet Information is provided "as is" and all representations and warranties whether oral or written, express or implied (by common law, statute or otherwise), are hereby excluded and disclaimed, to the fullest extent permitted by law. In particular, with regard to the FactSet Information, FactSet disclaims any implied warranties of merchantability and fitness for a particular purpose and makes no warranty of accuracy, completeness, timeliness, functionality, and/or reliability. The FactSet Information does not constitute investment advice and any opinions or assertion contained in any publication containing the FactSet Information (and/or the FactSet Information itself) does not represent the opinions or beliefs of FactSet, its affiliated and/or related entities, and/or any of their respective employees. FactSet is not liable for any damages arising from the use, in any manner, of this publication or FactSet Information which may be contained herein.
All information has been obtained from sources believed to be reliable, buts its accuracy is not guaranteed. There is no representation or warranty as to the current accuracy, reliability or completeness of, nor liability for, decisions based on such information and it should not be relied on as such.
Issued and approved by State Street Global Advisors Limited.
State Street Global Advisors Limited is authorised and regulated by the Financial Conduct Authority.
Registered Number: 4486031 England.
Page 18 of 20
Quarterly Investment Report - 80237As of 30 Jun 2021Middlesbrough Borough Council
State Street Global Advisors Report ID: 2981631.1 Published: 12 Jul 2021

State Street Global Advisors Limited, a company registered in England with company number 2509928 and VAT number 5776591 81 and whose registered office is at 20 Churchill Place, London E14 5HJ.
This report is prepared solely for the use of the named client and should not be used by any other party.
All data sourced by State Street Global Advisors Limited unless stated otherwise.
All valuations are based on Trade Date accounting.
Performance figures are calculated 'Gross of Fees' unless otherwise stated.
Returns are annualised for periods greater than one year.
Returns are calculated using the accrual accounting method.
Performance figures are calculated by the Modified Dietz method or by the True Time-Weighted return method.
Past performance is not necessarily indicative of future investment performance.
Performance returns greater than one year are calculated using a daily annualisation formula. Returns for the same time period based on other formulas, such as monthly annualisation, may produce different results.
The account summary page details the opening balance at the start of the reporting period which is the equivalent of the closing balance of the previous reporting period.
If you are invested into any pooled fund or common trust fund, it may use over-the-counter swaps, derivatives or a synthetic instrument (collectively "Derivatives") to increase or decrease exposure in a particular market, asset class or sector to effectuate the fund's strategy. Derivatives agreements are privately negotiated agreements between the fund and the counterparty, rather than an exchange, and therefore Derivatives carry risks related to counterparty creditworthiness, settlement default and market conditions. Derivatives agreements can require that the fund post collateral to the counterparty consistent with the mark-to-market price of the Derivative. SSGA makes no representations or assurances that the Derivative will perform as intended.
If you are invested in an SSGA commingled fund or common trust fund that participates in State Street's securities lending program (each a "lending fund"), the Fund participates in an agency securities lending program sponsored by State Street Bank and Trust Company (the "lending agent") whereby the lending agent may lend up to 100% of the Fund's securities, and invest the collateral posted by the borrowers of those loaned securities in collateral reinvestment funds (the "Collateral Pools"). The Collateral Pools are not registered money market funds and are not guaranteed investments. The Fund compensates its lending agent in connection with operating and maintaining the securities lending program. SSGA acts as investment manager for the Collateral Pools and is compensated for its services. The Collateral Pools are managed to a specific investment objective as set forth in the governing documents for the Collateral Pools. For more information regarding the Collateral Pool refer to the "US Cash Collateral Strategy Disclosure Document." Securities lending programs and the subsequent reinvestment of the posted collateral are subject to a number of risks, including the risk that the value of the investments held in the Collateral Pool may decline in value, be sold at a loss or incur credit losses. The net asset value of the Collateral Pool is subject to market conditions and will fluctuate and may decrease in the future. More information on the securities lending program and on the Collateral Pools, including the "US Cash Collateral Strategy Disclosure Document" and the current mark to market unit price are available on Client's Corner and also available upon request from your SSGA Relationship Manager.
The information provided within this report is for the sole use of the official report recipient. It may not be reproduced in any form without express permission of State Street Global Advisors Limited. Whilst
Page 19 of 20
Quarterly Investment Report - 80237As of 30 Jun 2021Middlesbrough Borough Council
State Street Global Advisors Report ID: 2981631.1 Published: 12 Jul 2021

State Street Global Advisors Limited believe that the information is correct when this report was produced, no warranty or representation is given to this effect and no responsibility can be accepted by State Street Global Advisors Limited to any intermediaries or end users for any action taken on the basis of the information.
If you are invested in a Luxembourg sub-fund applying swing pricing (as set out in the prospectus of the SSGA Luxembourg SICAV, the "Prospectus"), performance of the fund is calculated on an unswung pricing basis, however, the fund price quoted and your mandate's return may be adjusted to take into consideration any Swing Pricing Adjustment (as defined in the Prospectus) . Please refer to the Prospectus for further information.
The Net performance returns reflected in the Performance Summary report is from Jan 2020 reporting onwards.
Page 20 of 20
Quarterly Investment Report - 80237As of 30 Jun 2021Middlesbrough Borough Council
State Street Global Advisors Report ID: 2981631.1 Published: 12 Jul 2021