new residential investment corp. quarterly supplement
TRANSCRIPT

New Residential Investment Corp.Quarterly Supplement
Fourth Quarter & Full Year 2018

DisclaimersIN GENERAL. This disclaimer applies to this document and the verbal or written comments of any person presenting it. This document, taken together with any such verbal or written comments, is referred to herein as the “Presentation.”
FORWARD-LOOKING STATEMENTS. Certain statements regarding New Residential Investment Corp. (together with its subsidiaries, “New Residential,” “NRZ,” the “Company” or “we”) in this Presentation may constitute forward-looking statements within the meaning of the Private Securities Litigation Reform Act of 1995, including without limitation, the ability to succeed in various interest rate environments, the Company’s expectations for closing, funding and financing various transactions, such as the transfer of MSRs from Ocwen, statements on future interest rates and market conditions, ability to take advantage of future investment opportunities, our targeted lifetime IRRs and yields, expected or projected cash flows, expected returns, ability to mitigate prepayment risk for the MSR asset, issuance of additional term notes in 2019, ability to continue to work with strong counterparties, ability to capitalize on certain partnership opportunities, expected ownership levels of Prosper, expectations regarding interest rates and housing, sustainability of earnings or our dividend, ability to create shareholder value, ability to continue diversifying servicing counterparties, actual unpaid principal balance of loans subject to our call rights and Excess MSRs, expected shortening or acceleration of callability timelines for call rights, projected overall callable balance of call rights, the ability to execute and profit from our deal collapse strategy, the value of call rights increasing as interest rates decline or decreasing as interest rates increase, ability to execute future servicer advance and call rights mortgage loan securitizations and call rights, expectation that servicer advance maturity dates will be extended, ability to access a long-term pipeline of residential mortgage assets, potential to be subject to certain claims and legal proceedings, expectations for future prepayment speeds, ability to help protect returns in the event of a rise in voluntary prepayment rates, expectation of potential future upside as advance balances continue to decline, investments benefiting from an increase in interest rates or an improving macro backdrop, the potential deployment of additional capital in 2019, performance of residential loans and consumer loans, the continuing decline of delinquencies, the Company’s plan to issue additional non-qualified mortgage securities and statements regarding the Company’s investment pipeline and investment opportunities. These statements are based on management's current expectations and beliefs and are subject to a number of trends and uncertainties that could cause actual results to differ materially from those described in the forward-looking statements, many of which are beyond our control. New Residential can give no assurance that its expectations will be attained. Accordingly, you should not place undue reliance on any forward-looking statements made in this Presentation. For a discussion of some of the risks and important factors that could affect such forward-looking statements, see the sections entitled “Risk Factors” and “Management’s Discussion and Analysis of Financial Condition and Results of Operations” in the Company’s most recent reports on Form 10-Q and Form 10-K and other filings with the U.S. Securities and Exchange Commission (the “SEC”), which are available on the Company’s website (www.newresi.com). In addition, new risks and uncertainties emerge from time to time, and it is not possible for the Company to predict or assess the impact of every factor that may cause its actual results to differ from those contained in any forward-looking statements. Such forward-looking statements speak only as of the date of this Presentation. New Residential expressly disclaims any obligation to release publicly any updates or revisions to any forward-looking statements contained herein to reflect any change in the Company's expectations with regard thereto or change in events, conditions or circumstances on which any statement is based.
CAUTIONARY NOTE REGARDING ESTIMATED / TARGETED RETURNS AND YIELDS. The Company calculates the estimated return/yield, or the IRR, of an investment as the annualized effective compounded rate of return (assuming monthly compounding) earned over the life of the investment after giving effect, in the case of returns, to existing leverage. Life-to-date IRR, including life-to-date IRRs on the overall MSR portfolio, servicer advance investments, Non-Agency securities portfolio, residential loans and consumer loans, is based on the purchase price for an investment and the estimated value of the investment, or "mark," which is calculated based on cash flows actually received and the present value of expected cash flows over the life of the investment, using an estimated discount rate. Targeted returns and targeted yields reflect a variety of estimates and assumptions that could prove to be incorrect, such as an investment’s coupon, amortization of premium or discount, costs and fees, and our assumptions regarding prepayments, defaults and loan losses, among other things. Income and cash flows recognized by the Company in future periods may be significantly less than the income and cash flows that would have been recognized had expected returns been realized. As a result, an investment’s lifetime return may differ materially from an IRR to date. In addition, the Company’s calculation of IRR may differ from a calculation by another market participant, as there is no standard method for calculating IRRs. Statements about estimated and targeted returns and targeted yields in this Presentation are forward-looking statements. You should carefully read the cautionary statement above under the caption “Forward-looking Statements,” which directly applies to our discussion of estimated and targeted returns and targeted yields.
PAST PERFORMANCE. Past performance is not a reliable indicator of future results and should not be relied upon for any reason.
NO OFFER; NO RELIANCE. This Presentation is for informational purposes only and does not constitute an offer to sell, or a solicitation of an offer to buy, any security and may not be relied upon in connection with the purchase or sale of any security. Any reference to a potential financing does not constitute, nor should it be construed as, an offer to purchase or sell any security. There can be no assurance if or when the Company or any of its affiliates will offer any security or the terms of any such offering. Any such offer would only be made by means of formal documents, the terms of which would govern in all respects. You should not rely on this Presentation as the basis upon which to make any investment decision.
NON-GAAP MEASURES. This Presentation includes non-GAAP measures, such as Core Earnings. See "Appendix" in this presentation for information regarding this non-GAAP measure, including a definition, purpose and reconciliation to net income, the most directly comparable GAAP financial measure.
1

New Residential Overview *
2
New Residential (NYSE: NRZ) is a publicly traded mortgage real estate investment trust (REIT) with
a diversified portfolio and a strong track record of performance
* Detailed endnotes are included in the Appendix.
Includes mortgage servicing rights
(“MSRs”), call rights, residential
securities / loans, consumer loans and
an origination and servicing operating
company
A DIVERSIFIED PORTFOLIO
Portfolio is positioned to generate
stable returns across rate cycles
WELL POSITIONED FOR CHANGING
MARKET CONDITIONS
Strong balance sheet and financial
resources, NRZ is positioned to take
advantage of investment opportunities
WELL CAPITALIZED – ABILITY TO
EXECUTE ON FUTURE
OPPORTUNITIES
Provides leverage and helps reduce
counterparty risk
DIVERSIFIED & EXPERIENCED
NETWORK OF SUBSERVICERS &
FUNDING COUNTERPARTS
$539 billion UPB of MSRs (2) &
~$126 billion UPB of Call Rights (3)
SCALE IN HARD TO REPLICATE
INVESTMENTS
Consistent track record of earnings
growth & investment returns
STRONG & STABLE
DIVIDENDS & RETURNS
What Makes NRZ a Different Kind of Mortgage REIT? (1)
~12%Dividend Yield (4)
~$2.1BnMSR Term
Notes Issued
$114BnUPB of Newly
Acquired MSRs
~6%YoY Book
Value
Increase
$539BnUPB
of MSRs (2)
~$126BnUPB of
Call Rights (3)
FY 2018

FY’18 4Q’18 FY’17
($mm)($ / diluted share) (2) ($mm)
($ / diluted share) (2) ($mm)
($ / diluted share) (2)
GAAP Net Income $964 $2.81 $0.3 $0.00 $958 $3.15
Core Earnings (1) $815 $2.38 $208 $0.58 $861 $2.83
Common Dividend $693 $2.00 $185 $0.50 $609 $1.98
3
1) Core earnings is a non-GAAP measure. See Reconciliation pages in the Appendix for a reconciliation to the most comparable GAAP measure.2) Per share calculations of GAAP Net Income and Core Earnings are based on 343,137,361 average diluted shares during the full year ended December 31, 2018; 304,381,388 average diluted shares during the full
year ended December 31, 2017; 358,509,094 weighted average diluted shares during the quarter ended December 31, 2018 and 340,868,403 weighted average diluted shares during the quarter ended September 30, 2018. Per share calculations of Common Dividend are based on 369,104,429 basic shares outstanding as of December 31, 2018; 340,354,429 basic shares outstanding as of September 30, 2018; 339,862,769 basic shares outstanding as of June 30, 2018; 336,135,391 basic shares outstanding as of March 31, 2018; 307,361,309 basic shares outstanding as of December 31, 2017, September 30, 2017 and June 30, 2017; 307,334,117 basic shares outstanding as of March 31, 2017.
Financial Performance
Full Year 2018:
GAAP Net Income of $964 million, or $2.81 per diluted share
Core Earnings of $815 million, or $2.38 per diluted share (1)
Full year dividend of $2.00 per common share
Fourth Quarter 2018:
GAAP Net Income of $0.3 million, or $0.00 per diluted share
Core Earnings of $208 million, or $0.58 per diluted share (1)
Fourth quarter dividend of $0.50 per common share

New Residential 101 *
4
NRZ is a leading capital provider and facilitates home ownership through its mortgage origination subsidiary, NewRez
NRZ has a diversified portfolio of investments that would be difficult to replicate
Our objective continues to drive strong and sustainable risk-adjusted returns primarily through investments in:
Mortgage Servicing Rights Non-Agency Securities & Associated Call Rights Opportunistic Investments1 2 3
Portfolio Highlights
Opportunistic Investments
Mortgage Servicing Rights (“MSRs”)
$539Bn UPB of MSRs (2)
An MSR is the contractual
obligation to collect and
process mortgage payments in
exchange for a fee.
Servicer Advances
Advances are required capital
outlays by the servicer to fund
missed payments from
delinquent borrowers, payments
of taxes & insurance premiums
and foreclosure related expenses.
~$126Bn UPB of Calls (3)
Non-Agency Call Rights
NRZ’s call rights give NRZ
control over ~$126 billion UPB of
non-agency mortgage loans (3) –
the call rights allow NRZ to
purchase loans in a securitization
for a price generally equal to the
current loan balance plus
expenses.
With over $10bn in current face,
the Non-Agency Bond portfolio
helps NRZ execute its call right
strategy - NRZ is generally able
to improve its call economics by
acquiring these bonds at a
significant discount to par.
NRZ pursues various forms of
opportunistic investments as they
arise in the market.
Shellpoint Partners (Jul 2018)
Added in-house servicing, mortgage
origination, additional recapture
capabilities and ancillary revenue
streams.
HLSS (Oct 2015)
Doubled the size of NRZ’s portfolio of
servicing-related assets and achieved
critical mass in call rights.
Consumer Loans
SpringCastle & Prosper Portfolios -
Attractive one-off investments that
have delivered significant returns.
Net Investment (1)
Cash$251M
Resi Securities& Call Rights
$2,017M
ResiLoans$763M
MSRs**$3,004M
Consumer Loans$108M
*Detailed endnotes are included in the Appendix. ** Includes Excess MSRs, Full MSRs, Servicer Advances, Originations and Servicing.
As of December 31, 2018
Non-Agency Securities

5
Consistent Growth & Robust Performance Since Inception*
Strong track record of executing on core investment strategies, making
attractive opportunistic investments and delivering consistent growth
FY 2015 FY 2016 FY 2017 Feb 2017
Ability to Seek Out Attractive Opportunistic Investments & Execute on Strategic Initiatives
Nov 2017 & July 2018
ShellpointIntegrated mortgage platform – adding servicing, mortgage origination, recapture and ancillary revenue capabilities
• Industry leading 3rd party servicing -Shellpoint Mortgage Servicing
• UPB serviced was $50Bn in Nov. 2017; now $109Bn YE 2018
Prosper Consumer Loans• Joined 4-member consortium
agreeing to purchase up to
$5bn of unsecured consumer
loans on a forward flow basis
from Prosper
• Performing in-line with
original underwriting;
achieving IRR greater than
20%
Bulk MSR Acquisitions• Grew MSR portfolio -
purchasing / agreeing to
purchase MSRs totaling
~$237Bn ($110bn UPB
from Ocwen (3) and
$92Bn UPB from
CitiMortgage)
Ability to Acquire MSRs Independently
• Became eligible to own
Fannie, Freddie and
Non-Agency MSRs in
all 50 U.S. States
• First agreement to
purchase of full MSRs
in Aug 2016
Diversification of Servicers
• Expanded servicer
network to help
mitigate counterparty
risk
HLSS• Acquired HLSS
• Acquired ~$145Bn
of Ocwen call
rights
• Doubled NRZ’s
portfolio of
servicing-related
assets & achieved
critical mass in
call rights
*Detailed endnotes are included in the Appendix.
NRZ Book Value Per Share (1)
NRZMarket Cap (2) $1.5Bn $1.9Bn $3.0Bn $3.5Bn $5.5Bn $5.2Bn
$10.00 $11.28
$12.13 $13.00
$15.26 $16.25
2013 2014 2015 2016 2017 2018
+6% YoY+17% YoY
+7% YoY+8% YoY
+13% YoY+2% YoY

MSRs*
6
Mortgage Interest Rates Rose 56 basis points during 2018:(1)
• MSR Multiples** increased by 1.1x from 3.0x to 4.1x
• The share of the mortgage universe eligible for refinancing dropped from 29% to 9%(2)
Mortgage rates were 3.99% as of December 31, 2017 and 4.55% as of December 31, 2018(1)
NRZ’s MSR portfolio is less rate sensitive due to more seasoned / credit impaired borrowers
Recapture mitigates prepayment risk for the MSR asset
NRZ has recapture agreements on 100% of its MSRs and has a captive originator
NRZ’s net prepayment speeds dropped from a peak of 15% CPR in December 2016 to 8% CPR in December 2018
MSR Multiples (2018 4.5s)(3)
3.0
3.3
3.6
3.9
4.2
4.5
12/17 2/18 4/18 5/18 7/18 9/18 10/18 12/18
Q3
% of Mortgage Universe that is Refinanceable(2)
Start of 2018
Current
Q3
*Detailed endnotes are included in the Appendix. **The value of the servicing rights are frequently expressed as the multiple of the service fee. For example, for a FNMA loan that has 25 bps of interest, its value can be expressed as a 4x multiple, which represents a price of 100 bps of the UPB.

Acquisitions –
$600bn UPB of MSRs were sold in 2018.(2)
• NRZ purchased approximately 20% ($114bn) in 2018, and expects mid-teen levered
returns(3)
• Acquired $114bn UPB from 15 different counterparties; $19bn UPB acquired in Q4 2018
2019 Supply – The MSR pipeline continues to be robust with ~$350bn of expected supply(3)
As mortgage originators and non-bank servicers continue to consolidate, NRZ is well positioned to acquire assets
MSRs: Overview and Pipeline*
7
NRZ’s MSR portfolio totals $539 billion UPB (1)
FHLMC FNMA GNMA Non-AgencyExcess MSR
Total(5) FHLMC FNMA GNMA Non-AgencyFull MSRTotal**
TOTAL(5)
UPB ($Bn) 35 32 27 54 $149 Bn 90 179 30 92 $390 Bn $539 Bn
WAC 4.6% 4.7% 4.7% 4.8% 4.7% 4.3% 4.3% 3.8% 4.5% 4.3% 4.4%
WALA (Mth) 85 97 87 151 116 mth 56 70 31 154 84 mth 88 mth
Cur LTV 59% 53% 64% 69% 63% 66% 61% 90% 83% 70% 69%
Cur FICO 726 711 695 680 699 753 748 683 649 719 716
60+ DQ 1.6% 2.7% 1.2% 10.5% 5.5% 0.5% 1.0% 3.7% 14.9% 4.4% 4.6%
Excess MSRs(4) Full MSRs(4)
(1)
* Detailed endnotes are included in the Appendix.

Fixed rate term financing reduced NRZ’s cost of financing and extended maturities
Expect to issue additional term notes in 2019 which will lengthen our maturities for ~90% of our portfolio(1)
New Residential has an additional $345 million in undrawn capacity(2)
MSR Financing*
* Detailed endnotes and abbreviations are included in the Appendix.
8
Proven Access to Capital Markets (3)
Deals DateAmount
($mm)Maturity
Adv. Rate
WAL Coupon
PLS1 Jan’18 $500 3 Yrs 62% 2.06 3.55%
PLS2 Feb’18 $430 3 Yrs 68% 2.09 3.68%
FNT1 May’18 $646 5 Yrs 69% 2.89 4.45%
FNT2 Jul’18 $568 6 Yrs 67% 3.09 4.62%
Total $2,144 ~4 Yrs 67% 2.59 4.13%
NRZ MSR Term Notes – 2018YTD
$0
$500
$1,000
$1,500
$2,000
$2,500
PLSI PLS2 FNT1 FNT2
$500M
$430M
$646M
$568M
$2.1 Billion in total MSR term notes issued by NRZ in 2018
0% ~73%% of fixed rate MSR debt
Dec 31, 2017 Today
~64% ~73%% of MSR debt with maturity ≥ 1 year
NRZ issued $2.1Bn of Fixed Rate MSR Term Notes in 2018
PLS1

Maximizing Value of the Mortgage Asset*
NRZ is pursuing strategic partnerships and investments to maximize value of our servicing portfolio
NRZ owns $539bn UPB of MSRs which equates to approximately 3 million mortgage customers(1)
We have strong purchasing power and unique partnership opportunities across the financial services sector.
NRZ kicked off its expansion into mortgage operations through the acquisition of Shellpoint Partners in July 2018.
NRZ contracts with third parties to subservice the majority of our servicing portfolio and expects to continue to work with strong counterparties that can provide valuable services to NRZ and its customer base.(2)
NRZ’s diversified mortgage servicing strategy positions the company to capitalize on partnership opportunities that help: improve servicing performance, minimize risk, enrich customer experience and maximize the value of each loan we service.(3)
9
Mortgage Assets
MSRsLoansBonds
Mortgage Assets
Potential Future Ancillary Service Offerings(2)
Origination Services
ConsumerServices
Default Services
Credit & Data Solutions Underwriting Verification Services Tax Tracking and Flood Services Origination Document Services
Homeowner’s Insurance Consumer Credit Products Property Maintenance and Home Improvement Smart Home and Security
Foreclosure and Auction Services Field Services Lien Tracking and Release Services Default Document Services
Services added through acquisition of Shellpoint Partners
* Detailed endnotes are included in the Appendix.

NRZ controls call rights to ~$126 billion of mortgage collateral, representing ~37% of
the Non-Agency market (1)(2)
~$47 billion, or ~37%, of our call right population is currently callable(1)
10
+44% YoY (3)
Loan Portfolio - Driven by Call Strategy
Deals continue to reach their callabilityfactor
Calls become profitable for NRZ as timelines continue to shorten as delinquencies and advances decline
Rates have returned back to 1Q2018 levels, which increases call profitability
Executed clean-up calls across 427 deals (~$11bn UPB) since inception
2018 FY – Called 88 deals (~$2.7B UPB)
2018 4Q – Called 14 deals (~$795mm UPB)
2018 4Q – Issued 2 Non-Agency securitizations ($1.0bn UPB)
Strong investor base with over 100 investors
Call strategy provides NRZ with access to a long-term pipeline of residential mortgage assets (4)
NRZ strategically invests in securities that are accretive to deal collapses
NRZ works with leading special servicers and asset managers to offer loan modifications and solutions to borrowers, shorten timelines and optimize liquidation results
Control Call Rights for ~$126Bnof Loans (1)
Robust Execution of Call Strategy
Increasing CallablePopulation
Call Rights*
Securitizations in 2018
* Detailed endnotes are included in the Appendix.
~$2.8BnCallable Deals
Up from $42Bn at end of 2017
~$47Bn

Delinquencies on NRZ Owned Calls vs Aggregate
11
Call Rights (cont’d)(1)*
2014 2015 2016 2017 2018
# of Deals 60 53 50 176 88
Call Deals Executed by NRZ to Date (UPB)
$1.4 Bn $1.2 Bn $1.2 Bn
$4.7 Bn
$2.7 Bn
NRZ Callable Population
Expecting a robust pipeline of callable deals and issuances in 2019(2)
* Detailed endnotes are included in the Appendix.

As of year end 2018, NRZ’s Non-Agency bond portfolio totaled ~$10bn in face value with an average price of 80%
NRZ Portfolio Composition(1)
($ in mm) Total
Current Face $10,521
Cost Basis $7,960
Carrying Value
$8,396
WAC (2) 4.8%
WALA (2) 134
60+ DQ 10.2%
Non-Agency Bond Portfolio*
12
Credit performance in Non-Agency portfolio continues to remain strong
DefaultDQ
2005$1,104
≤ 2004$467
≥ 2006 $6,389
(Book Value in millions)By Vintage
With ~20 points of discount in NRZ’s bond portfolio, NRZ’s Non-Agency bond positions help drive our collapse activity
50%+ of Legacy Non-Agency portfolio is currently callable or
will be callable within 3 years (<=15% factor)(3)
Borrower delinquency and default rates continued to improve across the legacy mortgage market
Improvements of 15% and 12%, respectively(4)
Improving collateral performance helps accelerate NRZ’s call
opportunities
In 2018, NRZ acquired $4.2 billion of Non-Agency securities at an average price of 85%
During the fourth quarter, NRZ acquired $447 million face
value of Non-Agency securities at an average price of 75%
Non-Agency bond prices increased year over year driven by declining supply and improved collateral performance
Net equity investment year over year increased $300 million, from $1.4 billion to $1.7 billion
* Detailed endnotes are included in the Appendix.
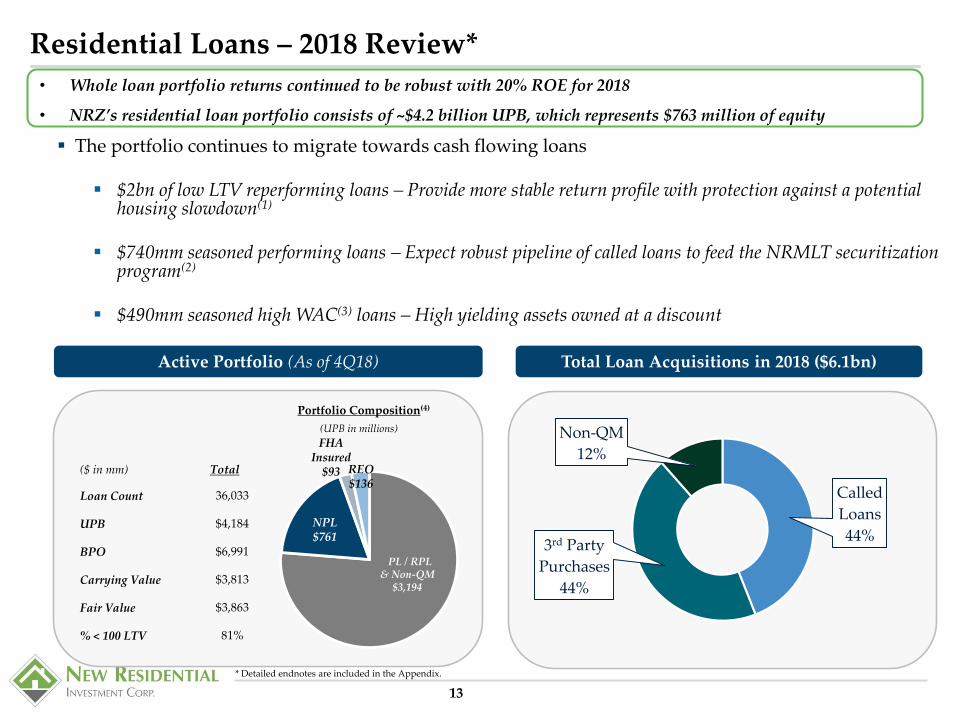
Residential Loans – 2018 Review*
• Whole loan portfolio returns continued to be robust with 20% ROE for 2018
• NRZ’s residential loan portfolio consists of ~$4.2 billion UPB, which represents $763 million of equity
13
The portfolio continues to migrate towards cash flowing loans
$2bn of low LTV reperforming loans – Provide more stable return profile with protection against a potential housing slowdown(1)
$740mm seasoned performing loans – Expect robust pipeline of called loans to feed the NRMLT securitization program(2)
$490mm seasoned high WAC(3) loans – High yielding assets owned at a discount
Active Portfolio (As of 4Q18)
(UPB in millions)
($ in mm) Total
Loan Count 36,033
UPB $4,184
BPO $6,991
Carrying Value $3,813
Fair Value $3,863
% < 100 LTV 81%
Portfolio Composition(4)
NPL$761
PL / RPL & Non-QM
$3,194
FHA Insured
$93 REO$136
Called
Loans
44%3rd Party
Purchases
44%
Non-QM
12%
Total Loan Acquisitions in 2018 ($6.1bn)
* Detailed endnotes are included in the Appendix.

New Residential – Loan Securitization Platform
NRZ Continues to be a strong issuer in the market
14
January 2018
CounterpartyWells, BAML
$726.5 Million
Mortgage Securitization NRMLT 2018-1
May 2018
CounterpartyWells, BAML
$435.3 Million
Mortgage Securitization NRMLT 2018-2
June 2018
CounterpartyBAML, CS
$692.2 Million
Mortgage Securitization NRMLT 2018-RPL1
August 2018
CounterpartyWells, BAML
$658.5 Million
Mortgage Securitization NRMLT 2018-3
October 2018
Mortgage Securitization NRZT 2018-NQM1
CounterpartyCS, Nomura
$310.7 Million
November 2018
CounterpartyJPM, Amherst
$406.0 Million
Mortgage Securitization NRMLT 2018-5
October 2018
CounterpartyCS, JPM
$599.8 Million
Mortgage Securitization NRMLT 2018-4
January 2019
Mortgage Securitization 2019-NQM1
CounterpartyCS, Nomura
$294.5 Million
NRZ issued $3.8bn in mortgage securitizations in 2018
Strength in the NRMLT shelf supports NRZ’s call rights strategy and non-QM origination as well as
opportunistic whole loan acquisitions(1)
Non-QM Loans Reperforming Loans
Called Loans
(1) Based on management’s current views and estimates. See “Disclaimers” at the beginning of this Presentation for more information on forward-looking statements.

15
Portfolio Characteristics (3) Continue to Lower Advances & Improve Financing
NRZ’s Servicer Advance balance Decreasing(1)
87% financed with fixed rate debt
Outstanding advance balance of $3.6 billion is financed with $3.2 billion of debt, 88% LTV and a 3.3% interest rate (1)
During 4Q 2018, NRZ continued to focus on improving financing and lowering advance balances
Continue to work with advance lenders to extend maturities and expect potential future upside as advance balances continue to decline (2)
*All data as of December 31, 2018, unless otherwise stated. In January 2018, as part of the Company’s previously announced MSR transfer agreement with Ocwen, NRZ paid Ocwen an approximately $280 million restructuring fee to obtain the remaining rights to MSRs on the legacy Non-Agency MSR portfolio totaling $87 billion UPB.As a result, the HLSS Advances are no longer classified as Servicer Advance Investments. Detailed endnotes are included in the Appendix.
Servicer Advances*
Advance Purchaser
HLSS SLS Total
Servicer (NSM) (Ocwen) (SLS)
UPB ($Bn) $39 $88 $1 $128Bn
Adv Balance $0.6 $3.0 $0.02 $3.6Bn
Adv / UPB 1.5% 3.4% 1.5% 2.8%
Debt $0.6 $2.6 $0.02 $3.2Bn
Gross LTV 88% 87% 86% 88%
Capacity $0.7 $2.7 $0.03 $3.4Bn
Maturity 2/20-3/21 3/19-12/21 11/19 3/19-12/21
Interest Rate 3.1% 3.3% 4.6% 3.3%
38% 87%% of fixed rate advance debt
Dec 31, 2015 Dec 31, 2018
$7.6 Bn
$7.2 Bn
$6.6 Bn$6.3 Bn
$5.9 Bn
$5.2 Bn
$4.8 Bn
$4.3 Bn$4.1 Bn $4.1 Bn
$3.8 Bn $3.7 Bn $3.6 Bn
Q4 '15 Q1 '16 Q2 '16 Q3 '16 Q4 '16 Q1 '17 Q2 '17 Q3 '17 Q4'17 Q1'18 Q2'18 Q3'18 Q4'18
5% 55%% of advance debt with maturity ≥ 2 year

• Life-to-date IRR of 86% (combination of distributions and refinancing proceeds)
• Life-to-date profit of $576 million
• + $691M of Distributions Received + $218M of Asset Value(2) - $333M of Equity Investment = $576M Life-to-date NRZ Profit
$1.7Bn Refinancing: Completed a $1.7 billion refinancing of the SpringCastle securitization,
providing ~$23 million of liquidity
16
Consumer Loans SpringCastle Investment -
NRZ’s Ownership
%
NRZ’sEquity
Contribution
NRZDistributionReceived (1)
CurrentAssetValue (2)
LTDIRR
30% ($241M) - -- --
30% -- +$462M -- 70%
54% ($56M) +$65M -- 88%
54% -- +$50M -- 94%
54% ($36M) +$114M $218M 86%
54% ($333M) +$691M $218M 86%
Initial Investment: Invested $241 million for a 30% interest in SpringCastle JV’s $3.9 billion
UPB consumer loan portfolio
Increased Ownership Interest: Invested an additional $56 million to increase its interest in
SpringCastle JV, from 30% to ~54%
$2.6Bn Refinancing: Completed a $2.6 billion asset backed secured refinancing of the $2.7
billion UPB consumer portfolio
Total Portfolio
(UPB)
Avg.Charge-Off
Rate30+ DQ
$3.9Bn 12.0% 10.6%
$2.7Bn 5.5% 8.5%
$2.0Bn 5.6% 7.0%
$1.7Bn 5.3% 7.4%
$1.0Bn 5.3% 6.7%
NRZ’s Investment Interest Portfolio Overview
+ $691M of Distributions Received + $218M of Asset Value(2) - $333M of Equity Investment = $576M Life-to-date NRZ Profit
1) Includes cumulative equity distributions between periods.2) Asset value as of December 31, 2018. Represents market value of retained bonds owned by NRZ and market value of NRZ’s equity portion of the Oct 2016 securitization.3) Represents NRZ’s purchase of additional SpringCastle bonds in January 2017.
Performance Since $1.7 Billion Refinancing(Nov 2016 to December 2018)
April2013
Oct2014
March2016
Oct2016
(3)

Locked in fixed rate warehouse financing - obtained an all-in financing rate of 4% for duration of investment
To date, the Consortium successfully securitized $2.9 billion of Prosper loans
The Consortium earns warrants to purchase shares of Prosper equity as loans are purchased on a forward flow basis
As of December 31, 2018, the Consortium earned 87% of its expected warrants
At the conclusion of April 2019, NRZ will own warrants in Prosper, representing approximately 7% of Prosper, if exercised(1)
17
Consumer Loans*Prosper Investment
Overview of Current Portfolio (As of 4Q18) (2)
# of Loans Cur Balance WALA GWAC FICO % Current 30+DQ IRR Total Equity
NRZ’s Portfolio 5,976 $36M 26.3 14.2% 718 93.8% 5.6% +~14% $12M
Consortium 18,698 $235M 3.1 14.2% 717 99.0% 0.8% +20% $38M
TOTAL 24,674 $271M 6.1 14.2% 717 98.3% 1.4% +20% $50M
Sept – Nov 2016
NRZ’s Initial Prosper Loan Purchase:NRZ acquires $177 million of consumer loans from Prosper
Feb 2017
NRZ Joined 4-Member Consortium: Consortium agrees to purchase up to $5bn of unsecured consumer loans on a forward flow basis (term of 24 months) from Prosper
As of 4Q18
Consortium Acquired ~$3.33Bn of Loans from Prosper: Consortium purchased flow from Prosper on a monthly basis
Since May 2017
$2.9Bn in Loan Securitizations: Consortium successfully securitized $2.9bn of Prosper loans through three securitization deals
*Detailed endnotes are included in the Appendix. Note that NRZ holds a 25% interest in the Consortium, therefore the Company holds a 25% interest in the Consortium’s portfolio and balances.
• NRZ is part of a 4-member Consortium that has acquired approximately $3.33 billion of unsecured consumer loans
from Prosper Marketplace (“Prosper”)
• Life to date IRR greater than 20% - in line with underwriting expectations of 15% to 20%(1)

18
Shellpoint
Originations 2018 Volume by Quarter ($ Thousands)
Shellpoint adds servicing, mortgage origination, recapture and ancillary revenue capabilities
(formerly known as NewPenn Financial)
Significantly increased recapture capabilities in 2018
130 professionals now dedicated to recapture
Added 100 professionals in 2018, increasing team by over 300% from start of year
Mortgage origination increased from $6.4bn in 2017 to $7.2bn FY 2018 and projected 2019 growth to approximately $10-$15bn(1)
Non-QM mortgage origination increased from $20mm in 1Q 2018 to $380mm in 4Q 2018.
SMS provides third party servicing to 30 third party clients including banks, GSEs, hedge funds and other whole loan investors.
SMS third party servicing increased 33% in 2018
0
500
1,000
1,500
2,000
Q1 2018 Q2 2018 Q3 2018 Q4 2018
Recapture Non-QM Other
SMS Servicing UPB by Quarter ($ Billions)
0
50
100
150
Q4 2017 Q1 2018 Q2 2018 Q3 2018 Q4 2018
SMS 3rd Party Servicing Total SMS Servicing
(1) Based on management’s current views and estimates. See “Disclaimers” at the beginning of this Presentation for more information on forward-looking statements.

Economy Remains Strong
U.S. GDP, job growth and consumer confidence all remain healthy
Rates are still expected to rise moderately in 2019; housing market projected to remain stable into 2020
Increased market volatility = continued opportunities for investment Targeted hedges for portfolio to manage overall interest rate exposure
Asset Class Impact given current and expected market conditions: Negative Neutral Positive
MSRs(Full & Excess)
Non-Agency Securities
& Call Rights
95% of Legacy Non-Agency securities portfolio (2) is floating rate Higher interest
income as rates rise
Declining delinquencies = Potential opportunity to accelerate call strategy
Residential & Consumer Loans
Limited interest rate sensitivity Portfolio mostly seasoned borrowers
Continued strong economy = Better performance
Servicer Advances
Balances continue to decline (down 2.0% from Q3 ’18, down 12.6% from Q4 ’17)
Strong economy Projected moderate home price appreciation Lower delinquencies
Close coordination with subservicers Lower advance balances through loss mitigation
Stable / rising interest rates Fewer refinancings Stability for MSR portfolio
Strong economy Lower delinquencies Stable value for MSR portfolio
Changing interest rates offset by mostly fixed rate MSR financing
Recapture Protects against lower interest rates and higher prepayment speeds
*Detailed endnotes are included in the Appendix.
19
What Does it all Mean for New Residential?*(1)

Wrap Up - Maintaining Strong Track Record & Performance*
20
Expect to continue executing on key strategic initiatives with the goal of generating attractive returns for shareholders(1)
NRZ – Selected Key Milestones
Apr’15 $1.4Bn Acquisition of HLSS
2015
2Q15
FY 2015
3Q16
2016
Nov’ 17
FY 2017
FY 2016
TODAY
Call rights portfolio totaled ~30% of Non-Agency mortgage market
Deployed ~$2.2Bn
~7% Growth in BV
Dividend up 21%
Became (i) qualified to own MSRs in all 50 U.S. states and (ii) an approved Fannie Mae & Freddie Mac Servicer and FHA Lender
Agreements to acquire Shellpoint (In-house servicing & origination)
Deployed ~$3.3Bn
2 dividend increases
Call volume increased ~290% compared to full year 2016 (3)
Deployed ~$1.5Bn
44% Total Return (2)
~7% Growth in BV
*Detailed endnotes are included in the Appendix.
3Q18 Closed Shellpoint Acquisition (In-house servicing & origination)
1Q18 & 2Q18 Acquired ~$54Bn UPB of MSRs
4Q18 First Non-QM Securitization
2019 Outlook & Beyond(1)
• Housing Market $27 Trillion(4)
• $16 trillion of equity and $11 trillion of debt
• The world is changing
• GSE reform – may provide opportunities for private sector
• As mortgage originators and non‐bank servicers continue to consolidate, NRZ is well positioned to acquire assets
• Continue to focus on counterparty risk
• Focus on “entire pie” - maximize value by offering ancillary services

Appendices
1) Financial Statements
2) GAAP Reconciliation & Endnotes

1) Financial Statements
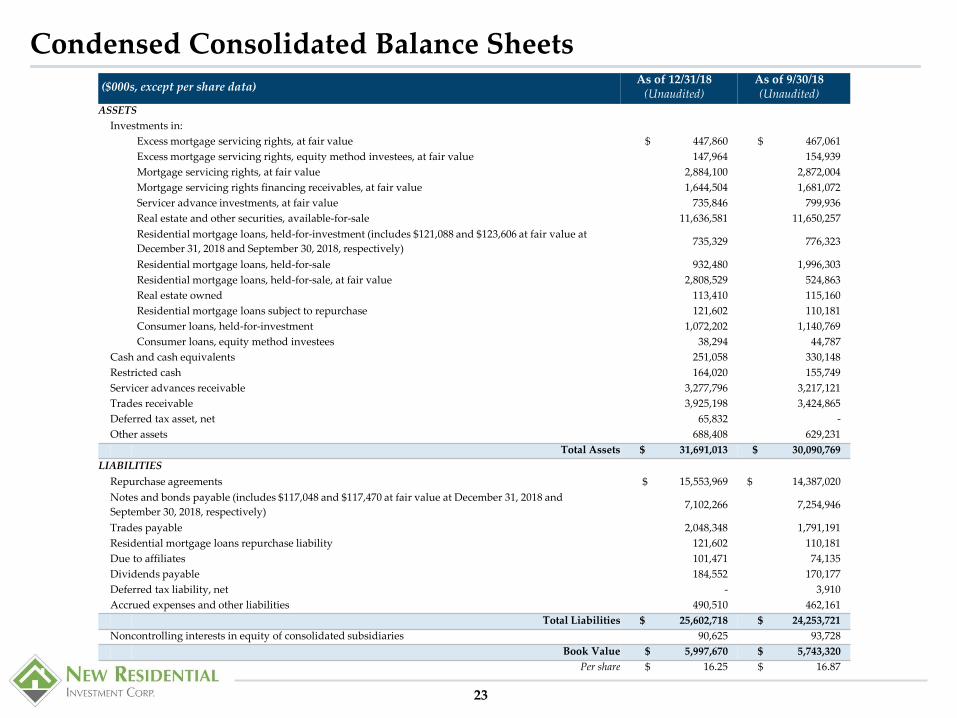
Condensed Consolidated Balance Sheets
($000s, except per share data)As of 12/31/18
(Unaudited)As of 9/30/18(Unaudited)
ASSETS
Investments in:
Excess mortgage servicing rights, at fair value $ 447,860 $ 467,061
Excess mortgage servicing rights, equity method investees, at fair value 147,964 154,939
Mortgage servicing rights, at fair value 2,884,100 2,872,004
Mortgage servicing rights financing receivables, at fair value 1,644,504 1,681,072
Servicer advance investments, at fair value 735,846 799,936
Real estate and other securities, available-for-sale 11,636,581 11,650,257
Residential mortgage loans, held-for-investment (includes $121,088 and $123,606 at fair value at
December 31, 2018 and September 30, 2018, respectively)735,329 776,323
Residential mortgage loans, held-for-sale 932,480 1,996,303
Residential mortgage loans, held-for-sale, at fair value 2,808,529 524,863
Real estate owned 113,410 115,160
Residential mortgage loans subject to repurchase 121,602 110,181
Consumer loans, held-for-investment 1,072,202 1,140,769
Consumer loans, equity method investees 38,294 44,787
Cash and cash equivalents 251,058 330,148
Restricted cash 164,020 155,749
Servicer advances receivable 3,277,796 3,217,121
Trades receivable 3,925,198 3,424,865
Deferred tax asset, net 65,832 -
Other assets 688,408 629,231
Total Assets $ 31,691,013 $ 30,090,769
LIABILITIES
Repurchase agreements $ 15,553,969 $ 14,387,020
Notes and bonds payable (includes $117,048 and $117,470 at fair value at December 31, 2018 and
September 30, 2018, respectively)7,102,266 7,254,946
Trades payable 2,048,348 1,791,191
Residential mortgage loans repurchase liability 121,602 110,181
Due to affiliates 101,471 74,135
Dividends payable 184,552 170,177
Deferred tax liability, net - 3,910
Accrued expenses and other liabilities 490,510 462,161
Total Liabilities $ 25,602,718 $ 24,253,721
Noncontrolling interests in equity of consolidated subsidiaries 90,625 93,728
Book Value $ 5,997,670 $ 5,743,320
Per share $ 16.25 $ 16.87
23

Condensed Consolidated Income Statements
24
($ 000s)
3 Months EndedDecember 31, 2018
(Unaudited)
3 Months EndedSeptember 30, 2018
(Unaudited)
12 Months EndedDecember 31, 2018
(Unaudited)
12 Months EndedDecember 31, 2017
(Unaudited)
Interest Income $ 451,321 $ 425,524 $ 1,664,223 $ 1,519,679
Interest Expense 185,324 162,806 606,433 460,865Net Interest Income 265,997 262,718 1,057,790 1,058,814
ImpairmentOther-than-temporary impairment (OTTI) on securitiesValuation and loss provision (reversal) on loans and real estate owned (REO)
6,827 32,488
3,889 5,471
30,01760,624
10,33475,758
Net Interest Income after impairment
39,315
226,682
9,360
253,358
90,641
967,149
86,092
972,722Servicing revenue, net (10,189) 175,355 528,595 424,349
Gain on sale of originated mortgage loans, net 43,285 45,732 89,017 -
Other IncomeChange in fair value of investments in excess MSRs (2,945) (4,744) (58,656) 4,322
Change in fair value of investments in excess MSRs, equity method investees 2,733 3,396 8,357 12,617
Change in fair value of investments in mortgage servicing rights financing receivables (32,078) (88,345) 31,550 66,394
Change in fair value of servicer advance investments (2,751) (5,353) (89,332) 84,418Change in fair value of investments in residential mortgage loans 73,515 - 73,515 -Gain (loss) on settlement of investments, net (2,222) (11,893) 103,842 10,310
Earnings from investments in consumer loans, equity method investees (1,540) 4,555 10,803 25,617
Other income (loss), net (163,383) 19,086 (124,336) 4,108(128,671) (83,298) (44,257) 207,786
Operating ExpensesGeneral and administrative expenses 92,410 98,587 231,579 67,159Management fee to affiliate 16,567 15,464 62,594 55,634Incentive compensation to affiliate 29,731 23,848 94,900 81,373Loan servicing expense 9,938 11,060 43,547 52,330Subservicing expense 41,081 43,148 176,784 166,081
189,727 192,107 609,404 422,577
Income Before Income Taxes (58,620) 199,040 931,100 1,182,280
Income tax (benefit) expense (67,474) 3,563 (73,431) 167,628
Net Income $ 8,854 $ 195,477 $ 1,004,531 $ 1,014,652
Noncontrolling Interests in Income of Consolidated Subsidiaries 8,506 10,869 40,564 57,119
Net Income Attributable to Common Stockholders $ 348 $ 184,608 $ 963,967 $ 957,533

2) GAAP Reconciliation & Endnotes

Management uses Core Earnings, which is a Non-GAAP measure, as one measure of operating performance.
Please see next slide for the definition of Core Earnings.
26
($000s, except per share data) 4Q 2018 3Q 2018 FY 2018 FY 2017
Reconciliation of Core EarningsNet income attributable to common stockholders $ 348 $ 184,608 $ 963,967 $ 957,533
Impairment 39,315 9,360 90,641 86,092
Other Income Adjustments:
Other Income
Change in fair value of investments in excess mortgage servicing rights 2,945 4,744 58,656 (4,322)Change in fair value of investments in excess mortgage servicing rights, equity method investees
(2,733) (3,396) (8,357) (12,617)
Change in fair value of investments in mortgage servicing rights financing receivables
(11,066) 39,329 (229,253) (109,584)
Change in fair value of servicer advance investments 2,751 5,353 89,332 (84,418)
Change in fair value of investments in residential mortgage loans (73,515) - (73,515) -
(Gain) loss on settlement of investments, net 2,222 11,893 (103,842) (10,310)
Unrealized (gain) loss on derivative instruments 141,543 (24,299) 113,558 2,190
Unrealized (gain) loss on other ABS 1,718 (7,197) (10,283) (2,883)
(Gain) loss on transfer of loans to REO (2,910) (6,119) (19,519) (22,938)
(Gain) loss on transfer of loans to other assets 329 1,528 1,977 (488)
(Gain) loss on Excess MSR recapture agreements 4,278 (987) (979) (2,384)
(Gain) loss on Ocwen common stock 15,515 145 10,860 (5,346)
Other (income) loss 2,910 17,843 28,722 27,741
Total Other Income Adjustments 83,987 38,837 (142,643) (225,359)
Other Income and impairment attributable to non-controlling interests (5,159) (4,633) (22,247) (30,416)
Change in fair value of investments in mortgage servicing rights 160,947 (44,192) (65,670) (155,495)
(Gain) loss on settlement of mortgage loan origination derivative instruments (3,991) 2,757 (1,234) -
Gain on securitization of originated mortgage loans 8,757 - 8,757 -
Non-capitalized transaction related expenses 3,162 5,274 21,946 21,723
Incentive compensation to affiliate 29,731 23,848 94,900 81,373
Deferred taxes (67,374) (1,865) (80,054) 168,518
Interest income on residential mortgage loans, held for sale 600 5,906 13,374 13,623
Limit on RMBS discount accretion related to called deals (45,473) (2,914) (58,581) (28,652)
Adjust consumer loans to level yield 734 (6,760) (21,181) (41,250)
Core earnings of equity method investees:Excess mortgage servicing rights
2,669 4,468 13,183 13,691
Core Earnings $ 208,253 $ 214,694 $ 815,158 $ 861,381
Net Income Per Diluted Share $ 0.00 $ 0.54 $ 2.81 $ 3.15
Core Earnings Per Diluted Share $ 0.58 $ 0.63 $ 2.38 $ 2.83
Weighted Average Number of Shares of Common Stock Outstanding, Diluted 358,509,094 340,868,403 343,137,361 304,381,388
Unaudited GAAP Reconciliation of Core Earnings

Reconciliation of Non-GAAP MeasuresCore Earnings
We have four primary variables that impact our operating performance: (i) the current yield earned on our investments, (ii) the interest expense under the debt incurred to finance our investments, (iii) our operating expenses and taxes and (iv) our realized and unrealized gains or losses, including any impairment, on our investments. “Core earnings” is a non-GAAP measure of our operating performance, excluding the fourth variable above and adjusts the earnings from the consumer loan investment to a level yield basis. Core earnings is used by management to evaluate our performance without taking into account: (i) realized and unrealized gains and losses, which although they represent a part of our recurring operations, are subject to significant variability and are generally limited to a potential indicator of future economic performance; (ii) incentive compensation paid to our Manager; (iii) non-capitalized transaction-related expenses; and (iv) deferred taxes, which are not representative of current operations.
Our definition of core earnings includes accretion on held-for-sale loans as if they continued to be held-for-investment. Although we intend to sell such loans, there is no guarantee that such loans will be sold or that they will be sold within any expected timeframe. During the period prior to sale, we continue to receive cash flows from such loans and believe that it is appropriate to record a yield thereon. In addition, our definition of core earnings excludes all deferred taxes, rather than just deferred taxes related to unrealized gains or losses, because we believe deferred taxes are not representative of current operations. Our definition of core earnings also limits accreted interest income on RMBS where we receive par upon the exercise of associated call rights based on the estimated value of the underlying collateral, net of related costs including advances. We created this limit in order to be able to accrete to the lower of par or the net value of the underlying collateral, in instances where the net value of the underlying collateral is lower than par. We believe this amount represents the amount of accretion we would have expected to earn on such bonds had the call rights not been exercised.
Our investments in consumer loans are accounted for under ASC No. 310-20 and ASC No. 310-30, including certain non-performing consumer loans with revolving privileges that are explicitly excluded from being accounted for under ASC No. 310-30. Under ASC No. 310-20, the recognition of expected losses on these non-performing consumer loans is delayed in comparison to the level yield methodology under ASC No. 310-30, which recognizes income based on an expected cash flow model reflecting an investment’s lifetime expected losses. The purpose of the Core Earnings adjustment to adjust consumer loans to a level yield is to present income recognition across the consumer loan portfolio in the manner in which it is economically earned, avoid potential delays in loss recognition, and align it with our overall portfolio of mortgage-related assets which generally record income on a level yield basis. With respect to consumer loans classified as held-for-sale, the level yield is computed through the expected sale date. With respect to the gains recorded under GAAP in 2014 and 2016 as a result of a refinancing of the debt related to our investments in consumer loans, and the consolidation of entities that own our investments in consumer loans, respectively, we continue to record a level yield on those assets based on their original purchase price.
While incentive compensation paid to our Manager may be a material operating expense, we exclude it from core earnings because (i) from time to time, a component of the computation of this expense will relate to items (such as gains or losses) that are excluded from core earnings, and (ii) it is impractical to determine the portion of the expense related to core earnings and non-core earnings, and the type of earnings (loss) that created an excess (deficit) above or below, as applicable, the incentive compensation threshold. To illustrate why it is impractical to determine the portion of incentive compensation expense that should be allocated to core earnings, we note that, as an example, in a given period, we may have core earnings in excess of the incentive compensation threshold but incur losses (which are excluded from core earnings) that reduce total earnings below the incentive compensation threshold. In such case, we would either need to (a) allocate zero incentive compensation expense to core earnings, even though core earnings exceeded the incentive compensation threshold, or (b) assign a “pro forma” amount of incentive compensation expense to core earnings, even though no incentive compensation was actually incurred. We believe that neither of these allocation methodologies achieves a logical result. Accordingly, the exclusion of incentive compensation facilitates comparability between periods and avoids the distortion to our non-GAAP operating measure that would result from the inclusion of incentive compensation that relates to non-core earnings.
With regard to non-capitalized transaction-related expenses, management does not view these costs as part of our core operations, as they are considered by management to be similar to realized losses incurred at acquisition. Non-capitalized transaction-related expenses are generally legal and valuation service costs, as well as other professional service fees, incurred when we acquire certain investments, as well as costs associated with the acquisition and integration of acquired businesses.
As of the third quarter of 2018, as a result of the Shellpoint Acquisition, we, through its wholly owned subsidiary, New Penn, originated conventional, government-insured and nonconforming residential mortgage loans for sale and securitization. In connection with the transfer of loans to the GSEs or mortgage investors, we report realized gains or losses on the sale of originated residential mortgage loans and retention of mortgage servicing rights, which we believe is an indicator of performance for the Servicing and Origination segment and therefore included in core earnings. Realized gains or losses on the sale of originated residential mortgage loans had no impact on core earnings in any prior period, but may impact core earnings in future periods.
Management believes that the adjustments to compute “core earnings” specified above allow investors and analysts to readily identify and track the operating performance of the assets that form the core of our activity, assist in comparing the core operating results between periods, and enable investors to evaluate our current core performance using the same measure that management uses to operate the business. Management also utilizes core earnings as a measure in its decision-making process relating to improvements to the underlying fundamental operations of our investments, as well as the allocation of resources between those investments, and management also relies on core earnings as an indicator of the results of such decisions. Core earnings excludes certain recurring items, such as gains and losses (including impairment as well as derivative activities) and non-capitalized transaction-related expenses, because they are not considered by management to be part of our core operations for the reasons described herein. As such, core earnings is not intended to reflect all of our activity and should be considered as only one of the factors used by management in assessing our performance, along with GAAP net income which is inclusive of all of our activities.
The primary differences between core earnings and the measure we use to calculate incentive compensation relate to (i) realized gains and losses (including impairments), (ii) non-capitalized transaction-related expenses and (iii) deferred taxes (other than those related to unrealized gains and losses). Each are excluded from core earnings and included in our incentive compensation measure (either immediately or through amortization). In addition, our incentive compensation measure does not include accretion on held-for-sale loans and the timing of recognition of income from consumer loans is different. Unlike core earnings, our incentive compensation measure is intended to reflect all realized results of operations. The Gain on Remeasurement of Consumer Loans Investment was treated as an unrealized gain for the purposes of calculating incentive compensation and was therefore excluded from such calculation.
27

Endnotes to Slide 21) Based upon management's current views and estimates, and actual results may vary materially. See “Disclaimers” at the beginning of this Presentation for more
information on forward-looking statements. All data as of December 31, 2018 unless otherwise indicated.
2) MSRs UPB as of December 31, 2018. Includes Excess MSRs and Full MSRs.
3) Call rights UPB as of December 31, 2018. Our call rights may be materially lower than the estimates in this Presentation and there can be no assurance that we will be able to execute on this pipeline of callable deals in the near term, on the timeline presented above, or at all, or that callable deals will be economically favorable. The economic returns from this strategy could be adversely affected by a rise in interest rates and are contingent on the level of delinquencies and outstanding advances in each transaction, fair market value of the related collateral and other economic factors and market conditions. We may become subject to claims and legal proceedings, including purported class-actions, in the ordinary course of our business, challenging whether our loan servicing practices and other aspects of our business comply with applicable laws, agreements and regulatory requirements or challenging our right to exercise our call rights. Call rights are usually exercisable when current loan balance is equal to, or lower than, 10% of its original balance. See “Disclaimers” at the beginning of this Presentation for more information on forward-looking statements.
4) Dividend yield as of February 11, 2019.
28

Endnotes to Slide 4
29
1) Net Investment & Targeted Lifetime Net Yield as of 12/31/2018.
MSRs: Excess MSRs - Net Investment of $307 million includes (A) $595 million investment in 12/31/18 Legacy NRZ Excess MSRs, and (B) $10 million of restricted cash and other assets, net of debt and other liabilities of $298 million (debt issued on the NRZ Agency Excess MSR portfolio). At 12/31/18 Net Investment excludes Excess MSR Cash (included in Cash as of 12/31/18). MSRs - Net Investment of $2,539 million includes $9,017 million of total assets, net of debt and other liabilities of $6,470 million and non-controlling interests in the portfolio of $8 million; includes Originations. Servicer Advances - Net Investment of $158 million includes (A) $152 million net investment in AP LLC Advances, with $746million of total assets, net of debt and other liabilities of $542 million and non-controlling interests in the portfolio of $52 million and (B) $6 million net investment in SLS advances, with $24 million of total assets, net of debt and other liabilities of $18 million. At 12/31/18 Net Investment excludes Servicer Advance Cash (included in Cash as of 12/31/18).
Residential Securities & Call Rights: Net Investment of $2,017 million includes (A) $1,706 million net investment in Non-Agency RMBS, with $9,033 million of assets, net of debt and other liabilities of $7,327 million, (B) $311 million in Agency RMBS, with $6,711 million of assets (including $3,923 million of Open Trades Receivable), net of debt and other liabilities of $6,400 million (including $2,048 million of Open Trades Payable) and (C) $0.3 million net investment in Call Rights. At 12/31/18, Net Investment excludes Residential Securities Cash (included in Cash as of 12/31/18). Targeted Lifetime Net Yield represents the targeted future IRR over a weighted average life of 6.9 years for Non-Agency RMBS, assuming actual and targeted leverage, and represents the IRR over a weighted average life of 8.1 years for Agency RMBS.
Residential Loans: Net Investment of $763 million includes (A) $741 million net investment in Residential Loans & REO, with $3,895 million of total assets, net of debt and other liabilities of $3,154 million, (B) $21 million net investment in EBOs, with $59 million of total assets, net of debt and other liabilities of $38 million and (C) $0.9 million net investment in Reverse Loans, with $10 million of total assets, net of debt and other liabilities of $9 million. At 12/31/18 Net Investment excludes Residential Loan Cash (included in Cash as of 12/31/18). Targeted Lifetime Net Yield represents the IRR over a weighted average life of 9.1 years.
Consumer Loans: Net Investment of $108 million includes $1,186 million of total assets, net of debt and other liabilities of $1,047 million and non-controlling interests in the portfolio of $31 million. At 12/31/18 Net Investment excludes Consumer Loan Cash (included in Cash as of 12/31/18). Targeted Lifetime Net Yield represents the IRR over a weighted average life of 3.5 years.
Cash: $251 million of total cash and cash equivalents as of 12/31/18.
2) MSRs UPB as of December 31, 2018. Includes Excess MSRs and Full MSRs.
3) Call rights UPB as of December 31, 2018. Our call rights may be materially lower than the estimates in this Presentation and there can be no assurance that we will be able to execute on this pipeline of callable deals in the near term, on the timeline presented above, or at all, or that callable deals will be economically favorable. The economic returns from this strategy could be adversely affected by a rise in interest rates and are contingent on the level of delinquencies and outstanding advances in each transaction, fair market value of the related collateral and other economic factors and market conditions. We may become subject to claims and legal proceedings, including purported class-actions, in the ordinary course of our business, challenging whether our loan servicing practices and other aspects of our business comply with applicable laws, agreements and regulatory requirements or challenging our right to exercise our call rights. Call rights are usually exercisable when current loan balance is equal to, or lower than, 10% of its original balance. See “Disclaimers” at the beginning of this Presentation for more information on forward-looking statements.
Endnotes to Slides 5, 6, 7 & 8Endnotes to Slide 5:
1) Book value per share for 2013, 2014, 2015, 2016, 2017 and 2018 are as of year-end.
2) Market cap for 2013, 2014, 2015, 2016, 2017 and 2018 are as of year-end.
3) In January 2018, NRZ purchased from Ocwen $110 billion UPB of economic rights to MSRs. The transfer of the legal ownership of the MSRs has commenced and NRZ and Ocwen expect to transfer the remaining MSRs to New Residential in 1Q 2019 upon receiving certain third party consents. See “Disclaimers” at the beginning of this Presentation for more information on forward-looking statements.
Endnotes to Slide 6:
1) Mortgage rates are based on the Freddie Mac US Mortgage Market Survey: 30 Year Homeowner Commitment National.
2) Refinanceable assumes that there would be a 50bp incentive to refinance. Source: Barclays.
3) Source: MIAC GSA Indices. The value of the servicing rights are frequently expressed as the multiple of the service fee. For example for a FNMA loan that has 25 bps of interest, its value can be expressed as a 4x multiple which represents a price of 100 bps of the UPB.
Endnotes to Slide 7:
1) MSR UPB as of December 31, 2018. Includes Excess MSRs and Full MSRs.
2) Source: Inside Mortgage Trends – Volume 23 – Number 2 dated January 25, 2019.
3) Based upon management's current views and estimates, and actual results may vary materially. See “Disclaimers” at the beginning of this Presentation for more information on forward-looking statements. All data as of December 31, 2018 unless otherwise indicated.
4) See “Abbreviations” in Appendix for more information.
5) “Total” columns reflect weighted average calculations.
Endnotes to Slide 8:
1) Based upon management's current views and estimates. See “Disclaimers” at the beginning of this Presentation for more information on forward-looking statements. All data as of December 31, 2018 unless otherwise indicated.
2) As of December 31, 2018; our unused borrowing capacity consists of $245 million of undrawn funds and an additional $100 million that is available to us if we have additional eligible collateral to pledge and meet other borrowing conditions as set forth in the applicable agreements. See “Disclaimers” at the beginning of this Presentation for more information on forward-looking statements.
3) Based on management’s current views and estimates. See “Disclaimers” at the beginning of this Presentation for more information on forward-looking statements.
30

Endnotes to Slides 9, 10 & 11Endnotes to Slide 9:
(1) Source: Inside Mortgage Finance. “Top 50 Mortgage Servicing Participants: 4Q18” published February 1, 2019
(2) Based on management’s current views and estimates. See “Disclaimers” at the beginning of this Presentation for more information on forward-looking statements.
Endnotes to Slide 10:
1) Our call rights may be materially lower than the estimates in this Presentation and there can be no assurance that we will be able to execute on this pipeline of callable deals in the near term, on the timeline presented above, or at all, or that callable deals will be economically favorable. The economic returns from this strategy could be adversely affected by a rise in interest rates and are contingent on the level of delinquencies and outstanding advances in each transaction, fair market value of the related collateral and other economic factors and market conditions. We may become subject to claims and legal proceedings, including purported class-actions, in the ordinary course of our business, challenging whether our loan servicing practices and other aspects of our business comply with applicable laws, agreements and regulatory requirements or challenging our right to exercise our call rights. Call rights are usually exercisable when current loan balance is equal to, or lower than, 10% of its original balance. See “Disclaimers” at the beginning of this Presentation for more information on forward-looking statements.
2) Size of Legacy Non-Agency mortgage market is approximately $342 billion. Source: Webbs Hill as of December 31, 2018.
3) Loan portfolio percentage increase is calculated based on the total UPB of the NRZ’s loan portfolio as of 4Q18, totaling $4.2 billion, compared to the total UPB of the NRZ’s loan portfolio as of 4Q17, totaling $2.9 billion.
4) Based on management’s current views and estimates, and actual results may vary materially. See “Disclaimers” at the beginning of this Presentation for more information on forward-looking statements.
Endnotes to Slide 11:
1) Our call rights may be materially lower than the estimates in this Presentation and there can be no assurance that we will be able to execute on this pipeline of callable deals in the near term, on the timeline presented above, or at all, or that callable deals will be economically favorable. The economic returns from this strategy could be adversely affected by a rise in interest rates and are contingent on the level of delinquencies and outstanding advances in each transaction, fair market value of the related collateral and other economic factors and market conditions. We may become subject to claims and legal proceedings, including purported class-actions, in the ordinary course of our business, challenging whether our loan servicing practices and other aspects of our business comply with applicable laws, agreements and regulatory requirements or challenging our right to exercise our call rights. Call rights are usually exercisable when current loan balance is equal to, or lower than, 10% of its original balance. See “Disclaimers” at the beginning of this Presentation for more information on forward-looking statements.
2)Based on management’s current views and estimates, and actual results may vary materially. See “Disclaimers” at the beginning of this Presentation for more information on forward-looking statements.
31

Endnotes to Slides 12, 13 & 15Endnotes to Slide 12:1)Represents principal and interest-paying securities, excludes bonds backed by consumer loans and new issue securities.
2)“WAC” represents weighted average coupon of underlying loans in the deal and “WALA” represents weighted average loan age.
3)Based on management’s current views and estimates. See “Disclaimers” at the beginning of this Presentation for more information on forward-looking statements.
4)Source: Bank of America US Securitized Products Research and Webbs Hill Advisors.
Endnotes to Slide 13:1)Based on management’s current views and estimates, and actual results may vary materially. See “Disclaimers” at the beginning of this Presentation for more
information on forward-looking statements.
2)Our call rights may be materially lower than the estimates in this Presentation and there can be no assurance that we will be able to execute on this pipeline of callable deals in the near term, on the timeline presented above, or at all, or that callable deals will be economically favorable. The economic returns from this strategy could be adversely affected by a rise in interest rates and are contingent on the level of delinquencies and outstanding advances in each transaction, fair market value of the related collateral and other economic factors and market conditions. We may become subject to claims and legal proceedings, including purported class-actions, in the ordinary course of our business, challenging whether our loan servicing practices and other aspects of our business comply with applicable laws, agreements and regulatory requirements or challenging our right to exercise our call rights. Call rights are usually exercisable when current loan balance is equal to, or lower than, 10% of its original balance. See “Disclaimers” at the beginning of this Presentation for more information on forward-looking statements.
3)“WAC” represents weighted average coupon of underlying loans in the deal.
4)EBO claims receivables is included in the FHA insured portfolio along with EBO loans.
Endnotes to Slide 15:
1) Represents par value of advances and related debt obligations inclusive of a non-controlling interest ownership of ~27% in the Advance Purchaser portfolio.
2) Based on management’s current views and estimates, and actual results may vary materially. See “Disclaimers” at the beginning of this Presentation for more information on forward-looking statements.
3) “Maturity” dates are expected to be extended but not guaranteed. See “Abbreviations” in the Appendix for more information.
32

Endnotes to Slides 17, 19 & 20Endnotes to Slide 17:
1) Based on management’s current estimates and expectations regarding targeted warehouse and securitization execution, and actual results may vary materially. See “Disclaimers” at the beginning of this Presentation for more information on forward-looking statements.
2) NRZ is one of four Consortium members. NRZ holds a 25% interest in the Consortium, and therefore holds a 25% interest in the Consortium’s portfolio and balances. See “Abbreviations” in the Appendix for more information.
Endnotes to Slide 19:
1) All statements made on this slide are based on current management views and estimates, and actual results may vary materially. See “Disclaimers” at the beginning of this Presentation for more information on forward-looking statements.
2) As of December 31, 2018. Represents a percent of market value of principal and interest-paying securities, excludes consumer loans and new issue securities.
Endnotes to Slide 20:
1) Based on management’s current views and estimates, and actual results may vary materially. See “Disclaimers” at the beginning of this Presentation for more information on forward-looking statements.
2) 2016 Total Return is calculated by dividing the appreciation in NRZ stock price plus dividends, declared by NRZ in 2016, over NRZ’s closing stock price on December 31, 2015.
3) Call volume percentage increase is calculated based on the total UPB NRZ called in 2017, totaling $4.7 billion, compared to the total UPB NRZ called in full year 2016, totaling $1.2 billion UPB.
4) As of January 2019. Source: Federal Reserve Flow of Funds and Urban Institute – “Housing Finance at a Glance – A Monthly Chartbook”.
33

Abbreviations
Abbreviations: This Presentation may include abbreviations, which have the following meanings:
60+ DQ – Percentage of loans that are delinquent by 60 days or more
Age (mths) or Loan Age (mths) – Weighted average number of months loans are outstanding
BPO – Broker’s Price Opinion
BV – Book Value
CDR – Conditional Default Rate
CLTV – Ratio of current loan balance to estimated current asset value
CPR – Constant Prepayment Rate
CRR – Constant Repayment Rate
Cur - Current
Current UPB – UPB as of the end of the current month
DTI – Debt to Income
EBO –Residential Mortgage Loans acquired through the GNMA early buy-out program
Excess MSRs – Monthly interest payments generated by the related Mortgage Servicing Rights (“MSRs”), net of a basic fee required to be paid to the servicer
FHLMC – Freddie Mac / Federal Home Loan Mortgage Corporation
FICO – A borrower’s credit metric generated by the credit scoring model created by the Fair Isaac Corporation
Flow Arrangements – Contractual recurring agreements, often monthly or quarterly, to purchase servicing of newly originated or highly delinquent loans
FNMA – Fannie Mae / Federal National Mortgage Association
GNMA – Ginnie Mae / Government National Mortgage Association
GWAC – Gross Weighted Average Coupon
HPA – Home Price Appreciation
LTD – Life to Date
LTD Cash Flows –Actual cash flow collected from the investment as of the end of the current month
LTV – Loan to Value
NPL – Non-Performing Loans
Original UPB – UPB at time of securitization
PLS – Private Label Securitizations
Proj. Future Cash Flows – Future cash flow projected with the Company’s original underwriting assumptions
QoQ – Quarter-over-quarter
Recapture Rate – Percentage of voluntarily prepaid loans that are refinanced by the servicer
REO – Real Estate Owned
SI – Short Interest
TSO – Total Shares Outstanding
Uncollected Payments – Percentage of loans that missed their most recent payment
UPB – Unpaid Principal Balance
Updated IRR – Internal rate of return calculated based on the cash flow received to date through the current month and the projected future cash flow based on our original underwriting assumptions
U/W LTD – Underwritten life-to-date
34
WA – Weighted Average
WAC – Weighted Average Coupon
WAL – Weighted Average Life to Maturity
WALA – Weighted Average Loan Age
YoY – Year-over-year