quarterly economy tracker
TRANSCRIPT
QUARTERLY ECONOMY TRACKER
(JUL-SEP 2017)
Socio-Economic Research Centre (SERC)
_________________________________________________________________________ This research paper was commissioned and funded by ACCCIM SERC Trust and managed by Socio-Economic Research Centre (operating under SERC Sdn. Bhd.).

Socio-Economic Research Centre (SERC)
Executive Director
Mr. Lee Heng Guie - [email protected]
Head of Research
Ms. Sum Kum Mooi - [email protected]
Researcher
Mr. Goh Kong Jun - [email protected]
Mr. Lee Soon Thye - [email protected]
Administrative and IT Executive
Ms. Vicki Lai Mun Yee - [email protected]

1
QUARTERLY ECONOMY TRACKER (JUL-SEP 2017)
Executive Summary
A. GLOBAL ENVIRONMENT
A broad-based global recovery. Our global growth assessment continues to look favourable. The global economy is rebounding, with both advanced and emerging economies registering improved growth, supported by continued gains in manufacturing, recovering global trade and higher exports as well as firmer commodity prices. The International Monetary Fund (IMF) anticipates the global economy to remain on expansion track, keeping its April’s growth projection of 3.5% in 2017 and 3.6% in 2018.
Global financial markets continued to rise on optimism and confidence. Amid lingering concerns about policy uncertainty and risks as well as periodic bouts of geopolitical tensions, global bond yields though have ticked higher but the levels remained below the peak. Equity markets in advanced economies and emerging markets continued to remain upbeat, signalling continued market optimism about macro prospects and corporate earnings as well as some compression of interest rate spreads. In summary, markets shrug off a number of political and geopolitical impasses.
Accelerating economic activity in advanced and emerging economies. High frequency data, namely purchasing managers’ indices (PMI) for manufacturing and services show continued strength; steadying growth in industrial production and trade; and global chips demand firming up. All these point to continuing expansion of global activity going forward. Growth in the US economy has strengthened, backed by consumer spending and investment. Recovery in eurozone and Japan have firmed up. China’s growth remains resilient, helped by previous policy easing and supply-side reforms. Nevertheless, the rise in debt must be closely watched and contained to prevent systemic risk in China’s financial system.
Will benign inflation derail global central banks’ monetary policy agenda? The soft inflation numbers for the US raises a debate on whether the Federal Reserve (Fed) should continue to tighten interest rates whilst preparing to shrink its balance sheet. We are convinced that the Fed will raise interest rates gradually so as not to disrupt the strength of economic recovery. The Fed has embarked on the winding down of its US$4.5 trillion balance sheet in October, marking a significant policy shift to gradually remove its quantitative easing (QE) program initiated in 2009. The European Central Bank (ECB) has for many months stated that rates will only start to rise well after the horizon of net asset purchases has come to an end. Bank of Japan (BOJ) had pushed back the timing of achieving its inflation target of 2.0% for the sixth time, signalling negative interest rates will remain intact in the foreseeable future.
Medium-term risks still prevalent. Policy uncertainty in advanced economies if prolongs will present a big risk to inflict volatility in financial markets and exchange rates. Rich market valuations raise the likelihood of a market correction should there is a policy misstep or a protracted period of policy uncertainty, which could dampen growth and investors’ confidence. The policy uncertainties and financial volatility are associated with the impact of the Trump’s fiscal stimulus and regulatory, the path of the US monetary policy, the size and pace of the Fed’s balance sheet reduction, negotiations of post-Brexit arrangements, inward-looking policies that hinder global trade and market reforms. Rising geopolitical tensions can also weigh on market confidence and economic growth.

2
B. MALAYSIA’S ECONOMIC PERFORMANCE AND OUTLOOK
Strong economic growth in 1H2017. The Malaysian economy gained strong ground to register real GDP growth of 5.7% yoy in 1H2017 (5.8% in 2Q and 5.6% in 1Q), powered by unrelenting consumer spending, increased private investment, and strong surge in exports. Higher-than-expected growth for two successive quarters were the strongest in two years. We expect the economic expansion to continue, driven by firming domestic demand and exports. We have raised our 2017’s economic growth estimate to 5.5% from 5.0% previously. Bank Negara Malaysia indicated this year’s GDP growth will definitely be revised to above 4.8%, which will be unveiled at the tabling of 2018 Budget on 27 October 2017.
Powered by resilient consumer spending. Despite coping with high cost of living and increased prices, growth in consumer spending held even stronger than first quarter (7.1% in 2Q vs. 6.6% in 1Q) lifted by festive demand spending, improved rural income on high commodity prices, cash handouts as well as special RM1 billion Aidilfitri aid to 2.37 million civil servants and pensioners. With the hosting of SEA Games in Kuala Lumpur and the final tranche of BR1M payment, consumer spending should be held steady, delivering a full-year private consumption growth of 6.8% this year (6.0% in 2016).
Private investment has bounced from the lows. Private investment growth expanded by 7.4% in 2Q, albeit slower compared to 12.9% in 1Q17. This was supported by higher capital spending in services and manufacturing sectors. The export-oriented and domestic-market oriented industries have undertaken capacity expansions, machinery and equipment (M&E) acquisitions and replacements to cater for new orders. In the services sector, investment was supported mainly by expansions in the utilities, healthcare and food & beverages and accommodation sub-sectors. With a 10.0% growth in 1H17, private investment growth is estimated to expand by 9.2% this year (4.3% in 2016).
Most economic sectors register stronger growth. The services, manufacturing and construction sectors continued to deliver higher output growth in 2Q, reflecting resilient domestic demand, robust external demand and the on-going implementation of public infrastructure projects and housing development.
Exports growth momentum to continue, albeit slower in 2H17. Exports have expanded by 21.5% in August and 30.9% in July (20.9% in 1H), underpinned by continued broad-based recovery in global trade and stable commodities prices. Electronics exports were the primary contributor. Better growth prospects for advanced and emerging economies, coupled with positive leads of global semiconductor industry, exports are estimated to grow by 17.5% this year (1.2% in 2016).
Headline inflation has come off from the highs. Even though headline inflation, as measured by the Consumer Price Index (CPI) has retreated to 3.7% in August (3.2% in July) from 4.3% in 2Q and 4.0% in 1Q, households were not convinced that prices of goods and services have increased at a slower pace. Consumers’ real purchasing power continued to shrink as cost-induced price pressures remained elevated. Fuel prices remain a big wild card given the recent run-up in crude oil prices. Headline inflation is estimated to increase by 3.9% in 2017 (2.1% in 2016).

3
Private consumption and investment indicators. Consumers’ purchase of big-ticket item, namely passenger cars contracted marginally by 0.5% in August after a strong increase of 15.6% in July (0.7% in 2Q and 8.9% in 1Q). Loans extended for the purpose of consumption remained stable while imports of consumption goods expanded strongly, albeit slower (17.8% in August vs. 21.8% in July) but much more robust than 1.5% in 2Q and 4.0% in 1Q respectively. Both imports of investment and intermediate goods grow at strong double-digit rates of 12.7% and 25.5% respectively in August (-16.5% and 24.2% respectively in July). Growth in loan applications and approvals moderated sharply in August after registering strong double-digit rates in July while loan disbursements growth expanded higher.
Budget 2018: Focus on future, and digitalisation is a step forward. Malaysia’s economic prospect for 2018 should remain good, supported by still-favourable global growth, which bodes well for exports. The Budget measures, accommodative monetary policy, and the on-going and new implementation of public infrastructure projects should hold up domestic demand. For 2018, real GDP growth is projected to grow by 5.1% vs. estimated 5.5% in 2017.
Domestic interest rates to remain stable at 3.00%. We expect BNM to maintain the overnight policy rate (OPR) at 3.00% this year, supported by steady domestic demand amid high cost-driven inflation pressures. Nevertheless, we think the central bank should prepare the groundwork for a gradual rise in interest rates in 2018 if the economy continues to strengthen.
The Ringgit still facing headwinds. We draw comfort that Bank Negara Malaysia (BNM)’s stabilisation measures have helped to contain the ringgit’s volatility, leading to an appreciation of 6.3% to the US dollar in the first nine months of this year. However, the ringgit will continue to be influenced by external uncertainties associated with the timing and magnitude of Fed’s interest rates normalisation, a gradual winding down of its balance sheet, and the unpredictable geopolitical tensions. The ringgit is expected to be around RM4.20 per US dollar by end-2017 and RM4.10-4.20 per US dollar by end-2018 (RM4.4860 at end-2016).

4
GLOBAL GROWTH REMAINS INTACT
Synchronised improvements across advanced and emerging economies. The International Monetary Fund (IMF) maintained this year’s global growth estimate of 3.5% and 3.6% for 2018. The recovery is broadening across advanced and emerging economies, underpinned by strong global trade recovery, strengthening exports, sustained expansion in manufacturing and services sectors as well as gains in investment. Global equity markets are at record highs, buoyed by market optimism about economic growth prospects and corporate earnings in advanced and emerging economies.
The strong 3.1% annualised qoq US GDP growth in 2Q17, supported by investment and consumption have reassured investors that the US economy is firmly on the path of recovery. Market consensus estimate the severe disruptions caused by hurricanes Harvey, Irma and Maria in the affected regions of Texas and Louisiana are expected to shave 0.3-0.5% pts off 3Q GDP growth. But, as activity resumes and reconstruction efforts get under way, growth will likely rebound. In addition, the fundamental strength of consumer spending, improved labour market condition, and investment are expected to sustain the US economy.
Growth in eurozone was better than expectation and has broadened due to stronger momentum in domestic demand. Private consumption, investment, and exports sustained the Japanese economy. China’s growth is still steadying, underpinned by previous policy easing and supply-side reforms. However, Beijing authorities must not go slow to contain the rise in debt and financial risks amid warnings from global rating agencies.
No let-up in current and forward indicators. The OECD Composite leading indicators show stable growth momentum in major advanced economies and China. Global Purchasing Managers indices (PMI) for manufacturing and services sectors had a good start in the third quarter. Technology-related products and chips ended the second quarter on a strong note. Crude oil prices appear stabilising and gaining traction in recent weeks as the oil market continues to rebalance.
Near-term risks somewhat balanced. We must remain wary about the policy shocks and uncertainties that could temper market confidence as well as affect growth and investment activity. Policy uncertainty will remain in 2018, and the risks include unexpected changes in monetary policies, the financial-sector uncertainty in major economies, as well as geopolitical turmoil. Pressures for protectionism are building up.
Figure 1: Real GDP growth (% YoY)
2015 2016
2017 1Q
2017 2Q
2017e (IMF)
2017e (WB)
2018f (IMF)
2018f (WB)
United States 2.9 1.5 2.0 2.2 2.1 2.1 2.1 2.2
Euro Area 2.0 1.8 2.6 1.7 1.9 1.7 1.7 1.5
China 6.9 6.7 6.9 6.9 6.7 6.5 6.4 6.3
Japan 1.1 1.0 1.5 1.4 1.3 1.5 0.6 1.0
India1 8.0 7.1 6.1 5.7 7.2 7.2 7.7 7.5
Malaysia 5.0 4.2 5.6 5.8 4.5 4.9 4.7 4.9
Singapore 1.9 2.0 2.5 2.9 2.2 - 2.6 -
Indonesia 4.9 5.0 5.0 5.0 5.1 5.2 5.3 5.3
Thailand 2.9 3.2 3.3 3.7 3.2 3.2 3.3 3.3
Philippines 6.1 6.9 6.4 6.5 6.8 6.9 6.9 6.9
Vietnam 6.7 6.2 5.2 6.2 6.3 6.3 6.3 6.4
Source: Officials; IMF (World Economic Outlook, July & April 2017; Recent Article IV Consultations); World Bank (Global Economic Prospects, June 2017)
Note 1: Annual GDP for India is on fiscal year basis, as per reporting practice of the country.

5
A. SNAPSHOT REVIEW OF KEY GLOBAL ECONOMIC INDICATORS
1) The composite leading indicators (CLIs) suggest stable growth momentum in major economies in the OECD area. The CLI index continued to rise by an annual rate of 0.6% yoy in July for nine straight months since November 2016. The CLI for China rose for the fourth consecutive month in July while that of India contracted at a smaller magnitude.
Figure 2: OECD CLI continues to improve steadily
Source: OECD
Figure 3: CLIs of China and India show positive outlook
Source: OECD
98.0
98.5
99.0
99.5
100.0
100.5
101.0
101.5
102.0
201
0 J
an
Ap
r
Jul
Oct
201
1 J
an
Ap
r
Jul
Oct
201
2 J
an
Ap
r
Jul
Oct
201
3 J
an
Ap
r
Jul
Oct
201
4 J
an
Ap
r
Jul
Oct
201
5 J
an
Ap
r
Jul
Oct
201
6 J
an
Ap
r
Jul
Oct
201
7 J
an
Ap
r
Jul
Total OECD CLI US CLI Euro Area CLI Japan CLI
98.0
98.5
99.0
99.5
100.0
100.5
101.0
101.5
102.0
102.5
201
0 J
an
Ap
r
Jul
Oct
201
1 J
an
Ap
r
Jul
Oct
201
2 J
an
Ap
r
Jul
Oct
201
3 J
an
Ap
r
Jul
Oct
201
4 J
an
Ap
r
Jul
Oct
201
5 J
an
Ap
r
Jul
Oct
201
6 J
an
Ap
r
Jul
Oct
201
7 J
an
Ap
r
Jul
China CLI India CLI

6
2) The global manufacturing sector remains on the expansion path, keeping the index at 53.2 in September, unchanged from August’s 75-month high. The stable rate was due to the faster rate of increases in production, employment and prices, offsetting by slower growth in new orders and exports.
The PMI reading for global service sector dipped slightly to 54.0 in September (54.1 in August), but remained above the average index of 53.7 in 1H, continuing 98 consecutive months of expansion trend. The expansion was led by further increases in input prices and output costs, offsetting by slower increases in employment and new business growth.
Figure 4: Global PMI for manufacturing and services on positive track
Source: Markit
3) World trade volume fell 0.4% mom in July after a stagnant growth in June. Both exports and imports contracted by 0.5% and 0.3% respectively. However, the annual growth of world trade volume has improved for eighteen consecutive months.
In advanced economies, export volumes in euro area and the US have dropped 1.3% mom and 0.8% respectively while Japan and other advanced economies grew 1.7% and 0.9% in July. All emerging economies experienced contraction in export volume (-0.6%), led by central and eastern Europe (-3.2%), Latin America (-1.6%), Africa and Middle East (-0.6%) and emerging Asia (-0.1%). In terms of year-on-year growth, only Africa and Middle East region recorded a continuous contraction of 2.4% in July, 2.5% in June and 1.0% in May.
Global trade recovery is gaining traction driven by continued demand from advanced economies and China. The World Trade Outlook Indicator (WTOI) is designed to provide "real time" information on the trajectory of world trade relative to recent trends. The latest reading of 102.6 for June is above trend and rising, signalling strengthening trade growth in the third quarter (July-September).
The World Trade Organisation (WTO) revised this year’s global trade growth to 3.6% from 2.4% previously (1.3% in 2016), driven by Asia and North America. Global trade growth is projected to moderate to 3.2% in 2018. The ratio of trade growth to GDP growth should rise to 1.3 in 2017 from about 1.1 times after the 2008-09 Global Financial Crisis. The IMF’s estimate is more optimistic, pegging a growth of 4.0% in 2017 and 3.9% in 2018 respectively.
30
35
40
45
50
55
60
65
200
6 J
an
Ap
rJul
Oct
200
7 J
an
Ap
rJul
Oct
200
8 J
an
Ap
rJul
Oct
200
9 J
an
Ap
rJul
Oct
201
0 J
an
Ap
rJul
Oct
201
1 J
an
Ap
rJul
Oct
201
2 J
an
Ap
rJul
Oct
201
3 J
an
Ap
rJul
Oct
201
4 J
an
Ap
rJul
Oct
201
5 J
an
Ap
rJul
Oct
201
6 J
an
Ap
rJul
Oct
201
7 J
an
Ap
rJul
Global Manufacturing PMI Global Services PMI

7
What could possibly temper global trade recovery are policy shocks and uncertainties, rising protectionism threat, including the imposition of trade restrictive measures and disrupted global supply chains.
Figure 5: Higher volatility in world trade volume
Source: CPB Netherlands Bureau for Economic Policy Analysis
Figure 6: World exports volume continued to fluctuate
Source: CPB Netherlands Bureau for Economic Policy Analysis
4) World industrial production declined marginally by 0.1% mom in July after five consecutive months of increase (1.2% in 2Q and 0.6% in 1Q). Uneven growth found in advanced economies: United States (0.4%), euro area (0.0%), Japan (-0.7%) and other developed economies (-0.3%). Industrial production in emerging economies declined by 0.2% (1.1% in 2Q and 0.7% in 1Q), dragged by central and eastern Europe (-1.0%) and emerging Asia (-0.4%).
-7%
-6%
-5%
-4%
-3%
-2%
-1%
0%
1%
2%
3%
4%
5%
200
8 J
an
Ap
r
Jul
Oct
200
9 J
an
Ap
r
Jul
Oct
201
0 J
an
Ap
r
Jul
Oct
201
1 J
an
Ap
r
Jul
Oct
201
2 J
an
Ap
r
Jul
Oct
201
3 J
an
Ap
r
Jul
Oct
201
4 J
an
Ap
r
Jul
Oct
201
5 J
an
Ap
r
Jul
Oct
201
6 J
an
Ap
r
Jul
Oct
201
7 J
an
Ap
r
Jul
World Trade Volume (mom) World Trade Unit Value (mom)
-8%-7%-6%-5%-4%-3%-2%-1%0%1%2%3%4%5%
200
8 J
an
Ap
r
Jul
Oct
200
9 J
an
Ap
r
Jul
Oct
201
0 J
an
Ap
r
Jul
Oct
201
1 J
an
Ap
r
Jul
Oct
201
2 J
an
Ap
r
Jul
Oct
201
3 J
an
Ap
r
Jul
Oct
201
4 J
an
Ap
r
Jul
Oct
201
5 J
an
Ap
r
Jul
Oct
201
6 J
an
Ap
r
Jul
Oct
201
7 J
an
Ap
r
Jul
World Exports Volume (mom) World Exports Unit Value (mom)

8
Figure 7: World industrial production dropped after growing five months
Source: CPB Netherlands Bureau for Economic Policy Analysis
5) Global sales of semiconductors expanded robustly by 22.5% yoy to US$95.9 billion in 2Q17 (16.1% in 1Q), marking its highest-ever quarterly sales since 3Q 2010. In August, sales rose by 23.9% (24.0% in July). Regionally, sales were sustained at strong growth across all regions compared to a year ago: Americas (39.0% vs. 36.0% in July), China (23.3% vs 24.0% in July), Asia Pacific/All Other (19.5% vs. 20.4% in July), Europe (18.8% vs. 18.8% in July), and Japan (14.3% vs. 16.7% in July).
Figure 8: Global semiconductor sales mark 13 months of unbroken expansion
Source: Semiconductor Industry Association (SIA)
-5%
-4%
-3%
-2%
-1%
0%
1%
2%2
00
8 J
an
Ap
r
Jul
Oct
200
9 J
an
Ap
r
Jul
Oct
201
0 J
an
Ap
r
Jul
Oct
201
1 J
an
Ap
r
Jul
Oct
201
2 J
an
Ap
r
Jul
Oct
201
3 J
an
Ap
r
Jul
Oct
201
4 J
an
Ap
r
Jul
Oct
201
5 J
an
Ap
r
Jul
Oct
201
6 J
an
Ap
r
Jul
Oct
201
7 J
an
Ap
r
Jul
World Industral Production Index (mom) Advanced Economies Production Index (mom)
Emerging Economies Production Index (mom)
-60%
-40%
-20%
0%
20%
40%
60%
80%
199
6 J
an
Jul
199
7 J
an
Jul
199
8 J
an
Jul
199
9 J
an
Jul
200
0 J
an
Jul
200
1 J
an
Jul
200
2 J
an
Jul
200
3 J
an
Jul
200
4 J
an
Jul
200
5 J
an
Jul
200
6 J
an
Jul
200
7 J
an
Jul
200
8 J
an
Jul
200
9 J
an
Jul
201
0 J
an
Jul
201
1 J
an
Jul
201
2 J
an
Jul
201
3 J
an
Jul
201
4 J
an
Jul
201
5 J
an
Jul
201
6 J
an
Jul
201
7 J
an
Jul
Worldwide (yoy) USA (yoy) Europe (yoy)
Japan (yoy) Asia Pacific incl. China (yoy)

9
The World Semiconductor Trade Statistics (WSTS) revised its projection of semiconductor sales for 2017 to 17.0% from 11.5% previously (1.1% in 2016). All regions are estimated to grow at double-digit rate: Americas (21.4%), Asia Pacific (16.8%), Europe (15.4%) and Japan (11.5%). This projection is aligned with other semiconductor forecasters’ revision, i.e. IC Insights (16.0%), Gartner (16.8%) and Semiconductor Intelligence (18.5%). Nonetheless, WSTS expects semiconductor sales growth to moderate to 4.3% in 2018 and contract moderately by 0.6% in 2019. Integrated circuits (IC), which accounted for 83% of the total semiconductor sales are projected to grow by 19.1% in 2017. Among the IC components, memory is expected to register the highest growth of 50.5% while logic and analog will rise by 8.8% and 8.0% respectively.
6) Global oil price, as benchmarked by Brent crude, which averaged US$49.55 per barrel in 2Q (US$53.59 per barrel in 1Q17), inched higher to US$52.10 in 3Q and is currently hovering around US$56 in the first week of October. The extended oil output cuts agreement among Organization of the Petroleum Exporting Countries (OPEC) and non-OPEC countries will expire in March 2018. In August, OPEC did not meet their oil production cut target of 1,176 kbpd, whereas the non-OPEC nations achieved their target of cutting 546 kbpd for the first time in 2017 with 119% compliance.
It takes time for the rebalancing of the oil market. The parties agreeing to cutting supply need to convince the market that they are in together. Risks to that effort include rising output in Libya and Nigeria as well as shale-oil producers in the U.S.
OPEC raised its outlook for oil demand in 2018 and cut its forecasts for output from rivals next year, yet another increase in the group’s production suggested the market will remain in surplus despite efforts to limit supply.
Brent crude rises to US$56/bbl amid possibilities of further extension of supply curbs and US oil rig count continued to fall. Recent bets suggest expectations that markets are tightening and prices will rise modestly. IEA warns that lack of new investment in oil production is sticking a risk of tighter crude supply and unstable prices. OPEC and other oil producers are clearing a glut that has weighed on crude prices for three years and may wait until January before deciding whether to extend their output curbs beyond the 1Q18.
Figure 9: Brent crude oil price rose to a two-year high in recent weeks
Source: US Energy Information Administration
20
40
60
80
100
120
140
200
7 J
an
Ap
rJul
Oct
200
8 J
an
Ap
rJul
Oct
200
9 J
an
Ap
rJul
Oct
201
0 J
an
Ap
rJul
Oct
201
1 J
an
Ap
rJul
Oct
201
2 J
an
Ap
rJul
Oct
201
3 J
an
Ap
rJul
Oct
201
4 J
an
Ap
rJul
Oct
201
5 J
an
Ap
rJul
Oct
201
6 J
an
Ap
rJul
Oct
201
7 J
an
Ap
rJul
USD/barrel
Brent Crude Oil WTI Crude Oil
10
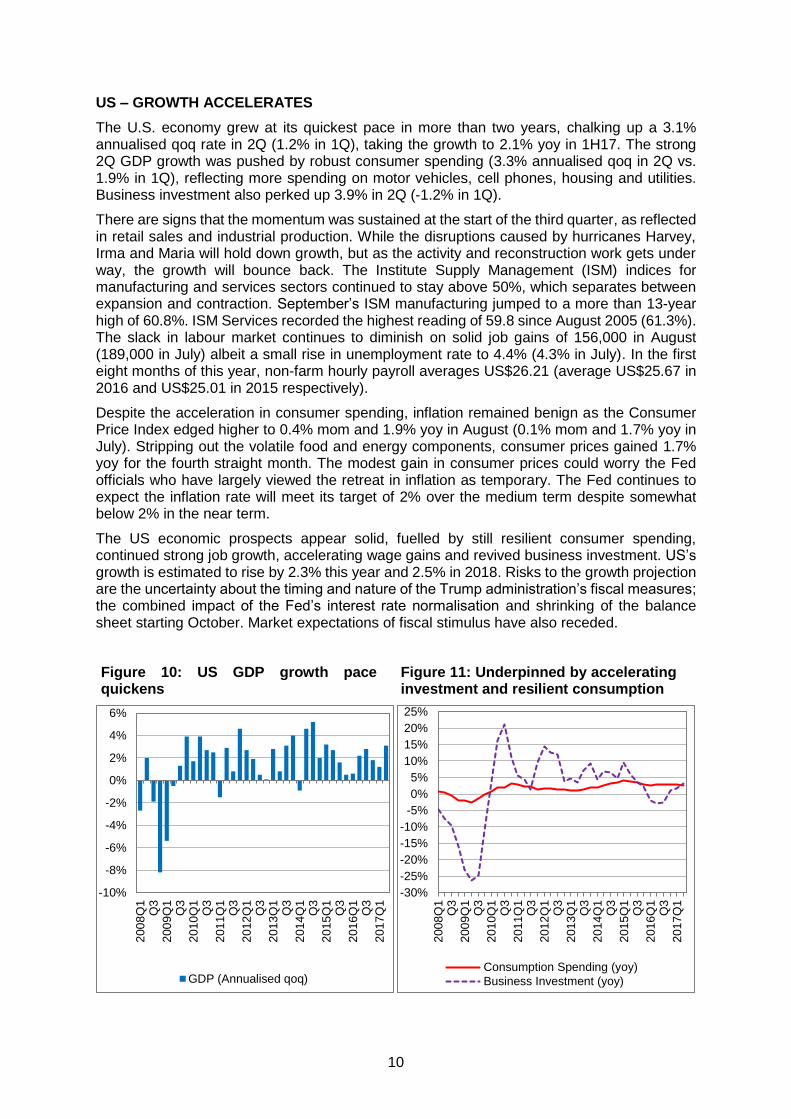
US – GROWTH ACCELERATES
The U.S. economy grew at its quickest pace in more than two years, chalking up a 3.1% annualised qoq rate in 2Q (1.2% in 1Q), taking the growth to 2.1% yoy in 1H17. The strong 2Q GDP growth was pushed by robust consumer spending (3.3% annualised qoq in 2Q vs. 1.9% in 1Q), reflecting more spending on motor vehicles, cell phones, housing and utilities. Business investment also perked up 3.9% in 2Q (-1.2% in 1Q).
There are signs that the momentum was sustained at the start of the third quarter, as reflected in retail sales and industrial production. While the disruptions caused by hurricanes Harvey, Irma and Maria will hold down growth, but as the activity and reconstruction work gets under way, the growth will bounce back. The Institute Supply Management (ISM) indices for manufacturing and services sectors continued to stay above 50%, which separates between expansion and contraction. September’s ISM manufacturing jumped to a more than 13-year high of 60.8%. ISM Services recorded the highest reading of 59.8 since August 2005 (61.3%). The slack in labour market continues to diminish on solid job gains of 156,000 in August (189,000 in July) albeit a small rise in unemployment rate to 4.4% (4.3% in July). In the first eight months of this year, non-farm hourly payroll averages US$26.21 (average US$25.67 in 2016 and US$25.01 in 2015 respectively).
Despite the acceleration in consumer spending, inflation remained benign as the Consumer Price Index edged higher to 0.4% mom and 1.9% yoy in August (0.1% mom and 1.7% yoy in July). Stripping out the volatile food and energy components, consumer prices gained 1.7% yoy for the fourth straight month. The modest gain in consumer prices could worry the Fed officials who have largely viewed the retreat in inflation as temporary. The Fed continues to expect the inflation rate will meet its target of 2% over the medium term despite somewhat below 2% in the near term.
The US economic prospects appear solid, fuelled by still resilient consumer spending, continued strong job growth, accelerating wage gains and revived business investment. US’s growth is estimated to rise by 2.3% this year and 2.5% in 2018. Risks to the growth projection are the uncertainty about the timing and nature of the Trump administration’s fiscal measures; the combined impact of the Fed’s interest rate normalisation and shrinking of the balance sheet starting October. Market expectations of fiscal stimulus have also receded.
Figure 10: US GDP growth pace quickens
Figure 11: Underpinned by accelerating investment and resilient consumption
-10%
-8%
-6%
-4%
-2%
0%
2%
4%
6%
200
8Q
1Q
32
00
9Q
1Q
32
01
0Q
1Q
32
01
1Q
1Q
32
01
2Q
1Q
32
01
3Q
1Q
32
01
4Q
1Q
32
01
5Q
1Q
32
01
6Q
1Q
32
01
7Q
1
GDP (Annualised qoq)
-30%
-25%
-20%
-15%
-10%
-5%
0%
5%
10%
15%
20%
25%
200
8Q
1Q
32
00
9Q
1Q
32
01
0Q
1Q
32
01
1Q
1Q
32
01
2Q
1Q
32
01
3Q
1Q
32
01
4Q
1Q
32
01
5Q
1Q
32
01
6Q
1Q
32
01
7Q
1
Consumption Spending (yoy)
Business Investment (yoy)

11
Figure 12: Industrial output and retail sales continued to expand
Figure 13: Highest manufacturing and services PMI since 2004/05
Figure 14: Continued jobs gain amid steady jobless rate
Figure 15: Improved wages amid soft inflation
Source: US Bureau of Economic Analysis; Federal Reserve System; US Census Bureau; Institute for Supply Management; US Bureau of Labor Statistics
EUROZONE – ENTRENCHED RECOVERY
Higher 2Q GDP growth (0.6% qoq and 1.7% yoy vs. 0.5% qoq and 2.6% yoy respectively in 1Q) reaffirmed solid growth momentum in eurozone, a bright spot in the global economy this year. Domestic demand remains the driver’s seat as an improving labor market, high confidence levels and expansionary monetary policy support economic activity. Exports also expanded aided by the improved global demand.
-20%
-15%
-10%
-5%
0%
5%
10%
15%2
00
8 J
an
Jul
200
9 J
an
Jul
201
0 J
an
Jul
201
1 J
an
Jul
201
2 J
an
Jul
201
3 J
an
Jul
201
4 J
an
Jul
201
5 J
an
Jul
201
6 J
an
Jul
201
7 J
an
Jul
Industrial Production (yoy)
Retail Trade & Food Services Sales (yoy)
30
35
40
45
50
55
60
65
200
8 J
an
Jul
200
9 J
an
Jul
201
0 J
an
Jul
201
1 J
an
Jul
201
2 J
an
Jul
201
3 J
an
Jul
201
4 J
an
Jul
201
5 J
an
Jul
201
6 J
an
Jul
201
7 J
an
Jul
ISM Manufacturing Index (%)
ISM Non-Manufacturing Index (%)
4%
5%
6%
7%
8%
9%
10%
11%
12%
-1,000
-800
-600
-400
-200
0
200
400
600
200
8 J
an
Jul
200
9 J
an
Jul
201
0 J
an
Jul
201
1 J
an
Jul
201
2 J
an
Jul
201
3 J
an
Jul
201
4 J
an
Jul
201
5 J
an
Jul
201
6 J
an
Jul
201
7 J
an
Jul
('000)
Nonfarm Employment (mom net change) (LHS)Unemployment Rate (RHS)
-1%
0%
1%
2%
3%
4%
201
0 J
an
Jul
201
1 J
an
Jul
201
2 J
an
Jul
201
3 J
an
Jul
201
4 J
an
Jul
201
5 J
an
Jul
201
6 J
an
Jul
201
7 J
an
Jul
Average Hourly Earnings (yoy)CPI Urban Consumers (yoy)Core CPI Urban Consumers (yoy)

12
A slew of leading indicators for 3Q point to solid continued momentum. Economic sentiment in the Eurozone rose to 113.0 in September (111.9 in August), the highest in more than a decade as sentiment scales high in manufacturing and services sectors. Manufacturing sector in euro area ended the third quarter with PMI reading at a 79-month high of 58.1, marking 51 consecutive months of expansion. This was underpinned by a strong and accelerated improvement in domestic market conditions and increase in levels of new exports. Services expanded for fifty consecutive months with PMI reading at 55.8 in September. However, the average reading in third quarter (55.3) was not as strong as the 2Q (56.0).
Industrial production growth improved to 3.2% in July from 2.8% in June. Inflation increased to 1.5% in August after stabilising at 1.3% for two months, but still below the European Central Bank’s target of 2.0%. Core inflation rate maintained at 1.2% for three months since June.
Figure 16: Eurozone economy heads for decade-high growth
Figure 17: Domestic demand remains the driver’s seat
Figure 18: Rising industrial output and retail sales
Figure 19: PMI for manufacturing and services accelerate
-3.5%
-3.0%
-2.5%
-2.0%
-1.5%
-1.0%
-0.5%
0.0%
0.5%
1.0%
1.5%
200
8Q
1Q
32
00
9Q
1Q
32
01
0Q
1Q
32
01
1Q
1Q
32
01
2Q
1Q
32
01
3Q
1Q
32
01
4Q
1Q
32
01
5Q
1Q
32
01
6Q
1Q
32
01
7Q
1
GDP (qoq)
-25%
-20%
-15%
-10%
-5%
0%
5%
10%
15%
200
8Q
1Q
32
00
9Q
1Q
32
01
0Q
1Q
32
01
1Q
1Q
32
01
2Q
1Q
32
01
3Q
1Q
32
01
4Q
1Q
32
01
5Q
1Q
32
01
6Q
1Q
32
01
7Q
1
Household Consumption (yoy)
Gross Capital Formation (yoy)
-25%
-20%
-15%
-10%
-5%
0%
5%
10%
15%
200
8 J
an
Jul
200
9 J
an
Jul
201
0 J
an
Jul
201
1 J
an
Jul
201
2 J
an
Jul
201
3 J
an
Jul
201
4 J
an
Jul
201
5 J
an
Jul
201
6 J
an
Jul
201
7 J
an
Jul
Industrial Production (yoy)
Retail Trade Volume (yoy)
30
35
40
45
50
55
60
200
8 J
an
Jul
200
9 J
an
Jul
201
0 J
an
Jul
201
1 J
an
Jul
201
2 J
an
Jul
201
3 J
an
Jul
201
4 J
an
Jul
201
5 J
an
Jul
201
6 J
an
Jul
201
7 J
an
Jul
Manufacturing PMI Services PMI
13
Figure 20: Substantial improvement in jobless rate
Figure 21: Inflation ticks higher but still below the ECB’s 2% target
Source: Eurostat; Markit
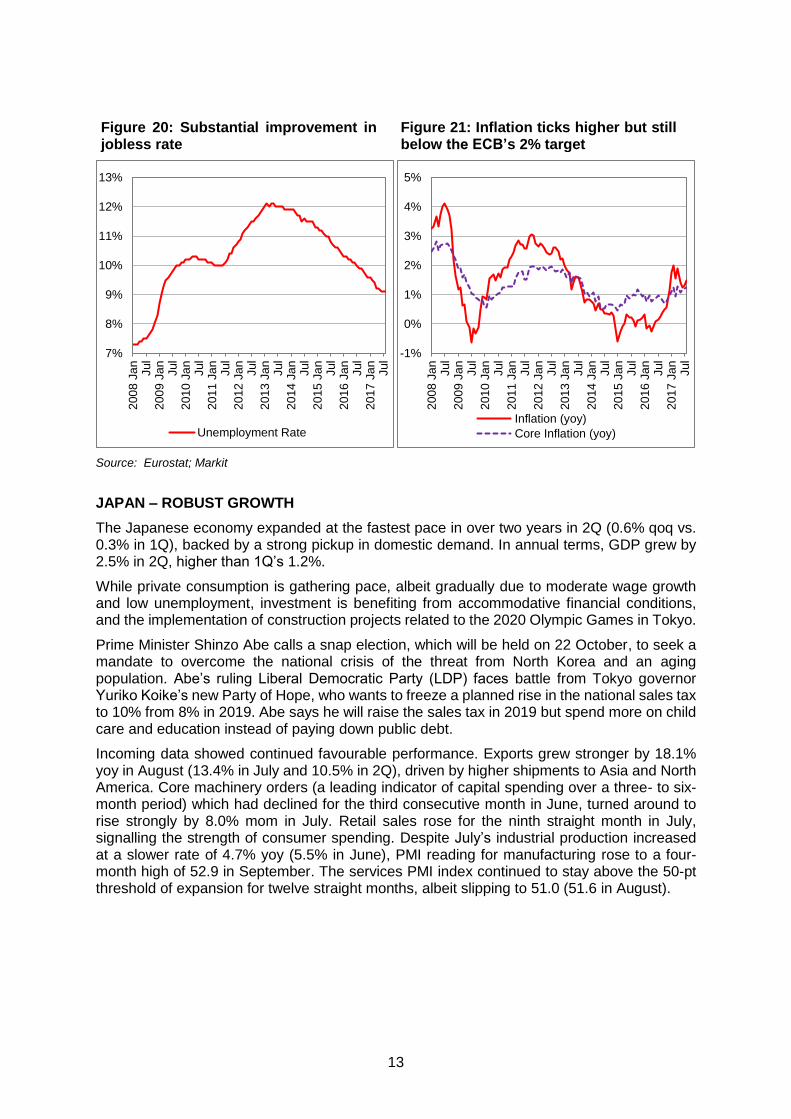
JAPAN – ROBUST GROWTH
The Japanese economy expanded at the fastest pace in over two years in 2Q (0.6% qoq vs. 0.3% in 1Q), backed by a strong pickup in domestic demand. In annual terms, GDP grew by 2.5% in 2Q, higher than 1Q’s 1.2%.
While private consumption is gathering pace, albeit gradually due to moderate wage growth and low unemployment, investment is benefiting from accommodative financial conditions, and the implementation of construction projects related to the 2020 Olympic Games in Tokyo.
Prime Minister Shinzo Abe calls a snap election, which will be held on 22 October, to seek a mandate to overcome the national crisis of the threat from North Korea and an aging population. Abe’s ruling Liberal Democratic Party (LDP) faces battle from Tokyo governor Yuriko Koike’s new Party of Hope, who wants to freeze a planned rise in the national sales tax to 10% from 8% in 2019. Abe says he will raise the sales tax in 2019 but spend more on child care and education instead of paying down public debt.
Incoming data showed continued favourable performance. Exports grew stronger by 18.1% yoy in August (13.4% in July and 10.5% in 2Q), driven by higher shipments to Asia and North America. Core machinery orders (a leading indicator of capital spending over a three- to six-month period) which had declined for the third consecutive month in June, turned around to rise strongly by 8.0% mom in July. Retail sales rose for the ninth straight month in July, signalling the strength of consumer spending. Despite July’s industrial production increased at a slower rate of 4.7% yoy (5.5% in June), PMI reading for manufacturing rose to a four-month high of 52.9 in September. The services PMI index continued to stay above the 50-pt threshold of expansion for twelve straight months, albeit slipping to 51.0 (51.6 in August).
7%
8%
9%
10%
11%
12%
13%
200
8 J
an
Jul
200
9 J
an
Jul
201
0 J
an
Jul
201
1 J
an
Jul
201
2 J
an
Jul
201
3 J
an
Jul
201
4 J
an
Jul
201
5 J
an
Jul
201
6 J
an
Jul
201
7 J
an
Jul
Unemployment Rate
-1%
0%
1%
2%
3%
4%
5%
200
8 J
an
Jul
200
9 J
an
Jul
201
0 J
an
Jul
201
1 J
an
Jul
201
2 J
an
Jul
201
3 J
an
Jul
201
4 J
an
Jul
201
5 J
an
Jul
201
6 J
an
Jul
201
7 J
an
Jul
Inflation (yoy)
Core Inflation (yoy)

14
Figure 22: Japan’s economy grows at fastest pace in more than two years
Figure 23: Fuelled by consumer spending and investment
Figure 24: Industrial output and retail sales still growing
Figure 25: Exports have enjoyed a run of strong growth
-20%
-15%
-10%
-5%
0%
5%
10%2
00
8Q
1Q
32
00
9Q
1Q
32
01
0Q
1Q
32
01
1Q
1Q
32
01
2Q
1Q
32
01
3Q
1Q
32
01
4Q
1Q
32
01
5Q
1Q
32
01
6Q
1Q
32
01
7Q
1
GDP (Annualised qoq)
-20%
-15%
-10%
-5%
0%
5%
10%
15%
200
8Q
1Q
32
00
9Q
1Q
32
01
0Q
1Q
32
01
1Q
1Q
32
01
2Q
1Q
32
01
3Q
1Q
32
01
4Q
1Q
32
01
5Q
1Q
32
01
6Q
1Q
32
01
7Q
1
Household Consumption (yoy)
Gross Capital Formation (yoy)
-40%
-30%
-20%
-10%
0%
10%
20%
30%
200
8 J
an
Jul
200
9 J
an
Jul
201
0 J
an
Jul
201
1 J
an
Jul
201
2 J
an
Jul
201
3 J
an
Jul
201
4 J
an
Jul
201
5 J
an
Jul
201
6 J
an
Jul
201
7 J
an
Jul
Industrial Production (yoy)
Retail Sales (yoy)
-60%
-50%
-40%
-30%
-20%
-10%
0%
10%
20%
30%
40%
50%
200
8 J
an
Jul
200
9 J
an
Jul
201
0 J
an
Jul
201
1 J
an
Jul
201
2 J
an
Jul
201
3 J
an
Jul
201
4 J
an
Jul
201
5 J
an
Jul
201
6 J
an
Jul
201
7 J
an
Jul
Exports (yoy)

15
Figure 26: Unemployment rate held steady at 2.8% in August
Figure 27: Inflation ticks up but still way off target
Source: Economic and Social Research Institute; Ministry of Economy, Trade and Industry, Japan; Japan Customs; Statistics Bureau, Japan
CHINA – FINE-TUNING TO MAINTAIN GROWTH MOMENTUM
China's economy held steady in the first half-year as real GDP growth sustained a healthy rate of 6.9% yoy each in 2Q and 1Q17 respectively, driven by consumption, the expansion of services sector, export activity, and property investment. The strong economic growth in 1H has reassured Beijing to achieve a growth target of around 6.5% for this year, a tad lower from 6.7% in 2016.
Incoming data for July-August suggests that momentum is moderating in 2H. Retail sales, investment and industrial production slowed in July and August. House prices also increased at a slower pace (8.1% yoy in August vs. July’s 9.1%). Manufacturing activity expanded at the fastest pace since April 2012 with a PMI reading of 52.4 in September, buoyed by a surge in new orders and production. Exports moderated further to 5.5% in August (7.2% in July and 8.5% in 1H) with an accumulated trade surplus of US$271.5 billion in 8M17.
The People's Bank of China (PBOC) will cut the reserve requirement ratio (RRR) for the first time since February 2016 for some banks that meet certain requirements for lending to small enterprises, micro-sized and individual businesses and farmers starting in 2018. The reserve requirement rate will be cut by 50 bps or 0.5% for banks whose loans to the targeted groups account for 1.5% of their balance of outstanding newly added loans for the previous year. For banks whose loans to the designated groups account for 10% of all loans, the rate will be cut by 100 bps or 1%. The current rate for major banks was set at 17.0% after the last general RRR cut that took effect in March 2016. The targeted RRR cut does not constitute a change to its prudent and neutral monetary policy. It is intended to provide liquidity to some qualified banks for specific lending to support real economic activities.
Recent data indicates that growth in shadow banking has slowed as M2 growth paced to a record low of 8.9% in August 2017, thanks to the coordinated measures by the central bank, the banking and securities regulators to curb runaway growth in shadow banking as well as to contain systemic financial risks.
2%
3%
4%
5%
6%
200
8 J
an
Jul
200
9 J
an
Jul
201
0 J
an
Jul
201
1 J
an
Jul
201
2 J
an
Jul
201
3 J
an
Jul
201
4 J
an
Jul
201
5 J
an
Jul
201
6 J
an
Jul
201
7 J
an
Jul
Unemployment Rate
-3%
-2%
-1%
0%
1%
2%
3%
4%
200
8 J
an
Jul
200
9 J
an
Jul
201
0 J
an
Jul
201
1 J
an
Jul
201
2 J
an
Jul
201
3 J
an
Jul
201
4 J
an
Jul
201
5 J
an
Jul
201
6 J
an
Jul
201
7 J
an
Jul
Inflation (yoy)
Core Inflation (yoy)

16
Nevertheless, the central bank commented that the shadow banking sector still lacks of adequate regulation and pledges to step up regulations to curb shadow banking risks. The authorities are expected to adopt a measured approach rather than a hard-hitting stance to restrain shadow banking. This is to avoid an over adjustment on the economy via dampening consumption and investment) and threaten the financial stability.
Figure 28: China economy still steadying
Figure 29: Retail sales surprised on the downside in August
Figure 30: Industrial production also paced slower
Figure 31: Expansion in fixed capital investment dipped more than expected
0%
2%
4%
6%
8%
10%
12%
14%
200
8Q
1Q
32
00
9Q
1Q
32
01
0Q
1Q
32
01
1Q
1Q
32
01
2Q
1Q
32
01
3Q
1Q
32
01
4Q
1Q
32
01
5Q
1Q
32
01
6Q
1Q
32
01
7Q
1
GDP (yoy)
8%
10%
12%
14%
16%
18%
20%
22%
24%
200
8 J
an
Jul
200
9 J
an
Jul
201
0 J
an
Jul
201
1 J
an
Jul
201
2 J
an
Jul
201
3 J
an
Jul
201
4 J
an
Jul
201
5 J
an
Jul
201
6 J
an
Jul
201
7 J
an
Jul
Retail Sales (yoy)
0%
5%
10%
15%
20%
25%
200
8 J
an
Jul
200
9 J
an
Jul
201
0 J
an
Jul
201
1 J
an
Jul
201
2 J
an
Jul
201
3 J
an
Jul
201
4 J
an
Jul
201
5 J
an
Jul
201
6 J
an
Jul
201
7 J
an
Jul
Value-added of Industry (yoy)
0%
5%
10%
15%
20%
25%
30%
35%
40%
200
8 J
an
Jul
200
9 J
an
Jul
201
0 J
an
Jul
201
1 J
an
Jul
201
2 J
an
Jul
201
3 J
an
Jul
201
4 J
an
Jul
201
5 J
an
Jul
201
6 J
an
Jul
201
7 J
an
Jul
Fixed Assets Investment Accumulated GrowthRate (yoy)

17
Figure 32: PMI readings for manufacturing and services held steady
Figure 33: Exports continued to slow
Source: National Bureau of Statistics of China
ASEAN-5 ECONOMIES’ KEY ECONOMIC DATA TRACKER
Broadly, ASEAN-5 economies’ (Malaysia, Singapore, Indonesia, Thailand and Philippines) economic growth expanded further in 2Q on higher exports and resilient domestic demand. While growth in Indonesia stabilised in 2Q, real GDP growth of Malaysia, Singapore, Philippines, and Thailand came in stronger than that of 1Q.
Both exports and industrial production grew at a slower pace going into third and fourth quarters. Headline inflation has moderated for most countries. Given subdued inflation, Bank Indonesia (BI) surprisingly cut the BI seven-day Reverse Repo rate two rounds (25 basis point each) in August and September, taking it to 4.25% from 4.75% to boost lacklustre economic activity and spur lending growth. BI also eased macroprudential rules such as the down payment for motor vehicles and home loans.
35
40
45
50
55
60
65
200
8 J
an
Jul
200
9 J
an
Jul
201
0 J
an
Jul
201
1 J
an
Jul
201
2 J
an
Jul
201
3 J
an
Jul
201
4 J
an
Jul
201
5 J
an
Jul
201
6 J
an
Jul
201
7 J
an
Jul
Manufacturing PMINon-Manufacturing PMI
-60%
-40%
-20%
0%
20%
40%
60%
80%
100%
200
8 J
an
Jul
200
9 J
an
Jul
201
0 J
an
Jul
201
1 J
an
Jul
201
2 J
an
Jul
201
3 J
an
Jul
201
4 J
an
Jul
201
5 J
an
Jul
201
6 J
an
Jul
201
7 J
an
Jul
Exports (USD, yoy) Imports (USD, yoy)

18
Figure 34: Real GDP growth trend
Source: Department of Statistics, Malaysia; Singapore Department of Statistics; Statistics Indonesia; National Economic and Social Development Board, Thailand; Philippine Statistics Authority
Figure 35: Export growth trend
Source: Department of Statistics, Malaysia; Singapore Department of Statistics; Statistics Indonesia; Bank of Thailand; Philippine Statistics Authority
-6%
-4%
-2%
0%
2%
4%
6%
8%
10%
12%
14%
16%2
01
1Q
1
Q2
Q3
Q4
201
2Q
1
Q2
Q3
Q4
201
3Q
1
Q2
Q3
Q4
201
4Q
1
Q2
Q3
Q4
201
5Q
1
Q2
Q3
Q4
201
6Q
1
Q2
Q3
Q4
201
7Q
1
Q2
Malaysia (yoy) Singapore (yoy) Indonesia (yoy)
Thailand (yoy) Philippines (yoy)
-30%
-20%
-10%
0%
10%
20%
30%
40%
50%
201
1 J
an
Ap
r
Jul
Oct
201
2 J
an
Ap
r
Jul
Oct
201
3 J
an
Ap
r
Jul
Oct
201
4 J
an
Ap
r
Jul
Oct
201
5 J
an
Ap
r
Jul
Oct
201
6 J
an
Ap
r
Jul
Oct
201
7 J
an
Ap
r
Jul
Malaysia (yoy) Singapore (yoy) Indonesia (yoy)
Thailand (yoy) Philippines (yoy)

19
Figure 36: Industrial production growth trend
Source: Department of Statistics, Malaysia; Singapore Department of Statistics; Statistics Indonesia; Office of Industrial Economics, Thailand; Philippine Statistics Authority
Figure 37: Inflation trend
Source: Department of Statistics, Malaysia; Singapore Department of Statistics; Bank Indonesia; Ministry of Commerce, Thailand; Philippine Statistics Authority
-50%
-40%
-30%
-20%
-10%
0%
10%
20%
30%
40%
50%
60%2
01
1 J
an
Ap
r
Jul
Oct
201
2 J
an
Ap
r
Jul
Oct
201
3 J
an
Ap
r
Jul
Oct
201
4 J
an
Ap
r
Jul
Oct
201
5 J
an
Ap
r
Jul
Oct
201
6 J
an
Ap
r
Jul
Oct
201
7 J
an
Ap
r
Malaysia (yoy) Singapore (yoy) Indonesia (yoy)
Thailand (yoy) Philippines (yoy)
-2%
0%
2%
4%
6%
8%
10%
201
1 J
an
Ap
r
Jul
Oct
201
2 J
an
Ap
r
Jul
Oct
201
3 J
an
Ap
r
Jul
Oct
201
4 J
an
Ap
r
Jul
Oct
201
5 J
an
Ap
r
Jul
Oct
201
6 J
an
Ap
r
Jul
Oct
201
7 J
an
Ap
r
Jul
Malaysia (yoy) Singapore (yoy) Indonesia (yoy)
Thailand (yoy) Philippines (yoy)

20
B. GLOBAL MONETARY POLICY TRACKER
Amid firmer signs of global economic recovery and steady employment growth, headline inflation generally either softened or stabilized, and remains at levels well below central banks’ targets in most advanced economies. Core inflation has also remained broadly stable.
Will stagnating inflation weigh on the Fed’s interest rate normalization agenda and the shrinking of its balance sheet? The Federal Reserve’s Open Market Committee (FOMC) reiterated its intention to begin to unwind its US$4.5 trillion balance sheet. The Fed will allow US$10 billion to roll off initially, increasing quarterly in US$10 billion increments until the total hits US$50 billion starting in October 2017. The operational details are as follows: a) US$6 billion per month for Treasuries at 3-month intervals over 12 months until it reaches US$30 billion per month; and b) Mortgage-backed securities, tapering US$4 billion per month initially at 3-month intervals over 12 months until it reaches US$20 billion per month.
Federal Reserve Chairwoman Janet Yellen remarked that while recent soft inflation readings justify a gradual pace for interest-rate hikes, there is also a danger of moving too slowly. There is a risk that the labour market could become overheated, causing an inflation problem down the road. Persistently easy policy could have adverse implications for financial stability. Given that monetary policy affects economic activity and inflation with a substantial lag, it would be imprudent to keep monetary policy on hold until inflation is back to 2%.
Since December 2015, the Fed has approved four rate hikes, taking the short-term Fed funds rate to 1.25% currently and is likely to end the year 2017 at 1.50%. As of September 2017, the Fed’s new dot path signalled it will raise rates to 2.0% in 2018 and 3% in 2019. The Fed maintained its market guidance for another rate hikes this year and three more hikes in 2018.
The Fed is unlikely to shock the market as the size and pace of the Fed’s balance sheet reduction will not be as large and fast as the amount of QE when it was initiated during 2008-09 Global Financial Crisis; ii) the future stance of US monetary policy will be determined by a combination of the path for the Fed funds rate and the balance sheet normalization. It is expected that if bond yields rise larger than expected when the Fed runs down its balance sheet, the Fed could go slow on the path of short-term interest rates; and iii) The Fed would be prepared to review its balance sheet normalization program or even resume reinvestments if there is material deterioration in the economic outlook.
The ECB continues to maintain ultra-accommodative monetary stance despite robust economic activity in an environment of low price pressures. ECB President Mario Draghi continued to take a dovish tone regarding the ECB’s bond-buying program (which will expire in December 2017), stating that it could be increased in size or duration if the economic and inflation outlook were to turn less favourable.
The Bank of Japan (BOJ) had pushed back the timing of achieving its inflation target of 2.0% sixth time, signalling that the ultra-loose monetary policy will remain intact for the foreseeable future.
Some regional central banks have slashed interest rates to spur growth given low inflation risk. In Aug-Sep, Bank Indonesia (BI) cut its policy rate twice by a cumulative of 50 bps to 4.25% from 4.75%. Reserve Bank of India also trimmed its policy rate by 25 bps to 6.00% in August.

21
Implications of the Fed’s continued rate hikes and shrinking balance sheet
The Fed’s great unwinding of balance sheet marks a significant policy change with regards the implications on the US short-and long-term interest rates, the US yields curve, the US dollar and the direction of flows into the US-denominated assets.
For emerging markets, including Malaysia, the spillover effects are two folds. The first channel is strong US dollar appreciation means a weak domestic currency against the dollar; and the second channel is via capital flows reversal from emerging markets as the yield differential between domestic interest rates and the US interest rates and bond yields continued to narrow moving forward.
What would the central banks in emerging economies react in such environment? Some central banks have already slashed their policy rates, signalling the priority to support an entrenched economic growth amid moderate inflation. The improved economic growth prospects and strengthened financial fundamentals should cushion against capital reversals and the induced financial volatility.
Figure 38: Policy rate (%)
End-period of 2008 2009 2010 2011 2012 2013 2014 2015 2016 2017 Sep
2017e 2018f
US, Federal Funds Rate
0.00-0.25
0.00-0.25
0.00-0.25
0.00-0.25
0.00-0.25
0.00-0.25
0.00-0.25
0.25-0.50
0.50-0.75
1.00-1.25
1.25-1.50
2.00-2.25
Euro Area, ECB (Deposit Facility)
2.00 0.25 0.25 0.25 0.00 0.00 -0.20 -0.30 -0.40 -0.40 -0.40 0.00
Japan, BOJ Policy Rate
0.10 0.10 0.00-0.10
0.00-0.10
0.00-0.10
0.00-0.10
0.00-0.10
0.00-0.10
-0.10 -0.10 -0.10 0.00-0.10
China, PBOC 1-year Benchmark Loan I/R
5.31 5.31 5.81 6.56 6.00 6.00 5.60 4.35 4.35 4.35 4.35 4.85
India, RBI Policy Repo Rate
6.50 4.75 6.25 8.50 8.00 7.75 8.00 6.75 6.25 6.00 5.75 6.00
Korea, BOK Base Rate
3.00 2.00 2.50 3.25 2.75 2.50 2.00 1.50 1.25 1.25 1.25 1.50
Malaysia, BNM O/N Policy Rate
3.25 2.00 2.75 3.00 3.00 3.00 3.25 3.25 3.00 3.00 3.00 3.25
Indonesia, BI 7-Day RR Rate
9.25 6.50 6.50 6.50 5.75 7.50 7.75 7.50 4.75 4.25 4.25 4.25
Thailand, BOT 1-Day Repurchase Rate
2.75 1.25 2.00 3.25 2.75 2.25 2.00 1.50 1.50 1.50 1.50 1.75
Philippines, BSP O/N RR Rate
5.50 4.00 4.00 4.50 3.50 3.50 4.00 4.00 3.00 3.00 3.00 3.25
Source: Officials; SERC
22
C. MALAYSIA: ECONOMY GAINING GROUND, LOOKING FOR GROWTH
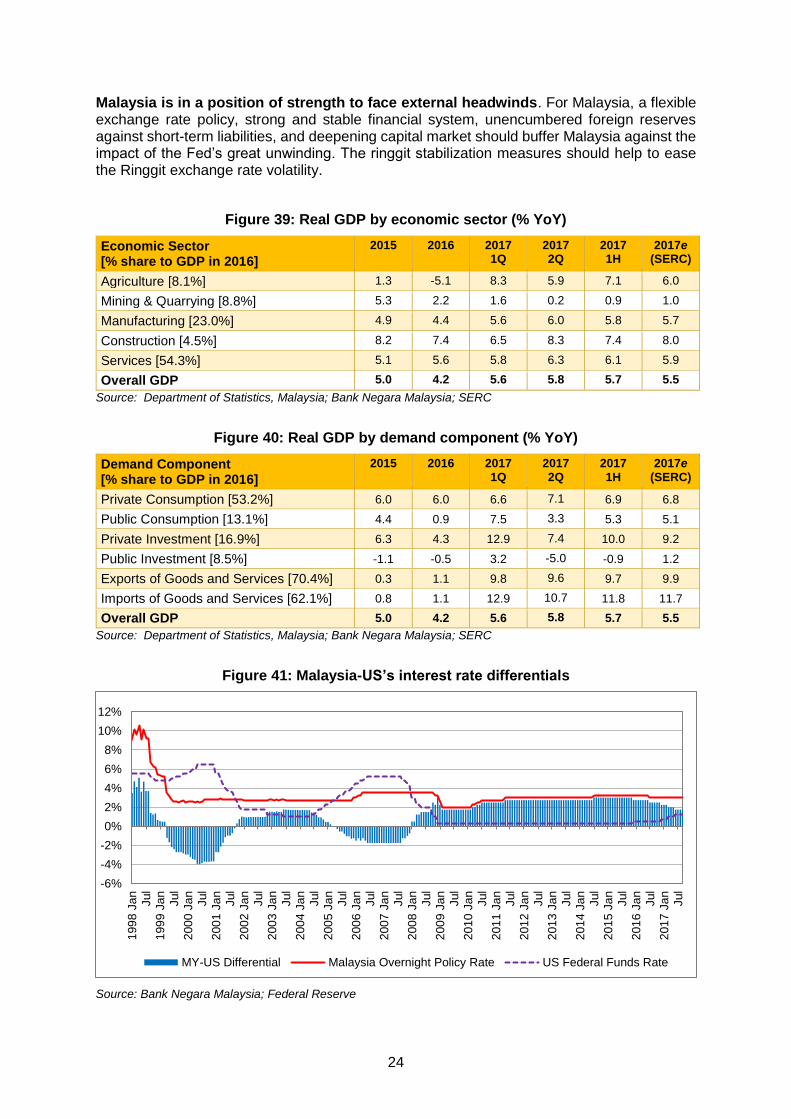
Better-than-expected economic growth in 1H17. Resilient domestic demand and strong surge in exports pushed Malaysia’s economic growth to a two-year high of 5.8% yoy in 2Q17 (5.6% in 1Q), bringing growth to 5.7% in the first half-year. With the strong economic growth locked-in in 1H, the economy should finish the year on a strong note, estimated GDP growth of 5.5% this year, an improvement from two successive years of slowing growth (4.2% in 2016 and 5.0% in 2015).
Robust consumer spending despite rising living cost. The strength of consumer spending continues to surprise on the upside, as it perked higher to 7.1% in 2Q from 6.6% in 1Q (6.9% in 1H) despite grappling with rising cost of living and high prices of goods and services. Strong festive spending, improved rural income on high commodity prices, cash handouts as well as special RM1 billion Aidilfitri aid to 2.37 million civil servants and pensioners. With the hosting of SEA Games in Kuala Lumpur and the final tranche of BR1M payment, consumer spending should be held steady, delivering a full-year private consumption growth of 6.8% this year (6.0% in 2016).
Private investment growth has bounced from the lows. After slowing four years in a row since 2012 and trapped in low single-digit for many quarters, private investment returned with much vigour to grow by 7.4% in 2Q, albeit slower compared to 12.9% in 1Q17 (10.0% in 1H17). This was supported by higher capital spending in services and manufacturing sectors. The export-oriented and domestic-market oriented industries have undertaken capacity expansions, machinery and equipment (M&E) acquisitions and replacements to cater for new orders. In the services sector, investment was supported mainly by expansions in the utilities, healthcare and food & beverage and accommodation sub-sectors. With a 10.0% growth in 1H17, private investment growth is estimated to expand by 9.2% this year (4.3% in 2016).
Most economic sectors register higher growth. The strong GDP growth in 2Q was lifted by higher expansions in services (6.3% vs. 5.8% in 1Q), manufacturing (6.0% vs. 5.6% in 2Q), and construction (8.3% vs. 6.5% in 1Q). Output growth of agriculture moderated to 5.9% in 2Q from 8.3% in 1Q, followed by a marginal growth of 0.2% in mining (1.6% in 1Q).
In tandem with resilient consumer spending, robust trade activity as well as increased financial services, the services sub-sectors that registered higher output expansion were retail trade (11.4% vs. 7.8% in 1Q), wholesale trade (6.0% vs. 5.5% in 1Q), food and beverages (8.0% vs. 7.9% in 1Q), accommodation (5.0% vs. 4.8% in 1Q), transport and storage (6.2% vs. 6.1% in 1Q), information and communication (8.5% vs. 8.2% in 1Q), finance (5.6% vs. 3.9% in 1Q), insurance (3.4% vs. 2.2% in 1Q), as well as real estate and business services (7.3% vs. 7.3% in 1Q).
Exports growth momentum to continue, albeit slower in 2H17. Exports have expanded by 21.5% in August and 30.9% in July (20.9% in 1H17), underpinned by continued broad-based recovery in global trade and stable commodities prices. Electronics exports were the primary contributor. Better growth prospects in advanced and emerging economies, coupled with positive leads of global semiconductor industry, exports are estimated to grow by 17.5% this year (1.2% in 2016).
Private consumption and investment indicators. Consumers’ purchase of big-ticket item, namely passenger cars declined marginally by 0.5% in August after registering a strong growth of 15.6% in July (0.7% in 2Q and 8.9% in 1Q). Loans extended for the purpose of consumption remained stable while imports of consumption goods expanded strongly, albeit slower (17.8% in August vs.21.8% in July) but much more robust that 1.5% in 2Q and 4.0% in 1Q respectively. Both imports of investment and intermediate goods remained strong to increase by 12.7% and 25.5% respectively in August (-16.5% and 24.2% respectively in July).

23
Growth in loan applications and approvals moderated sharply in August after growing at double-digit rates in July while loan disbursements growth expanded higher.
2018 Budget: Focus on future, and digitalisation is a step forward. Malaysia’s economic prospects for 2018 should remain good, supported by still-favourable global growth, which bodes well for exports. The Budget measures, accommodative monetary policy, and the on-going and new implementation of public infrastructure projects should hold up domestic demand. For 2018, real GDP growth is projected to grow by 5.1% vs. estimated 5.5% in 2017.
Roadmap and priorities. We expect the 2018 Budget to be the least painful budget, focussing on sustaining domestic demand and competitiveness but without comprising fiscal prudence.
On domestic front, economic and social issues preoccupied Malaysians are rising cost of living, rising prices despite receding CPI readings, housing affordability, employment opportunities for unemployed graduates and youth. Businesses, especially SMEs are still struggling with high cost of doing business and compliance costs. There remain lingering concerns about the employment of foreign workers, including foreign workers’ levy, and the Employment Insurance System (EIS).
The 2018 Budget agenda should contain short- and medium-term initiatives and action plans to re-position the country for the future. It’s about continuing re-engineer our strategies and re-shaping the state of nation’s competitiveness in the era of digitalization and the quicken pace of technologies disruption. Tax certainty continues to play high on the wish list.
According to the latest release of Global Competitiveness Report 2017-2018, Malaysia’s competitiveness ranking climbed two notches to 23rd position from 25th but still remains far away from the 18th position in 2015-2016.
Amongst the possible key measures include higher cash handout to the targeted households, lowering of corporate and individual income tax rates, tax reliefs and rebates to ease the cost of living, children education, medical expenses, incentives for manufacturing industry and SMEs to embrace Industrial Revolution 4.0, initiatives to address youth unemployment and continued to support socio-economic, commerce, public infrastructure, and housing development projects.
Headline inflation has come off from the highs. Even though headline inflation, as measured by the Consumer Price Index (CPI) has retreated to 3.7% yoy in August (3.2% in July) from 4.3% in 2Q and 4.0% in 1Q, households were not convinced that prices of goods and services have increased at slower pace. Their real purchasing power continued to shrink as cost-induced price pressures remain elevated. Headline inflation is estimated to increase by 3.9% in 2017 (2.1% 2016).
Domestic interest rates to remain stable at 3.00%. We expect BNM to maintain the overnight policy rate (OPR) at 3.00% this year, supported by steady domestic demand amid high cost-driven inflation pressures. Nevertheless, we think the central bank should prepare the groundwork for a gradual rise in interest rate in 2018 if the economy continues to strengthen.
The Ringgit still facing headwinds. We draw comfort that Bank Negara Malaysia (BNM)’s stabilisation measures have contained the ringgit’s volatility, leading to an appreciation of 6.3% to the US dollar in the first nine months of this year. However, the ringgit will continue to be influenced by external uncertainties associated with the timing and magnitude of Fed’s interest rates normalisation, the winding down of its balance sheet, and the unpredictable geopolitical tensions. The ringgit is expected to be around RM4.20 per US dollar by end-2017 and RM4.10-4.20 per US dollar by end-2018 (RM4.4860 at end-2016).
24
Malaysia is in a position of strength to face external headwinds. For Malaysia, a flexible exchange rate policy, strong and stable financial system, unencumbered foreign reserves against short-term liabilities, and deepening capital market should buffer Malaysia against the impact of the Fed’s great unwinding. The ringgit stabilization measures should help to ease the Ringgit exchange rate volatility.
Figure 39: Real GDP by economic sector (% YoY)
Economic Sector [% share to GDP in 2016]
2015 2016 2017 1Q
2017 2Q
2017 1H
2017e (SERC)
Agriculture [8.1%] 1.3 -5.1 8.3 5.9 7.1 6.0
Mining & Quarrying [8.8%] 5.3 2.2 1.6 0.2 0.9 1.0
Manufacturing [23.0%] 4.9 4.4 5.6 6.0 5.8 5.7
Construction [4.5%] 8.2 7.4 6.5 8.3 7.4 8.0
Services [54.3%] 5.1 5.6 5.8 6.3 6.1 5.9
Overall GDP 5.0 4.2 5.6 5.8 5.7 5.5
Source: Department of Statistics, Malaysia; Bank Negara Malaysia; SERC
Figure 40: Real GDP by demand component (% YoY)
Demand Component [% share to GDP in 2016]
2015 2016 2017 1Q
2017 2Q
2017 1H
2017e (SERC)
Private Consumption [53.2%] 6.0 6.0 6.6 7.1 6.9 6.8
Public Consumption [13.1%] 4.4 0.9 7.5 3.3 5.3 5.1
Private Investment [16.9%] 6.3 4.3 12.9 7.4 10.0 9.2
Public Investment [8.5%] -1.1 -0.5 3.2 -5.0 -0.9 1.2
Exports of Goods and Services [70.4%] 0.3 1.1 9.8 9.6 9.7 9.9
Imports of Goods and Services [62.1%] 0.8 1.1 12.9 10.7 11.8 11.7
Overall GDP 5.0 4.2 5.6 5.8 5.7 5.5
Source: Department of Statistics, Malaysia; Bank Negara Malaysia; SERC
Figure 41: Malaysia-US’s interest rate differentials
Source: Bank Negara Malaysia; Federal Reserve
-6%
-4%
-2%
0%
2%
4%
6%
8%
10%
12%
199
8 J
an
Jul
199
9 J
an
Jul
200
0 J
an
Jul
200
1 J
an
Jul
200
2 J
an
Jul
200
3 J
an
Jul
200
4 J
an
Jul
200
5 J
an
Jul
200
6 J
an
Jul
200
7 J
an
Jul
200
8 J
an
Jul
200
9 J
an
Jul
201
0 J
an
Jul
201
1 J
an
Jul
201
2 J
an
Jul
201
3 J
an
Jul
201
4 J
an
Jul
201
5 J
an
Jul
201
6 J
an
Jul
201
7 J
an
Jul
MY-US Differential Malaysia Overnight Policy Rate US Federal Funds Rate
25
REVIEW OF KEY ECONOMIC AND FINANCIAL INDICATORS
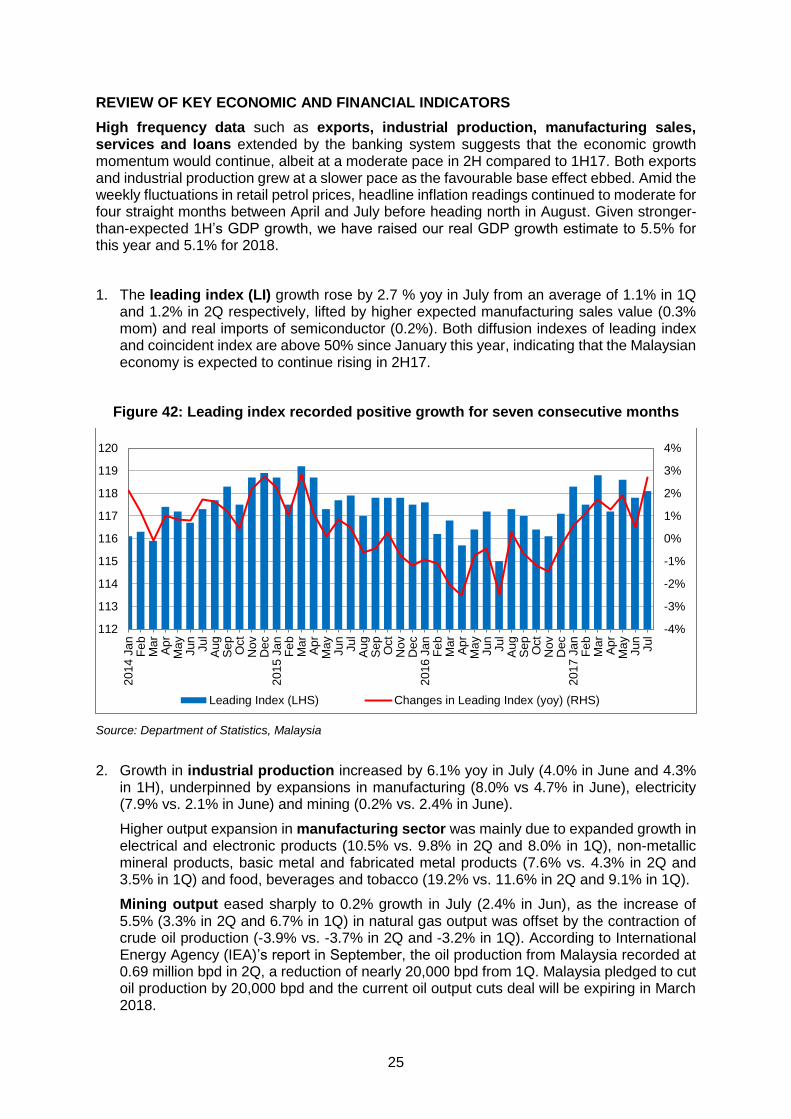
High frequency data such as exports, industrial production, manufacturing sales, services and loans extended by the banking system suggests that the economic growth momentum would continue, albeit at a moderate pace in 2H compared to 1H17. Both exports and industrial production grew at a slower pace as the favourable base effect ebbed. Amid the weekly fluctuations in retail petrol prices, headline inflation readings continued to moderate for four straight months between April and July before heading north in August. Given stronger-than-expected 1H’s GDP growth, we have raised our real GDP growth estimate to 5.5% for this year and 5.1% for 2018.
1. The leading index (LI) growth rose by 2.7 % yoy in July from an average of 1.1% in 1Q and 1.2% in 2Q respectively, lifted by higher expected manufacturing sales value (0.3% mom) and real imports of semiconductor (0.2%). Both diffusion indexes of leading index and coincident index are above 50% since January this year, indicating that the Malaysian economy is expected to continue rising in 2H17.
Figure 42: Leading index recorded positive growth for seven consecutive months
Source: Department of Statistics, Malaysia
2. Growth in industrial production increased by 6.1% yoy in July (4.0% in June and 4.3% in 1H), underpinned by expansions in manufacturing (8.0% vs 4.7% in June), electricity (7.9% vs. 2.1% in June) and mining (0.2% vs. 2.4% in June).
Higher output expansion in manufacturing sector was mainly due to expanded growth in electrical and electronic products (10.5% vs. 9.8% in 2Q and 8.0% in 1Q), non-metallic mineral products, basic metal and fabricated metal products (7.6% vs. 4.3% in 2Q and 3.5% in 1Q) and food, beverages and tobacco (19.2% vs. 11.6% in 2Q and 9.1% in 1Q).
Mining output eased sharply to 0.2% growth in July (2.4% in Jun), as the increase of 5.5% (3.3% in 2Q and 6.7% in 1Q) in natural gas output was offset by the contraction of crude oil production (-3.9% vs. -3.7% in 2Q and -3.2% in 1Q). According to International Energy Agency (IEA)’s report in September, the oil production from Malaysia recorded at 0.69 million bpd in 2Q, a reduction of nearly 20,000 bpd from 1Q. Malaysia pledged to cut oil production by 20,000 bpd and the current oil output cuts deal will be expiring in March 2018.
-4%
-3%
-2%
-1%
0%
1%
2%
3%
4%
112
113
114
115
116
117
118
119
120
201
4 J
an
Fe
bM
ar
Ap
rM
ay
Jun
Jul
Au
gS
ep
Oct
Nov
Dec
201
5 J
an
Fe
bM
ar
Ap
rM
ay
Jun
Jul
Au
gS
ep
Oct
Nov
Dec
201
6 J
an
Fe
bM
ar
Ap
rM
ay
Jun
Jul
Au
gS
ep
Oct
Nov
Dec
201
7 J
an
Fe
bM
ar
Ap
rM
ay
Jun
Jul
Leading Index (LHS) Changes in Leading Index (yoy) (RHS)

26
We expect the industrial output to grow by 4.5-4.8% in 2017 (3.8% in 2016), supported by higher expansion of manufacturing sector and electricity as well as moderate growth in mining output.
Figure 43: Industrial production is driven by positive growth in all sectors
Source: Department of Statistics, Malaysia
3. The external sector continues to deliver a strong performance since November 2016. Total trade rose by 22.0% yoy in August (26.4% in July and 22.0% in 1H). In 8M17, exports and imports expanded by 22.2% and 23.0% respectively. The cumulative trade surplus amounted to RM60.8 billion for the same period.
Exports expanded by 21.5% to RM82.2 billion in August, albeit slower compared to 30.9% in July (20.9% in 1H), underpinned by continued broad-based recovery in global trade and stable commodities prices. Exports of electrical and electronic products expanded by 20.1% to RM31.0 billion, maintaining its dominant position as the primary export earner. Other significant export contributions were: liquefied natural gas (101.8%; share: 4.8%), refined petroleum products (35.5%; share: 5.2%), natural rubber (47.0%; share: 0.5%), and timber and timber-based products (6.1%; share: 2.5%).
Exports to ASEAN increased 16.4%, accounting for 28.4% or RM23.3 billion of Malaysian exports in August, of which Singapore took up nearly half of the share. Export growth to other major trading partners were European Union (21.6%), China (21.2%), Japan (18.0%) and the United States (14.5%). China remained as Malaysia’s largest trading partner with total external trade share of 16.3% (export share of 13.7% and import share of 19.3%) while Singapore is Malaysia’s top export destination.
Going into 2H17 and 2018, the fundamental economic improvements in advanced and emerging economies, continued uptrend in technology demand as well as steady commodity prices are expected to support Malaysia’s exports. But, the disappearing of favourable base effects as well as exchange rate valuation should take some heat from the annual growth of exports. There are risks to our baseline projection of export growth: the inward-looking policies in some advanced economies, some pullback in China’s economic strength, volatile crude oil due to more imbalances in the oil market.
Backed by improved global demand and firmer commodity prices, exports are estimated to grow by 17.5% this year (1.2% in 2016) and 7.0% in 2018.
-25%
-20%
-15%
-10%
-5%
0%
5%
10%
15%
20%
201
1 J
an
Ap
r
Jul
Oct
201
2 J
an
Ap
r
Jul
Oct
201
3 J
an
Ap
r
Jul
Oct
201
4 J
an
Ap
r
Jul
Oct
201
5 J
an
Ap
r
Jul
Oct
201
6 J
an
Ap
r
Jul
Oct
201
7 J
an
Ap
r
Jul
Overall IPI (yoy) Mining (yoy) Manufacturing (yoy) Electricity (yoy)

27
Figure 44: Exports still growing
Source: Department of Statistics, Malaysia
Figure 45: Broad-based exports expansion
Source: Department of Statistics, Malaysia
4. Total sales value of manufacturing sector expanded significantly by 22.2% yoy in July (15.4% in 2Q), marking the highest growth since March 2010. Higher sales value were recorded in electrical and electronic products (27.6%), petroleum, chemical, rubber and plastic products (24.0%) and non-metallic mineral products, basic metal and fabricated metal products (10.2%). These products group collectively contributed 80.4% of total sales value.
-30%
-20%
-10%
0%
10%
20%
30%
40%
50%
60%
0
2
4
6
8
10
12
14
16
18
201
4 J
an
Ma
r
Ma
y
Jul
Se
p
No
v
201
5 J
an
Ma
r
Ma
y
Jul
Se
p
No
v
201
6 J
an
Ma
r
Ma
y
Jul
Se
p
No
v
201
7 J
an
Ma
r
Ma
y
Jul
RM billion
Trade Balance (LHS) Exports (yoy) (RHS) Imports (yoy) (RHS)
-40%
-20%
0%
20%
40%
60%
200
8 J
an
Ap
r
Jul
Oct
200
9 J
an
Ap
r
Jul
Oct
201
0 J
an
Ap
r
Jul
Oct
201
1 J
an
Ap
r
Jul
Oct
201
2 J
an
Ap
r
Jul
Oct
201
3 J
an
Ap
r
Jul
Oct
201
4 J
an
Ap
r
Jul
Oct
201
5 J
an
Ap
r
Jul
Oct
201
6 J
an
Ap
r
Jul
Oct
201
7 J
an
Ap
r
Jul
Total Exports (yoy) E&E Exports (yoy) Non-E&E Exports (yoy)
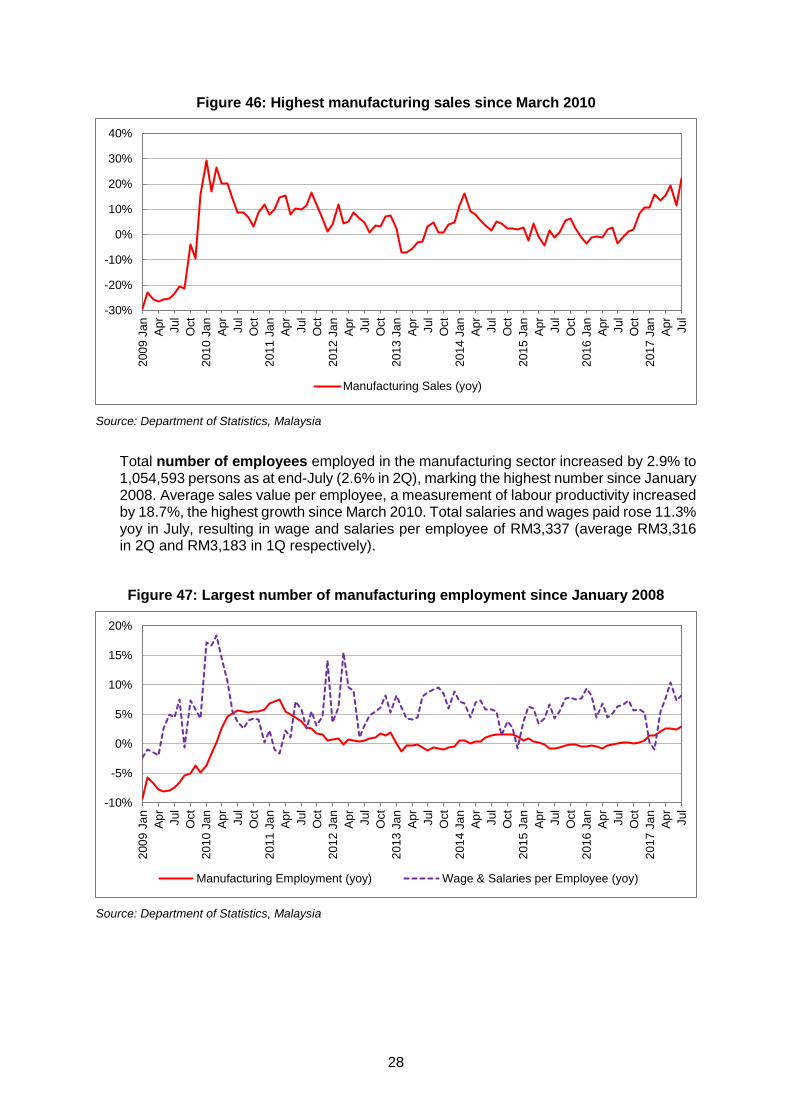
28
Figure 46: Highest manufacturing sales since March 2010
Source: Department of Statistics, Malaysia
Total number of employees employed in the manufacturing sector increased by 2.9% to 1,054,593 persons as at end-July (2.6% in 2Q), marking the highest number since January 2008. Average sales value per employee, a measurement of labour productivity increased by 18.7%, the highest growth since March 2010. Total salaries and wages paid rose 11.3% yoy in July, resulting in wage and salaries per employee of RM3,337 (average RM3,316 in 2Q and RM3,183 in 1Q respectively).
Figure 47: Largest number of manufacturing employment since January 2008
Source: Department of Statistics, Malaysia
-30%
-20%
-10%
0%
10%
20%
30%
40%2
00
9 J
an
Ap
r
Jul
Oct
201
0 J
an
Ap
r
Jul
Oct
201
1 J
an
Ap
r
Jul
Oct
201
2 J
an
Ap
r
Jul
Oct
201
3 J
an
Ap
r
Jul
Oct
201
4 J
an
Ap
r
Jul
Oct
201
5 J
an
Ap
r
Jul
Oct
201
6 J
an
Ap
r
Jul
Oct
201
7 J
an
Ap
r
Jul
Manufacturing Sales (yoy)
-10%
-5%
0%
5%
10%
15%
20%
200
9 J
an
Ap
r
Jul
Oct
201
0 J
an
Ap
r
Jul
Oct
201
1 J
an
Ap
r
Jul
Oct
201
2 J
an
Ap
r
Jul
Oct
201
3 J
an
Ap
r
Jul
Oct
201
4 J
an
Ap
r
Jul
Oct
201
5 J
an
Ap
r
Jul
Oct
201
6 J
an
Ap
r
Jul
Oct
201
7 J
an
Ap
r
Jul
Manufacturing Employment (yoy) Wage & Salaries per Employee (yoy)

29
5. The services sector printed an increase of 9.6% yoy in sales value to RM383.5 billion in 2Q (8.3% in 1Q), mainly thanks to a stronger rise of 9.7% to RM286.6 billion in the distributive trade, which contributed 74.7% of total sales value.
Distributive trade grew higher by 11.1% in July, lifted by higher expansions in wholesale (9.2% vs. 8.7% in 2Q), retail (14.1% vs. 13.5% in 2Q) and motor vehicle (9.8% vs. 2.5% in 2Q).
Figure 48: Encouraging retail sales
Source: Department of Statistics, Malaysia
Among the subsectors posting positive sales growth in 2Q were: professional (24.0% vs 20.5% in 1Q; share: 2.0%), information and communication (10.3% vs. 6.3% in 1Q; share: 7.8%), food and beverages (10.1% vs. 6.9%in 1Q; share: 3.6%), real estate agent (9.0% vs. 8.2% in 1Q; share: 0.2%), private education (8.6% vs. 8.8% in 1Q; share: 1.1%), arts, entertainment & recreation (8.5% vs. 8.1% in 1Q; share: 1.5%), transportation and storage (6.7% vs. 6.2% in 1Q; share: 7.1%), private health (5.2% vs. 6.4% in 1Q; share: 1.2%) and accommodation (2.4% vs. 1.6% in 1Q; share: 0.8%).
Total number of employees engaged in services sector rose by 3.4% to 3,603,252 persons in 2Q (2.7% in 1Q). Total salaries and wages paid increased by 5.4% to RM23.2 billion in 2Q. By subsector, an employee in information and communication sector received the highest monthly average pay of RM5,607. Employee’s productivity growth as measured by sales value per employee outpaced wage per employee to increase by 6.0%. The wholesale subsector registered the highest productivity growth.
6. Private consumption indicators showed mixed performance. While consumer sentiment continued to improve, the MIER’s consumer sentiment index (CSI) of 80.7 in 2Q (76.6 in 1Q) remains below the 100-point optimum threshold since 3Q14. Nevertheless, the not so strong consumer sentiment did not translate into weak consumer spending. Private consumption grew 6.9% yoy in 1H17, as private sector’s wage growth surged 7.1% in 2Q from 4.5% in 1Q. Unemployment rate edged higher to 3.5% in July after stabilising at 3.4% for four straight months. The rate has been hovering between 3.4-3.5% since December 2015.
-10%
-5%
0%
5%
10%
15%
20%
201
5 J
an
Fe
b
Ma
r
Ap
r
Ma
y
Jun
Jul
Au
g
Se
p
Oct
Nov
Dec
201
6 J
an
Fe
b
Ma
r
Ap
r
Ma
y
Jun
Jul
Au
g
Se
p
Oct
Nov
Dec
201
7 J
an
Fe
b
Ma
r
Ap
r
Ma
y
Jun
Jul
Wholesale Trade Revenue (yoy) Retail Trade Revenue (yoy)
Motor Vehicles Revenue(yoy)

30
Following a strong double-digit growth of 15.6% in July, passenger car sales declined marginally by 0.5% in August (4.7% in 1H), which was in tandem with the trend in total loan approval for purchase of passenger cars (-2.4% in August and 10.5% in July). In the first half-year, passenger cars and MPV sub-segment recorded positive growth in sales while window vans and 4WD/SUV sub-segment recorded declining sales. Total industry volume of 284,461 units recorded in 1H made up 48.2% of the Malaysian Automotive Association (MAA)’s forecast of 522,000 units. With the current sales level already made up 66.1% of MAA’s target and also the anticipated stronger sales in December due to end-year discounts and promotions, passenger car sales target of 522,000 units for this year looks attainable.
Figure 49: High fluctuations in passenger car sales
Source: Bank Negara Malaysia
Consumption credit rose by 0.8% in August from 0.7% in July, but still lower than 0.9% in 2Q, whereas imports of consumption goods continued to increase at double digit growth of 17.8% in August, albeit slower than 21.8% in July (1.5% in 2Q), mainly on higher spending on processed food and beverages due to festive demand during the Aidilfitri celebration.
-30%
-20%
-10%
0%
10%
20%
30%
40%
50%
60%
200
8 J
an
Ap
r
Jul
Oct
200
9 J
an
Ap
r
Jul
Oct
201
0 J
an
Ap
r
Jul
Oct
201
1 J
an
Ap
r
Jul
Oct
201
2 J
an
Ap
r
Jul
Oct
201
3 J
an
Ap
r
Jul
Oct
201
4 J
an
Ap
r
Jul
Oct
201
5 J
an
Ap
r
Jul
Oct
201
6 J
an
Ap
r
Jul
Oct
201
7 J
an
Ap
r
Jul
Passenger Car Sales (yoy)
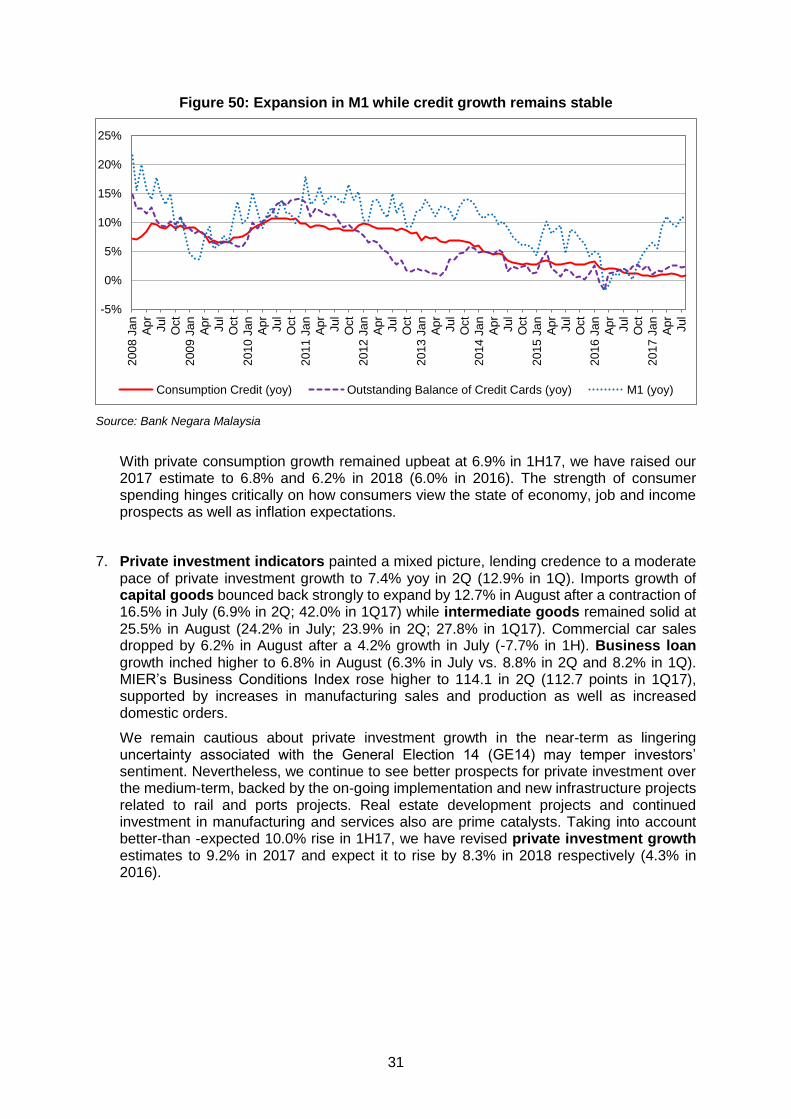
31
Figure 50: Expansion in M1 while credit growth remains stable
Source: Bank Negara Malaysia
With private consumption growth remained upbeat at 6.9% in 1H17, we have raised our 2017 estimate to 6.8% and 6.2% in 2018 (6.0% in 2016). The strength of consumer spending hinges critically on how consumers view the state of economy, job and income prospects as well as inflation expectations.
7. Private investment indicators painted a mixed picture, lending credence to a moderate pace of private investment growth to 7.4% yoy in 2Q (12.9% in 1Q). Imports growth of capital goods bounced back strongly to expand by 12.7% in August after a contraction of 16.5% in July (6.9% in 2Q; 42.0% in 1Q17) while intermediate goods remained solid at 25.5% in August (24.2% in July; 23.9% in 2Q; 27.8% in 1Q17). Commercial car sales dropped by 6.2% in August after a 4.2% growth in July (-7.7% in 1H). Business loan growth inched higher to 6.8% in August (6.3% in July vs. 8.8% in 2Q and 8.2% in 1Q). MIER’s Business Conditions Index rose higher to 114.1 in 2Q (112.7 points in 1Q17), supported by increases in manufacturing sales and production as well as increased domestic orders.
We remain cautious about private investment growth in the near-term as lingering uncertainty associated with the General Election 14 (GE14) may temper investors’ sentiment. Nevertheless, we continue to see better prospects for private investment over the medium-term, backed by the on-going implementation and new infrastructure projects related to rail and ports projects. Real estate development projects and continued investment in manufacturing and services also are prime catalysts. Taking into account better-than -expected 10.0% rise in 1H17, we have revised private investment growth estimates to 9.2% in 2017 and expect it to rise by 8.3% in 2018 respectively (4.3% in 2016).
-5%
0%
5%
10%
15%
20%
25%2
00
8 J
an
Ap
r
Jul
Oct
200
9 J
an
Ap
r
Jul
Oct
201
0 J
an
Ap
r
Jul
Oct
201
1 J
an
Ap
r
Jul
Oct
201
2 J
an
Ap
r
Jul
Oct
201
3 J
an
Ap
r
Jul
Oct
201
4 J
an
Ap
r
Jul
Oct
201
5 J
an
Ap
r
Jul
Oct
201
6 J
an
Ap
r
Jul
Oct
201
7 J
an
Ap
r
Jul
Consumption Credit (yoy) Outstanding Balance of Credit Cards (yoy) M1 (yoy)

32
Figure 51: Private investment indicators show mixed results
Source: Bank Negara Malaysia
8. Headline inflation, as measured by the Consumer Price Index (CPI) reversed its slowing trend to increase by 3.7% yoy in August (3.2% in July) from 4.0% in 2Q and 4.3% in 1Q. Despite the CPI has moderated from high, households were not convinced that prices of goods and services have increased at slower pace. Their real purchasing power continued to shrink as cost-induced price pressures remained elevated. Core inflation, which excludes volatile items up 2.4% in August. It has been hovering between 2.3% and 2.6% since January this year, largely driven by prices of food and non-alcoholic beverages.
Figure 52: Inflation turns higher on increasing fuel prices
Source: Department of Statistics, Malaysia
-40%
-20%
0%
20%
40%
60%
80%
100%2
00
8 J
an
Ap
r
Jul
Oct
200
9 J
an
Ap
r
Jul
Oct
201
0 J
an
Ap
r
Jul
Oct
201
1 J
an
Ap
r
Jul
Oct
201
2 J
an
Ap
r
Jul
Oct
201
3 J
an
Ap
r
Jul
Oct
201
4 J
an
Ap
r
Jul
Oct
201
5 J
an
Ap
r
Jul
Oct
201
6 J
an
Ap
r
Jul
Oct
201
7 J
an
Ap
r
Jul
Sales of Commercial Vehicles (yoy) Import of Investment Goods (yoy)
Import of Intermediate Goods (yoy)
0%
1%
2%
3%
4%
5%
6%
201
1 J
an
Ap
r
Jul
Oct
201
2 J
an
Ap
r
Jul
Oct
201
3 J
an
Ap
r
Jul
Oct
201
4 J
an
Ap
r
Jul
Oct
201
5 J
an
Ap
r
Jul
Oct
201
6 J
an
Ap
r
Jul
Oct
201
7 J
an
Ap
r
Jul
CPI (yoy) Core CPI (yoy)

33
The price index of transport group increased significantly by 11.7% in August (7.7% in July), lifted by 20.4% jump in fuels and lubricants for personal transport equipment, which accounts for 7.8% of the CPI basket. The average price for a litre of RON95 petrol was around RM2.12 in August 2017, representing a marked difference of 37 sen per litre or 21.1% increase when compared to RM1.75 in August 2016.
Food & non-alcoholic beverages, the largest component of CPI basket increased 4.3% in August. Food prices have been stabilised in the range of 4.0% to 4.4% since January. By state, the states which registered higher food prices were Johor (5.0%), followed by Malacca (4.9 %), Penang, Kuala Lumpur, Sabah and Labuan at 4.8% each respectively.
While the cost-push inflation has caused broader price increases, demand pressure inflicted by a wage-price spiral is not seen as core inflation increased moderately. Though the headline inflation readings will moderate in 2H17, the pace of price increases will depend on global crude oil prices, which have firmed up in recent weeks. We estimate inflation to average 3.9% this year (2.1% in 2016).
Figure 53: Fuel prices rise again after four consecutive months of slowing down
Source: Department of Statistics, Malaysia
9. All loan indicators continued to register positive, albeit mixed for two straight months in July and August. Loan applications slowed down to 4.1% in August from 22.9% in July. The same trend also seen in loan approvals, which moderated sharply to 9.9% from 24.8%. In contrast, loan disbursements expanded higher by 15.8% in August from 13.3% in July. Total loan outstanding growth inched up to 5.8% in August (5.6% in July), but still slower when compared to 6.6% in 1H.
Household loan growth paced at a slower rate of 5.0% after stabilising at 5.1% for four straight months in April-July. The drag came from lower disbursements in August (7.2% vs. 15.8% in July). Business loan growth moved higher to 6.8% in August (6.3% in July; 8.5% in 1H), with decent growth in wholesale, retail, restaurants and hotels (6.0%), real estate (6.0%), financing, insurance and business services (4.8%) and manufacturing including agro-based (4.6%).
-15%
-10%
-5%
0%
5%
10%
15%
20%
25%
30%
-3%
-2%
-1%
0%
1%
2%
3%
4%
5%
6%
201
1 J
an
Ap
r
Jul
Oct
201
2 J
an
Ap
r
Jul
Oct
201
3 J
an
Ap
r
Jul
Oct
201
4 J
an
Ap
r
Jul
Oct
201
5 J
an
Ap
r
Jul
Oct
201
6 J
an
Ap
r
Jul
Oct
201
7 J
an
Ap
r
Jul
Food & Non-Alcoholic Beverages (yoy) (LHS)
Housing, Water, Electricity, Gas & Other Fuels (yoy) (LHS)
Services (yoy) (LHS)
Transport (yoy) (RHS)

34
Loan applications growth in August was mainly driven by the purchase of residential property (13.1% vs. 27.5% in July), but offset by a sharp decline of 9.9% for the purpose of working capital (2.5% in July). The steep slowdown in growth of loan approvals were caused by contractions in loans for the purchase of passenger cars (-2.4%) and working capital (-24.4%).
Loan disbursements were markedly higher in August due to a turnaround in the purchase of transport vehicle (5.9% vs -6.4% in July), continued purchase of residential property, albeit slower (6.0% vs. 18.2% in July), purchase of non-residential property (16.2% vs. -0.8% in July), credit cards (6.9% vs. 0.1% in July) and working capital (18.6% vs. 13.3% in July).
We estimate the banking system’s loans growth to rise by 4.5% this year (5.3% in 2016), and 5.0% in 2018, supported by improved loans demand from both households and businesses.
Figure 54: Household loan growth moderated further in August
Source: Bank Negara Malaysia
10. Bank Negara Malaysia’s holdings of foreign exchange crawled back to above US$100 billion-mark, reaching US$101.2 billion as at end-September 2017, marking an increase of US$6.7 billion from US$94.5 billion at end-December 2016. The return of foreign flows into government bonds, continued surpluses in both trade and current account as well as FDI have been underpinning the rise in foreign reserves. The current level of reserves is sufficient to finance 7.6 months of retained imports and were 1.1 times the short-term external debt.
0%
2%
4%
6%
8%
10%
12%
14%
16%
18%
200
8 J
an
Ap
r
Jul
Oct
200
9 J
an
Ap
r
Jul
Oct
201
0 J
an
Ap
r
Jul
Oct
201
1 J
an
Ap
r
Jul
Oct
201
2 J
an
Ap
r
Jul
Oct
201
3 J
an
Ap
r
Jul
Oct
201
4 J
an
Ap
r
Jul
Oct
201
5 J
an
Ap
r
Jul
Oct
201
6 J
an
Ap
r
Jul
Oct
201
7 J
an
Ap
r
Jul
Total Loans (yoy) Household Sector (yoy) Business Sector (yoy)
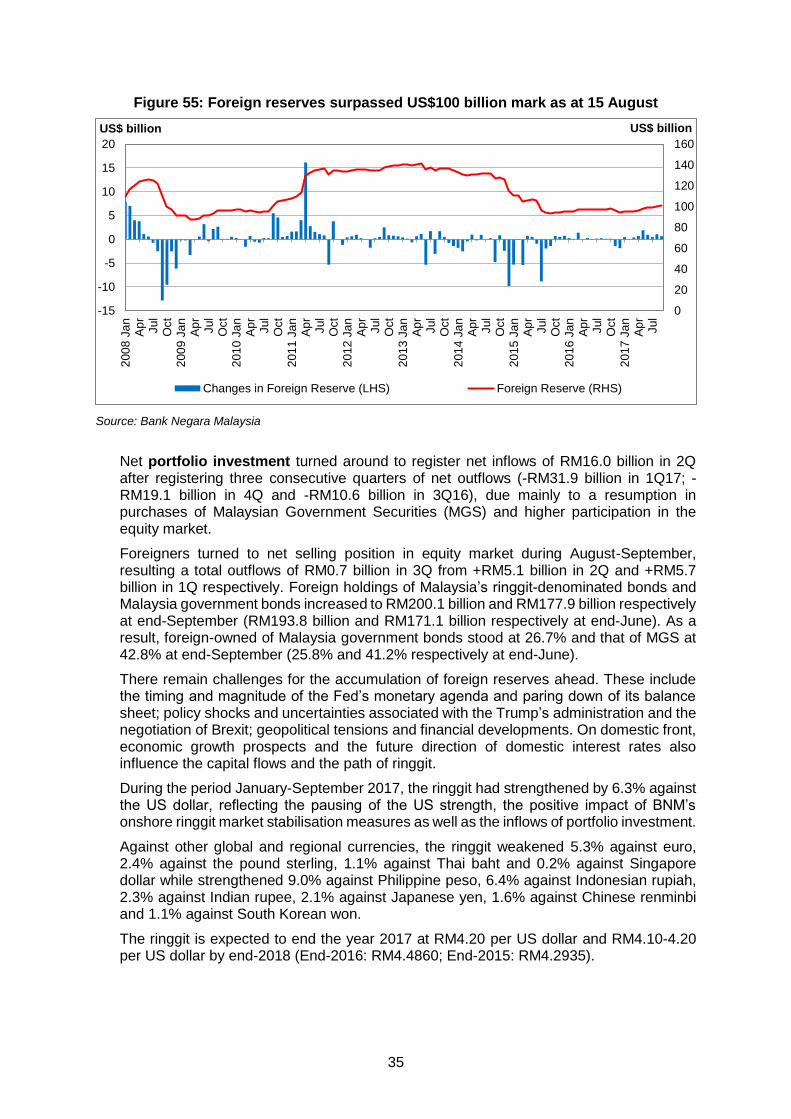
35
Figure 55: Foreign reserves surpassed US$100 billion mark as at 15 August
Source: Bank Negara Malaysia
Net portfolio investment turned around to register net inflows of RM16.0 billion in 2Q after registering three consecutive quarters of net outflows (-RM31.9 billion in 1Q17; -RM19.1 billion in 4Q and -RM10.6 billion in 3Q16), due mainly to a resumption in purchases of Malaysian Government Securities (MGS) and higher participation in the equity market.
Foreigners turned to net selling position in equity market during August-September, resulting a total outflows of RM0.7 billion in 3Q from +RM5.1 billion in 2Q and +RM5.7 billion in 1Q respectively. Foreign holdings of Malaysia’s ringgit-denominated bonds and Malaysia government bonds increased to RM200.1 billion and RM177.9 billion respectively at end-September (RM193.8 billion and RM171.1 billion respectively at end-June). As a result, foreign-owned of Malaysia government bonds stood at 26.7% and that of MGS at 42.8% at end-September (25.8% and 41.2% respectively at end-June).
There remain challenges for the accumulation of foreign reserves ahead. These include the timing and magnitude of the Fed’s monetary agenda and paring down of its balance sheet; policy shocks and uncertainties associated with the Trump’s administration and the negotiation of Brexit; geopolitical tensions and financial developments. On domestic front, economic growth prospects and the future direction of domestic interest rates also influence the capital flows and the path of ringgit.
During the period January-September 2017, the ringgit had strengthened by 6.3% against the US dollar, reflecting the pausing of the US strength, the positive impact of BNM’s onshore ringgit market stabilisation measures as well as the inflows of portfolio investment.
Against other global and regional currencies, the ringgit weakened 5.3% against euro, 2.4% against the pound sterling, 1.1% against Thai baht and 0.2% against Singapore dollar while strengthened 9.0% against Philippine peso, 6.4% against Indonesian rupiah, 2.3% against Indian rupee, 2.1% against Japanese yen, 1.6% against Chinese renminbi and 1.1% against South Korean won.
The ringgit is expected to end the year 2017 at RM4.20 per US dollar and RM4.10-4.20 per US dollar by end-2018 (End-2016: RM4.4860; End-2015: RM4.2935).
0
20
40
60
80
100
120
140
160
200
8 J
an
Ap
rJul
Oct
200
9 J
an
Ap
rJul
Oct
201
0 J
an
Ap
rJul
Oct
201
1 J
an
Ap
rJul
Oct
201
2 J
an
Ap
rJul
Oct
201
3 J
an
Ap
rJul
Oct
201
4 J
an
Ap
rJul
Oct
201
5 J
an
Ap
rJul
Oct
201
6 J
an
Ap
rJul
Oct
201
7 J
an
Ap
rJul
-15
-10
-5
0
5
10
15
20
US$ billionUS$ billion
Changes in Foreign Reserve (LHS) Foreign Reserve (RHS)

36
Figure 56: The ringgit records mixed performance against major foreign currencies
Source: Bank Negara Malaysia
Figure 57: Ringgit bounced back against CNY recently
Source: Bank Negara Malaysia
-10%
-8%
-6%
-4%
-2%
0%
2%
4%
6%
8%3
0/1
2/2
01
6
14/0
1/2
01
7
29/0
1/2
01
7
13/0
2/2
01
7
28/0
2/2
01
7
15/0
3/2
01
7
30/0
3/2
01
7
14/0
4/2
01
7
29/0
4/2
01
7
14/0
5/2
01
7
29/0
5/2
01
7
13/0
6/2
01
7
28/0
6/2
01
7
13/0
7/2
01
7
28/0
7/2
01
7
12/0
8/2
01
7
27/0
8/2
01
7
11/0
9/2
01
7
26/0
9/2
01
7
USD EUR JPY GBP SGD
-2.0%
-1.0%
0.0%
1.0%
2.0%
3.0%
4.0%
5.0%
30/1
2/2
01
6
14/0
1/2
01
7
29/0
1/2
01
7
13/0
2/2
01
7
28/0
2/2
01
7
15/0
3/2
01
7
30/0
3/2
01
7
14/0
4/2
01
7
29/0
4/2
01
7
14/0
5/2
01
7
29/0
5/2
01
7
13/0
6/2
01
7
28/0
6/2
01
7
13/0
7/2
01
7
28/0
7/2
01
7
12/0
8/2
01
7
27/0
8/2
01
7
11/0
9/2
01
7
26/0
9/2
01
7
CNY


SOCIO-ECONOMIC RESEARCH CENTRE (SERC) SERC SDN BHD (918837-W) 6th Floor, Wisma Chinese Chamber, 258, Jalan Ampang, 50450 Kuala Lumpur, Malaysia. Tel: (603) 4260 3116 / 3119 Fax: (603) 4260 3118 Email: [email protected] Website: http://www.acccimserc.com