quarterly economic report q2|2016 - deloitte are very pleased to release quarterly economic report...
TRANSCRIPT

Quarterly Economic ReportQ2|2016Deloitte Touche Tohmatsu Jaiyos Clients and Industry

Contents
Executive Summary 4
Global & Asian Economic Review 8
AEC Economic Review 11
AEC Blueprint 2025: Vision, Strategies, and Challenges 23
Thailand Economic Review 39
Brexit: A Serious Risk to Thailand’s Growth? 42
Thailand Reform Review 46
Industry Sector Update 54
Automotive 56
Finance & Banking 59
Electronics 63
Residential Real Estate 67
Wholesale & Retail 70
Tourism 73
Upcoming Report Highlights 76
© 2016 Deloitte Touche Tohmatsu Jaiyos Co., Ltd.| Quarterly Economic Report : Q2 | 2016 2

© 2016 Deloitte Touche Tohmatsu Jaiyos Co., Ltd.| Quarterly Economic Report : Q2 | 2016 3
Dear Our Valued Clients,
We are very pleased to release Quarterly Economic Report Q2|2016 to you. It is a part of our constant endeavors to provide valuable insights to our clients. This high level update and summary of the market conditions will hopefully be beneficial in helping you to understand the business environment so as to support you in your decision making process and further development of your business strategies.
Global economic growth continues to be sluggish. Economic activities are forecasted to improve at a steady pace but the pace is not expected to be sustainable. Developed economies are still dependent on central bank stimulus, while soft demand in the West and China will affect the performance in developing economies. It is projected that global real GDP in 2016 may reach 3.1%. Asian region’s growth prospects is expected to be moderate and is unlikely to be improving much this year. Increased levels of investments in infrastructure projects in ASEAN is vital to sustain growth, as past levels have constrained growth. ASEAN’s growth should remain stable from 2016 onwards. Meanwhile,Thailand’s economic outlook is estimated at 3.0%, underpinned by a highly competitive tourism industry coupled with government spending but weak merchandise exports and lackluster consumer demand will create headwinds.
On behalf of Deloitte Thailand, we very much look forward to supporting you in the dynamic and changing business environment. If you have any questions or inputs, please do not hesitate to contact us at Deloitte.
Best Regards,
Subhasakdi KrishnamraCountry Managing Partner

Executive Summary
© 2016 Deloitte Touche Tohmatsu Jaiyos Co., Ltd.| Quarterly Economic Report : Q2 | 2016 4

© 2016 Deloitte Touche Tohmatsu Jaiyos Co., Ltd.| Quarterly Economic Report : Q2 | 2016 5
Executive SummaryGlobal economic growth continues to be sluggish. Developed economies are still dependent on central bank stimulus, while soft demand in the West and China will affect the performance in developing economies.
Global and major economies’ GDP growth in 2016
Asia 1/
5.2%
World3.1%
UnitedState2.0% Euro
Area1.6%
China6.7%
Japan0.5%
ASEAN5.0%
India7.4%
Sources: ADB, EIU, European Economic forecast, & IMFRemark : 1/ Asia’s GDP growth excl. Japan

© 2016 Deloitte Touche Tohmatsu Jaiyos Co., Ltd.| Quarterly Economic Report : Q2 | 2016 6
ASEAN’s prospects remain stable from 2016 onwards. More infrastructure investment in ASEAN is vital to sustain growth as weak infrastructure has limited growth in the past.
ASEAN’s GDP growth in 2016
Myanmar
7.8%Philippines
5.7%
Indonesia
5.1%
Viet Nam
6.3%
Malaysia
4.3%Singapore
1.4%
Thailand
3.0%
Lao PDR
7.8%
Cambodia
6.8%
Brunei
0.7%
ASEAN5.0%
Sources: ADB,EIU, & IMF

© 2016 Deloitte Touche Tohmatsu Jaiyos Co., Ltd.| Quarterly Economic Report : Q2 | 2016 7
Global economic growth still finds a way to a strengthening path. Global economic activities are forecasted to improve at a steady pace but the pace is not expected to be sustainable. Even if some signs of recovery such as temporarily stabilized Chinese economy, Higher oil prices, better-than-expected growth in some economies are shown, the projection of growth is still 3.1% in 2016.
Asian region’s growth prospects still face difficulties. The region’s growth will slightly moderate and is unlikely to improve much this year. Economic growth in China continue to decline. Shrinking population and labour force in Japan will limit growth in the future. Meanwhile, high private consumption and low commodity price enable India to continue its strong growth path.
Annual real GDP growth in ASEAN is projected to reach 5.0% in 2016. Growth in ASEAN will be more stable from 2017 onwards due to increasing integration of the region’s economies. Some member states, however, will fail to fulfill their growth potential.
Thailand’s economic outlook is forecasted to reach 3.0% underpinned by highly competitive tourism industry and government spending but weak merchandise exports and lackluster consumer demand will create headwinds.
A modest recovery in developed economies continues. Overall economy remains resilient. Meanwhile, growth rates of emerging market and developing economies remain steady owing to downside risks including low commodity prices, tighter external financial conditions and structural reform.
World Economy
United States
Euro Area Asia Japan China India ASEAN Thailand
2014 3.3 2.4 0.9 5.6 (0.1) 7.4 7.2 4.6 0.8
2015 3.1 2.4 1.5 5.4 0.7 6.9 7.3 4.6 2.8
2016F 3.1 2.0 1.6 5.2 0.5 6.7 7.4 5.0 3.0
2017F-2020F 3.2 1.9 1.6 4.7 0.4 4.9 7.3 5.4 3.0
-1.0 0.0 1.0 2.0 3.0 4.0 5.0 6.0 7.0 8.0
Trend
Real
GD
P G
row
th R
ate
(%)
Sources: Compiled from various research houses & agencies (e.g. IMF, ADB, EIU, NESDB) & DTTJ AnalysisRemark : Asia’s GDP growth excl Japan

Global & AsianEconomic Review
© 2016 Deloitte Touche Tohmatsu Jaiyos Co., Ltd.| Quarterly Economic Report : Q2 | 2016 8

© 2016 Deloitte Touche Tohmatsu Jaiyos Co., Ltd.| Quarterly Economic Report : Q2 | 2016 9
Some signs of recovery are shown but the global economy will not quickly get back on its feet.
A better-than-expect growth in some developed economies, along with more stabilsed Chinese market will help promote global growth this year, but the pace is expectedly not sustained.
Global economic activities are forecasted to modestly improve at a steady pace but the pace is not expected to be sustainable. Downside risks to the global economy such as China’s rebalancing, lower commodity prices, tighter global financing conditions, and ongoing geopolitical tensions still continue to worsen the economic outlook. A sigh of a pick-up in global growth is expected from 2017 onwards.
World Economy
Weak demand in developed market, coupled with the slowdown in large developing economies will continue to limit growth prospects in Asia. The growth projection for the Asian economies is 5.2% this year and drop to 4.7% on average in 2017-2020.
In the next five years, it is forecasted that a region will face more difficulty to sustain its economic growth owing to the projected slowdown in China’s growth and the uneven demand from the US and Europe.
Asia (Excl Japan)A stronger expansion in consumer spending, an improvement in manufacturing activity, rapid growth of new house and retail sales and more government spending will help encourage growth this year. Nonetheless, weak external demand, the strong dollar, and low oil prices will partly affect the economic outlook for 2016. It is, then, estimated that growth in 2016 will not exceed 2%
Average real GDP growth in 2017-2018 is forecasted at 2.3% before contracting to roughly 1% due to saturated job market, low consumer demand, inflated asset prices, and other serious external risks such as a hard landing in China and Brexit
United State
Challenges to the economic growth have increased including the UK’s Brexit vote. It is, however, projected that the region will modestly grow at 1.6% in 2016 supported by an improved labour market and ultra-loosen monetary policy.
Euro Area
World Economy United States Euro Area Asia 2014 3.3 2.4 0.9 5.6
2015 3.1 2.4 1.5 5.4
2016F 3.1 2.0 1.6 5.2
2017F-2020F 3.2 1.9 1.6 4.7
0.0
1.0
2.0
3.0
4.0
5.0
6.0
Trend
Real
GD
P G
row
th R
ate
(%)
Sources: ADB, EIU, European Economic forecast, & IMF

© 2016 Deloitte Touche Tohmatsu Jaiyos Co., Ltd.| Quarterly Economic Report : Q2 | 2016 10
Challenges still lie ahead due to headwinds from continued sluggish global recovery and trade as well as impacts of China’s growth transition.
Asian region’s growth prospects still face difficulties. Growth in the region will slightly moderate this year but will significantly drop in 2017-2020 owing to a prolonged slowdown in aggregate investment and trade.
Japanese economy is expected to grow 0.5% in 2016. Private consumption, together with ultra-loosen monetary policy will help drive growth while external headwinds from stronger yen and weak global demand will constrain Japan’s economic expansion.
The economy in 2017-2020 is forecasted to grow 0.4% on average. The main constraint on potential growth is the rapid labour shortage that will undermine the consumption and investment sentiment. Meanwhile, the benefits of TPP will expectedly be received after 2020.
JapanReal GDP growth in 2016 is expected to roughly drop to 6.7%, compared to 6.9% in 2015. Private consumption growth will decelerate, but remain robust while the acceleration in investment, especially in housing market activity is forecasted.
In the next five years, it is speculated that real GDP growth will ease to 5.0% on average in 2017-2020 as a result of the slow pace of reform and a failure to strengthen credibility to control debt levels. A debt crisis in banking sector might result in a severe contraction in investment and potentially lead to a recession.
China
High saving rates and strong growth in labour force and middle class will play an important role in boosting India’s economy in 2016. The expansion will be also driven by growth in healthcare, retailing, hospitality, and education. Some of the government’s reform initiatives will boost investment. “Make in India” Campaign will help promote both domestic and foreign investment. Meanwhile, the bankruptcy reform will improve capital allocation.
India
Japan China India
2014 (0.1) 7.4 7.2
2015 0.7 6.9 7.3
2016F 0.5 6.7 7.4
2017F-2020F 0.4 4.9 7.3
(1.0)
0.0
1.0
2.0
3.0
4.0
5.0
6.0
7.0
8.0
Trend
Real
GD
P G
row
th R
ate
(%)
Sources: ADB, EIU, European Economic forecast, & IMF

AEC Economic Review
© 2016 Deloitte Touche Tohmatsu Jaiyos Co., Ltd.| Quarterly Economic Report : Q2 | 2016 11

© 2016 Deloitte Touche Tohmatsu Jaiyos Co., Ltd.| Quarterly Economic Report : Q2 | 2016 12
ASEAN in the Global EconomyIn 2014,…
ASEAN Economy ASEAN Population ASEAN Trade and FDI
1,367 M 1,259 M 622 M 504 M 319 M
largest in Asia
largest in the world
3rd
7th
ASEAN GDP nearly doubled from USD 1.33 trillion in 2007 to USD 2.57 trillion in 2014.
76% increase in GDP per capita from 2007 to 2014
largest in the world3rd
In 2014, the total population in ASEAN was 622 million.
More than 50% of population in ASEAN is under 30 years old.
trade & FDI has become more influential
Intra-ASEAN
Total trade increased almost USD 1 trillion during 2007 to 2014.
Total FDI inflows shifted from USD 85 billion (5% share to the world) to USD 136 billion (11% of share to the world).
Intra-ASEAN trade contributed to the largest share of trade in ASEAN by trading partner.
Intra-ASEAN FDI was the 2nd
highest source of total FDI inflows into ASEAN.
Source: ASEAN Secretariat

© 2016 Deloitte Touche Tohmatsu Jaiyos Co., Ltd.| Quarterly Economic Report : Q2 | 2016 13
Real GDP growth rate of ASEAN economies from 2014 – 2020F
Growth in ASEAN will be more stable in 2016 – 2020 due to the increasing integration of the region’s economies.
Annual real GDP growth in ASEAN is projected to reach 5.0% in 2016 and 5.4% on average during 2017-2020. Some member states, however, will fail to fulfill their growth potential.
Real GDP Growth Rate (%)
ASEAN Brunei Darussalam
Cambodia Indonesia Lao PDR Malaysia Myanmar Philippines Singapore Thailand Viet Nam
2014 4.6 (2.3) 7.0 5.0 7.4 6.0 6.4 6.1 2.9 0.8 6.0
2015 4.6 (1.2) 6.9 4.8 7.5 5.0 6.8 5.9 2.0 2.8 6.7
2016F 5.0 0.7 6.8 5.1 7.8 4.3 7.8 5.7 1.4 3.0 6.3
2017F-2020F 5.4 1.2 7.3 5.1 7.7 4.6 9.1 5.2 3.1 3.0 6.5
Trend
-2.0
-1.0
0.0
1.0
2.0
3.0
4.0
5.0
6.0
7.0
8.0
9.0
10.0
2014 2015 2016F 2017F 2020F
ASEAN
Brunei
Cambodia
Indonesia
Lao PDR
Malaysia
Myanmar
Philippines
Singapore
Thailand
Viet Nam
Lao PDR Cambodia
Myanmar
Thailand
Viet Nam
Brunei
Philippines
Malaysia
Indonesia
Singapore
ASEAN
Sources: ADB, EIU, IMF, NESDB, & Research Houses

© 2016 Deloitte Touche Tohmatsu Jaiyos Co., Ltd.| Quarterly Economic Report : Q2 | 2016 14
BruneiLow hydrocarbon prices will continually suppress the sultanate’s exports. A country is still struggling to sustain its economic growth.
GDP growth Private consumption
Total investment
Government Balance1/
Current Acocunt
Balance 1/ Inflation
2015 (1.2) 0.4 (0.7) 6.5 (0.4)
2016F 0.7 1.4 (13.5) (1.3) (0.2)
(15.0)
(10.0)
(5.0)
-
5.0
10.0
n/a n/a
With the high degree of dependency on oil and gas production, the decline in oil and gas production as well as their prices will impede the sultanate’s economic growth. Only a small increase in real GDP in 2016 is forecasted.
Brunei’ s current account will continues to fall as a result of the decline in oil and gas trade surplus. Nonetheless, a small fall in unemployment has been shown due to a slight improvement in oil and gas prices in early months of 2016.
A number of infrastructure projects such as a bridge to Pulau Muara Besar island and Temburong bridge project are under way. The protracted maintenance work on oil and gas facilities still drag on the whole economy. However, the growth in non-energy sector such as fisheries, education services, wholesale and retail trade has recorded an increase.
Bandar Seri Begawan
Brunei economy forecasted to grow 0.7% in 2016Real expenditure on GDP (% change)
Sources: ADB, EIU, and IMF 1/ % of GDP

© 2016 Deloitte Touche Tohmatsu Jaiyos Co., Ltd.| Quarterly Economic Report : Q2 | 2016 15
Cambodia Strong private consumption is still the source of growth. A more stable labour relations in the garment industry, an expansion in construction funded by an increase in inflow FDI, and low oil prices will also provide tailwinds for growth.
0.0
2.0
4.0
6.0
8.0
10.0
12.0
14.0
GDP growth Private consumption
Total investment
Government consumption Exports Imports Inflation
2015 6.9 5.8 12.5 11.8 8.2 7.4 1.2
2016F 6.8 5.6 4.9 11.9 8.0 7.3 2.4
A moderate growth at 6.8% in 2016, compared to 6.9% in 2015 is estimated. Cambodian growth will be led by private consumption, which accounts for roughly 75% of GDP. Both domestic and external demand is expected to improve and will help promote growth from 2017 onwards.
Overall exports will continue to increase owing to more stable labour relations in the garment industry. Meanwhile, an expansion in construction projects funded by an increase in inflow FDI and moderate inflation will support growth towards the end of the forecast period.
Despite the fact that a gradual slowdown in rapid growth has been perceived, the high level of dollarization still limit the effectiveness of monetary policy.
Phnom Penh
Cambodian economy forecasted to grow 6.8% in 2016Real expenditure on GDP (% change)
Sources: ADB, EIU, & IMF

© 2016 Deloitte Touche Tohmatsu Jaiyos Co., Ltd.| Quarterly Economic Report : Q2 | 2016 16
IndonesiaPrivate consumption is still the main contribution to economic growth but relatively sluggish government consumption, slow implement of reforms and inconsistency in public spending are downside risks to the economic expansion.
The estimated growth in 2016 is 5.1% driven mainly by strong private consumption owing to a stabilisation in inflation, looser monetary conditions, and the expansion of jobs and social welfare.
An inconsistency in public spending on reforms, especially in infrastructure projects due to the concern over government revenue, is seen. Compared to 2015, however, investment activities in 2016 is expected to grow as construction of new roads, ports and power stations gather pace.
The government will continue to encourage more private investment from both local and foreign investment. By easing the restrictions, the Jokowi administration is expected that foreign investment will rise toimprove manufacturing capabilities and quality of domestic services including travel and leisure, transportation, and entertainment in Indonesia.
Jakarta
GDP growth Private consumption Total investment Government
consumption Exports Imports Inflation
2015 4.8 4.8 5.1 4.9 (1.9) (5.8) 6.4
2016F 5.1 5.5 5.5 4.2 (0.6) 0.9 3.8
-8.0
-6.0
-4.0
-2.0
0.0
2.0
4.0
6.0
8.0
Indonesian economy forecasted to grow 5.1% in 2016Real expenditure on GDP (% change)
Sources: ADB, EIU, & IMF

© 2016 Deloitte Touche Tohmatsu Jaiyos Co., Ltd.| Quarterly Economic Report : Q2 | 2016 17
Lao PDR GDP growth remains robust driven mainly by hydropower and service industries. Mining and manufacturing sectors, however, suffer from low commodity prices and labour shortage.
The continue work on hydropower construction projects and railway between Vientiane and Kunming in China will help boost GDP growth in 2016 to 7.8%, compared to 7.5% in 2015.
Large investment in construction projects such as hydropower projects, high-speed railway to the Chinese border, and the expansion of the passenger terminal at the international airport will contribute to the strong export and inflows of government revenue.
A small recovery in agriculture is forecasted in 2016. An increase in private consumption also helps accelerate retail and wholesale trade and food processing sectors. The rising in tourists from Thailand and China, meanwhile, will underpin tourism in Lao PDR.
The government is facing the difficulties in controlling budget deficit as reinvestment in the mining sector is limited by low commodity price.
Vientiane
GDP growth Private consumption
Total investment
Government Balance 1/
Current Account
Balance 1/ Inflation
2015 7.5 (5.2) (8.3) 1.3
2016F 7.8 (7.0) (4.0) 0.7
-10.0
-8.0
-6.0
-4.0
-2.0
0.0
2.0
4.0
6.0
8.0
10.0
n/a n/a n/a
n/a
Lao PDR economy forecasted to grow 7.8% in 2016Real expenditure on GDP (% change)
Sources: ADB, EIU, and IMF 1/ % of GDP

© 2016 Deloitte Touche Tohmatsu Jaiyos Co., Ltd.| Quarterly Economic Report : Q2 | 2016 18
Malaysia The economy still loses growth momentum due to subdued global trade and low energy prices. A steady increase in private consumption and growth in service sector will help alleviate the growth contraction.
The sluggish global trade and low energy prices will continue to present negative effects to Malaysian economy. Real GDP growth in 2016 is estimated at 4.3% dropped from 4.7% in 2015.
A modest recovery in global trade growth will slightly stimulate trading activities in Malaysia. Nonetheless, an economic slowdown in China, Malaysia’s second-largest export market, will cause a weak demand for goods, especially electronic and electrical goods from Malaysia.
Service sector, which accounts for the largest share of Malaysian GDP, is expected to expand in 2016-20. Information and communications, real estate and business service are considered as the most dynamic sectors.
Kuala Lumpur
GDP growth Private consumption
Total investment
Government consumption Exports Imports Inflation
2015 5.0 6.0 3.7 4.3 0.7 1.3 2.1
2016F 4.3 4.9 4.0 4.2 1.9 2.6 2.2
0.0
1.0
2.0
3.0
4.0
5.0
6.0
7.0
Malaysian economy forecasted to grow 4.3% in 2016Real expenditure on GDP (% change)
Sources: ADB, EIU, & IMF

© 2016 Deloitte Touche Tohmatsu Jaiyos Co., Ltd.| Quarterly Economic Report : Q2 | 2016 19
Myanmar Regulatory and legal reforms, coupled with the ongoing liberalisation of financial sector will help spur the overall economy. Private and public consumption will also strengthen aggregate domestic demand.
The 2016 headline growth is expected to pick up to 7.8% driven by investment spending. Large projects in many industries, particularly hydro-carbons and infrastructure funded by foreign investors will underpin growth in the forecast period. Oil and gas sector, meanwhile, will continue to grow despite low global energy prices.
Regulatory and legal reforms will help attract more foreign investment to a number of industries and these activities will pick up in 2017-18 as a recovery of global commodity prices is expected.
An improved access to capital and foreign markets will promote growth in many sectors, especially labour- intensive export manufacturing and tourism. Meanwhile, the relatively low wage rate compared with other Asian countries will help support the growth in garment industry.
Naypyidaw
GDP growth Private consumption
Total investment
Government consumption Exports Imports Inflation
2015 6.8 2.2 14.0 7.2 18.0 22.0 9.2
2016F 7.8 2.8 14.5 7.4 15.0 21.0 7.0
0.0
5.0
10.0
15.0
20.0
25.0
Myanmar economy forecasted to grow 7.8% in 2016Real expenditure on GDP (% change)
Sources: ADB, EIU, & IMF

© 2016 Deloitte Touche Tohmatsu Jaiyos Co., Ltd.| Quarterly Economic Report : Q2 | 2016 20
Philippines A modest slowdown in real GDP growth is anticipated owing to the change in administration. Private consumption supported by strong remittances remains strong but growth in government expenditure and investment seems uncertain.
It is likely that many investors will put their money on hold due to uncertainties and risks associated from new administration’s economic agenda. On this basis, the minimal slowdown of real GDP is expected in 2016.
Strong private consumption driven largely by remittance inflows still helps bolster economic growth during this period. A slowdown in the government spending and investment, however, is assumed owing to some uncertainties such as political instability and stasis policy stemming from the new administration.
Subdued inflation, steady growth in employment and strong remittance continue to boost the household spending. Meanwhile, poor infrastructure remains evident as public investment is inadequate.
Manila
GDP growth Private consumption
Total investment
Government consumption Exports Imports Inflation
2015 5.9 6.3 15.2 7.8 9.0 14.0 1.4
2016F 5.7 6.7 5.8 5.9 5.2 6.4 1.8
0.0
2.0
4.0
6.0
8.0
10.0
12.0
14.0
16.0
Philippine economy forecasted to grow 5.7% in 2016Real expenditure on GDP (% change)
Sources: ADB, EIU, & IMF

© 2016 Deloitte Touche Tohmatsu Jaiyos Co., Ltd.| Quarterly Economic Report : Q2 | 2016 21
Singapore Ongoing sluggishness of global growth still presents threats to Singapore, a trade- dependent city-state. Private consumption and government spending, however, will provide some support for the economy.
Strong public investment will not be able to fully offset the negative effect from lackluster growth in trade and subdued housing construction due to tepid global growth and weak energy prices. An estimated real GDP growth in 2016, then, is 1.4% revised down from 2.0% in 2015.
Falling output of manufacturing sector continues as it is dominated by export-oriented industries. Biomedical output is still the key factor to determine the manufacturing growth. The continued weak performance, however, is forecasted owing to the ongoing sluggishness of global growth.
An improved access to capital and foreign markets will promote growth in many sectors, especially labour-intensive export manufacturing and tourism. Meanwhile, the relatively low wage rate compared with other Asian countries will help support the growth in garment industry.
Singapore
GDP growth Private consumption
Total investment
Government consumption Exports Imports Inflation
2015 2.0 4.5 (1.0) 6.6 2.5 2.1 (0.5)
2016F 1.4 2.1 (0.4) 5.4 1.6 1.4 (0.5)
-2.0
-1.0
0.0
1.0
2.0
3.0
4.0
5.0
6.0
7.0
Singapore economy forecasted to grow 1.4% in 2016Real expenditure on GDP (% change)
Sources: ADB, EIU, & IMF

© 2016 Deloitte Touche Tohmatsu Jaiyos Co., Ltd.| Quarterly Economic Report : Q2 | 2016 22
Viet Nam Foreign investment continues to gather momentum. Growth in manufacturing sector remains strong amid the sluggishness in the rest of the region.
Real GDP growth in 2016 is projected to modestly slow to 6.3% from 6.7% in 2015. Stable inflation, foreign investment, especially in electronic sector will result in the robust growth in private consumption.
Monetary policy still plays an important role in supporting Vietnamese econo-my. Meanwhile, foreign investments in manufacturing industry, especially in electronic sector, coupled with the migration of low-cost export manufacturing from China to Viet Nam will help promote the exports of good and services in 2016 – 2020.
The net export, however, is expected to undermine the GDP growth during the forecast period as the import volumes will outweigh the expansion in exports.
Hanoi
GDP growth Private consumption
Total investment
Government consumption Exports Imports Inflation
2015 6.7 7.5 9.6 6.9 9.5 11.4 0.9
2016F 6.3 7.0 9.8 6.8 8.3 9.9 2.4
0.0
2.0
4.0
6.0
8.0
10.0
12.0
Vietnamese economy forecasted to grow 6.3% in 2016Real expenditure on GDP (% change)
Sources: ADB, EIU, & IMF

AEC Blueprint 2025Vision, Strategies, and Challenges
© 2016 Deloitte Touche Tohmatsu Jaiyos Co., Ltd.| Quarterly Economic Report : Q2 | 2016 23

© 2016 Deloitte Touche Tohmatsu Jaiyos Co., Ltd.| Quarterly Economic Report : Q2 | 2016 24
Milestones - 50 Years from ASEAN to AEC
1992
1993
1997
2003
2010
2015
2018
2008
2025
2007
Birth ofASEAN* 1967
ASEAN FreeTrade Area(AFTA), a tradebloc agreement,enters into force
The FrameworkAgreement on EnhancingASEAN EconomicCooperation
ASEANVision2020
Bali Concord II(Declaration ofASEAN Concord II)
AECBlueprint2015 (Nov 2007)
CebuDeclaration(Jan 2007)
ASEANCharter
ASEAN Trade inGoods Agreement(ATIGA) entersinto force
FormalEstablishmentof the AEC(Dec 2015)
AEC Blueprint2025 published
Deadline forNon-Tariff Barriers(NTB) within ASEANto be eliminated
AEC to bea communityby deepening itseconomicintegration
Sources: ASEAN Secretariat, The ABC of the AECNote: * ASEAN was first established by only five ASEAN countries, which are Indonesia, Malaysia, Philippines, Singapore, and Thailand. The other five ASEAN countries including Brunei Darussalam (1984), Viet Nam (1995), Lao PDR (1997), Myanmar (1997), and Cam bodia (1999) joined later

© 2016 Deloitte Touche Tohmatsu Jaiyos Co., Ltd.| Quarterly Economic Report : Q2 | 2016 25
The concept of ASEAN economic integration was first introduced in the Framework Agreement on Enhancing ASEAN Economic Cooperation signed in Singapore in 1992. It aims to enhance ASEAN economic cooperation in the areas of trade; industry, minerals and energy; finance and banking; food, agriculture, and forestry; as well as transport and communications.
The formation of an ‘ASEAN Economic Community’ aiming to achieve the regional economic integration, was declared in the Bali Concord II at the 9th ASEAN Summit in 2003. The agreed goal was consistent with the ASEAN Vision 2020 which was adopted in 1997.
In 2007, the timeline of AEC establishment was accelerated from 2020 to 2015 as stated in the Cebu Declaration on the Acceleration of the Establishment of ASEAN Community by 2015. Meanwhile, the AEC Blueprint 2015 was initiated in November to provide the single and coherent plan progressing step by step to the AEC. Eventually, the AEC was formally established at the end of 2015 and the achievement of the AEC Blueprint 2015 in the four key pillars of AEC had been met as planned.
“The AEC Blueprint has served as a comprehensive master
plan to chart the region’s journey towards the formal
establishment of the AEC”
Sources: ASEAN Secretariat, The ABC of the AEC

© 2016 Deloitte Touche Tohmatsu Jaiyos Co., Ltd.| Quarterly Economic Report : Q2 | 2016 26
Key Achievements of AEC Blueprint 2015
Free flow of goods: The ASEAN Trade inGoods Agreement (ATIGA). ASEAN’s averagetariff elimination is 95.99% (ASEAN-6 at99.2% & CLMV at 90.86%).
Pillar % Achievement Key achievements
Single Market & Production Base
Achievement: 92.4% • Completed: 256 • Not completed: 21
•
•
•
•
•
Free flow of services: The ASEAN FrameworkAgreement on Services (AFAS) and theMutual Recognition Arrangements. Free flow of investment: The ASEANComprehensive Investment Agreement ACIA) and the Protocol to Amend the ACIA. Freer flow of capital: Implementation ofmeasures to further spur financial servicesliberalisation, capital market development,and capital account liberalisation.
Free flow of skilled labour: The ASEANAgreement on the Movement of NaturalPersons and the ASEAN QualificationReference Framework (AQRF).
ASEAN member states achieved 92.7% or 469 out of 506 scorecard measures by 2015.
Source: ASEAN Economic Community 2015:Progress and Key Achievements

© 2016 Deloitte Touche Tohmatsu Jaiyos Co., Ltd.| Quarterly Economic Report : Q2 | 2016 27
Pillars % Achievement Key achievements
Competitive Economic Region
Achievement: 90.5% •Completed: 154 • Not completed: 16
Equitable Economic Development
Achievement: 100%
Integration into Global Economy Achievement: 100%
The achievement of AEC Blueprint 2015 can be viewed as the establishment of an economic communityframework, which still have numerous challenging issues, and in turn, requires committed efforts and resourcesfrom ASEAN member states in pursuit of the AEC vision 2025.
•
•
•
•
•
Measures to develop capacities andframeworks on competition policy and law, consumerprotection and intellectual property right (IPR).
Measures to enhance the region’s competitivenessand connectivity.
ASEAN Leaders endorsed the ASEAN Framework onEquitable Economic Development (EED).
On-going negotiations for the Regional ComprehensiveEconomic Partnership(RCEP) or ASEAN + 6 includingChina, India, Japan, South Korea, Australia & New Zealand.
Preparations for the ASEAN-Hong Kong Free Trade Area(AHKFTA) negotiations.
ASEAN member states achieved 92.7% or 469 out of 506 scorecard measures by 2015.
Source: ASEAN Economic Community 2015:Progress and Key Achievements
© 2016 Deloitte Touche Tohmatsu Jaiyos Co., Ltd.| Quarterly Economic Report : Q2 | 2016 28
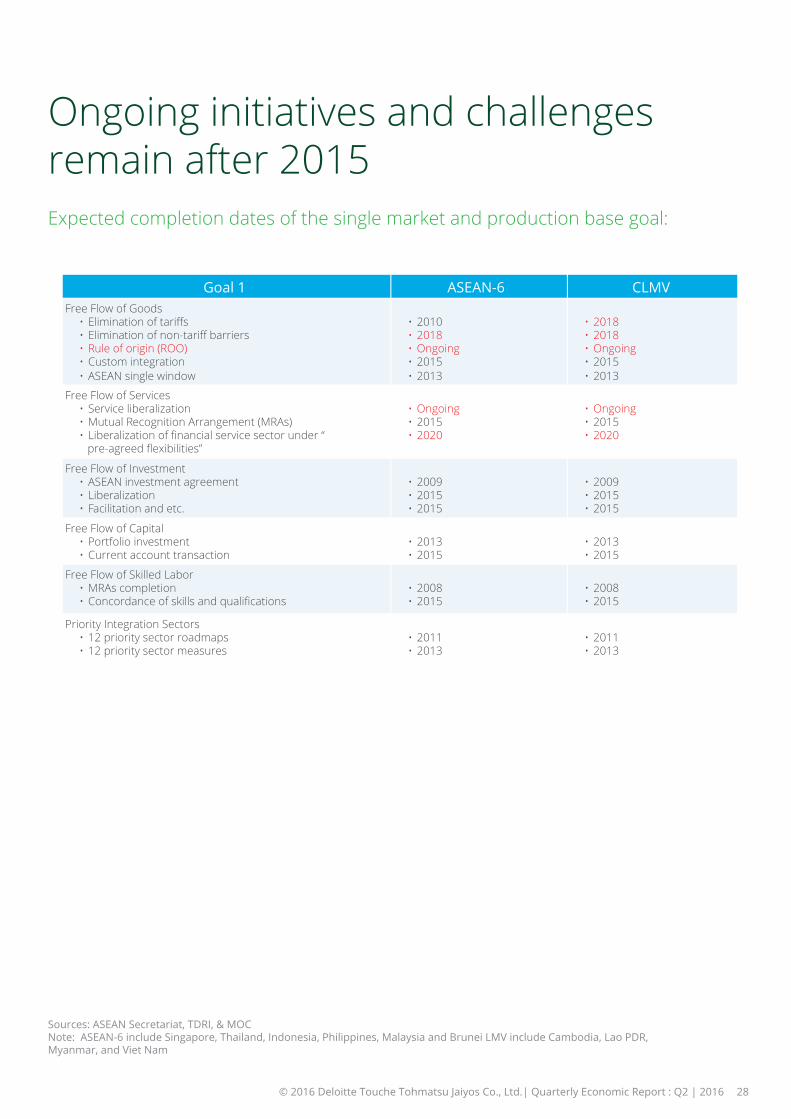
Goal 1 ASEAN-6 CLMV Free Flow of Goods
• Elimination of tariffs • Elimination of non-tariff barriers • Rule of origin (ROO) • Custom integration • ASEAN single window
2010 2018 Ongoing 2015 2013
• 2018 • 2018 • Ongoing • 2015 • 2013
Free Flow of Services • Service liberalization • Mutual Recognition Arrangement (MRAs) • Liberalization of financial service sector under “
pre-agreed flexibilities”
Ongoing 2015 2020
• Ongoing • 2015 • 2020
Free Flow of Investment • ASEAN investment agreement • Liberalization • Facilitation and etc.
2009 2015 2015
• 2009 • 2015 • 2015
Free Flow of Capital • Portfolio investment • Current account transaction
2013 2015
• 2013 • 2015
Free Flow of Skilled Labor • MRAs completion • Concordance of skills and qualifications
2008 2015
• 2008 • 2015
Priority Integration Sectors • 12 priority sector roadmaps • 12 priority sector measures
2011
•••••
•••
•••
••
••
•• 2013
• 2011 • 2013
Ongoing initiatives and challenges remain after 2015Expected completion dates of the single market and production base goal:
Sources: ASEAN Secretariat, TDRI, & MOCNote: ASEAN-6 include Singapore, Thailand, Indonesia, Philippines, Malaysia and Brunei LMV include Cambodia, Lao PDR, Myanmar, and Viet Nam

© 2016 Deloitte Touche Tohmatsu Jaiyos Co., Ltd.| Quarterly Economic Report : Q2 | 2016 29
Ongoing initiatives and challenges remain after 2015 Expected completion dates of the other goals:
Goals 2 - 4 ASEAN-6 CLMV Competitive Economic Region
• Competition policy • Consumer protection • Intellectual property rights • Infrastructure development • Taxation • E-Commerce
• 2011 • Ongoing • 2015 • Ongoing • 2010 • 2015
• 2011 • Ongoing • 2015 • Ongoing • 2010 • 2015
Equitable Economic Development • SME development • Initiatives for ASEAN integration
• 2015 • 2015
• 2015 • 2015
Integrate into the Global Economy • Guidebooks on best practices • Ensure AEC alignments with ASEAN’s FTAs and CEPs
• 2010 • 2015
• 2010 • 2015
Sources: ASEAN Secretariat, TDRI, & MOCNote: ASEAN-6 include Singapore, Thailand, Indonesia, Philippines, Malaysia and Brunei CLMV include Cambodia, Lao PDR, Myanmar, and Viet Nam

© 2016 Deloitte Touche Tohmatsu Jaiyos Co., Ltd.| Quarterly Economic Report : Q2 | 2016 30
AEC Vision 2025
A Highly Integrated &
Cohesive Economy
A Competitive, Innovative
and Dynamic ASEAN
Enhanced Connectivity &
Sectoral Cooperation
A Resilient, Inclusive,
People-Oriented &
People-centered
ASEAN
A Global ASEAN
AEC Vision 2025
• Facilitate the seamless movement of goods, services, investment, capital, and skilled labour.
• Establish a more
unified market for its firms and consumers.
• Engender a level playing for all firms.
• Foster the creation and protection of knowledge.
• Deepen ASEAN participation in global value chains.
• Enhance economic connectivity in various sectors.
• Integrate and cooperate in key sectors that create an integrated and sustainable economic region.
• Achieve sustainable and balanced growth and development.
• Encourage SMEs to participate in regional and global value chains.
• Build the capacity of the ASEAN’s newer member states.
• Make progress towards integrating the AEC into the global economy via FTAs an comprehensive economic partnership agreements (CEPs).
• Strengthen regulatory frameworks and practices and coherence at the regional level.
Sources: ASEAN Economic Community 2015:Progress and Key Achievements & AEC Blueprint 2025

© 2016 Deloitte Touche Tohmatsu Jaiyos Co., Ltd.| Quarterly Economic Report : Q2 | 2016 31
AEC Blueprint 2025 at a Glance
A Highly Integrated & Cohesive Economy
1. Trade in goods
2. Trade in services
3. Investment Environment
4. Financial Integration, Inclusion, & Stability
5. Facilitating Movement of Skilled Labour and Business Visitors
6. Enhance Participation in Global Value Chains
AEC Blueprint 2025 contains 5 pillars built on the previous AEC Blueprint 2015.
Post-2015 ASEAN: “politically cohesive, economically integrated and socially responsible”
A Competitive, Innovative, & Dynamic ASEAN
Enhanced Connectivity & Sectoral Cooperation
A Resilient, Inclusive, People-Oriented, &
People-Centered ASEAN A Global ASEAN
1. Effective Competition Policy
2. Consumer Protection
3. Strengthening Intellectual Property Rights Cooperation
4. Productivity-Driven Growth, Innovation, Research & Development, & Technology Commercialisation
5. Taxation Cooperation
6. Good Governance
7. Effective, Efficient, Coherent & Responsible Regulations, and Good Regulatory Practice
8. Sustainable Economic Development
9. Global Megatrends and Emerging Trade-Related Issues
1. Transport
2. ICT
3. E-Commerce
4. Energy
5. Food, Agriculture & Forestry
6. Tourism
7. Healthcare
8. Minerals
9. Science & Technology
1. Strengthening the Role of Micro & SMEs
2. Strengthening the Role of the Private Sector
3. Public-Private Partnership
4. Narrowing the Development Gap
5. Contribution of Stakeholders on Regional Integration Efforts
1. Integrating the region into the global economy through FTAs and comprehensive economic partnership (CEPs). For example, RCEP or ASEAN + 6 and ASEAN-HK FTA or AHKFTA
2. Enhance economic partnerships with non-FTA dialogue partners
3. Promote strategic engagement with global and regional institutions
Sources: ASEAN Economic Community 2015:Progress and Key Achievements & AEC Blueprint 2025

© 2016 Deloitte Touche Tohmatsu Jaiyos Co., Ltd.| Quarterly Economic Report : Q2 | 2016 32
AEC Blueprint 2025 – Pillar 1’s Highlights Pillar 1 - A Highly Integrated & Cohesive Economy
Trade in Goods
Key initiatives to be executed:
• The ASEAN Trade in Goods Agreement (ATIGA)
• The implementation of the Rules of Origin (ROO)
• The National Single Windows
• Public-private partnership (PPP)
• Minimising trade protection and compliance costs in dealing with Non-Tariff Measures (NTMs)
Trade in Services
Key initiatives to be executed:
• More foreign direct investment (FDI) in the services sectors to support GVC activities
• Alternative approaches for further liberalisationof services
Financial Integration, Inclusion and Stability
Key initiatives to be executed:
• The ASEAN Banking Integration Framework (ABIF)
• The ASEAN Insurance Integration Framework (AIIF)
• The ASEAN Capital Market Infrastructure (ACMI) Blueprint
• Financial products and services to a wider community that is under-served, including MSMEs
Facilitating Movement of Skilled Labourand Business Visitors
Key initiatives to be executed:
• Enforce MRAs across the AEC member states
• Temporary cross-border movement of natural persons (MNPs) and business visitors
• Reduce, if not standardise, documentationrequirements
Sources: ASEAN Economic Community 2015:Progress and Key Achievements & AEC Blueprint 2025

© 2016 Deloitte Touche Tohmatsu Jaiyos Co., Ltd.| Quarterly Economic Report : Q2 | 2016 33
AEC Blueprint 2025 – Pillar 2’s Highlights Pillar 2 - A Competitive, Innovative, & Dynamic ASEAN
Effective Competition Policy
Key initiatives to be executed:
• Enforce competition laws for all remaining ASEAN Member States that do not have them
• Regional Cooperation Arrangements on competition policy and law
Strengthening Intellectual Property (IP) Rights Cooperation
Key initiatives to be executed:
• The development of a more robust ASEAN IP system
• Regional IP platforms and infrastructure
• Regional mechanisms to promote asset creation and commercialisation
Taxation Cooperation
Key initiatives to be executed:
• The completion and improvement of network of bilateral tax agreements:
The issues of double taxation
The enhancement of withholding tax structure
The broadening of investor base in ASEAN debt issuance
• Global taxpayers’ identification number to improve tax collection and enhance monitoring of transactions
Sustainable Economic Development
Key initiatives to be executed:
• Foster policies supportive of renewable energy
• Efficient and low carbon technologies
• The use of biofuels for transportation
• Enhance connectivity within ASEAN
Multilateral electricity trade
Greater liquefied natural gas (LNG) cooperation
Sources: ASEAN Economic Community 2015:Progress and Key Achievements & AEC Blueprint 2025

© 2016 Deloitte Touche Tohmatsu Jaiyos Co., Ltd.| Quarterly Economic Report : Q2 | 2016 34
AEC Blueprint 2025 – Pillar 3’s Highlights Pillar 3- Enhanced Connectivity & Sectoral Cooperation
Transport
Key initiatives to be executed:
• Land transport : an integrated land transport network
• Air transport : the ASEAN Single Aviation Market (ASAM)
• Maritime transport : an ASEAN Single Shipping Market (ASSM)
• Transport facilitation : an integrated, efficient and globally competitive logistics and multimodal transportation system
Information & Communication Technology
Key initiatives to be executed:
• ASEAN’s Economic & Social Transformation:
- ICT for economic development and promote digital trade
- People integration and empowerment through ICT
- ICT innovations and entrepreneurship as well as new technological developments such as Smart City, Big Data and Analytics
- The free flow of ICT products, services and investment and lower international mobile roaming charges in ASEAN etc.
E-Commerce
Key initiatives to be executed:
• Harmonised consumer rights and protection laws
• Harmonised legal framework for online dispute resolution
• E-identification and authorization (electronic signature) schemes
• Personal data protection
Energy
Key initiatives to be executed:
• The ASEAN Plan of Action for Energy Cooperation (APAEC) 2016-2025 – Phase I (2016-2020) & Phase II (2021-2025):
- ASEAN Power Grid (APG) with multilateral electricity trade in at least one sub region by 2018
- Trans-ASEAN Gas Pipeline (TAGP)
- Others include renewable energy, energy efficiency & conservation, civilian nuclear energy, and so on.
Sources: ASEAN Economic Community 2015:Progress and Key Achievements & AEC Blueprint 2025

© 2016 Deloitte Touche Tohmatsu Jaiyos Co., Ltd.| Quarterly Economic Report : Q2 | 2016 35
AEC Blueprint 2025 – Pillar 3’s Highlights Pillar 3- Enhanced Connectivity & Sectoral Cooperation
Food, Agriculture, & Forestry
Key initiatives to be executed:
• Enhance production and promotion of halal food and products
• ASEAN as an organic food production base
• Agricultural productivity enhancement
• Increase investment in agricultural science and technology
Tourism
Key initiatives to be executed:
• The AEC 2025 vision for tourism is “ASEAN to be a quality tourism destination”
• Enhance competitiveness of ASEAN as a single tourism destination
• Achieve a more sustainable and inclusive pattern of ASEAN tourism
Healthcare
Key initiatives to be executed:
• Open up private healthcare market and Public-Private Partnership (PPP) investments
• Harmonisation of standards and conformance in healthcare products and services
• Promote high-growth potential sectors such as health tourism and e-healthcare services
Science & Technology
Key initiatives to be executed:
• Implement The ASEAN Plan of Action on Science, Technology and Innovation (APASTI) 2016-2025
• Enhance mobility of scientists and researchers from both public S&T institutions and private sector
• Promote regional STI enterprise arising from spinoffsand joint ventures
Sources: ASEAN Economic Community 2015:Progress and Key Achievements & AEC Blueprint 2025

© 2016 Deloitte Touche Tohmatsu Jaiyos Co., Ltd.| Quarterly Economic Report : Q2 | 2016 36
AEC Blueprint 2025 – Pillar 4’s Highlights Pillar 4 – A Resilient, Inclusive, People-Oriented, & People-Centered ASEAN
Strengthening the Role of Micro & SMEs
Key initiatives to be executed: •Enhance MSME competitiveness, resilience and to enable greater benefits from ASEAN integration.
• Increase access to finance.
•Promote productivity, technology and innovation.
Strengthening the Role of the Private Sector
Key initiatives to be executed: • Implement a more inclusive and consultative process involving the private sector through the ASEAN Business Advisory Council (ASEAN-BAC).
•Enhance coordination between ASEAN-BAC and the ASEAN Secretariat.
Public-Private Partnership (PPP)
Key initiatives to be executed: •National legal and institutional frameworks that support PPP at both the national and regional levels.
•Establish an ASEAN network of PPP agencies and stakeholders (legal firms, companies, financial institutions) in ASEAN member states.
•Encourage the ASEAN Infrastructure Fund (AIF).
Narrowing the Development Gap
Key initiatives to be executed: •Sustain the pace of economic growth among ASEAN member states, especially CLMV.
•Enhance productivity and competitiveness of rural economies, especially CLMV.
Sources: ASEAN Economic Community 2015:Progress and Key Achievements & AEC Blueprint 2025

© 2016 Deloitte Touche Tohmatsu Jaiyos Co., Ltd.| Quarterly Economic Report : Q2 | 2016 37
AEC Blueprint 2025 – Pillar 5’s Highlights Pillar 5 – A Global ASEAN
A Global ASEAN
Key initiatives to be executed: • Review and Improve ASEAN Free Trade Agreements (FTAs) and Comprehensive Economic
Partnerships (CEPs).
• Enhance economic partnerships with non-FTA Dialogue Partner.
• Support the multilateral trading system and actively participating in regional fora.
• Engage with regional and global partners to explore strategic engagement to pursue economic partnerships with emerging economies and/or regional groupings that share the same values and principles on improving the lives of their people through economic integration.
Sources: ASEAN Economic Community 2015:Progress and Key Achievements & AEC Blueprint 2025

© 2016 Deloitte Touche Tohmatsu Jaiyos Co., Ltd.| Quarterly Economic Report : Q2 | 2016 38
The road towards the AEC full integration remain challenging Several barriers to the full economic integration have been evident and in turn ASEAN member states need dedicated resources to overcome them.
The AEC Challenges
Non-tariff barriers (NTBs)
Hostile/unfavourable domestic regulations
ASEAN connectivity and so on ….
Economic development gaps
Sources: ADB, ASEAN Economic Community 2015:Progress and Key Achievements, AEC Blueprint 2025, Department of Trade Negotiation (DTN), Office of the Council of State, World Bank, & DTTJ Analysis

Thailand Economic Review
© 2016 Deloitte Touche Tohmatsu Jaiyos Co., Ltd.| Quarterly Economic Report : Q2 | 2016 39

© 2016 Deloitte Touche Tohmatsu Jaiyos Co., Ltd.| Quarterly Economic Report : Q2 | 2016 40
ThailandHighly competitive tourism industry and government spending still accelerate Thai economic growth but weak merchandise exports and lackluster consumer demand will create headwinds to economic performance in 2016.
Overall weak private consumption and goods export will continue to undermine economic prospects in 2016. Nonetheless, a continuing high performance in tourism industry and public investment are expected to offset the downside risks. The estimated real GDP growth in 2016 is 3.0% which is slightly higher than 2.8% in 2015.
Downturn in external demand, high levels of household debt in lower- income people and rising unemployment in agri-cultural and industrial sectors due to persistent drought effect from the El Niño weather pattern will result in low private consumption and also temper the whole economy as private consumption accounts for almost 50% of Thailand’s GDP.
GDP growth Private consumption
Total investment
Government consumption Exports Imports Inflation
2015 2.8 2.1 4.7 2.2 (5.6) (11.3) (0.9)
2016F 3.0 2.3 4.2 3.9 (1.7) (4.6) 0.2
-14.0
-12.0
-10.0
-8.0
-6.0
-4.0
-2.0
0.0
2.0
4.0
6.0
Thai economy forecasted to grow 3.0% in 2016Real expenditure on GDP (% change)
Sources: ADB, NESDB, EIU, & IMF

© 2016 Deloitte Touche Tohmatsu Jaiyos Co., Ltd.| Quarterly Economic Report : Q2 | 2016 41
Poor performance of merchandise exports in agricultural and industrial exports is expected due to the contraction of external demand. A particular concern is the slowing growth of exports to ASEAN, which accounts for one-fourth of the total export value. The more integrated ASEAN market, however, is expected to offer some benefits to main industries in Thailand through lower tariff barriers in 2016-2018.
Another Thailand’s GDP growth driver in 2016 is public investment in large-scale infrastructure projects including the transport infrastructure as planned in Transport Infrastructure Master Plan from 2015 -2022.
Political uncertainty owing to the delay in transition back to democracy might undermine both consumer and investor confidence and dampen the potential for the growth rate this year.
49.7%
17.2%
16.3%
6.7%
10.2%
2016 GDP Component
Breakdown/p
Sources: NESDB, K-Research, SCB EIC, & DTTJ Estimates/p preliminary data
Private Consumption
Private Investment
Government Consumption
Government Investment
Net Export
Sources: NESDB, K-Research, SCB EIC, & DTTJ Estimates /p preliminary data

© 2016 Deloitte Touche Tohmatsu Jaiyos Co., Ltd.| Quarterly Economic Report : Q2 | 2016
Brexit: A Serious Risk to Thailand’s Growth?

© 2016 Deloitte Touche Tohmatsu Jaiyos Co., Ltd.| Quarterly Economic Report : Q2 | 2016 43
Brexit: A Serious Risk to Thailand’s Growth?
Gains & Losses to the UK
“A Vote for Brexit raises
the big question “What will happen next?”
“
Allow the UK to establish and negotiate its own trade deals, treaties without the interference from the EU and to regain control of its border.
It could hold back the flow of foreign investment in the UK as well as the export volume to countries in the EU as the tax-free goods will no longer be exported.
A drop of immigration might help create jobs for British workers in the UK.
Without the free movement of people across the EU, the job opportunities for British workers in the EU will be limited
The unstable and less effective financial service sector in the UK stemming from the Brexit outcome will bring about the difficulty of borrowing money owing to lower credit rating.
On 23rd June 2016, the whole world kept an eye on Britain’s referendum on whether to exit (Brexit) or to remain (Bremain) in the European Union (the EU).
With more than 30 million people voting and the referendum turnout of 71.8%, it was the highest turnout in UK since the general election in 1992. A vote for exit won by 52% to 48% raising the big question “What will happen next to the UK, the EU, and the global economy?
Sources: Foreign and Thai local newspapers

© 2016 Deloitte Touche Tohmatsu Jaiyos Co., Ltd.| Quarterly Economic Report : Q2 | 2016 44
“The UK departure
from the EU will have only slight
effect on the Thai economy
”
“It is also believed that the British vote to
leave the EU could result in the ripple
effects and will pose a serious challenge on
global economic growth.”
For ASEAN countries, a departure of one of the EU’s biggest economies, coupled with the possible un-certainties of EU market might dry up the business activities in some ASEAN markets especially Indonesia where the UK is its strategic trading partner. However, a little impact on ASEAN region is anticipated.
Sources: Thai local newspapers

© 2016 Deloitte Touche Tohmatsu Jaiyos Co., Ltd.| Quarterly Economic Report : Q2 | 2016 45
Merchandise Trade Investment Tourism
Trade performance between the two countries will partially decelerate as a result of the depreciation of Pound Sterling.
Less inflow of investment from the UK to Thailand is likely owing to depreciation of Pound Sterling.
For Tourism sector, one of the key driving forces of growth in Thailand, a decline in tourists from the UK and EU countries is forecasted owing to the plunge in the value of the Pound and Euro. Considering the fact that the
average share of Thailand’s trade with the UK in total trade was only 1.43% per year, the little impact of Brexit on trade is expected.
The overall growth in private investment will continue to grow as only 3.50% per year for inward FDI from the UK, Nevertheless, a short-term im-
pact is expected as a number of tourists will rebound once cur-rency volatility eases.
The slightly negative impacts on the Thai economy are predicted over the next two-year period until the UK’s economy settles down.
Thailand will face the short-term financial volatility, especially in bond markets and foreign ex-change. With only 1.31 percent of total assets for FDI exposure in the UK and Europe-wide financial sector, however, the impact on Thai economy is expected to be insignificant.
“ Brexit vote may trigger
other countries in Europe to seek for similar referendums and consequently could create more serious problems
to the global economy.”
Source : Bank of Thailand, data from 2011 – 2015

Thailand Reform Review
© 2016 Deloitte Touche Tohmatsu Jaiyos Co., Ltd.| Quarterly Economic Report : Q2 | 2016 46

© 2016 Deloitte Touche Tohmatsu Jaiyos Co., Ltd.| Quarterly Economic Report : Q2 | 2016 47
Thailand’s Current Politics and Administration system
NCPO
Government NLA NRSA
The National Council for Peace and Order (NCPO)
To maintain peace and
security in the country and to ensure a smooth
reform process.
The interim Government
To perform public administration duties
in both economic and social aspect.
The National Legislative Assembly
To performs functions of National Parliament,
including passing legislations, approving emergency decrees,
and approving treaties.
The National Reform Steering Assembly
To implement and to initiate ideas for national reforms following the dissolution of the National Reform
Council (NRC)
Note: The National Reform Council (NRC) was for undertaking a comprehensive reform of the country and drawing up recommendations for the Constitution Drafting Committee (CDC) The Constitution Drafting Committee (CDC), which consists of legal experts, academics, former senators, judges, civil servants, representatives from NGOs and the media, is nominated to ensure a truly democratic constitutional monarchy.

© 2016 Deloitte Touche Tohmatsu Jaiyos Co., Ltd.| Quarterly Economic Report : Q2 | 2016 48
NCPO’s roadmap to reform Thailand in Stage 2
The National Council for Peace and Order (NCPO) proposed three stages of national administration during the transition period.
Coup on 22 May 2014
Stage OneBring back normal operations of civil service
Executed national security and law enforcement.
Developed economic master plans.
Launched the 19th interim constitution of Thailand.
Cleared illegal weapons.
Set up Reconciliation & Reform Center.
Drafted the 2015 Annual Budget Bill of THB 2.6 trillion
Appointed and transferred critical officers.
Enforced narcotic suppression.
Reviewed 56 SOEs’ governance structure.
May 2014
Jun 2014
Jul 2014
Sources: compiled from NCPO, the Royal Thai Government, & Thai Local Newspapers

© 2016 Deloitte Touche Tohmatsu Jaiyos Co., Ltd.| Quarterly Economic Report : Q2 | 2016 49
Stage TwoCreate an environment contributes to national reforms with NLA & NRC in actions.
Established the National Legislative Assembly (NLA) to perform the parliament roles
NLA successfully impeached the former Prime Minister Yingluck Shinawatra over the rice-pledging scheme.
Approved the 2015 Annual Budget Bill
NRC proposed reform frameworks and appoints Constitution Drafting Committee (CDC) to drafts the 20th Constitution of Thailand.
NRC rejected the draft of the 20th Constitution of Thailand by 135 votes against 105 in favour with 7 abstentions, and in turn, was dissolvedon September 6, 2015
NPCO proposed the 20-month period of the new political roadmap known as the 6-4-6-4 formula, which leads to a new civil government in July 2017.
Appointed the Interim Prime Minister and form an Interim Government
Operated government new fiscal year
Appointed and transferred key civil & military officers
Established the National Reform Council (NRC) to study and provide recommendations for Thailand reforms
Aug 2014 – Oct 2014
Oct 2014 - Sep 2015.
Sources: compiled from NCPO, the Royal Thai Government, ThaiPBS, & Thai Local Newspapers (The Nation, Bangkok Post)

© 2016 Deloitte Touche Tohmatsu Jaiyos Co., Ltd.| Quarterly Economic Report : Q2 | 2016 50
Stage Two - ContinuedCreate an environment contributes to national reforms with NLA and NRSA in actions.
Stage ThreeAn election will be held to restore full democracy.
Appointed a new 21-person Constitutional Drafting Committee to propose the new draft of 20th Constitution of Thailand within 180 days.
Execute general elections – the Senate and the House of Representatives
Established the National Reform Steering Assembly (NRSA) consisting of 200 members to implement the national reform blueprint proposed by the dissolved NRC.
Parliament in action
Form a new government
Continue Thailand’s reform initiatives
Conduct a nationwide referendum of the drafted 20th Constitution of Thailand on August 7, 2016.
Launch the 20th Constitution of Thailand, if the majority of voters accept the drafted charter.
Draft and deliberate the organic laws of the 20th Constitution of Thailand.
Oct 2015 – Feb 2017 (Approximately)
Mar 2017 onwards (Approximately)
Sources: compiled from NCPO, the Royal Thai Government, ThaiPBS, & Thai Local Newspapers (The Nation, Bangkok Post)

© 2016 Deloitte Touche Tohmatsu Jaiyos Co., Ltd.| Quarterly Economic Report : Q2 | 2016 51
The Interim Government to performpublic administration The Interim Government established under Thailand’s Interim Constitution 2014 consists of the Prime Minister (General Prayuth Chan-ocha) and 34 other ministers appointed by the King to perform public administration.
Approved draft laws on national strategies and the reform of public organizations. In addition, the committee for drafting national reform strategies has affirmed the Kingdom is in need of a national level 20-year plan to ensure consistency in its administration.
Approval of a plan to develop the nation’s digital economy and digital government with 3-year time frame. The plan covers four dimensions, namely the economy, society, human resources, and the government, with the aim to elevate Thailand as one of the leading countries in line with the 20-year National Strategy.
Ministry of Industry declared the termination of all gold exploration and mining activities across the country following public complaints over environmental and health impacts. For Chatree Mine of Akara Resources Pcl in Phichit province, the Cabinet gave permission for the facility to continue operation until the end of this year.
Accelerating Thai economic growth
Agricultural reform
Anti-human trafficking
Energy and environment sustainability
Social affairs
Thailand and the world
HighlightsGovernment Priorities
Sources: The Royal Thai Government, Thailand Interim Constitution 2014, National New Bureau of Thailand & Thai local newspapers (The Nation, Bangkok Post)

© 2016 Deloitte Touche Tohmatsu Jaiyos Co., Ltd.| Quarterly Economic Report : Q2 | 2016 52
The National Legislative Assembly (NLA) to take the Parliament dutiesNLA established under Thailand’s Interim Constitution 2014 NLA consists of 220 members appointed by the King in accordance with NCPO’s recommendation.
The National Security Council (NSC) proposed a national security bill to the NLA. If passed, the bill is expected to be enforced in August aiming to protect national sovereignty. Its framework includes protocolsfor Thailand’s response to the international community.
NLA held a seminar on the drafted 2017 Budget Act with the head of the Bureau of the Budget. The 2017 Budget Act with the total 2.73 trillion Baht (i.e. up 13 billion Baht from 2016) integrates a number of projects in-line with government policy to expedite public investments and devotes more funds to local administrations.
NLA approved the nomination of a new Secretary-General of the Anti-Money Laundering Office (AMLO) in which 154 votes were cast in favor of the nomination of Police General Chaiya Siriumphankul as the new chief of the AMLO, with two votes against and three abstentions.
Priority role is to act as the House of Representatives, the Senate, and the National Assembly during the transition period.
NLA has the power to:
Issue the rule on election and perform duties of the NLA President, the NLA Vice-Presidents, and its Committees and meetings.
Introduction and deliberation of Bills and Organic Law Bills (i.e. Constitution Related Bills).
Monitor and control the Interim Government by making the submission of motions, discussion, making resolutions, and interpellation.
Peace keeping and other related matters for the performance of its duties.
HighlightsNLA’s Key Duties
-
-
-
-
Sources: The Royal Thai Government, Thailand Interim Constitution 2014, National New Bureau of Thailand & Thai local newspapers The Nation, Bangkok Post)

© 2016 Deloitte Touche Tohmatsu Jaiyos Co., Ltd.| Quarterly Economic Report : Q2 | 2016 53
The National Reform Steering Assembly (NRSA) to implement the national reform blueprintsNRSA established under Thailand’s Interim Constitution 2014 consists of 200 mem-bers appointed by the King in accordance with NCPO’s recommendation.
A public referendum of the drafted 20th
Constitution of Thailand will be held on August 7, 2016. If the people vote against the draft charter in the referendum, the government will consider drafting another one based on past constitutions (e.g. the 1997, 2007 or existing drafted constitutions). According to the Deputy Premier Wissanu Krea-ngam, this new constitution would be adopted without a public vote.
The Election Commission (EC) held a meeting with election officials from all 77 provinces alongside CDC preparing teachers and speakers to meet with the public on the draft constitution on June. Also, EC confirmed its readiness for the public referendum that will take place on August 7, 2016.
Approved action on an urgent matter related to the reform of the police. The police reform proposal aims to solve problems related to the annual transfers of police officers, which attract widespread criticism concerning corruption and bribery.
Implement the national reform blue-prints proposed by the dissolved National Reform Council (NRC).
Give advices and recommendations to the Constitution Drafting Committee (CDC) for the purpose of Constitution drafting.
Highlights
HighlightsNLA’s Key Duties
Sources: The Royal Thai Government, Thailand Interim Constitution 2014, National New Bureau of Thailand & Thai local newspapers (The Nation, Bangkok Post)

© 2016 Deloitte Touche Tohmatsu Jaiyos Co., Ltd.| Quarterly Economic Report : Q2 | 2016 54
Industry Sector Update

© 2016 Deloitte Touche Tohmatsu Jaiyos Co., Ltd.| Quarterly Economic Report : Q2 | 2016 55
Thailand key industries are expected to continue their moderate growth path in 2016
Sources: Compiled from various research houses & agencies (e.g. EIU, NESDB, K-Research, SCB EIC, FTI) & DTTJ Analysis
Automotive Finance & Banking Electronics Residential Real Estate Wholesale & Retail Tourism
2014 (24) 4 0 10 2 (3)
2015 2 3 (8) 8 2 23
2016F 5 6 3 8 2 14
Forecast CAGR 4 8 1 7 4 7
(30)
(20)
(10)
0
10
20
30
Total loanat the year end
Wholesale &Retail Sales
Revenue fromforeign tourists
Property loanat the year end
Car production ElectronicOutput

© 2016 Deloitte Touche Tohmatsu Jaiyos Co., Ltd.| Quarterly Economic Report : Q2 | 2016 56
AutomotiveThai automotive industry in 2016 is expected to grow 5% buttressed by export growth, while domestic market remains in a negative growth mode due to unfavourable factors. Over the long-term, Thailand automotive industry is forecasted to have an upward moderate growth path.
Thai automotive industry in 2015 benefited from export growth, while domestic market contracted since 2013. Total car production was 1.91 million units or grew by 2% compared to 2014s’. Car export reached 1.2 million units or increased 7% YoY. However, domestic sales during 2015 was 0.8 million units or 9% lower than 0.9 million units sold in 2014 due to the impact of economic slowdown, lower commodity prices, and high level of household debt.
Car production is projected at 2.0 million units, growing 5% from 2015. Of which, 65% of production is for export and 35% for domestic sales. Domestic car sales is forecasted at 0.7 million units or contracts 10% YoY due to the slowdown of domestic demand, whilst car export is likely to maintain the growth rate at 7%YoY thanks to growing demands in major export markets.
As Thailand represents a regional strategic location for production along with the BOI’s eco-car incentive scheme and mega-project investment to enhance Thailand’s competitiveness, major car producers will continue to deploy their production and supply chain capacity to great effects. As analysts expect that overall global economy will gradually capture an upward growth trend in the coming years, Thailand’s car industry is projected to grow 4% over the long-term.
Situation in 2015 Forecast 2016 Long-term trend
Sources: BOI, FTI, OIE, Somboon Advance Technology (SAT), & Thailand Automotive Institute

© 2016 Deloitte Touche Tohmatsu Jaiyos Co., Ltd.| Quarterly Economic Report : Q2 | 2016 57
Thailand remains the ASEAN’s automotive industry leader in the coming years buttressed by an established solid supply chain and a large pool of skilled labours.
ASEAN car production volume (2012 – 2016F)
Thailand domestic car sales and export
(2012 – 2019F)
Sources: ASEAN Automotive Federation, FTI, OIE, OICA, & SAT
Million Unit
0.0
0.5
1.0
1.5
2.0
2.5
3.0
Vietnam Philippines Malaysia Indonesia Thailand
2012
2013
2014
2015
2016F
CAGR (5)%
CAGR 0%
CAGR (4)% CAGR
(33)% CAGR 34%
1.0 1.1
1.0 1.2 1.3 2.12.2
2.3
0.0
0.5
1.0
1.5
2.0
2.5
3.0
2012 2013 2014 2015 2016F 2017F 2018F 2019F Domestic Sales Export
Million Unit
1.4 1.30.9 0.8 0.7
Although CAGR displays negative production growth, Thailand remains the leading car producer of ASEAN with 51.2% market share.
During 2016, Thailand is expected to produce 2.0 million cars growing 5% from 2015. Domestic sales is forecasted at 0.7 million units accounting for 35%, while export is projected at 65% or 1.3 million units
Overall, ASEAN car industry in 2016 is forecasted to grow around 1-2% compared to 2015s’. Car export from ASEAN is expected to grow while domestic demand remains in a contraction mode.
Despite the slowdown of both global and domestic car demands, automotive players in Thailand can outperform other regions as a result of an established solid supply chains and a large pool of skilled labours in Thailand.

© 2016 Deloitte Touche Tohmatsu Jaiyos Co., Ltd.| Quarterly Economic Report : Q2 | 2016 58
Domestic car sales during the first quarter of 2016 was contracted 9% compared to 2014s’ as a result of slowdown domestic demands and several macro adverse factors.
The total number of domestic cars sales during Q1-2016 was 0.18 million units dropped 9% YoY.
Japanese car manufacturers maintained the market leadership in the Thailand car market. Several car manufacturers attempted to capture emerging and untapped demands in ASEAN countries.
Macro adverse factors are expected to affect car domestic sales during 2016. These include high household debt level, low agricultural commodity prices, slow public and private investment disbursement, and international trade contraction.
Update Thailand Car Market for Q1-2016Sources: FTI & Toyota (Thailand) Co. Ltd.
Toyota 28%
Isuzu 20%
Honda 14%
Mitsubishi 9%
Nissan 7%
Mazda 6%
Ford 5%
Suzuki 3%
Chevrolet 2%
Others 6%
Thailand’s domestic car
sales classified by brand during
Q1-2016
Sources: FTI & Toyota (Thailand) Co. Ltd.

© 2016 Deloitte Touche Tohmatsu Jaiyos Co., Ltd.| Quarterly Economic Report : Q2 | 2016 59
Finance & BankingFinance & banking sector is forecasted to grow 6% in 2016 mainly driven by accommodative monetary policy and expansionary fiscal policy.
As a result of domestic and global economic slowdown affected by various adverse factors (e.g. lower commodity prices, high level of household debt, geo-political conflicts), loan outstanding in the banking system finished at 13.2 trillion Baht, growing 3% from 2014.
Overall, Thailand loan outstanding in 2016 is forecasted at 14.0 trillion Baht or grow 6%YoY. During Q1/2016, gross NPL in banking industry was 0.36 trillion Baht or raised 5.9% QoQ affected by adverse economic factors. Likewise, the high level of household debt and lower commodity prices as well as severe drought caused by El Nino will affect consumer loan demands. Overall during 2016, loan de-mands are expected to stem from an accommodative monetary policy and public infrastructure investment.
Financial institutions, will be posting loan growth around 7-8%YoY over the next few years despite facing both external and domestic downside risks. In addition, Thai Government will continue to pursue both short-term and long-term economic stimulus schemes (e.g. SME incentives, transportation infrastructure investments), which will stimulate both Bangkok and upcountry economic expansion, boost loan demands across Thailand, and also, provoke capital markets to raise investment funds.
Situation in 2015 Forecast 2016 Long-term trend
Sources: EIU, K-Research, & SCB EIC

© 2016 Deloitte Touche Tohmatsu Jaiyos Co., Ltd.| Quarterly Economic Report : Q2 | 2016 60
Thailand’s total loans in Q1/2016 reached 13.5 trillion Baht, increasing 2.4% QoQ. In the same period, NPL proportion remained 2.6% QoQ, but NPL outstanding raised 5.9% QoQ.
Overall, the growth of Thailand’s total loan outstanding is expected to accelerate from 3% in 2015 to 6% in 2016. Business loan growth for both corporate and SME segment will be driven largely by public infrastructure investment, which also stimulates private investment. Likewise, overall consumer loan segment will continue to its growth momentum around 6-7% thanks to con-sumption demands and marketing campaigns. NPL proportion in 2016 is forecasted at 2.8 - 3.0% compared to 2.6% in 2015 as a result of adverse economic factors. In addition, analysts have viewed that financial technology (FinTech) in several formats will significantly affect competition, regulatory framework and governance of banks and financial institutions in Thailand in the coming years.
Thailand’s total Loan vs. NPL 2006 – Q1/2016
6.0 6.2 7.5 7.8 8.8 9.8 11.3 12.3 12.9 13.2 13.5
0.0
2.0
4.0
6.0
8.0
10.0
12.0
14.0
16.0
2006 2007 2008 2009 2010 2011 2012 2013 2014 2015 Q1/2016
CAGR 8.6%
CAGR (2.2)%
Trillion Baht
% NPL 7.5% 7.3% 5.3% 4.9% 3.6% 2.8% 2.3% 2.2% 2.2% 2.6% 2.6%
Total Loan
NPL
Sources: BOT, EIU, SCB EIC, K-Research, TMB Analytics, & DTTJ Estimates (Data as of May 2016)Note: (1) Total Loan includes both Thai banks’ and foreign banks’ loan outstanding as of the 4th quarter 2006-2015 (2) NPL include both Thai banks’ and foreign banks’ gross NPL outstanding as of the 4th quarter 2006-2015

© 2016 Deloitte Touche Tohmatsu Jaiyos Co., Ltd.| Quarterly Economic Report : Q2 | 2016 61
Selected Financial Statistics
Commercial Bank Loan 2006 – Q1/2016
Consumption Loan 2006 – Q1/2016
Sources: BOT (as of May 2016) & DTTJ EstimatesNote: * Data have been revised by Bank of Thailand.
Thailand’s total loan in 2016 is expected to grow 6% from 2015.
Number of Total
Thai Commercial Bank 15
Foreign Bank Subsidiary & Branch 16
Specialized Financial Institution 8
Foreign Representative 47
Asset Management Company (AMC) 43
Credit Card Company 10
Personal Loan Company 36
Nano Finance Company 17
Credit Card 22.3 M
Debit Card 47.0 M
ATM Card 12.9 M
Personal Loan Account* 13.0 M
E-Money Card/Account* 32.9 M
Internet Banking Account* 12.9 M
Mobile Banking Account* 11.6 M
Selected Financial Statistics
2.7 1.2 2.0 3.0 3.4 3.8 4.1 4.7 4.9 4.9 4.8 5.12.8
2.9 2.6 2.9 3.3 3.6 4.2 4.4 4.7 4.7
1.2 1.4
1.6 1.7 2.1 2.4 2.9 3.3 3.5 3.7 3.7
0.0 2.0 4.0 6.0 8.0
10.0 12.0 14.0 16.0
2006
2007
2008
2009
2010
2011
2012
2013
2014
2015
Q1/
2016
Corporate Loan SME Loan Consumer Loan
CAGR 10.1%
Trillion Baht
CAGR 11.9%
CAGR 15.5%
CAGR 5.2%
0.3 0.7 0.8 0.9 1.0 1.1 1.2 1.3 1.5 1.7 1.0 1.9
0.3 0.4 0.4 0.5 0.6 0.8 0.9 0.9 1.0 1.0
0.2 0.3 0.4 0.4 0.5 0.6 0.8
0.9 0.9 0.9 0.9
0.0 0.5 1.0 1.5 2.0 2.5 3.0 3.5 4.0
2006
2007
2008
2009
2010
2011
2012
2013
2014
2015
Q1/
2016
Hire Purchase Other Loan Housing Loan
CAGR 15.1%
CAGR 12.4%
CAGR 10.5%
CAGR 11.9%
Trillion Baht

© 2016 Deloitte Touche Tohmatsu Jaiyos Co., Ltd.| Quarterly Economic Report : Q2 | 2016 62
Total loan outstanding in Q1/2016 was 13.5 trillion Baht. Corporate, SME and Consumer loan proportion were 38%, 35% and 27% respectively.
Consumer 27%
SME 35%
Corporate 38%
Loan proportion in Q1/2016
Loan growth comparisons (Unit: Trillion Baht)
Q1/2015 Q4/2015 Q1/2016 % YoY
% QoQ
Corporate 4.98 4.79 5.13 3.1% 7.1%
SME 4.53 4.72 4.68 3.3% (0.8)%
Consumer 3.52 3.71 3.73 5.7% 0.4%
Total 13.03 13.22 13.53 3.8% 2.4%
Loan growth comparisons (Unit: Trillion Baht)
Source: Bank of Thailand (as of May 2016)

© 2016 Deloitte Touche Tohmatsu Jaiyos Co., Ltd.| Quarterly Economic Report : Q2 | 2016 63
ElectronicsThailand’s electronic industry continues its downward trend affected by global and domestic economic slowdown as well as shifting production-base.
Electronic industry outputs were contracted by 7.9% compared to 2014s’ due to the slowdown of global and domestic demands. Computer and part dropped by 10.2%, while domestic electrical appliances were contracted 4.4% from the previous period.
Office of Industrial Economics (OIE) forecasts that the production of computer and part and domestic electrical appliances will grow 3% and 5% respectively. However, Thai electronic export is expected to shrink at 5-7% due to the sluggish demand of electronic inputs and products in export markets.
Thailand’s electronic industry, especially computer and parts, has been facing high competition and global demand uncertainty with the projected long-term growth at 0-1%. In turn, computer and part players across the world will create their new growth models to counter the aggressive moves of smartphone and tablet rivals (e.g. Samsung, Apple, Lenovo, Huawei, Xiaomi). For electronic appliance industry, although Thailand no longer gains advantages as the regional production-base, both export markets and domestic demands for some products (e.g. air conditioners, refrigerators) are likely to maintain their growth path in the coming years.
Situation in 2015 Forecast 2016 Long-term trend
Sources: OIE & MOC

© 2016 Deloitte Touche Tohmatsu Jaiyos Co., Ltd.| Quarterly Economic Report : Q2 | 2016 64
Electronics – computers & partsThe outlook for global electronic industry in a next few years overall remains in a slowdown mode.
Global semiconductor sales in 2016 is expected to contract 2.4%YoY as a result of tepid semiconductor demands across major markets. For 2017-2018, SIA has forecasted semiconductor sales growth at 2.0% and 2.2% in line with slow recovery of advanced economies.
Global PC penetration will continue to rise steadily from 46% in 2016 to 53% in 2018. PC usage remains strong, but its status as the default tool is gradually being eroded in developed economies.
Although Apple and Samsung maintain their dominance in the smartphone market, budget smartphone offerings are gradually gaining stronghold in emerging markets. However, over the long-term the smartphone market is showing signs of slowing down due to the sluggish growth of major economies.
Global Semiconductor Sales
Personal Computer User
305.6
335.8 335.2 327.2 333.7 340.9
200.0
300.0
400.0
2013
2014
2015
2016
F
2017
F
2018
F
Global Semiconductor Sales Billion USD CAGR 2013 – 2018F = 2%
0.0 10.0 20.0 30.0 40.0 50.0 60.0
2013
2014
2015
2016
F
2017
F
2018
F
Users/ 100 People
CAGR 2013 – 2018F = 7%
37.7 40.4 43.3 46.4 49.6 53.1
Sources: EIU, OIE, Semiconductor Industry Association (SIA), & World Semiconductor Trade Statistics (WSTS)

© 2016 Deloitte Touche Tohmatsu Jaiyos Co., Ltd.| Quarterly Economic Report : Q2 | 2016 65
Production
Export Capacity Utilization
100.0 88.3 86.5 94.9
73.3 63.2
0.0
100.0
200.0
2011
2012
2013
2014
2015
2016
(4M
)
MPI
CAGR 2011 – 2015 = (8%)
Man
ufac
turi
ng P
rodu
ctio
n In
dex
(B
ase
Year
201
1 =
100)
17.1 19.1
17.8 18.2 17.6
6.6
0.0
5.0
10.0
15.0
20.0
2011
2012
2013
2014
2015
2016
(5M
)
Billion USD
CAGR 2011 – 2015 = (0.8)%
69.7
58.7 54.8 54.8
44.1 37.8
0.0
20.0
40.0
60.0
80.0
2011
2012
2013
2014
2015
2016
(4M
)
Percentage (%)
CAGR 2011 – 2015 = (11%)
Sources: DTTJ Estimates, Department of International Trade Promotion (DITP) & OIE
The Thai computer and part industry is moving toward the decline stage, facing challenges from technological shifts and oversea competitors.
MPI and capacity utilization from January – April 2016 were contracted 16.7% and 7.3%YoY respectively. Likewise, computer and part export during January – May 2016 was dropped by 8.5% compared to 2015s’.
Overall, MPI, export and capacity utilization in 2016 is expected to be lower than 2015s’.
Due to the contraction of computer and part industry across the world, Thailand can no longer take great benefits from this industry as before. Value has migrated to growing adjacent segments (i.e. tablet, smartphone).

© 2016 Deloitte Touche Tohmatsu Jaiyos Co., Ltd.| Quarterly Economic Report : Q2 | 2016 66
Electronics – domestic electrical appliancesDomestic electrical appliance’s production and export are projected to grow in 2016 and could keep a stable trend in years after.
Production
Export Capacity Utilization
100.0
109.0
97.1 96.6 94.2 95.9
80.0
90.0
100.0
110.0
120.0 20
11
2012
2013
2014
2015
2016
(4M
)
MPI
CAGR 2011 – 2015 = (2)%
Man
ufac
turi
ng P
rodu
ctio
n In
dex
(B
ase
Year
201
1 =
100)
14.9 14.8 14.7 14.6 14.0
5.7
0.0
5.0
10.0
15.0
20.0
2011
2012
2013
2014
2015
2016
(5M
)
Billion USD
CAGR 2011 – 2015 = (1.5)%
64.9
72.2
64.5 64.3 62.2 65.0
40.0
60.0
80.0
2011
2012
2013
2014
2015
2016
(4M
)
Percentage (%)
CAGR 2011 – 2015 = (1)%
From January – April 2016, MPI and capacity utilization increased by 1.0% and 1.3%YoY respectively. Likewise, export during January – May 2016 grew by 4%YoY
Despite struggling in the recent years, Thailand remains competitive for several domestic appliance products such as air conditioners, refrigerator among them.
Thai government deploys the new BOI investment policy, which encourage manufacturers to deploy Thailand as a springboard to AEC.
Sources: DTTJ Estimate, DITP, & OIENote: Domestic Appliances include several electrical products such as air conditioner, rice cooker, refrigerator, water pot, electric fan and so on.

© 2016 Deloitte Touche Tohmatsu Jaiyos Co., Ltd.| Quarterly Economic Report : Q2 | 2016 67
Residential Real EstateA gradual rise in household revenue and accelerating urbanization still help boost the real estate sector. However, the growth rate has been restricted by an increase in household debt and some concerns over lower demand in the future.
Real estate markets were solid during 2015, as investor confidence in residential real estate sector improved. Nevertheless, various factors such as higher household debt, low commodities prices and slow government budget disbursement shook both lender and investor confidence and resulted in the lower growth in real estate market. Property credit outstanding by the end of 2015 reached 2.5 trillion Baht or grew 9% from 2014.
Thailand’s property market is projected to grow by 5-10%, especially in Bangkok and vicinity area due to public investment in infrastructure projects and government real estate incentives. Likewise, regional mega-project investments including railway double-tracking, motorways, and new mass-transit routes will encourage the growth of property market nationwide.
The forecasted long-term GDP growth of Thailand at 3.0-3.5% in conjunction with global economic sluggish growth is likely to cause an adverse effect on real estate sector in Thailand. In the wake of higher housing debt, it is expected that lenders will tighten up the mortgage criteria and decelerate the demand for house. Nonetheless, the ASEAN integrated market should help increase demand for commercial and residential space in Thailand as foreign firms are likely to move their headquarters and some stages of production to benefit a low cost of living.
Situation in 2015 Forecast 2016 Long-term trend
Sources: BOT, Plus Property, & SCB EIC

© 2016 Deloitte Touche Tohmatsu Jaiyos Co., Ltd.| Quarterly Economic Report : Q2 | 2016 68
Mortgage markets and property loan continue their growth path in 2016 amid sluggish domestic demands.
Permitted Construction Areas in Municipal Zones Nationwide Condominium Registration
New Housing in Bangkok & Vicinity
Property Loan Outstanding
3.5 2.4 2.9
3.8 2.9
5.4 5.9 4.8 3.5
3.8
2.4 2.0 2.1 2.3 2.6
3.6 4.4
3.0 3.7
3.4
0.0
5.0
10.0
15.0
20.0
25.0
30.0 20
06
2007
2008
2009
2010
2011
2012
2013
2014
2015
2016
F
Industrial Commercial Residential
19.6
Million M 3
17.4 17.5 17.0 18.0 18.0
24.2 26.1
24.1 23.4
CAGR 2006 – 2016F = 0.6%
20.7 20.9
13.7 12.9 12.5 11.0 12.515.1 15.8 16.2 16.3
13.6
0.3 0.4 0.4 0.4
0.4 0.4
0.5 0.5
0.6 0.6
0.0
0.5
1.0
1.5
2.0
2.5
3.0
2006
2007
2008
2009
2010
2011
2012
2013
2014
2015
2016
F
Developer Loan
Personal Housing Loan
CAGR 2006 – 2016F = 10% Trillion Baht
1.0 1.1 1.3
1.3 1.4
1.6 1.8
2.1
2.3 2.5
2.7
0.7 0.8 0.9 1.0 1.1 1.2 1.3 1.5 1.7 1.8
2.7
The trend of construction and real estate investment in overseas markets to generate more revenue and to balance portfolios has been seen as a window of business opportunities opens.
Mortgage markets and lending growth are buttressed by accommodative fiscal and monetary policy (i.e. mortgage stimulus package and lending interest rate), but also by infrastructure investment in major regional provinces.
Sources: BOT, GHB, REIC & DTTJ Estimates

© 2016 Deloitte Touche Tohmatsu Jaiyos Co., Ltd.| Quarterly Economic Report : Q2 | 2016 69
The upper-income and foreign buyers are the growth engine of Thailand’s mortgage market in 2016.
Nationwide Condominium Registration Key Real Estate Landscapes
New Housing in Bangkok & Vicinity
10.4 7.1 14.1
26.6 21.8
10.7
47.2
51.6 64.0 76.4
0.0
20.0
40.0
60.0
80.0
100.0
120.0
140.0
2006 2007 2008 2009 2010 2011 2012 2013 2014 2015 2016F
Other Provinces
BKK & Vicinity
(‘000 Unit)
23.2 21.9
40.3
56.2 63.9
39.8
81.7
102.2 108.2
117.6 123.5
12.8 14.8 26.3 29.6 42.129.1 34.5
50.6 44.2 41.2
18.6 17.4 34.0 53.7 59.9
34.7
78.4 71.4 75.1 67.4 28.9 25.3
24.0 19.6
22.5
20.1
23.4 23.3 24.9
23.1
0.0
20.0
40.0
60.0
80.0
100.0
120.0
140.0
160.0
2006 2007 2008 2009 2010 2011 2012 2013 2014 2015 2016F
Self-Built House Apartment & Condo Housing Project
(‘000 Unit)
79.8 75.7 85.6
95.0 106.9
81.9
125.0 130.0 133.8
124.5 130.7
32.2 32.8 27.5 21.6 24.5 27.0 23.237.6 33.5 34.0
Sources: BOT, GHB, REIC, & DTTJ Estimates
Mae Hong Sorn
Chiang Mai
Chiang Rai
Nan
Lam phun
Phayao
Lam pang
Phrae
Utharadit
Nakorn Sri Thammarat
Samut Prakan
Prachuab Kirikhan
Chum porn
Phang Nga
Trad
Chanta buri Rayong Phetchaburi
Prachinburi
Chonburi
Samut Sakorn
Ratchaburi
Kanchanaburi
Kalasin Mukda harn
UbonRatchathaniSrisaket Surin
Roi-et Yaso thorn
Sakon nakorn
Buengkan
Nakorn Phanom
Khon Kaen
Sukho thai Phitsanulok
Tak
Udorn Thani Loei
Uthaithani
Chaiyaphum Maha Sara kham
Nakorn Sawan
Pichit Phet cha boon
Kampang phetch
Su- phan- buri
Chainat
Saraburi
Lopburi Sing buri
Buriram
Nakorn Ratchasima
Ang Thong
Nakorn Nayok
Ayuthaya
Nakhon Pathom
Phuket Patta-lung
Krabi
Nara thiwat
Yala
Trang
Songkhla Pattani Satun
Chachoengsao
Samut Songkram
BKK
Ranong
Non thaburi
Pathum Thani
Sakaeo
Amnat Charoen
Nong Bua Lam- phu
Surat Thani
Nong Khai
Koh Samui
Bangkok & Vicinity
Chiang MaiChonburiKhon KaenNakorn RatchasimaPhuketPrachuab Kirikhan (Hua Hin)RayongSongkhla (Hadyai)Surat Thani (Koh Samui)Ubon RatchathaniUdon Thani
Key UPC real estate markets

© 2016 Deloitte Touche Tohmatsu Jaiyos Co., Ltd.| Quarterly Economic Report : Q2 | 2016 70
Wholesale & RetailWholesale and retail players will continue their growth strategy in the coming years underpinned by the expansion of tourism, e-commerce, and both modern and tradition traders in urban and country areas.
Thailand’s consumer goods market was improved in 2015 thanks to better political conditions and domestic economic rebound. Retail and wholesale taken together grew approximately 2% compared to 2014s’. Major players continued to adopt marketing promotions, but also enlarge their footprints nationwide.
Wholesale and retail sales in 2016 are expected to be in a moderate growth mode with a combined growth rate at 2% compared to 2015s’. During Q1-2016, Berli Jucker Pcl, one of the major players in Thailand’s consumer business segment, has become the major shareholder of BIGC Supercenter Pcl and in turn boost competitive advantages and business synergies for Thai Chareon Corporation (TCC) Group.
Thai government has tried to transformed the traditional market to the service-based economy. Private consumption has been bolstered by an expansionary fiscal policy spending on repairing schools, hospitals and irrigation systems to support job creation in both urban and rural areas. The emergence of AEC, moreover, will open up an opportunity to invest and trade between ASEAN member states. The strong sales performance for the wholesale and retail industry over the long-term is expected to grow around 3-4%.
Situation in 2015 Forecast 2016 Long-term trend
Sources: BOT, BOL Database, EIU, & DTTJ Analysis

© 2016 Deloitte Touche Tohmatsu Jaiyos Co., Ltd.| Quarterly Economic Report : Q2 | 2016 71
Sources: BOT & EIU
Three major sales channels continue their long-term growth momentum. Retailers and Wholesalers gain a moderate sales growth path, while department store enjoys a rapid pace of sales expansion thanks to the revival of tourism sector and domestic demands.
Major Trading Indices (2008 – Q1/2016)
Index
135 141 145 152
161 175
183 193
210
151 160 167 179
196
198 207 203
210
157
179 186 195
208 220 225
241
292
0
25
50
75
100
125
150
175
200
225
250
275
300
2008 2009 2010 2011 2012 2013 2014 2015 Q1/2016
Wholesale
Retail
Department Store
Base
Yea
r 200
2 =
100
5.2%
4.3%
6.3%
CAGR (2008 – 2015) Q1/2016 YoY
7.9%
5.4%
26.4%

© 2016 Deloitte Touche Tohmatsu Jaiyos Co., Ltd.| Quarterly Economic Report : Q2 | 2016 72
Sources: BOL Database, EIU, & DTTJ EstimatesNote: Our analysis covers only wholesalers and retailers of foods and customer package products.
Both wholesale and retail sales in 2016 are projected to grow moderately as a result of sluggish domestic consumption and investment.
Major Trading Indices (2008 – Q1/2016)
1,057 1,147
1,252
1,396 1,415 1,421 1,414 1,435 1,457
609 599 673
762
891 950 968 994 1,013
0
200
400
600
800
1,000
1,200
1,400
1,600
2008 2009 2010 2011 2012 2013 2014 2015 2016F
Wholesale
Retail
1.5%
2.0%
CAGR (2008 – 2015) 2016YoY
4.5%
7.2%
Billion Baht

© 2016 Deloitte Touche Tohmatsu Jaiyos Co., Ltd.| Quarterly Economic Report : Q2 | 2016 73
TourismWith the vision 2015 – 2017 “Quality Leisure Destination”, Thailand tourism sector in 2016 is projected to continue its growth path in both the number of foreign tourists and revenues.
Tourism sector was recovered in 2015 as a result of a better political environment and the success of the government’s tourism campaign, namely, “2015 Discover Thainess”. The number of foreign tourists was 29.9 million or grew 21% compared to 2014s’. Total tourism revenue in 2015 was 1.45 trillion Baht or increased 23%YoY.
As Thailand shifts her tourism strategy from the quantity-driven to the quality- driven (i.e. grow both the number of foreign tourists and revenues), several initiatives have been proposed by the Ministry of Tourism and Sports to increase visitor expenditure, average length of stay, and the overall quality of the visitor experience. It is forecasted that the number of foreign visitors in 2016 will reach 32.3 million or grow 8% compared to 2015. Similarly, revenue from foreign tourists will be around 1.65 trillion Baht or increase 14%YoY.
Asian tourists especially from ASEAN, China, Japan and South Korea will be the major contributors to Thai tourism businesses over the long-term. Likewise, a trend of global economic recovery and better Thai political condition could boost tourism sector with the potential CAGR of 8%. In turn, it is expected that hotel industry will gain high room occupancy rate above 60%. In the long-run, Thailand adopts “quality tourism strategy”, which addresses the so-called “3Rs” (i.e. Repositioning, Restructure, and Rebalance) to enhance both competitiveness and sustainability of tourism industry.
Situation in 2015 Forecast 2016 Long-term trend
Sources: BOT, Department of Tourism, Tourism Authority of Thailand (TAT), 2016 Thailand Tourism by Minister of Tourism & Sports & The World Tourism Organization (UNWTO)

© 2016 Deloitte Touche Tohmatsu Jaiyos Co., Ltd.| Quarterly Economic Report : Q2 | 2016 74
Total tourist arrivals in 2016 are forecasted at 32.3 million or raised 8% compared to 2015s’.
Foreign Tourists 2008 – 2016F
14.6 14.1 15.9
19.2
22.4
26.5 24.8
29.9 32.3
0.0
5.0
10.0
15.0
20.0
25.0
30.0
35.0
2008 2009 2010 2011 2012 2013 2014 2015 2016F
CAGR 2008 – 2016 = 10.4%
Hotel room occupancy (%) 56% 49% 50% 58% 61% 65% 56% 62% 65%F
#Tourist (Million)
Flooding Political Unrest Political
Unrest
Coup d’etat
Political Unrest
Political Unrest
Forecast: Grow 8% from 2015
Subprime Crisis
Subprime Crisis
Euro Debt Crisis Euro Debt
Crisis
MERS
The number of foreign tourists in 2016 is projected at 32.3 million growing 8%YoY and around 70% of these tourists is from ASEAN, China, South Korea and Japan.
Hotel room occupancy rate is forecasted at 65% in line with increasing number of tourists. However, the large proportion of room occupancy tends to concentrate in major tourist destinations such as Bangkok, Phuket, Chiang Mai, Chonburi and the like.
Sources: Department of Tourism, TAT, The Royal Thai Government, & DTTJ Estimate

© 2016 Deloitte Touche Tohmatsu Jaiyos Co., Ltd.| Quarterly Economic Report : Q2 | 2016 75
The implementation of new tourism strategy focusing on “Quality Tourism” significantly boosts revenues from foreign tourists since 2015, but will also contribute a large proportion to Thailand GDP over the coming years.
Revenue from Foreign Tourists (2008 -2016F)
0.00
0.50
1.00
1.50
2.00
2008 2009 2010 2011 2012 2013 2014 2015 2016F
Trillion THB CAGR 2008 – 2016 = 14.1%
0.57 0.51 0.59 0.730.98
1.21 1.171.45
1.65
The tourism strategy focusing on “Quality Tourism” over the coming years is likely to sustain the growth momentum of tourism activities across tourism supply chain including hotels, airlines, travel agents, restaurants, and so on.
In 2016, Revenue from foreign tourists is forecasted at 1.65 trillion Baht growing 13.8%YoY accounting for 11.8% of Thailand GDP.
For the 2016 – 2026 period, WTTC has projected the cumulative average growth rate (CAGR) of 6.7%. By 2026, Thailand’s tourism is expected to have a direct contribution of 2.48 trillion Baht or 14.0% of total GDP in 2026.
Sources: Department of Tourism, 2016 Thailand Tourism by Minister of Tourism & Sports, NESDB, World Travel & Tourism Council 2016 (WTTC) & DTTJ Estimate

© 2016 Deloitte Touche Tohmatsu Jaiyos Co., Ltd.| Quarterly Economic Report : Q2 | 2016 76
Upcoming Report HighlightsComing next in Oct’16
New Thailand key industry updates
Current Situation of Key Industries:
Food & Beverage, Energy: Electricity, and
Telecommunications

Deloitte refers to one or more of Deloitte Touche Tohmatsu Limited, a UK private company limited by guarantee (“DTTL”), its network of member firms, and their related entities. DTTL and each of its member firms are legally sepa-rate and independent entities. DTTL (also referred to as “Deloitte Global”) does not provide services to clients. Please see www.deloitte.com/th/about to learn more about our global network of member firms. Deloitte provides audit, consulting, financial advisory, risk management, tax and related services to public and private clients spanning multiple industries. Deloitte serves four out of five Fortune Global 500® companies through a glob-ally connected network of member firms in more than 150 countries and territories bringing world-class capabilities, insights, and high-quality service to address clients’ most complex business challenges. To learn more about how Deloitte’s approximately 225,000 professionals make an impact that matters, please connect with us on Facebook, LinkedIn, or Twitter. About Deloitte Southeast Asia
Deloitte Southeast Asia Ltd – a member firm of Deloitte Touche Tohmatsu Limited comprising Deloitte practices operating in Brunei, Cambodia, Guam, Indonesia, Lao PDR, Malaysia, Myanmar, Philippines, Singapore, Thailand and Vietnam – was established to deliver measurable value to the particular demands of increasingly intra-regional and fast growing companies and enterprises. Comprising 270 partners and over 7,300 professionals in 25 office locations, the subsidiaries and affiliates of Deloitte Southeast Asia Ltd combine their technical expertise and deep industry knowledge to deliver consistent high quality services to companies in the region. All services are provided through the individual country practices, their subsidiaries and affiliates which are separate and independent legal entities. About Deloitte Thailand
In Thailand, services are provided by Deloitte Touche Tohmatsu Jaiyos Co., Ltd. and its subsidiaries and affiliates. This communication contains general information only, and none of Deloitte Touche Tohmatsu Limited, its member firms, or their related entities (collectively, the “Deloitte network”) is, by means of this communication, rendering pro fessional advice or services. No entity in the Deloitte network shall be responsible for any loss whatsoever sus-tained by any person who relies on this communication.