china economic quarterly q2 2019 - pwc...china economic quarterly q2 2019 amidst the global economic...
TRANSCRIPT

China Economic Quarterly Q2 2019
Amidst the global economic slowdown and escalating trade tensions, the 6.2% GDP growth rate in Q2 meets market expectations.
August 2019Major economic indicators p1/Policy updates p10/Hot topic analysis p14
Content
Ⅰ. Major economic indicators 1
GDP growth increased by 6.2% in Q2 (IMF expects global economy slow down to 3.2% in 2019)
Total fixed asset investment reached 29.91 trillion yuan, expanding by 5.8% in 1H
Total real estate investment increased by 10.9%, reached 6.16 trillion yuan in 1H
PMI dropped below the threshold of 50%
Total profit for all industrial companies over certain scales declined by 2.4% in 1H
Total retail sales of consumer goods went up by 8.4% in 1H
Imports and exports increasing by 3.9% in 1H
PPI went up by 0.3% and CPI increased by 2.2% in 1H
2
4
5
6
7
8
9
10
Ⅱ. Policy updates 10
1. Aggregate financing continued to grow 10
2. Fiscal spending went up by 10.7% in 1H, or 3.9% more than in 2018 11
Ⅲ. Hot topic analysis: What China has achieved for economic development in the last seven decades?
14

For the second quarter in 2019, China’s GDP growth has increased by 6.2%, or 6.3% for the first half year year-on-year. The growth rate in Q2 was slower than Q1, but as a result of the global economic slowdown and ongoing trade tensions, this matched market expectations.
Even though, the GDP growth rate was slightly lower than past quarters, China will still contribute around 30% of global economic growth this year. China's economy will definitely add more than US$1 trillion in GDP in 2019 which is very likely to be bigger than the growth of the US, Europe and Japan combined.
In comparison to the GDP growth in previous quarters — 6.4% in Q1 2019, and 6.4% in Q4, 6.5% in Q3, 6.7% in Q2, 6.8% in Q1 2018 year-on-year, trade tensions (together with domestic policy adjustments including deleveraging) have definitely negatively impacted on China’s economy, but the direct influence is rather limited, and not as serious as some press have reported.
Furthermore, the total GDP reached 45.09 trillion yuan in the first half year and the growth rate of 6.2% in Q2 is 0.2% less than Q1, or 0.5% less than Q2 of last year. There is no doubt that China can meet the new official GDP growth target range from 6.5% to 6% in the second half of 2019.
Major economic indicatorsI
Figure 1: Quarterly GDP values and quarterly and annual GDP growth rate
Source: National Bureau of Statistics of China; Wind
1.80%
1.80%
1.70%
1.70%
1.80%
1.70%
1.50%
1.40%1.90%
1.70%1.60%
1.50%
1.80%
1.70%
1.60%
1.50%
1.70%
1.60%
1.50%
1.40%
1.60%
7.30%6.90% 6.70% 6.80% 6.60%
0.00%
1.00%
2.00%
3.00%
4.00%
5.00%
6.00%
7.00%
8.00%
0.00
5.00
10.00
15.00
20.00
25.00
30.00
Quarterly GDP Value Quarterly Growth Annual GDP growth
GD
P (T
rillio
n yu
an)
On the other hand, the International Monetary Fund (IMF) recently announced that the global economy would grow 3.2% in 2019 and 3.5% in 2020 which is 0.1 percentage point lower than the forecast released in April. The IMF emphasised this is mostly due to ongoing trade tensions between China and the US. Actually, as we mentioned in earlier issues of this report, the IMF has cut global economic forecasts a couple of times, from 3.7% to 3.5% in January, and again from 3.5% to 3.3% in April.
China’s economic growth is still nearly two times the global economic growth rate and continues to be one of the most important backbones upholding the global growth trend.
In addition to GDP, China’s unemployment rate was slightly lower than the same period last year, but still remained stable in the first half year. During the first six months, 7.37 million new jobs across the country were created which accounts for 67% of the annual target for 2019.
In June the urban surveyed unemployment rate in 31 major cities was 5.0%, and the national unemployment rate in urban areas was 5.1%. Particularly, for the population aged from 25 to 59, the surveyed unemployment rate in urban areas was 4.6%, which is much lower than the total rate. In June, the national average working hours of employees in enterprises was 45.7 hours per week.
Additionally, the three most important drivers of China’s economy, namely consumption, total fixed asset investment, and trade, went up 8.4%, 5.8% and 3.9% respectively in the first six months of 2019. All of these figures improved even more in June, month-on-month.
Therefore, there are no strong indicators showing that China’s GDP growth rate will fall below 6% in the second half of the year.
1PwC
Source of data: Unless otherwise stated, economic data is from the National Bureau of Statistics, Wind and financial data from the People’s Bank of China.

Again, probably as a result of trade tensions and the global economic slowdown, the total value of imports and exports in the first half year increased by only 3.9% (3.7% in Q1, 9.7% in 2018) to 14.67 trillion yuan. However, net exports expanded and contributed 20.7% (22.8% in Q1) to total GDP growth.
The impact of gross capital formation and net exports to China’s economic growth are almost the same. However, this does not happen very often.
Figure 2: GDP composition
Prop
ortio
n
8.19%
7.84%
7.69%
7.55%
7.24%
7.12%
7.06%
6.98%
6.35%
5.93%
6.08%
46.96%
47.73%
47.84%
46.78%
45.38%
44.60%
42.38%
40.99%
41.50%
41.70%
41.11%
44.86%
44.43%
44.47%
45.67%
47.38%
48.28%
50.56%
52.03%
52.15%
52.37%
52.81%
0.00%
20.00%
40.00%
60.00%
80.00%
100.00%
Primary industry Secondary industry Tertiary industry
In the first half year, the output of the primary, secondary and tertiary industry was 2.32, 18.00, 24.77 trillion yuan, respectively (0.88, 8.23, and 12.23 trillion yuan in Q1).
The tertiary industry or service sector, accounting for 60.3% of total GDP, grew by 7.0% year-on-year in the first half year, while the growth rates for the primary industry and secondary industry were 3.0% and 5.8% respectively.
Due to a lower growth rate caused by a higher benchmark for the same period in 2018, the primary industry (mainly agriculture) contribution of total GDP continued to drop to 2.6% in the first half year (from 7.19% in 2018 to 4.11% in Q1 in 2019).
For the first half year, the final consumption expenditure amounted to 60.1% (65.1% in Q1, 76.2% in 2018) of total GDP growth.
Meanwhile, gross capital formation (or gross domestic investment) contributed about 19.2% (12.1% in Q1, 30% in 2018) of total GDP growth in the first half year, which is much higher than Q1.
2 China Economic Quarterly Q2 2019

Total fixed asset investment reached 29.91 trillion yuan, expanding by 5.8% in the first half year (6.3% in Q1) year-on-year, which is slightly slower than the same period in 2018. In June, it went up by 0.44% month-on-month.
As a result of supportive policy measures since Q4 of 2018, total fixed asset investment continued to grow, but as with last year, the growth rate is still less than the GDP growth rate.
More specifically in the first six months, private investment continued to account for more than 60% of the total, and went up by 5.7% (6.4% in Q1) year-on-year. State owned investment increased by 6.9% (6.7% in Q1), and fixed asset investment from Hong Kong, Macao and Taiwan owned companies was still very weak, increasing by only 1.1% (2.8% increase in Q1, 11.5% decline in 2018).
Unlike Q1, foreign owned fixed investment increased by only 1.2% (8.7% in Q1) in the first six months. This is probably due to slower global economic growth and escalating trade disputes between China and the US. However, while China is speeding up reform and opening up more sectors to foreign investment, foreign owned fixed investment is expected to grow again in the near future.
By sectors, fixed asset investment of the primary (0.84 trillion yuan), secondary (10.01 trillion yuan) and tertiary industry (19.06 trillion yuan) declined 0.6% (3% increase in Q1 and 12.9% in 2018), increased 2.9% (4.2% in Q1 and 6.2% in 2018) and increased 7.4% (7.5% in Q1 and 5.5% in 2018) respectively during the first six months year-on-year. Again, the investment growth of the service sector is much higher than the same period last year.
As with Q1, fixed asset investment in a few sectors was still weak in the first half year, such as:• -10.5% (-8.7% in Q1, -4.1% in
2018) in manufacturing of railways, shipbuilding, aerospace and other transportation equipment;
• -0.5% (0.7% in Q1, -6.7% in 2018) in production and supply of electricity, gas, and water;
• 1.1% (-5.5% in Q1, -4.9% in 2018) in management of water resources;
• -8.1% (-3.1% in Q1) in manufacturing of electrical machinery and equipment;
• 0.2% (-1.0% in Q1) in manufacturing of automobiles;
• -3.4% (-17.1% in Q1) in smelting and pressing of non-ferrous metal;
• -7.4% (-6.7% in Q1) in processing of food from agricultural products.
• 0.4% in processing of food;• -0.3% in textiles.
Figure 3: Fixed Asset Investment
13.50%
11.40%10.30%
10.00%10.70%
9.00%8.20% 8.10%
9.20%8.60%
7.50% 7.20% 7.50%
6.00%5.40%
5.90% 6.30%5.80%
Accu
mul
ated
gro
wth
rat
eThe growth of fixed asset investment in the manufacturing sector was only 3.0%, much slower than 9.5% in 2018, and 4.6% in Q1 of this year.
Infrastructure investment is recovering and increased 4.1%, of which ecological protection and environmental management went up by 48%, and railway transportation increased by 14.1%.
From the services sector, it is worth mentioning that fixed asset investment in education increased by18.9% and that of culture, sports, and entertainment went up by 22.1%.
For the second half of 2019, the growth trend of total fixed asset investment will probably not change very much, however state owned controlled investment might gradually speed up as a result of policy support.
3PwC

Figure 4: Growth rates in real estate
15.8%
-1.2% 0.5% -2.1%2.1%
7.2%
11.3%15.6% 15.7% 15.3% 14.3% 14.2%
-34.1%-33.1% -33.8% -33.2%
-27.5%
8.2%4.8% 3.1% 2.1% 5.1%
4.6% 6.4% 6.9% 7.8% 7.7% 7.6% 6.4%2.1%
5.9%8.9% 7.6% 7.2%7.0%
9.9% 10.4% 10.3% 10.2% 9.7%10.2%
10.1% 9.9% 9.7% 9.7%9.5%
11.6% 11.8% 11.9% 11.2% 10.9%
-40.0%-35.0%-30.0%-25.0%-20.0%-15.0%-10.0%
-5.0%0.0%5.0%
10.0%15.0%20.0%
growth rate of land purchased growth rate of resources of funds growth rate of investment
Gro
wth
rat
e
As with Q1, as a result of increasing aggregate financing to the real economy, financing in the real estate sector improved in the first six months of 2019 compared to last year.
Total real estate investment increased by 10.9% (11.8% in Q1) and reached 6.16 trillion yuan (2.4 trillion yuan in Q1) which accounted for about 21% of total fixed asset investment in the first six months.
Meanwhile, residential property is about 73% of China’s real estate investment, which went up 15.8%. On the other hand, investment in commercial buildings has grown at a much slower rate.
Compared to the growth rate of 5.8% for total fixed asset investment in the first half year, real estate investment has grown much faster. Steady and healthy growth of the real estate sector is becoming more critical to China’s development, especially during the downturn.
It is likely that macro control policy for the property market will continue to combat speculation, but might also hinder reasonable demand for better quality and bigger housing. Thus, it is important to define the difference between speculation and rational demand for better living conditions.
Additionally, in the longer term, China’s urbanisation rate is around 60%, which is about 20% less than many advanced economies. Each year millions of people move from rural areas to cities, and this will last for at least another two decades.
During the first half year, the development of the overall real estate sector was still relatively slow, for instance:• Floor space of buildings completed
(residential, office, and commercial) dropped by 12.7% (10.8% in Q1, 7.8% drop in 2018).
• In 2018 the growth rate of land purchased increased by 14.2%, but it has significantly declined 27.5% in the first six months (33.1% decline in Q1). This is the result of tighter financing and strict macro controls in the last few years. Some small and medium sized developers might have been squeezed out of the market due to tough competition.
• Floor space of commercial housing ready for sale dropped by 8.9% (9.9% in Q1, 11% in 2018), out of which residential housing declined 15.2%.
• Total floor space of commercial buildings sold declined by 1.8% (0.9% decline in Q1, 1.3% increase in 2018).
However, as with Q1, the total sales value of commercial buildings went up by 5.6% in the first half year or increased by 7.07 trillion yuan (2.7 trillion yuan in Q1), out of which residential housing sales rose by 8.4%. Both office and commercial building sales declined by 12.5% and 10.0% respectively. The prices of residential housing is still rising.
The overall growth rate of sources of funds increased by 7.2% (5.9% in Q1, 6.4% in 2018) and reached 8.70 trillion yuan (3.89 trillion yuan in Q1) in the first half year. Bank loan growth went up by 8.4% (2.5% increase in Q1, 4.9% drop in 2018) to 1.33 trillion yuan, thanks to monetary policy adjustment which has led to increased aggregate financing to the real economy.
With the macro control policy on combatting speculation, future demand for properties will mostly be from real demand for living, not from investment, and China’s real estate market will return to normal. There will be no surprises in the second half of 2019 and probably also in the next few years.
4 China Economic Quarterly Q2 2019

Figure 5: Purchasing Managers’ Index
54.60%53.80%
53.40%
54.40%
53.80%
53.70%
53.70%
54.50%55.10%
54.90%
55.40%55.00%
54.60%
55.00% 54.90%
53.80%
54.80%54.20%
51.50%
50.20%
49.80% 49.70%
50.20% 50.00%50.40%
51.40%51.80%51.70%
52.40%51.60%
51.50%
51.50%
50.80%
49.40%
50.50%
49.40%
46.00%
47.00%
48.00%
49.00%
50.00%
51.00%
52.00%
53.00%
54.00%
55.00%
56.00%
Perc
enta
ge
Non-manufacturing Manufacturing sector 50% breaking point
5PwC
China’s Purchasing Managers’ Index (PMI) for the manufacturing sector in the last three months of the first half year dropped below the threshold again. The PMI was 50.1%, 49.4% and 49.4% for April, May and June (49.5%, 49.2% and 50.5% for January, February and March), respectively.
Relatively weak and fluctuating overall PMIs in the first half year indicates the complicated condition (weak demand from both domestic and international market) of the manufacturing sector.
As mentioned in the previous issue of this report, the PMI might not stabilisewhile the domestic and global economy still face uncertainties and merchandise trade is expected to decline. This situation did not improve in Q2, thus, overall PMI will remain at the current low level in the coming months.
Furthermore, the new export orders index and import index continued to decline to 46.3% and 46.8% in June respectively.
In June, the PMI of large enterprises also dropped below the threshold to 49.9%, or 0.4% less than in May, and is much lower compared to 51.1% in March (50.1% in December 2018).
The PMI of medium enterprises fell just below the threshold at 49.1%, while the small enterprise PMI declined to 48.3% in June.
While it does not happen very often , the PMI of large enterprises declined to below the threshold of 50%.
The production index dropped slightly from 52.8% in March to 51.3% in June which is still above the threshold of 50%. The new order index declined from 51.6% in March to 49.6% in June. This means overall production and market demand has become much weaker than in Q1.
The raw materials inventory index and employed person index were still below the threshold at 48.2% (48.4% in March) and 46.9% (47.6% in March). As can be seen, both indexes declined further compared to March levels.
The non-manufacturing PMI still remained at a much higher level than the manufacturing PMI in Q2, as the business activity index reached 54.2% in June (54.8% in March).
The non-manufacturing PMI of the service sector increased to 53.4%, slightly less than 53.6% in March.
In June, the index of business activity went up to more than 59% in sectors including railway transport, air transportation, telecommunications, radio and television, satellite transmission services, financial services, and insurance.
Meanwhile, in sectors such as road transport, accommodation, resident services, and repair the index of business activity fell to less than 50%.
For the second half of 2019, the progress of trade negotiations will have a big impact, whether or not the manufacturing PMI returns to above 50%. The non-manufacturing PMI of the service sector will certainly remain higher than 50%.
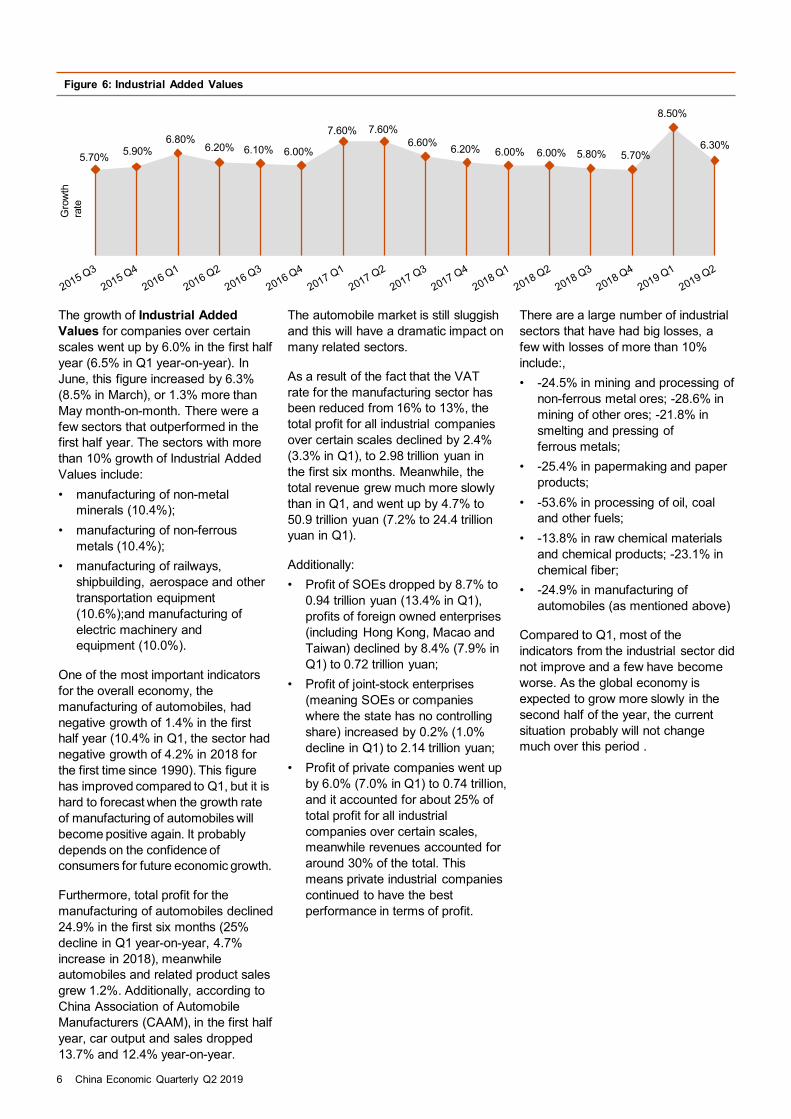
Figure 6: Industrial Added Values
5.70% 5.90%6.80%
6.20% 6.10% 6.00%
7.60% 7.60%6.60% 6.20% 6.00% 6.00% 5.80% 5.70%
8.50%
6.30%
Gro
wth
ra
te
The growth of Industrial Added Values for companies over certain scales went up by 6.0% in the first half year (6.5% in Q1 year-on-year). In June, this figure increased by 6.3% (8.5% in March), or 1.3% more than May month-on-month. There were a few sectors that outperformed in the first half year. The sectors with more than 10% growth of Industrial Added Values include:• manufacturing of non-metal
minerals (10.4%);• manufacturing of non-ferrous
metals (10.4%);• manufacturing of railways,
shipbuilding, aerospace and other transportation equipment (10.6%);and manufacturing of electric machinery and equipment (10.0%).
One of the most important indicators for the overall economy, the manufacturing of automobiles, had negative growth of 1.4% in the first half year (10.4% in Q1, the sector had negative growth of 4.2% in 2018 for the first time since 1990). This figure has improved compared to Q1, but it is hard to forecast when the growth rate of manufacturing of automobiles will become positive again. It probably depends on the confidence of consumers for future economic growth.
Furthermore, total profit for the manufacturing of automobiles declined 24.9% in the first six months (25% decline in Q1 year-on-year, 4.7% increase in 2018), meanwhile automobiles and related product sales grew 1.2%. Additionally, according to China Association of Automobile Manufacturers (CAAM), in the first half year, car output and sales dropped 13.7% and 12.4% year-on-year.
The automobile market is still sluggish and this will have a dramatic impact on many related sectors.
As a result of the fact that the VAT rate for the manufacturing sector has been reduced from 16% to 13%, the total profit for all industrial companies over certain scales declined by 2.4% (3.3% in Q1), to 2.98 trillion yuan in the first six months. Meanwhile, the total revenue grew much more slowly than in Q1, and went up by 4.7% to 50.9 trillion yuan (7.2% to 24.4 trillion yuan in Q1).
Additionally:• Profit of SOEs dropped by 8.7% to
0.94 trillion yuan (13.4% in Q1), profits of foreign owned enterprises (including Hong Kong, Macao and Taiwan) declined by 8.4% (7.9% in Q1) to 0.72 trillion yuan;
• Profit of joint-stock enterprises (meaning SOEs or companies where the state has no controlling share) increased by 0.2% (1.0% decline in Q1) to 2.14 trillion yuan;
• Profit of private companies went up by 6.0% (7.0% in Q1) to 0.74 trillion, and it accounted for about 25% of total profit for all industrial companies over certain scales, meanwhile revenues accounted for around 30% of the total. This means private industrial companies continued to have the best performance in terms of profit.
6 China Economic Quarterly Q2 2019
There are a large number of industrial sectors that have had big losses, a few with losses of more than 10% include:, • -24.5% in mining and processing of
non-ferrous metal ores; -28.6% in mining of other ores; -21.8% in smelting and pressing of ferrous metals;
• -25.4% in papermaking and paper products;
• -53.6% in processing of oil, coal and other fuels;
• -13.8% in raw chemical materials and chemical products; -23.1% in chemical fiber;
• -24.9% in manufacturing of automobiles (as mentioned above)
Compared to Q1, most of the indicators from the industrial sector did not improve and a few have become worse. As the global economy is expected to grow more slowly in the second half of the year, the current situation probably will not change much over this period .

Figure 7: Retail Sales of Consumer Goods
10.50%
10.70%
10.30% 10.30%10.40% 10.40%
10%
10.40% 10.40%10.20%
9.80%
9.40%9.30%
8.98%
8.30%8.40%Ac
cum
ulat
ed g
row
th r
ate
Total retail sales of consumer goods went up by 8.4% in the first six months or 6.7% in real terms (8.3% or 6.9% in real terms in Q1) after deducting the price factor year-on-year, to 19.52 trillion yuan (9,.78 trillion yuan in Q1). In June, it increased by 9.8% year-on-year.
Even though, the growth of retail sales is slightly slower than the same period last year, among all the major economic indicators, it is probably one of the best performers for the first half of 2019. Final consumption expenditure amounted to 60.1% (65.1% in Q1) of total GDP growth in the first six months. Therefore, there is no doubt that consumption is the most the important driver to keep China’s economy growing.
In terms of types of consumption, in the first six months, catering consumption went up 9.4% year-on-year. Meanwhile, goods retail sales went up by 8.3%.
Sales of cosmetics went up by 13.2% (10.9% in Q1) and home appliances grew by 6.7% (7.8% in Q1) year-on-year. Sales of clothing, groceries and foodstuffs (including cooking oil) went up 3.0%, 14.1% and 10.4 (3.3%,16.1% and 10.6% in Q1) respectively in the first half year, mostly due to price hikes.
Despite the fact that total car sales dropped 12.4% as mentioned in the previous section, sales of automobiles and related products went up by 1.2% in the first six months (3.4% decline in Q1, 2.4% drop in 2018) year-on-year. In June, sales of automobiles surged by 17.2% year-on-year, probably because there were lots of promotions from dealers to reduce inventory. In June, 2018 this figure was -7%.
In addition, total online sales reached 4.82 trillion yuan (2.24 trillion yuan in Q1), growing by 17.8% (15.3% in Q1), still slower than the 2018 growth rate of 23.9% year-on-year. Online physical goods sales went up 21.6% (21% in Q1) which accounts for 19.6% (18.2% in Q1 and 18.4% in 2018) of the total retail sales of consumer goods.
In comparison, in the first half year, the per capita disposable nominal income, reached to 15,294 yuan (8,492 yuan in Q1), and has increased by 8.8% (8.7% in Q1) year-on-year, or 6.5% real growth (after adjusting for inflation, 6.8% real growth in Q1). More specifically, it was 21,342 and 4,600 yuan, for urban and rural residents respectively.
On the other hand, per capita consumption expenditure increased by 7.5% (7.3% in Q1, 8.4% in 2018) to 10,330 yuan. During the first half year, the consumption expenditure per capita was as follows (updated for Q2):• 28.6% (30.2% in Q1) for tobacco
and food (including liquor); 23.1% (21.9% in Q1) for housing;
• 13.4% (13.2% in Q1) for transportation and communication;
• 10.0% (9.9% in Q1) for education, culture and entertainment;
• 9.1% (8.4% in Q1) for healthcare and medical services due to price hike, and 7.1% (8.1% in Q1) for clothing.
In the first half year, consumption expenditure per capita on tobacco, food, housing, healthcare and medical services increased more than others.
7PwC
Figure 8: National Per Capita Consumption Expenditure and Proportion (2018Q1-Q4) (Unit: RMB)
Tobacco and Food, 5,631,
28.4%
Clothing, 1289, 6.5%
Housing, 4,647, 23.4%
Supplies and Services, 1223, 6.2%
Transportation and Communication,
2,675, 13.5%
Education, Culture and Entertainment,
2,226, 11.2%
Healthcare and Medical Services,
1,685, 8.5%
Other Supplies and Services,
477, 2.4%

Figure 9: Quarterly Balance of Trade
0.00
200.00
400.00
600.00
800.00
1000.00
1200.00
-25.00%-20.00%-15.00%-10.00%
-5.00%0.00%5.00%
10.00%15.00%20.00%25.00%30.00%35.00%
Net Export( RMB billion) Export Growth Import Growth
Gro
wth
rat
e
(Billion yuan)
789.50 745.40 990.10 706.90 917.80 419.40 767.30 302.40 545.50 519.180.85% -17.12% -13.77% -8.65% 2.13% 31.28% 16.73% 12.20% 19.12% 0.31%
12.66% 4.76% -5.86% -7.82% -0.40% 13.73% 8.43% 7.12% 9.83% 6.70%
532.30 920.30 832.30 1109.40 844.10 883.40 810.90 854.20 570.90 905.70 717.39-0.10% -1.60% -13.78% -8.46% -1.54% 8.39% 20.71% 10.47% 11.19% 9.11% 2.32%3.38% 8.62% -3.15% -1.74% -0.81% 0.22% 14.54% 7.37% 2.64% 8.50% 5.68%
As a result of slower global economic growth and trade, especially due to the ongoing trade disputes between China and the US, China’s imports and exports hardly expanded in the second half year.
Total imports and exports reached 14.67 trillion yuan (7.01 trillion yuan in Q1), increasing by only 3.9% (3.7% in Q1 and 9.9% in 2018) over the same period last year. This was much slower than total GDP growth of 6.3% in the first six months.
Exports went up by 6.1% (6.7% in Q1 and 7.1% in 2018) year-on-year to 7.95 trillion yuan, and imports grew by 1.4% (0.3% in Q1 and 12.9% in 2018) year-on-year to 6.72 trillion yuan.
The trade surplus went up 41.6% (75.2% in Q1) to 1.23 trillion yuan. Meanwhile, the amount of net exports became bigger and contributed 20.7% (22.8% in Q1) to total GDP growth.
As a result of the trade frictions, China’s imports to and exports from the US substantially decreased by 9% (11% decline in Q1 and 5.7% increase in 2018) to 1.75 trillion yuan accounting for 12% (13.7% in 2018) of China’s total trade in the first six months. As in Q1, no US-related export and import data has been released.
A few weeks after the G20 summit in Japan at the end of June between the leaders of China and the US, China started to purchase some American agricultural products. Thus, imports from the US to China might rise in the second half year, but probably not by much, unless the two countries reach a better agreement that meets market expectations.
In addition to decreasing imports to and exports from the US, China’s trade with other major partners was quite stable. For instance, in the first half year, trade with the EU increased by 11.2% (11.5% in Q1 and 7.9% in 2018) and accounted for 15.7% of China’s total trade. Exports and imports with ASEAN went up by 10.5% (8.1% in Q1 and 11.2% in 2018) and accounted for 13.5% of China’s total trade.
Exports and imports with Japan grew slightly by 1.7% to 1.03 trillion yuan (3.2% in Q1) and accounted for 7.0% of China’s trade. According to data from Japan Customs, trade between the two countries increased by 6.8% in 2018 to US$317.53 billion. Therefore, there might be still room for trade with Japan to grow in the second half year
China’s trade with countries under the Belt and Road Initiative accounted for 28.9% in the first half year (27.4% in 2018) and reached to 4.24 trillion yuan.
Total trade with these countries (under the Belt and Road) went up 9.7% (7.8% in Q1 and 13.3% in 2018) or 5.8% more than China’s total trade growth.
More specifically, in the first six months, trade with Russia, Saudi Arabia and Egypt increased by 11.5% (9.8% in Q1 and 24.4% in 2018), 34% (33.8% in Q1 and 23.2% in 2018) and 11% (18.3% in Q1) respectively.
Furthermore, exports and imports from private enterprises went up 11.0% (9.9% in Q1) and accounted for 41.7% (40.6% in Q1 and 39.7% in 2018) of China’s total trade.
Since global economic growth and trade is expected to slow down to a greater degree than previous forecasts, external demand for China’s exports and imports will be weak . Consequently, in the second half year China’s trade will continue slowing.
8 China Economic Quarterly Q2 2019
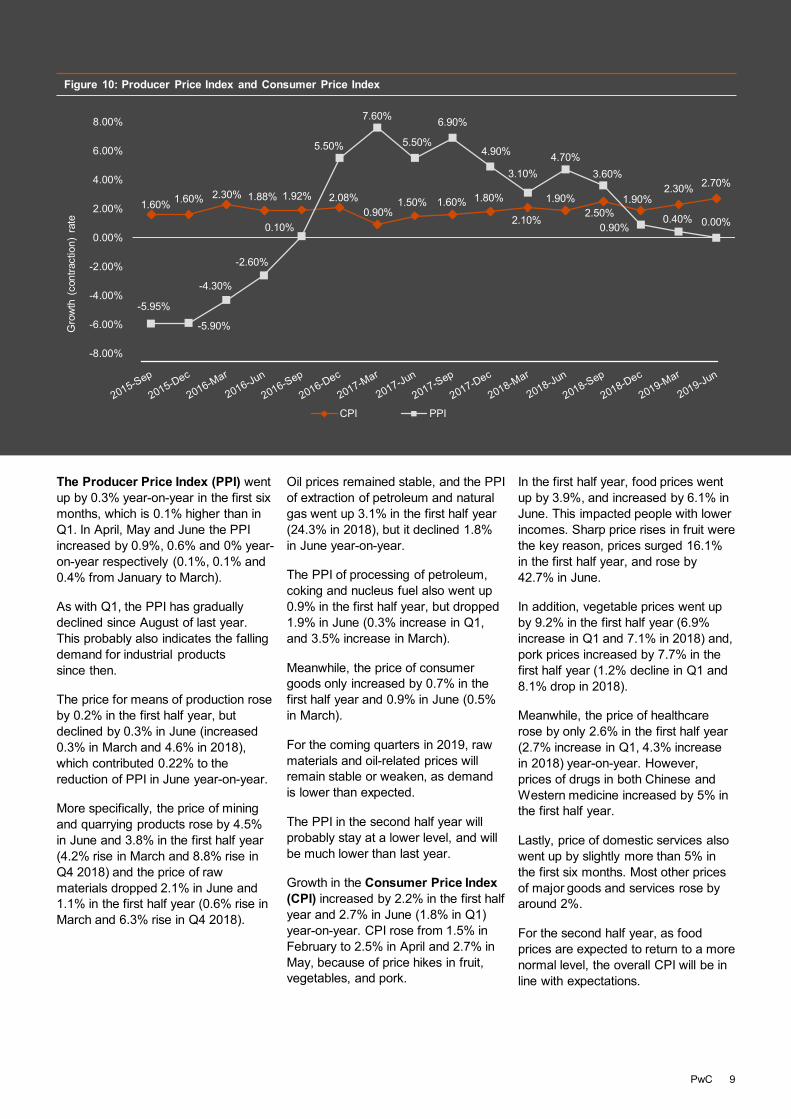
Figure 10: Producer Price Index and Consumer Price Index
1.60% 1.60% 2.30% 1.88% 1.92% 2.08%0.90%
1.50% 1.60% 1.80%
2.10%
1.90%2.50%
1.90%2.30% 2.70%
-5.95%
-5.90%
-4.30%
-2.60%
0.10%
5.50%
7.60%
5.50%
6.90%
4.90%
3.10%4.70%
3.60%
0.90%0.40% 0.00%
-8.00%
-6.00%
-4.00%
-2.00%
0.00%
2.00%
4.00%
6.00%
8.00%
CPI PPI
Gro
wth
(co
ntra
ctio
n) r
ate
The Producer Price Index (PPI) went up by 0.3% year-on-year in the first six months, which is 0.1% higher than in Q1. In April, May and June the PPI increased by 0.9%, 0.6% and 0% year-on-year respectively (0.1%, 0.1% and 0.4% from January to March).
As with Q1, the PPI has gradually declined since August of last year. This probably also indicates the falling demand for industrial products since then.
The price for means of production rose by 0.2% in the first half year, but declined by 0.3% in June (increased 0.3% in March and 4.6% in 2018), which contributed 0.22% to the reduction of PPI in June year-on-year.
More specifically, the price of mining and quarrying products rose by 4.5% in June and 3.8% in the first half year (4.2% rise in March and 8.8% rise in Q4 2018) and the price of raw materials dropped 2.1% in June and 1.1% in the first half year (0.6% rise in March and 6.3% rise in Q4 2018).
Oil prices remained stable, and the PPI of extraction of petroleum and natural gas went up 3.1% in the first half year (24.3% in 2018), but it declined 1.8% in June year-on-year.
The PPI of processing of petroleum, coking and nucleus fuel also went up 0.9% in the first half year, but dropped 1.9% in June (0.3% increase in Q1, and 3.5% increase in March).
Meanwhile, the price of consumer goods only increased by 0.7% in the first half year and 0.9% in June (0.5% in March).
For the coming quarters in 2019, raw materials and oil-related prices will remain stable or weaken, as demand is lower than expected.
The PPI in the second half year will probably stay at a lower level, and will be much lower than last year.
Growth in the Consumer Price Index (CPI) increased by 2.2% in the first half year and 2.7% in June (1.8% in Q1) year-on-year. CPI rose from 1.5% in February to 2.5% in April and 2.7% in May, because of price hikes in fruit, vegetables, and pork.
In the first half year, food prices went up by 3.9%, and increased by 6.1% in June. This impacted people with lower incomes. Sharp price rises in fruit were the key reason, prices surged 16.1% in the first half year, and rose by 42.7% in June.
In addition, vegetable prices went up by 9.2% in the first half year (6.9% increase in Q1 and 7.1% in 2018) and, pork prices increased by 7.7% in the first half year (1.2% decline in Q1 and 8.1% drop in 2018).
Meanwhile, the price of healthcare rose by only 2.6% in the first half year (2.7% increase in Q1, 4.3% increase in 2018) year-on-year. However, prices of drugs in both Chinese and Western medicine increased by 5% in the first half year.
Lastly, price of domestic services also went up by slightly more than 5% in the first six months. Most other prices of major goods and services rose by around 2%.
For the second half year, as food prices are expected to return to a more normal level, the overall CPI will be in line with expectations.
9PwC

-2,500
-1,500
-500
500
1,500
2,500
3,500
4,500
5,500
6,500
7,500
8,500
Q12016
Q22016
Q32016
Q42016
Q12017
Q22017
Q32017
Q42017
Q12018
Q22018
Q32018
Q42018
Q12019
Q22019
Aggregate financing to the real economy RMB loansForeign currency-denominated loans Entrusted loansTrust loans Undiscounted bankers’ acceptances Net financing of corporate bonds Domestic equity financing by non-financial enterprises
Policy UpdatesⅡ
Figure 11: Q1 2016 – Q2 2019 aggregate financing to the real economy (flows), RMB bn
Source: Wind
Aggregate financing continued to grow in the first half year. According to data from the People’s Bank of China, in the first half year, aggregate financing to the real economy (AFRE) was 13.23 trillion yuan or 3.18 more than the same period of last year. AFRE went up by 10.9% year-on-year in the first six months. By the end of June, total AFRE reached 213.26 trillion yuan year-on-year (AFRE was 8.18 trillion, and went up 2.34 trillion yuan year-on-year in Q1).
Among all the items of AFRE in the first half year, RMB loans accounted for about 75.8% (76.9% in Q1) which increased to 9.67 trillion (6.29 trillion in Q1), or 0.64 trillion yuan (1.44 trillion in Q1) more than the same period in 2018. As mentioned earlier, Total AFRE, as well as RMB loans in the first quarter often rise sharply. Thus it makes sense that the increase in RMB loans amount in Q2 is less than Q1.
By the end of June, total RMB loans (accumulated balance) reached 145.97 trillion yuan and went up by 13% year-on-year. Additionally, the balance of corporate bonds was 21.28 trillion yuan and increased by 11.2%. The balance of special debt of local governments went up by 44.7% to 8.45 trillion yuan.
The growth rate of AFRE and RMB loans in the first half year is nearly double GDP growth. Both RMB interest rate and exchange rate were also stable in the first half year.
These factors should be sufficient enough to provide ample financing and liquidity and support economic development.
10 China Economic Quarterly Q2 2019

Source: Wind
Fiscal spending went up by 10.7% in the first half year, or 3.9% more than in 2018
Despite the fact that the general public budget revenue increased by only 3.4% in the first half year (as a result of the policy measures of cutting taxes and fees), China continued to expand fiscal spending to 12.35 trillion yuan (5.86 trillion yuan), which went up by 10.7%. More specifically, it includes 1.69 and 10.66 trillion yuan (0.69 trillion and 5.17 trillion in Q1) for central and local general public budget expenditure respectively.
The growth rate of fiscal spending was 3.9 percentage points higher than the same period in 2018. More specifically, other major expenditure includes:• 1.76 trillion yuan on social security
and employment (6.7% increase in Q2 and 7.6% increase in Q1);
• 1.81 trillion yuan on education (14% increase in Q2 and 14% increase in Q1);
• 1.42 trillion yuan on urban and rural communities (administration, public facilities, planning, environmental sanitation etc.) (13.5% increase in Q2 and 22.8% increase in Q1);
• 1.01 trillion yuan on healthcare and sanitation (8.3% increase in Q2, and 9% increase in Q1);
• 945 billion yuan on agriculture, forestry and water conservancy (13% increase in Q2 and 14.6% increase in Q1);
• 677 billion yuan on transportation (22.3% increase in Q2 and 47.4% increase in Q1);
• Spending on science and technology as well as energy conservation and environmental protection went up by 17.3% (26.5% in Q1) and 19.7% (30.6% in Q1) respectively to 428 billion yuan and 315 billion yuan.
0
100
200
300
400
500
600
700
800
900
1,000
Q12016
Q22016
Q32016
Q42016
Q12017
Q22017
Q32017
Q42017
Q12018
Q22018
Q32018
Q42018
Q12019
Q22019
Education
Social security and employment
Healthcare and sanitation
Urban and rural communities(administration, public facilities, planning,environmental sanitation and etc.)Agriculture, forestry and waterconservancy
Transportation
Figure 12: Q1 2016 - Q1 2019 general public budget expenditure, RMB bn
In addition to increasing fiscal spending, the policy measures of cutting taxes and fees have saved 1.17 trillion yuan for businesses and individuals in the first half year(out of which 1.04 trillion are from tax cuts). China’s general public budget revenue from individual income tax dropped by 30.6%. It means tax payers saved 307.7 billion yuan. This transfer of government revenue to companies and individuals will definitely stimulate the economic growth.
11PwC

What has China achieved in economic development in the last seven decades? Ⅲ
As the popular saying goes, China’s rapid development in the past several decades, especially since 1978 when the domestic economy started to reform and open up, is definitely one of the most phenomenal economic miracles in modern history. But what exactly has China achieved so far?
The National Bureau of Statistics of China recently released a series of reports as part of the 70th anniversary celebration for the People’s Republic of China (PRC). The reports summarised the significant achievements of the country’s economic development in the past 70 years. A slew of data and information from these reports was revealed for the first time.
Below is an analysis of the highlights which matter for business operation. It is critical for the business community to understand and keep in mind some of the facts for business decision making in the future.
1. GDP per capita from US$54 to US$9,732 and went up by 180 times
As one of the most popular indicators for a country’s economic development, GDP per capita in China was 119 yuan (or around US$54 at the then RMB/USD exchange rate of 2.2 ) in 1952. This is the oldest available data from the National Bureau of Statistics, though PRC was established in October of 1949. China was probably one of the poorest countries in the world at that time. Comparatively, GDP per capita in the USA was about US$ 2,349, or 44 times of China’s in 1952.
By the end of 2018, GDP per capita in China rose to US$9,732 surging by 180 times over that of 1952. 2018 GDP per capita in the USA stood at US$ 62,606, which was still 6.4 times more than China’s, but the gap has been significantly narrowed since 1952.
YearGDP (USD billion) Per capita GDP (USD)
China Global China's share of global* China Global China versus global*
1952 31 1,368^ 2.3% 54 451^ 12.0%
1978 218 8,579 1.8%** 229 2,003 11.4%
2018 13,608 85,791 15.9% 9,732 11,297 86.5%
(*: PwC China calculation **: from National Bureau of Statistics :̂ data from 1960 by the World Bank; Source: National Bureau of Statistics, Wind, the World Bank)
12 China Economic Quarterly Q2 2019
Figure:13

China’s total GDP, in 1952 was only 67.9 billion yuan (US$30.9 billion). Then in 1978, China’s total GDP reached 367.9 billion yuan, equivalent to merely 1.8% of the global GDP. After 40 years of reform and opening up, domestic GDP skyrocketed by 175 times over that of 1952 and accounted for about 16% of the world’s total in 2018, while in the same period China’s population has grown to around 19% of world’s total.
Particularly from 1978 to 2018, China’s GDP has maintained an average annual growth of around 9.4% contributing an average of 18% to global economic growth in the last 40 years.
Additionally, China’s population also grew from 575 million in 1952 to nearly 1.4 billion in 2018, an increase of 240% in almost 70 years.
Despite a considerable slowdown of GDP growth to slightly more than 6% in 2019 Q2, China is still on track to become the world’s largest economy by 2030 according to outlook from the IMF. Looking retrospectively at what China has accomplished in the last 70 years especially in the past four decades, one should see signs of strength for China’s long term prospect.
2. From an agricultural country to the world’s factory with 27% of global manufacturing value added
When PRC was established in 1949, China was an agricultural economy with a large part of its population struggling to feed themselves and starvation was a common issue for many Chinese families. In 1952, value add of agriculture accounted for 50.5% of total GDP while 83.5% of the work force were farmers. Both figures fell to 27.7% and 70.5% respectively in 1978, although majority of Chinese still worked in the agricultural sector.
83.5%70.5%
26.1%
7.4%17.3%
27.6%
9.1% 12.2%
46.3%
0%
10%
20%
30%
40%
50%
60%
70%
80%
90%
100%
1952 1978 2018
Primary Industry Secondary Industry Tertiary Industry
Figure 14: Composition of Employed Persons by the three sectors of industry
13PwC
Source: Wind

A significant transformation took place from 1978 to 2018. Agricultural sector’s share of total GDP slid to only 7.2% in 2018, while the tertiary industry or service sector and secondary industry, accounted for 52.2% and 40.7% of total GDP respectively. The proportion of workforce employed in the primary or agriculture, secondary industry (industrial) and service sector was 26.1%, 27.6%, 46.3% respectively. Comparatively, only 1% of total employment in the USA work in the agriculture sector, while the proportion is 3% in the EU.
More specifically, China’s industrial value added increased by 971 times from 12 billion yuan in 1952 to 30.52 trillion yuan in 2018. According to the World Bank, in 2010, China’s industrial value added of manufacturing became the largest in the world, accounting for 27.0% of the global total by the end of 2017.
For instance, in 2018, China’s aggregate outputs of mobile phones, computers, and televisions were about 70% to 90% of the global production. It is also the largest producer of over 100 light industrial products including clocks (watches), bicycles, sewing machines, batteries, beer, furniture and so on.
Evidently, China has successfully transformed itself from an agricultural economy into the world’s largest manufacturer, and in the process created enormous job opportunities for its vast population, particularly from 1978 to 2018. However, there is still a long way to go for China in achieving the developed-country status. More specifically, compared to the USA (80%) and or EU (74%), the share of services in total GDP of China (52%) is still relatively small.
50.5%
27.7%
7.2%
20.8%47.7%
40.7%
28.7% 24.6%
52.2%
0%
10%
20%
30%
40%
50%
60%
70%
80%
90%
100%
1952 1978 2018
Primary Industry Secondary Industry Tertiary Industry
2.70%6.00%
13.20%
27.00%
0.00%
5.00%
10.00%
15.00%
20.00%
25.00%
30.00%
1990 2000 2007 2017
Figure:15 Composition of GDP by the three strata of industry
Figure:16 China's share of global manufacturing
74.00% 80.20%
52.16%
26.00% 18.90%
40.65%
1.60% 0.90% 7.19%
EU USA China
Services Industry Agriculture
14 China Economic Quarterly Q2 2019
Source: National Bureau of Statistics
Source: the World Bank, Ministry of Industry and Information Technology (news)
Figure:17 Sector composition as a percentage of GDP in 2018

3. Urbanisation rate rose from 11% to 60% with potential upside of another 20%
China used to be an agricultural economy with more than 70% of total workforce engaged in agricultural activities until 1978. Since the majority of population resided in rural area, the urbanisation rate only grew slowly from 12.5% in 1952 to 17.9% in 1978. Since then the pace of urbanisation has accelerated and by the end of 2018 reached 59.6% with majority of people now settling in the cities.
0
20,000
40,000
60,000
80,000
100,000
120,000
140,000
160,000
1952 1978 2018
Total population Urban population Rural population
12.5%
17.9% 59.6%
Source: Wind
Figure18: Urbanisation rate in China
According to National Development and Reform Commission (NDRC), each one per cent increase of urbanisation rate corresponds to a migration of 14 million people from rural area to urban area. Because many people who came from rural area and now residing in cities have no hukou (or household registration), urbanisation rate for people with hukoufrom the city they reside was only 43.4% in 2018. Therefore, this year China is lifting some restrictions on its hukou policy in second-tier and third-tier cities to help 100 million migrant workers obtain household registration , so they can more easily access urban social welfares such as education and health care.
Despite substantial increase of urbanisation rate within the last four decades, China still has a huge portion of population with the need to migrate from rural to urban areas, in order to transform into a developed economy similar to the West. Urbanisation rate in the developed countries on average is about 80% and China still has 20% to catch up, while the race to remove such gap would generate enormous business opportunities in the next few decades.
15PwC

4. Momentous development in many other sectors and aspects including business ownership, trade, R&D, education, health care, housing, and etc.
Private companies are becoming much more important for China’s economic development. Contrary to a socialist economy portrayed by the West, China has seen significant decline in state ownership in many sectors, and this trend is expected to continue in the coming years. China had almost no privately owned enterprises before it started to open up and reform in 1978, but today private companies play an irreplaceable role in the China’s economy. More specifically, by the end of 2018, private companies contributed more than 50% of national tax revenue, made up of more than 60% of GDP, fixed asset investment, outbound direct investment and generated more than 80% urban job opportunities.
State owned enterprises (SOEs) still play a leading role in many key and strategic sectors including financial services especially banking and insurance, energy (oil, gas, coal), mining and metallurgy, telecom, railway, aviation, and so on. In many others, however, the involvement of SOEs has diminished dramatically. On the other hand, foreign owned enterprises (including Hong Kong, Macao and Taiwan) also made substantial contribution to China’s economic success. From 1978 to 2018, China attracted a total of US$ 2.03 trillion foreign non-financial direct investment.
China is now the economy with the world’s largest commodity trade and second largest service trade, though trading value was only US$ 1.13 billion in 1950 and US$20.6 billion in 1978 respectively. In 2018, commodity trade further expanded to US$ 4.6 trillion, 223 times higher than that of 1978, meanwhile service trade also surged to US$ 0.79 trillion equivalent to 168-times growth from 1982 to 2018. Although overall global trade is declining, China’s trade with the Belt and Road countries and regions is expected to grow much faster than others in the future. Therefore, China is likely to remain as the world’s largest commodity trading country for a long time, and in the future it is poised to lead global service trade as well.
China’s ratio of research and development (R&D) spending to gross domestic product (GDP) reached 2.18% or 1.97 trillion yuan in 2018 exceeding that of the EU. According to Global Innovation Index 2019 published by World Intellectual Property Organization (WIPO), China’s R&D spending ranked second in the world, and contributed 31% of global R&D spending in 2018. Obviously, this has helped accumulate a large pool of knowledge and technical know-how, necessary for upgrading China’s economic development.
Thus, Chinese companies have a dominating position in R&D spending and contributed 1.35 trillion yuan or 76.5% of the country’s total R&D spending in 2017. On the other hand, illiteracy was as high as 80% when PRC was first established. The situation has much improved over the years and by 2018, gross enrolment ratio of higher education increased to 48.1% in 2018. Talents with higher education provided a strong foundation for sustainable R&D in the future.
16 China Economic Quarterly Q2 2019

The standard of living for Chinese people has dramatically improved, especially in the area of healthcare and housing. Average life expectancy of Chinese citizen was only 35 years when PRC was established, and in 2018 it improved to 77 years. Infant mortality rate dropped from 200‰ to 6.1‰ in the same period. Furthermore, in 2018, China’s average living space per person in urban area reached 39 square meters, and 47.3 square meters in rural area, a significant improvement over 40 years Thanks to the huge investment in real estate development in last few decades and more specifically, from 1987 to 2019, there were 99 trillion yuan invested in property development with an annual growth of 24.8%.
Finally, the past 70 years, especially the last four decades from 1978 to 2018 has proven to be a critical milestone for 1.4 billion Chinese people or about 20% of global population. Today, majority of Chinese people lead a much better life free from worrying for food and shelter.. Some of the middle class families from major cities can afford to own decent apartments and cars, spend their vacation in developed countries, and even send their children abroad to pursue high-quality overseas education. In summary, these are the ultimate economic accomplishment China has achieved, and the economic numbers have spoken for themselves. “Seek truth from facts,” as Deng Xiaoping, the architect behind China's reform and opening-up, once said, a wealth of data and factual evidence have pointed to China’s robust economic development over the years and hinted at the country’s future direction and pattern of growth.
17PwC

AuthorG. Bin ZhaoSenior Economist PwC China+86 (21) 2323 [email protected]
Acknowledgements Special thanks to Thought Leadership and Research teams for their contributions to the report.
This content is for general information purposes only, and should not be used as a substi tute for consultation with professional advisors.
© 2019 PwC. All rights reserved. PwC refers to the PwC network and/or one or more of its member firms, each of which is a separate legal entity. Please see www.pwc.com/structure for further details.
www.pwccn.com/ceq