quarterly digital intelligence briefing - adobe digital intelligence briefing: the quest for mobile...
TRANSCRIPT

in association with
Quarterly Digital Intelligence Briefing
The Quest for Mobile
Excellence

in association with
Quarterly Digital Intelligence BriefingThe Quest for Mobile Excellence
Published April 2015
All rights reserved. No part of this publication may be reproduced or transmitted in any form or by any means, electronic or mechanical, including photocopy, recording or any information storage and retrieval system, without prior permission in writing from the publisher.
Copyright © Econsultancy.com Ltd 2015
Econsultancy London Wells Point 79 Wells Street London W1T 3QN United Kingdom
Telephone: +44 207 269 1450
http://econsultancy.com [email protected]
Econsultancy New York 350 7th Avenue, Suite 307 New York, NY 10001 United States
Telephone: +1 212 971 0630
Econsultancy Singapore 20 Collyer Quay #23-01 Singapore 049319
Telephone: +65 6653 1911

3Quarterly Digital Intelligence Briefing: The Quest for Mobile Excellence In association with
1 Foreword by Adobe . . . . . . . . . . . . . . . . . . . . . . . . . . . . . . . . . . . . . . . . . . . . . . . . . . . . . . . . . . . . . . . . . . . . . . . . . . . . . . . . . . . . . . . . . . . . . 4
2 Companies rise to the mobile challenge . . . . . . . . . . . . . . . . . . . . . . . . . . . . . . . . . . . . . . . . . . . . . . . . . . . . . . 6
3 The desktop bias . . . . . . . . . . . . . . . . . . . . . . . . . . . . . . . . . . . . . . . . . . . . . . . . . . . . . . . . . . . . . . . . . . . . . . . . . . . . . . . . . . . . . . . . . . . . . . . . . 9
4 Investment and experimentation . . . . . . . . . . . . . . . . . . . . . . . . . . . . . . . . . . . . . . . . . . . . . . . . . . . . . . . . . . . . . . . . . . . 14
5 The need for mobile measurement . . . . . . . . . . . . . . . . . . . . . . . . . . . . . . . . . . . . . . . . . . . . . . . . . . . . . . . . . . . . . . 16
6 The rise and rise of mobile apps . . . . . . . . . . . . . . . . . . . . . . . . . . . . . . . . . . . . . . . . . . . . . . . . . . . . . . . . . . . . . . . . . . . 21
7 Measuring, testing and optimising apps . . . . . . . . . . . . . . . . . . . . . . . . . . . . . . . . . . . . . . . . . . . . . . . . . . . . . 29
8 Ownership of mobile in a multichannel world . . . . . . . . . . . . . . . . . . . . . . . . . . . . . . . . . . . . . . . . . . . . 35
10 Appendix–methodologyandrespondentprofiles . . . . . . . . . . . . . . . . . . . . . . . . . . . . . . . . . . 38
Contents
4 Quarterly Digital Intelligence Briefing: The Quest for Mobile Excellence In association with
Foreword by Adobe 1A year is a long time in the world of mobile as smartphones, tablets, and even wearables are becoming more embedded in our lives as consumers.
This research comes 12 months after Econsultancy and Adobe published the Finding the Path to Mobile Maturity report1, giving us a great opportunity to assess the progress that companies have made in the intervening period. This year’s research is based on a global survey of nearly 3,000 marketers and digital professionals, providing another robust data set with which to compare last year’sfindings.
It is clear from the research that there is cause for optimism in terms of the mobile maturity of businesses generally, but also areas in which brands can improve their mobile experiences. Many companies have moved out of the laggard camp and started to take mobile optimisation seriously. Indeed, there is a small but growing proportion of businesses who nowdescribethemselvesas‘mobile-first’,aroundafifth(19%)oforganisationscomparedto13%lastyear.Inmanysectors it is these companies that are most likely to succeed in the customer-driven future.
But it is no surprise that many companies still haven’t been able to formulate an overarching strategy for mobile, when this is something that cuts across so many different business functions. It is clear from this report that too much mobile-related development and marketing activity is occurring in business silos. Lessthanathirdofcompanies(30%)agree their mobile activities are ‘central to the overall business and how they engage with customers’.
Furthermore,only22%ofcompaniesagreetheyhaveacentralisedmobileteam(e.g.acentreofexcellence)whichisresponsiblefordefininganintegratedstrategyforreaching and engaging consumers across mobileexperiences.Andonly13%ofcompany respondents say that every team ordepartmenthassetamobile-specifickeyperformanceindicator(KPI).
Despite research which shows the difficultyofgettingconsumers’attention,mobile apps continue to be an area where companies are putting a lot of focus. Almosthalfofcompanies(49%)saytheyemploymobileapps(upfrom35%lastyear),forarangeofdifferentusecasesincludingcontent(81%ofcompanies),interaction(60%)andgaming(13%).
1 https://econsultancy.com/reports/quarterly-digital-intelligence-briefing-finding-the-path-to-mobile-maturity/

5Quarterly Digital Intelligence Briefing: The Quest for Mobile Excellence In association with
Despite this growth in apps, measurement isstilloftensuperficial.Three-quartersofcompanies(76%)measurenumberofappdownloads but only a minority of companies use a range of other important metrics includingrecurrentusage(48%),timespent(41%),revenue/leadsgenerated(40%)andconversionrate(38%).
We have highlighted apps here because we believe that it is a good example and microcosm for mobile as a whole. More measurement and optimisation are needed to make sure that mobile-related initiatives are performing against business objectives. At Adobe, we are committed to helping companies develop and optimise for mobile across all of our solutions, and we are confidentthatourtechnologycanbethedifference between success and failure in an increasingly customer-centric and mobile world.
We hope you enjoy reading this report; we look forward to having a conversation around thesefindingsinthemonthstocome.
Mark Zablan President, Adobe EMEA

6 Quarterly Digital Intelligence Briefing: The Quest for Mobile Excellence In association with
Companies rise to the mobile challenge 2
While this report will show that there are opportunities for improvement, it isworthreflectingonthegreatstridesthat companies have taken to make the customer experience more mobile-friendly. It can be seen in Figure 1thatsignificantlymore companies than a year ago are optimising for mobile in a range of different ways, including employment of a mobile-optimisedsite(+35%),mobile-friendlyemail(+15%),responsive(+26%)oradaptivedesign(+92%)andmobileapps(+40%).
Compared to a year ago, when we published the Finding the Path to Mobile Maturity Quarterly Digital Intelligence Briefing,itisabundantlyclearthat progress has been made.
Based on this global survey of 2,973 digital professionals, we have evidently passed a tipping point, with the majority of companies actually doing something about the mobile experience, rather than simply thinking it might be a good idea. The reason for this step change is that mobile can no longer be ignored – we are all now facing a deluge of data which points not just to an increase in smartphone and tablet usage, but also to an increasing amount of revenue attributable directly to mobile devices.
Senior business executives, who are just as addicted to their devices as everyone else, are also seeing the reporting which shows that the amount of sales from mobile are no longer negligible. There is also growing evidence of the role of mobile in the overall customerexperienceandasaninfluencerofofflinebuying.
46%
43%
35%
13%
34%
12%
58%
58%
49%
12%
39%
23%
Responsive design
Mobileapplication(s)
Mobile-optimised email
Adaptive design
None of the above
0% 40%20% 60% 80%
Mobile-optimised website
2014 2015
Company respondents
Figure 1: Which of the following have you employed as part of your attempts to optimise for mobile?
Econsultancy / Adobe Quarterly Digital Intelligence Briefing Respondents 2015: 1,412 Respondents 2014: 279

7Quarterly Digital Intelligence Briefing: The Quest for Mobile Excellence In association with
Company respondents Agency respondents
This is all positive news. But it is clear that the increased use of certain mobile tactics or practices is not necessarily born out of an overarching strategy. It can be seen in Figure 2 that only a third of companies (34%)claimtheyhavea‘definedmobilestrategy that goes out at least a year’ and 45%saytheyareworkingonit.Agencyrespondents are more sceptical, saying that from their perspective, it’s only actually afifthofcompanies(exactly20%)whohave a strategy.
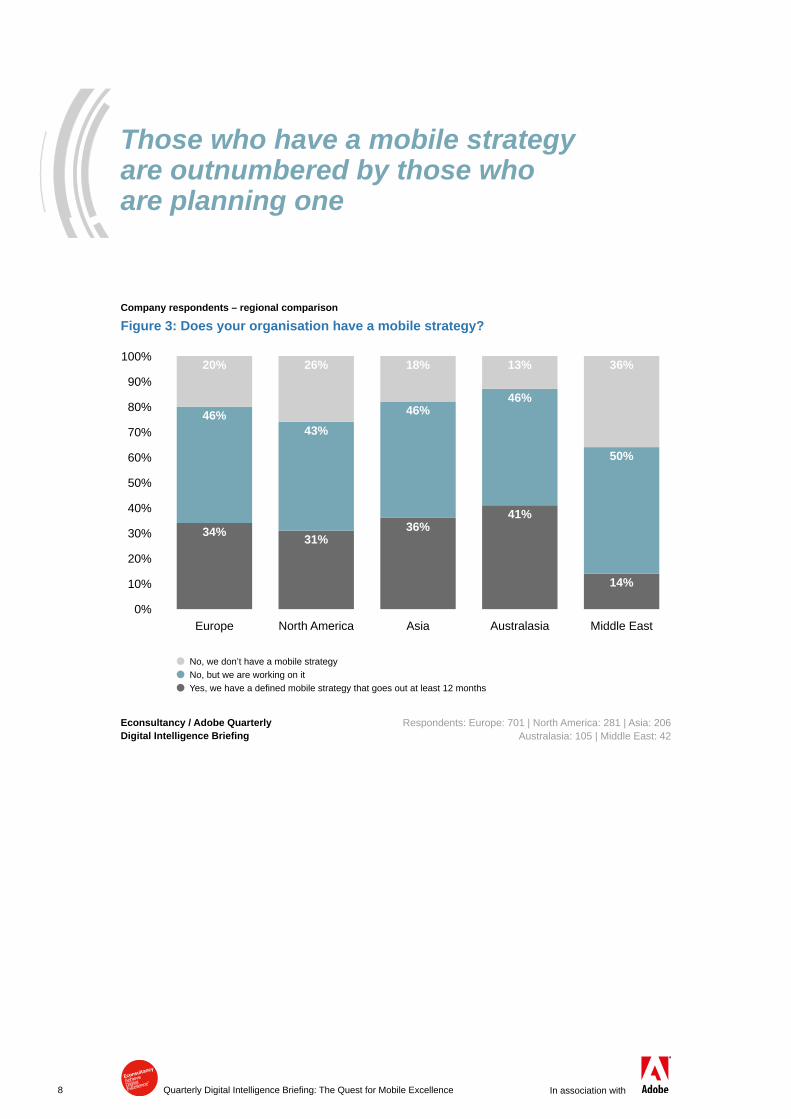
Figure 3 shows some noteworthy regional differences. There is roughly the same likelihood that companies in Europe and Asiahaveamobilestrategy,34%and36%respectively. US organisations are slightly lesslikely(32%)whileforAustralasiancompaniesthisincreasesto41%.MeanwhiletheMiddleEast(13%)hasthefewestorganisations with a mobile strategy, though on the plus side, half of companies there are planning one.
For all regions it can be seen that those who have a mobile strategy are outnumbered by those who are planning one, underlining how relevant this topic is to businesses across a range of sectors.
It is abundantly clear that great strides have
been taken
Figure 2: Does your organisation (or do your clients) have a mobile strategy?
60%
50%
40%
30%
20%
10%
0%Yes, we / they have a definedmobilestrategythat goes out at least 12
months
No, but we / they are working on it
No, we / they don’t have a mobile strategy
34%
45%
21%20%
52%
28%
Econsultancy / Adobe Quarterly Digital Intelligence Briefing Company respondents: 1,402 Agency respondents: 1,115
8 Quarterly Digital Intelligence Briefing: The Quest for Mobile Excellence In association with
Company respondents – regional comparison
Figure 3: Does your organisation have a mobile strategy?
100%
90%
80%
70%
60%
50%
40%
30%
20%
10%
0%Europe
34%
Econsultancy / Adobe Quarterly Digital Intelligence Briefing
Respondents: Europe: 701 | North America: 281 | Asia: 206 Australasia: 105 | Middle East: 42
46%
20%
No, we don’t have a mobile strategy No, but we are working on itYes,wehaveadefinedmobilestrategythatgoesoutatleast12months
Those who have a mobile strategy are outnumbered by those who are planning one
North America
31%
43%
26%
Asia
36%
46%
18%
Australasia
41%
46%
13%
Middle East
14%
50%
36%

9Quarterly Digital Intelligence Briefing: The Quest for Mobile Excellence In association with
The desktop bias 3On average, businesses surveyed for thisresearchreportthat31%oftheirtotaldigitaltrafficisnowviamobile(Figure 4).Additionally, the proportion of those saying thatover40%oftheirdigitaltrafficisviamobilehasincreasedby19%sincelastyear(from26%to31%).Theincreasedengagement with brands via portable devices has cemented its position as one of the most disruptive trends for companies in decades.
Smartphones are within arm’s reach constantly and, importantly, they’re very personal devices. So as a result consumers expect brands to respond to complaints at all times, and communicate to them as individuals. As a result it’s forced marketers to completely re-evaluate how they engage and retain customers.
Companies have also been empowered by technology, in particular responsive and adaptive design. This has enabled them to think beyond replicating traditional desktop experiences, to creating mobile environments that can leveragespecifichandsetfunctionality,not to mention contextual information such as location.
Ecommerce has also matured significantly;digitalteamsaresmarterand more agile when it comes to using data to optimise the user experience. The research also found that, on average,morethanafifth(21%)ofecommerce revenue is transacted directly on mobile devices.

10 Quarterly Digital Intelligence Briefing: The Quest for Mobile Excellence In association with
Companies need to understand the differences in behaviour between smartphone and tablet users, as how consumers engage with a relatively tiny screen on the move will differ hugely from how they interact with a tablet while they’re sitting on the sofa at home.
Figure 5 shows that while smartphones continue to account for the largest proportion ofmobiletraffic(63%onaverage),tabletsarealreadytakingafast-risingshareoftraffic(37%onaverage)andshouldn’tbeignored.
12%
17%
25%
2%
20%
12%
15%
20%
19%
4%
15%
2%
10%
0-10%
21-30%
31-40%
51-60%
61-70%
71-80%
81-90%
91-100%
0% 10% 20%5% 15% 25%
11-20%
2014 2015
Company respondents
Figure 4: How much of your total digital traffic is via mobile devices?
Econsultancy / Adobe Quarterly Digital Intelligence Briefing Respondents 2015: 1,198Respondents 2014: 292
11%13%41-50%
30%
1%
1%
1%

11Quarterly Digital Intelligence Briefing: The Quest for Mobile Excellence In association with
While there’s never been a more creative or exciting time in mobile marketing, it’s a rapidly changing and complex ecosystem. Marketers have to split their time across multiple devices, platforms and app stores. They also have to keep up with consumer expectations, while competing in a crowded marketplace.
Despite the proliferation of channels, the majority of marketers surveyed for this report (71%)rankeddesktopwebsitesastheirfirstchoice for providing a consistent customer experience(Figure 6).
Thisreflectsthefactthatthemajorityofonline purchases are still completed through desktops, with mobile commerce dollars stilllaggingtraffic.IntheUK,IMRGdatarevealedthatmobileaccountsfor40%ofall online retail sales2, while in the US the percentagehasbeenestimatedtobe29%(comparedtoaglobalaverageof34%).3 For some companies, this doesn’t necessarily mean that they aren’t implementing multichannel strategies.
The majority of online purchases are still completed
through desktops
63%
37%
Smartphones Tablets
Company respondents
Figure 5: What is the traffic split between tablets and smartphones?
Econsultancy / Adobe Quarterly Digital Intelligence Briefing Respondents: 444
71% 12% 8%
16% 49% 18%
10%
17% 31%
Desktop website
Smartphone applications
Tablet applications
0% 40% 80%20% 60% 100%
Mobile site
Company respondents
Figure 6: Please rank the following digital channels in importance when it comes to providing a consistent customer experience.
Econsultancy / Adobe Quarterly Digital Intelligence Briefing Respondents: 1,049
First choice Second choice Third choice
20% 38%
2 http://www.imrg.org/index.php?catalog=1769
91%
83%
51%
68%
3%

12 Quarterly Digital Intelligence Briefing: The Quest for Mobile Excellence In association with
Company respondents
Figure 7: ‘We are a mobile-first organisation’
100%
90%
80%
70%
60%
50%
40%
30%
20%
10%
0%2014
Econsultancy / Adobe Quarterly Digital Intelligence Briefing Respondents: 508
11%
25%
Strongly agree Agree Neutral Disagree Strongly disagree
2015
For example, as shown in Figure 1,58%of companies are optimising for mobile viaresponsivedesign(upby26%onthepreviousyear).Furtheranalysisofthedataalsorevealedthatthreeinfiverespondentswhorankeddesktopwebsitesastheirfirstchoice use responsive design.
But consumers are also browsing and researching on mobile, and they’re using handsets as in-store virtual shopping assistants. It’s therefore more important than ever to make the transition between different channels as consistent as possible, in addition to leveraging cross-channel data to optimise the customer journey.
Marketers need to think about where mobile sits in the overall customer journey. It’s not another channel or silo – it’s the linchpin that holds the entire cross-channel marketing experience together.
Companies that continue to look at mobile as just another channel will struggle to differentiate their brand in 2015. Only 19%agreedwiththestatement ‘we are a mobile-first organisation’ although, on a positive note, this represents a six percentage point increase compared to 2014(Figure 7).
By default consumers expect consistent, relevant messaging irrespective of their chosen device. They also have raised expectations about the customer journey, expecting seamless experiences. Being mobile-firstprovidescompanieswitha platform to engage more often and influencepurchasedecisions,ofteninnew and innovative ways.
2%
39%
23%
7%
12%
20%
38%
23%

13Quarterly Digital Intelligence Briefing: The Quest for Mobile Excellence In association with
It also means thinking about who your customers are; how they are using mobile devices, and then integrating your products or services according to the habits and behaviour which are being exhibited.
Despite the importance of mobile as a channel for engaging, connecting and building loyalty, it’s an area that companies are struggling to orientate their business towards,withlessthanathird(29%)agreeing that ‘mobile activities are central to our overall business and central to how we engage with the customers’(Figure 8).
Thisreflectsthechallengethatcompaniesface lifting mobile out of organisational silos, a challenge that has been emphasised during numerous roundtable discussions at recent Econsultancy events around the world, where marketers have for example often mentioned the challenges they face communicating the value of mobile to senior management.
Mobile is often seen by boardrooms as something which is ‘new and trendy’, with senior executives in some cases pushing for the development of a responsive site simply because “everyone else is doing it”. In these cases, work is often outsourced to control costs, or tasked to individual departments which are often under-resourced.
This limits the ability of companies to recognise inputs from different teams and departments, particularly in terms of sharing customer feedback to assist with ongoing development(inadditiontothecreationof ‘surprise and delight’ moments that can improvethecustomerexperience).
By default, consumers expect consistent, relevant messaging
irrespective of their chosen device
23%
23%
32%
16%6%
Strongly agree Agree Neutral Disagree Strongly disagree
Company respondents
Figure 8: ‘Our mobile activities are central to our overall business and how we engage with customers’
Econsultancy / Adobe Quarterly Digital Intelligence Briefing Respondents: 509
14 Quarterly Digital Intelligence Briefing: The Quest for Mobile Excellence In association with
Investment and experimentation 4
In order for organisations to truly maximise the opportunities mobile has created, a greater effort must be made to address its perceived lack of importance behind the desktop in the digital and overall experience. Clearly, companies are still attempting to figureouthowbesttoproceedwiththeirmobile efforts.
With that in mind, it is safe to assume that the changing processes, technologies and people that come with integrating new capabilities into a business are having an effect on budget and spending. While the research does illustrate this, it also points to some interesting trends that are worth exploring.
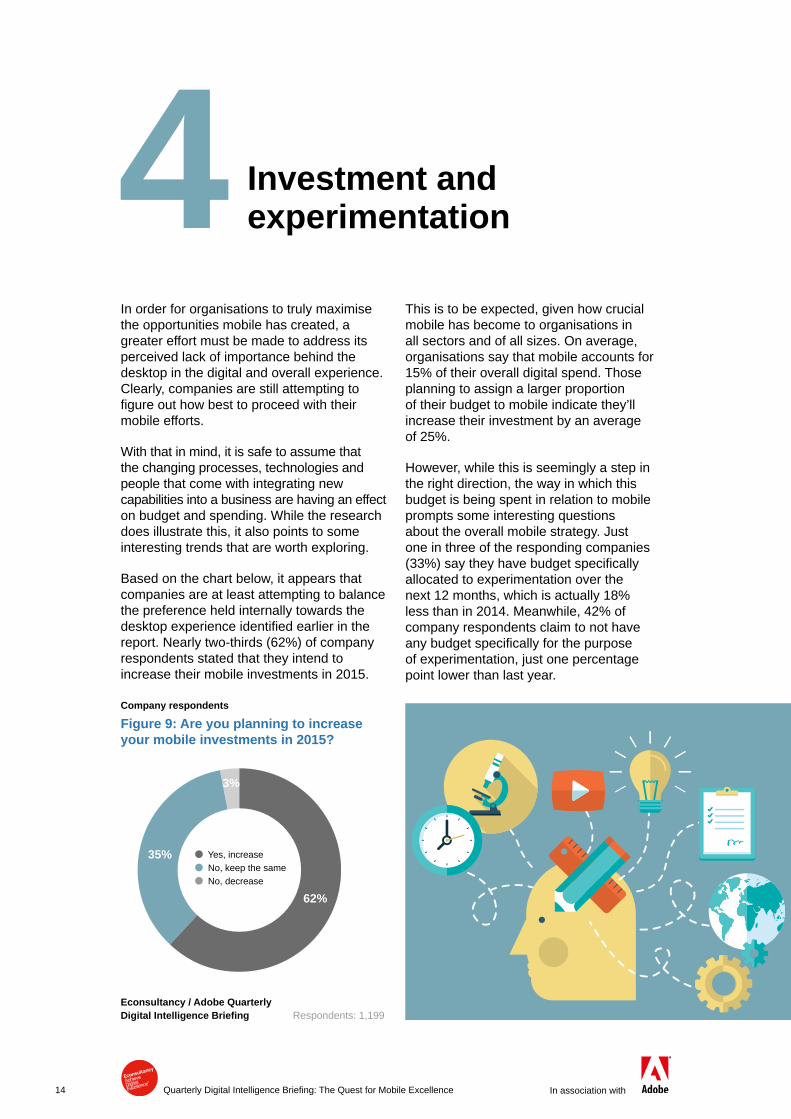
Based on the chart below, it appears that companies are at least attempting to balance the preference held internally towards the desktopexperienceidentifiedearlierinthereport.Nearlytwo-thirds(62%)ofcompanyrespondents stated that they intend to increase their mobile investments in 2015.
This is to be expected, given how crucial mobile has become to organisations in all sectors and of all sizes. On average, organisations say that mobile accounts for 15%oftheiroveralldigitalspend.Thoseplanning to assign a larger proportion of their budget to mobile indicate they’ll increase their investment by an average of25%.
However, while this is seemingly a step in the right direction, the way in which this budget is being spent in relation to mobile prompts some interesting questions about the overall mobile strategy. Just one in three of the responding companies (33%)saytheyhavebudgetspecificallyallocated to experimentation over the next12months,whichisactually18%lessthanin2014.Meanwhile,42%ofcompany respondents claim to not have anybudgetspecificallyforthepurposeof experimentation, just one percentage point lower than last year.
62%
35%
3%
Yes, increase No, keep the same No, decrease
Company respondents
Figure 9: Are you planning to increase your mobile investments in 2015?
Econsultancy / Adobe Quarterly Digital Intelligence Briefing Respondents: 1,199

15Quarterly Digital Intelligence Briefing: The Quest for Mobile Excellence In association with
The reduction of experimentation in this area is a cause for concern. Mobile devices will only continue to grow in importance for consumers as they become more accustomed to using it in intrinsically personal ways. The mobile experience is yet to garner the degree of priority afforded to the desktop, yet in order to provide a cohesive customer experience which is being touted as the key to competitive advantage, the two should be seen as at least equals. However, companies will not be able to reach this stage without trying new techniques in the area of mobile.
Experimentation is a critical hallmark of this current
area of marketing
Company respondents
Figure 10: ‘We have budget specifically allocated to experimenting with mobile over the next 12 months’
100%
90%
80%
70%
60%
50%
40%
30%
20%
10%
0%2014
Econsultancy / Adobe Quarterly Digital Intelligence Briefing Respondents 2015: 505 Respondents 2014: 232
Strongly agree Agree Neutral Disagree Strongly disagree
2015
8%
25%
25%
25%
17%
There is also a broader issue at play here. Experimentation is a critical hallmark of this current area of marketing and organisational development, with most companies attempting to be more customer-centric. Taking into consideration the spending tendencies being exhibited towards mobile, if their efforts are not rife with experimentation, it begs the question: have organisations really committed to improving the mobile experience beyond quick wins? Are they looking at mobile strategically or as yet another tactic?
8%
32%
17%
28%
15%

16 Quarterly Digital Intelligence Briefing: The Quest for Mobile Excellence In association with
The need for mobile measurement 5
There’s no denying that mobile is no longer just ‘the second screen’. The convenience of always being within arm’s reach means that it’softenthefirstchannelconsumerschooseon which to engage with a brand, with many viewing it as one of the most important elements aiding the purchase decision. In retail in particular, a sizeable segment of consumers exclusively access ecommerce websites using mobile devices – according to a 2014 study, more than one third of consumersintheUS,and25%intheUKuse mobile exclusively to make a purchase decision.4Mobileisoftenthefirstportofcallfor consumers, so it’s high time that it was elevated to the place that it deserves in an organisation’s strategy.
Mostcompaniesaredefinitelymovingintheright direction, as the anticipated boost in spending(as seen in the previous section)clearly demonstrates the development of mobile as a key channel and its role in supporting the entire customer journey. But to what extent is reliable, consistent measurement embedded into this process?
Not enough, according to Figure 11, which shows the range of areas involved in mobile-related business activities, not just restricted to marketing. Just over half (51%)ofcompaniessaytheyaremeasuring user engagement and ROI as part of their mobile-related marketing or wider business activities. Measuring engagement is a prerequisite for gauging campaign effectiveness and creating valuable experiences, yet half of those surveyed are not doing this at all. Encouragingly, a similar proportion are undertaking personalisation (51%)andoptimisation(49%),whilearoundtwoinfive(44%)usemobile messaging.
4 xAd / Telmetrics, Mobile Path to Purchase, 2014

17Quarterly Digital Intelligence Briefing: The Quest for Mobile Excellence In association with
51%
51%
49%
22%
20%
14%
44%
27%
47%
52%
40%
24%
26%
18%
42%
28%
Measuring user engagement and ROI
Optimisation(i.e.A/Btesting)
Mobilemessaging(SMS,pushnotifications,responsiveemail)
QR codes
Mobile solutions to assist sales staff (e.g.fieldenablement)
Locationtechnology(GPS,beacons,geo-fencing)
In-store display mobile apps / POS mobile apps
NFC(nearfieldcommunication)
0% 40%20% 60%
Personalisation
Company respondents Agency respondents
Figure 11: Which of the following are part of your / your clients’ mobile-related marketing or wider business activities?
Econsultancy / Adobe Quarterly Digital Intelligence Briefing Company respondents: 1,194Agency respondents: 924
29%27%
Cross-channel tracking / visitor stitching(identifyingsameusers
acrossdesktop/appassingleuser)
8%8%

18 Quarterly Digital Intelligence Briefing: The Quest for Mobile Excellence In association with
Figure 12showsthattwo-thirds(67%)of responding organisations have an understandingofhowmuchtrafficcomesviamobiledevices(combinedpercentagefor‘stronglyagree’and‘agree’)andasimilarproportion(70%)claimtheyknowwhattypesof devices their customers are using. This information is often readily available via web analytics tools and is considered to be part of the ‘basic toolkit’ that any organisation needs to possess in order to delve into more complex measurement.
As many companies are not able to keep trackofbasicmetricslikemobiletrafficandtypes of device used, it’s no surprise that onlyhalforlessareproficientintrackingandunderstanding how their customers move between devices and channels or how their behaviour varies depending on the devices they’re using. The proportion of those who understand these nuances has remained roughlythesame(37%comparedto41%lastyear).Notbeingabletocapitaliseonthe different nuances in behaviours and expectations means that many organisations are prone to failure by providing a one-size-fits-allexperiencetotheircustomers.
31%
27%
11%
8%
7%
36%
43%
40%
27%
30%
20%
16%
29%
28%
31%
10%
10%
16%
24%
24%
Weknowwhatproportionofourtraffic comes via mobile devices
Weunderstandhowmobilefitsintothecustomer journey across devices and channels
We can track our customers across different devices when they choose to authenticate
and log in to the experience
0% 40% 80%20% 60% 100%
We know what types of device our customers are using
Company respondents
Figure 12: Please indicate whether you agree or disagree with the following statements.
Econsultancy / Adobe Quarterly Digital Intelligence Briefing Respondents: 1,028
Strongly agree Agree Neutral Disagree Strongly disagree
We understand the nuances of how our customers use tablets and
smartphones differently
13%
8%
3%
4%
4%

19Quarterly Digital Intelligence Briefing: The Quest for Mobile Excellence In association with
Marketers need to stop and think about the bigger picture: what do
we need to measure and why?
Digitally mature organisations adopt an evidence-based approach, systematically measuring and reporting on a wide range of variables and metrics. Mobile should be no exception, yet these results point to a lack of measurement maturity. But where does it stem from?
●● Guesswork is not a predictor of performance: if you don’t measure it, you can’t improve it
Most of the time, it boils down to viewing mobile as a one-off activity that marketers carry out at some point, thinking that it’s enough to look at their analytics once and use that data to inform their strategies for the next few months or even years.
The mobile landscape is subject to lightning-speed changes, so organisations need to aim to collect informationonmobiletrafficandtypes of devices continuously if they want mobile interactions to have any noticeable impact.
●● You must understand what data you want and why you want it
More often than not, a lack of suitable technology is seen as an easy scapegoat, not only in mobile but digital more broadly. In many cases, the reality is that thetechnologyisreadilyavailable(orcanbecomeavailablequiteeasily),butnotechnology is worth its salt if it’s not used properly. As Matt Asay, VP of Mobile at Adobe, put it: “The technology might be there to measure activities or downloads or whatever accurately, but people don’t necessarily really know what they’re looking for.”5
Rather than leaping blindly into the world of data and choosing metrics which are highly irrelevant to their mobile efforts, marketers need to stop and think about the bigger picture: what do we need to measure and why?
What single thing would most help you address your pain points around mobile optimisation?
“Being able to measure more, faster and more accurately.”
“Better tracking of the importance of mobile in the overall purchase path of our customers. It is being under-represented right now and that does not help getting more investment.”
“Improved functionality to measure ROI and user experience that will result in return customers.”
“The means to effectively measure ROI and attribute conversion to build the case for a more in-depth mobile build-up.”
“Implementing cross-device tracking”
“Cross-devicecustomeridentification/tracking”
“Being able to track cross-device to see to what extent customers are using mobile as part of their buying journey.”
Company respondents
5 http://m.cmo.com/articles/2015/1/26/are_we_there_yet_the.html
20 Quarterly Digital Intelligence Briefing: The Quest for Mobile Excellence In association with
●● Tailor-made mobile campaigns require a lot of ‘knitting’ and ‘stitching’, but these are recurrent pain points for marketers
We’ve all heard it, time and time again: the customer journey is complex and identifying the same users across multiple devices is paramount, but attempts to undertake session stitching and cross-device attribution are few and far between. As seen in Figure 11, less than a third (29%)ofrespondingorganisationsusecross-channel tracking / visitor stitching as part of their mobile marketing efforts.
Further analysis of the results reveals that those who have a mobile strategy are nearly three times more likely to use cross-channel tracking / visitor stitching compared to those who don’t have a strategy(42%comparedto16%).Asexpected, there’s also a strong correlation betweentheproportionofmobiletrafficand the use of visitor stitching: those who saythatatleast10%oftheirtotaldigitaltrafficisviamobiledevicesare78%morelikely to employ this technique than those who say that mobile accounts for less than10%oftheirtotaltraffic.
Visitor stitching is a strong point of contention in many organisations: even if you’re lucky enough to use authentication or other types of commonidentifier,manyargueyou’restill not getting the full picture of a single user.
Thebenefitsofinvestingincross-device tracking are not to be ignored though:overtwo-thirds(67%)ofthoseusing cross-channel tracking/visitor stitching say they understand how mobilefitsintothecustomerjourneyacross devices and channels.
Marketing pundits will often say that mobilemeasurementisinastateofflux.They may be right, especially when taking intoconsiderationthatmanyfinditdifficulttodefinitivelyarguethatthemetricstheyareusingareright(orevenacceptable)for their organisations. But uncertainty is in the eye of the beholder – get to properly know your business and your customers’ behaviour on mobile and all that uncertainty will start to subside.
In your experience, what are the most common mistakes clients make when embarking on a mobile program?
“They don’t know how to measure ROI.”
“Not measuring the end results”
“Failure to set KPIs for measurement and ability to track measurement through analytics.”
“Lack of clear business objective and measurement”
“Not planning measurement, heatmaps or A/B testing early enough in the development backlog.”
“Goinginblindly,withoutidentifyingspecificneedsormetricsfordefiningsuccess. I liken it to the late 90s when folks said ‘I need a website’ but couldn’t identify why or what it would be worth to them.”
Agency respondents
21Quarterly Digital Intelligence Briefing: The Quest for Mobile Excellence In association with
The rise and rise of mobile apps 6
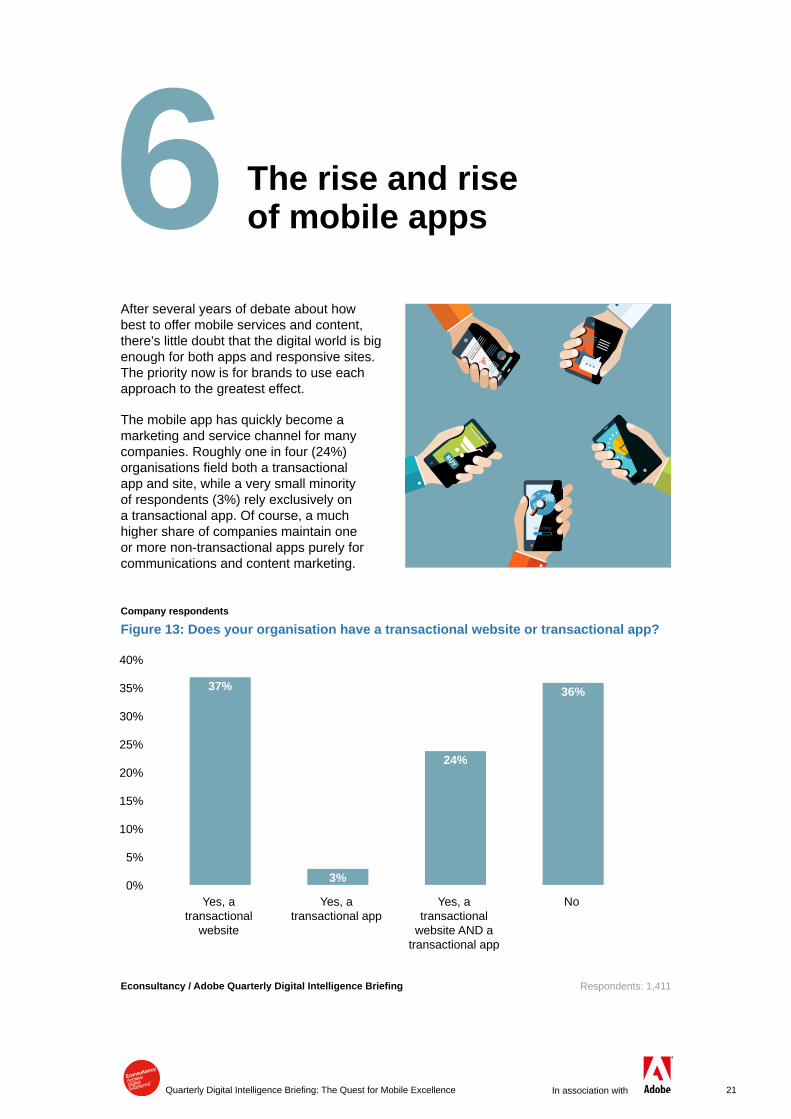
After several years of debate about how best to offer mobile services and content, there’s little doubt that the digital world is big enough for both apps and responsive sites. The priority now is for brands to use each approach to the greatest effect.
The mobile app has quickly become a marketing and service channel for many companies.Roughlyoneinfour(24%)organisationsfieldbothatransactionalapp and site, while a very small minority ofrespondents(3%)relyexclusivelyona transactional app. Of course, a much higher share of companies maintain one or more non-transactional apps purely for communications and content marketing.
Company respondents
Figure 13: Does your organisation have a transactional website or transactional app?
40%
35%
30%
25%
20%
15%
10%
5%
0%Yes, a
transactional website
Yes, a transactional app
Yes, a transactional
website AND a transactional app
No
37%
3%
24%
36%
Econsultancy / Adobe Quarterly Digital Intelligence Briefing Respondents: 1,411

22 Quarterly Digital Intelligence Briefing: The Quest for Mobile Excellence In association with
As shown in Table 1, retailers are most likely to say they use transactional websites only (58%),whilearoundathird(31%)havebotha transactional website and a transactional app.Companiesinthefinancialservices(47%)andtravel&leisure(42%)sectorsare most likely to use both websites and apps for transactional purposes – this is not surprising taking into consideration the consumer demand for these capabilities in the two sectors.
Across the board, exclusive use of transactionalappsisveryrare,withonly5%or less of those surveyed saying they only rely on an app for transactional purposes.
The questions for the strategist are no longer about the long-term viability of apps, but about their distinct role in the customer journey and the challenges of standing out in a growing crowd.
Transactional website
Transactional app
Transactional website AND transactional
app
None
Charities,GovernmentandNonProfit
46% 2% 14% 38%
ConsumerGoods 48% 3% 18% 31%
Financial Services 30% 2% 47% 20%
Healthcare and Pharma 31% 3% 15% 51%
Manufacturing 43% 5% 11% 42%
Media 26% 4% 25% 45%
Professional Services 31% 4% 3% 61%
Retail 58% 1% 31% 11%
TMT(technology,mediaandtelecoms)
33% 4% 15% 48%
Travel&Leisure 37% 1% 42% 20%
Note: We haven’t included data for the automotive, gaming & gambling, and telecom sectors in this analysis due to small sample sizes.
Company respondents – sector comparison
Table 1: Use of transactional websites and transactional apps by sector

23Quarterly Digital Intelligence Briefing: The Quest for Mobile Excellence In association with
6 Fast Company, 2015
For many brands the approach has been to duplicate the most popular functions of their existing websites, featuring retailers’ top products, tracking loyalty status or offering mobile-friendly versions of successful content.Increasingly,companiesnowfindthat they must expand beyond this basic level of functionality.
The Starbucks app is a good example; its evolution has mirrored advances in the larger app ecosystem, and helped drive them. Once simply a loyalty app, it is now a majorchannel.Over16%ofallStarbucks’US revenue is now taken in directly from the app.6 It has become an integral part of the offlineexperiencewiththeabilitytoorderand pay before arriving in a store. The app addresses the key issue of store wait times for customers, increases productivity and adds to marketers’ data about customers and their journeys.
Inspired by successes like this, we see in Figure 14 that marketers are increasingly creating experiences that are unique to thesmallscreen.Aroundtwo-thirds(64%)describe the experiences as ‘completely different’.
Because of the unique way in which apps aredistributed,manymarketers(44%)citedifficultyinstandingout.
The app stores are highly competitive walled gardens. The rules that govern app acceptance can seem arbitrary, as is the methodology for promotion. Many brands have found that it is much easier to market apps through complementary earned, owned and paid media than to rely heavily on promotion within the app store. This is especially true for the launch of a new app.
23%
15%
9%
41%
29%
27%
18%
42%
44%
15%
10%
17%
Mobile app and desktop experiences are completely different
Time spent per session is higher for mobile apps than for the mobile web
0% 40% 80%20% 60% 100%
Achieving stand-out in app stores is a huge challenge for us
Company respondents
Figure 14: In the context of your own organisation, please indicate whether you agree or disagree with the following statements.
Econsultancy / Adobe Quarterly Digital Intelligence Briefing Respondents: 1,053
Strongly agree Agree Neutral Disagree Strongly disagree
3%
4%
3%
Companies now find that they must expand beyond this
basic level of functionality

24 Quarterly Digital Intelligence Briefing: The Quest for Mobile Excellence In association with
But even after overcoming the initial hurdle and having their app downloaded, marketers are faced with an equally sizeable challenge; how to encourage ongoing use. Studies suggest that while consumers have dozens of apps installed on their devices, only a tiny fraction of them are used regularly. For this reason brands need to be strategic rather than reactive in their app design and distribution.
Some of the questions that might be considered when exploring how unique mobile characteristics can enhance the customer experience include the following:
1. How can this app add value to our customers’ lives?
Ifanapplication(oranymarketingplatform)servesausefulpurposeinsomeone’s life, it stands a much better chance of repeat use. Save them time, save them money, make them more informed or entertained… and your app may become a regular part of their lives.
2. How can we use data to personalise the app experience for different audiences in different situations?
Personalisation is important on the desktop, but it’s a key differentiator in mobile. With limited time and space, apps should increasingly use context to assist in delivering the most relevant information and prioritised services. For example, sports fans will want their news and scores personalised by their favourite teams. In addition, shoppers will want to receive personalised recommendations in their app versus a generic list of items on sale.
It’s all about doing as much work as we can for the customer
3. Can location and time add relevance for users of the app?
We’re only beginning to realise the possibilities that time and location add to our knowledge of how to serve the customer. In many circumstances, location is a more powerful variable in the customer journey than any other. Marketers who use location data to determine user proximity to a point of interest, venue or store can deliver highly relevant messages and experiences to consumers.
4. How can we use our customer data to improve the app experience and fulfil the customer’s desires?
It’s all about doing as much work as we can for the customer… they should never begivenanunnecessaryfieldtofillin,or a set of products they don’t want. Apps that access data about consumer preferences, favourites or products for a wishlist can deliver a more relevant and delightful experience. In addition, since the customer journey will span multiple channels, the ability to create preferences in one place that are accessible across desktop, mobile web and app experiences is an important requirement for success.
5. How can we package our data and offer it back to customers in a way that is unique and valuable?
As companies increasingly look to their data to add insight and value to the customer experience, they move into a position to offer the data itself back to customers. Credit card companies have offered year-end statements for years that show consumers how they spend, when they spend and where they might change their habits. Every data-driven marketing organisation has a similar opportunity to inform and educate the customer.
25Quarterly Digital Intelligence Briefing: The Quest for Mobile Excellence In association with
In your experience, what are the most common mistakes clients make when embarking on a mobile program?
“Developing an app without understanding if it will generate ROI compared to the responsive website.”
“No strategy, as well as understanding of sales funnel and where mobile can help drive sales. In addition, getting push from senior management to just build an app without considerations of other mobile strategies.”
“Notunderstandingthedifferencesandefficacyofmobile-designedsitesversusmobileapps – and which is most likely to resonate with end consumers given the rest of their digital portfolio of offerings.”
“The ‘I want an app’ demand, rather than looking properly at their consumers, their objectives etc. and then working out what they should be doing.”
“Thinking that an app constitutes a mobile strategy in and of itself.”
“Very little testing post launch. Some apps have very poor consumer feedback, so the teams who launched them simply move on to something new.”
Agency respondents
As we see in Figure 15 overleaf, most apps serve a combination of purposes already but the emphasis is still largely on content. For most non-publishers thinking about the utility, value and functionality of apps, content should be complementary rather than the central function.
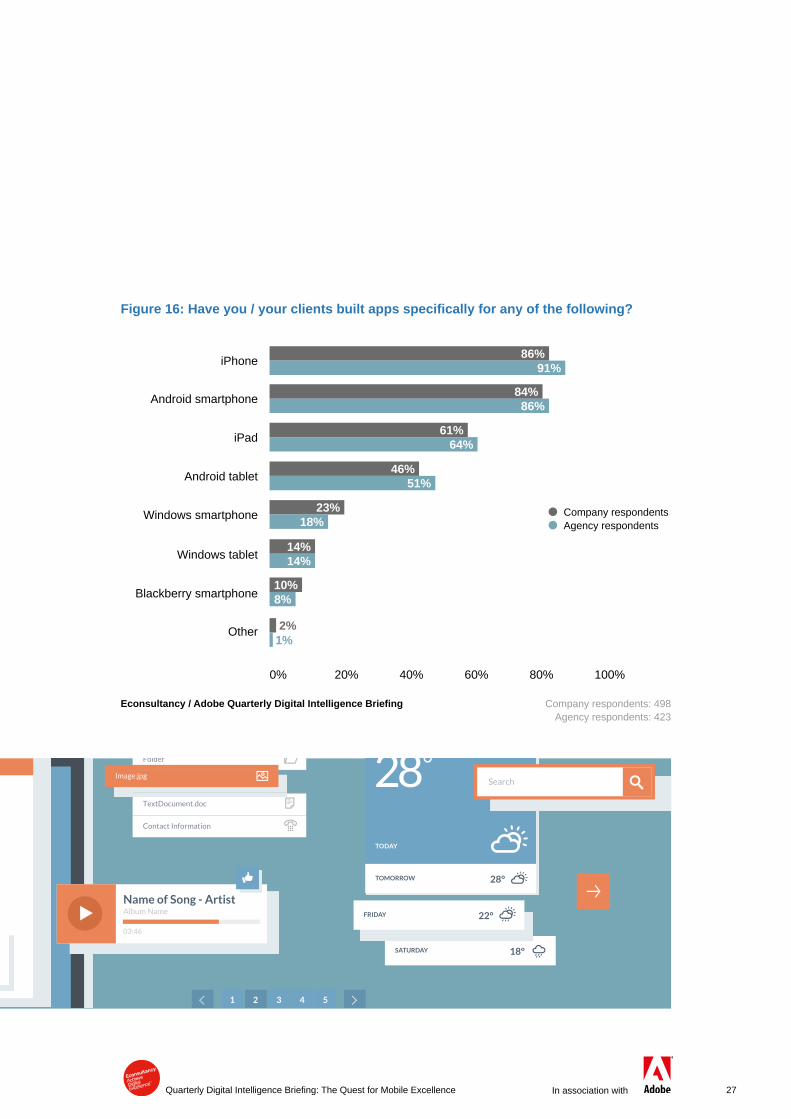
As seen in Figure 16, the most popular device for which apps have been developed istheiPhone,withthevastmajority(86%)of companies catering for this device. The proportion building apps for Android smartphonesisslightlylower(84%),followedbyiPad(61%ofcompanies)andAndroidtablets(46%).
In terms of types of app, native apps prove to be most popular, with seven in ten companies(71%)sayingtheyusethem(Figure 17),whilehybridandcross-platformappsseeadoptionlevelsof41%and32%respectively.

26 Quarterly Digital Intelligence Briefing: The Quest for Mobile Excellence In association with
Company respondents Agency respondents
Figure 15: For which of the following use cases do you or your clients have a mobile app or apps?
90%
80%
70%
60%
50%
40%
30%
20%
10%
0%Content Interaction Gaming Other
81%
60%
13% 11%
81%
69%
15%8%
Econsultancy / Adobe Quarterly Digital Intelligence Briefing Company respondents: 527 Agency respondents: 441
Content should be complementary rather than the central function
27Quarterly Digital Intelligence Briefing: The Quest for Mobile Excellence In association with
86%
84%
61%
10%
46%
14%
91%
86%
64%
8%
51%
14%
iPhone
iPad
Android tablet
Windows tablet
Blackberry smartphone
Other
0% 40% 80%20% 60% 100%
Android smartphone
Company respondents Agency respondents
Figure 16: Have you / your clients built apps specifically for any of the following?
Econsultancy / Adobe Quarterly Digital Intelligence Briefing Company respondents: 498 Agency respondents: 423
23%18%Windows smartphone
2%1%

28 Quarterly Digital Intelligence Briefing: The Quest for Mobile Excellence In association with
Native apps prove to be most popular, with seven in ten companies saying they use them
Company respondents Agency respondents
Figure 17: Which types of apps have you or your clients developed?
80%
70%
60%
50%
40%
30%
20%
10%
0%Native
(builtusingplatformvendorSDKs, including apps with a mixofnativeandwebviews)
Hybrid (builtusingweb
technologies and a nativewrapper)
Cross-platform (builtusingthird-party
SDKs and cross-compiledtonative)
71%
41%
32%
61%
49%
40%
Econsultancy / Adobe Quarterly Digital Intelligence Briefing Company respondents: 504 Agency respondents: 433

29Quarterly Digital Intelligence Briefing: The Quest for Mobile Excellence In association with
Measuring, testing and optimising apps 7
Intherushtofieldamobilepresence,manycompanies have ignored a measurement strategy, leading to an incomplete understanding of what is happening within the apps and because of them.
Unfortunately, systems and processes tend to take root once they are in place, even if they areinsufficient.Astheimpactofmobilerisesacross all sectors, it’s important that brands retrench and approach their apps with the same rigor in measurement and benchmarking that is standard for the desktop web.
Today, the success with apps is often measured with a blunt instrument. Three-quartersofcompanies(76%)lookat total downloads but less than half use more nuanced, and probably more important, metrics.

30 Quarterly Digital Intelligence Briefing: The Quest for Mobile Excellence In association with
76%
48%
41%
40%
22%
16%
7%
Number of downloads
Time spent
Revenue / leads generated
Custommetrics(e.g.socialshares)
Externalmetrics(e.g.reducedcostincustomerserviceduetofewerphonecalls)
None of the above
0% 20% 60%40% 80%
Recurrent usage
Company respondents
Figure 18: What metrics do you use for measuring the success of mobile applications?
Econsultancy / Adobe Quarterly Digital Intelligence Briefing Respondents: 526
38%Conversion rate
●● A simple but vital measure of the potential of an app is recurrent usage. The vast majority of apps are usedinfrequently(ifmorethanonce).Looking at recurrent usage helps to both determine the value of the relationship and uncover patterns of behaviour that caninspirefurtherrefinement.
●● Time spent is an essential measure of engagement and a valid metric to benchmark. It suggests the degree of usefulness the app offers to users and is another where pattern recognition can be illuminating.
●● It’s not always easy, but there’s no metric like revenue from the app. For example, apps that provide direct monetisation via commerce, in-app payments or ad-based sponsorships should always report revenue. However, apps that are used for customer service or loyalty should also measure activities that lead to cost savingssuchascallcentredeflection.
In addition, apps that are used by consumers to research a product that is eventually purchased in a physical store should consider analysis to quantify the influenceofmobileondrivingofflineconversions.

31Quarterly Digital Intelligence Briefing: The Quest for Mobile Excellence In association with
●● Finally, there’s a case to be made for custom metrics such as how many times content is shared via social networks. If your business has a social strategy, the mobile experience can be used to amplify your brand and drive awareness via the customer’s social network. Since each business has unique requirements, you should identify metrics that are most important to your business across functions including marketing, sales, customer service and product development.
Another result of the initial push to get apps on the market is that today we see a distinct advantage for those organisations that approach apps with a long-term development mindset.
Roughly40%ofsurveyrespondentsupdatetheirappsatleastmonthly,withonly15%doing so weekly or daily. This is in sharp contrast to the same brands’ approach to their desktop sites, where development is ongoing. Mobile revenue numbers might seem to justify this, but the larger growth in mobiletrafficandinfluencesuggeststhatthisis the moment to invest, not wait.
4%
11%
24%
42%
10%
4%
8%
20%
3%
41%
16%
Daily
Monthly
Every few months
Hardly ever
Never
0% 20% 40%10% 30% 50%
Weekly
Company respondents Agency respondents
Figure 19: How frequently do you / your clients update your / their app or apps?
Econsultancy / Adobe Quarterly Digital Intelligence Briefing Respondents 2015: 516Respondents 2014: 425
7%8%Annually
If your business has a social strategy, the mobile experience can
be used to amplify your brand
2%

32 Quarterly Digital Intelligence Briefing: The Quest for Mobile Excellence In association with
Figure 20 speaks to the evolution and ongoing potential for apps as a tool for marketing and just as importantly for customer service.
Most respondents already recognise that users are their most valuable source of information.Twointhree(66%)organisationswithappsinthefieldtakeadvantageofuserfeedback when making updates. However, that feedback may well be collected from app store comments and ratings, user forums etc. rather than direct user inquiries.
Both types of feedback are important. Comments in user forums and the app store will call out central issues to be addressed, but are not usually the source of inspiration and insight into creating greater value. For that kind of interaction with users, focus groups and usability tests can be more effective.
Once new features are ready to be implemented they should be tested, but we seeonlyaboutathird(35%)ofrespondentsconducting A/B and other types of tests on features and usability.
Without testing to determine effectiveness and improve on the experience companies are investing blindly. A new feature may be a poor implementation of a good idea or good implementation of the bad one. Without testing it’s impossible to tell. Surprisingly an almost equal share of respondents(33%)areexploringsomeof the more advanced functions that can be integrated such as location, timing and behaviour. These are all powerful ways in which an app can be customised in the moment, and therefore more valuable to the user.
64%
59%
32%
36%
66%
54%
35%
33%
We regularly update apps based on user feedback
We have conducted A/B testing on mobile app features, usability, etc.
We are using/exploring advanced functions such as geo-location, timed actions
and behavioural triggers in our mobile applications
0% 40% 80%20% 60%
We regularly update apps based on user behaviour/data
2014 2015
Company respondents
Figure 20: Which of the following apply to your testing and optimisation on mobile applications?
Econsultancy / Adobe Quarterly Digital Intelligence Briefing Respondents 2015: 429Respondents 2014: 66

33Quarterly Digital Intelligence Briefing: The Quest for Mobile Excellence In association with
The future of customer experience is personal and personalised. No tool in our modern history approaches the depth and breadth of the smartphone’s role in everyday life.
App strategies must include the same priority for personalisation and ongoing optimisation that are common to the desktop and mobile web, but organisations can go beyond that, as mobile apps offer more unique opportunities to personalise based on data not available to desktop and mobile web. As we see in Figure 21, there is a long way to go.
Onlyaminorityofrespondents(25%)feellike they can optimise their apps to the same degree or with the ease that they do their websites. This capability should be carefully evaluated, because personalisation is the path to usefulness on a mobile device. This is particularly critical on mobile as there is less time, incentive or inclination to wade through generic content to get to personalised experiences, and the expectation is for a deeper and more personalised experience.
With limited space and less time, consumers want their apps to do some of the thinking for them, determining function and content by context. Apps that accomplish this will have a much higher chance of being in that small group that is used often and highly valued.
The tag cloud on the next page, with the size of words indicating the frequency of mentions, highlights the most common issues preventing companies from updating their apps. Lack of internal development resources, technology shortcomings, delays caused by app store approval processes and reliance on third parties were most commonly cited by survey respondents.
With limited space and less time, consumers want their apps to do
some of the thinking for them
12%
9%
7%
31%
23%
30%
25%
49%
35%
28%
14%
22%
Businessobjectivesarethesameforapp(s)andmobile-optimisedsite(s)
We can measure success and ROI of mobile apps as well as we can for our website
0% 40% 80%20% 60% 100%
Conversion rates are higher for mobile apps than for the mobile web
Company respondents
Figure 21: In the context of your own organisation, please indicate whether you agree or disagree with the following statements.
Econsultancy / Adobe Quarterly Digital Intelligence Briefing Respondents: 1,052
Strongly agree Agree Neutral Disagree Strongly disagree
5%
5%
6%
5% 20% 35% 29%We can optimise our mobile apps easily as we can optimise our website 11%

34 Quarterly Digital Intelligence Briefing: The Quest for Mobile Excellence In association with
What are the main barriers to updating your app or apps?
“Compliance, tracking, general usage of analytics, tech delays, third-party agencies, lackofmobileknowledgeacrossbusiness(peoplejustwanttoduplicatewebsite).”
“Delaysindevelopmentandverylittlemanpower(wearenotabigcompanyandcan’tdedicatealotofresources).”
“The app is externally coded, so all changes have to be coordinated with a third-party company.”
“Matrix management of content stakeholders, dependency on vendor developments (newfeatures),nodedicatedmobiledevelopmentteam,noinstitutionalstrategy, low priority.”
“Pushing out updates and keeping the underlying cloud technology compliant to multipleversionsoftheappsinfield.”
“Reliance on third parties – our app is a product from an external vendor and we are reliant upon their product roadmap for our updates.”
“Third-party development delays, internal resource constraints, internal resource knowledge depth.”
“Werelyonourplatformprovidertodoeverythingandcannotinfluencetimelines or output.”
Company respondents
Company respondents
Figure 22: What are the main barriers to updating your app or apps?

35Quarterly Digital Intelligence Briefing: The Quest for Mobile Excellence In association with
Ownership of mobile in a multichannel world 8
In the fast-moving digital environment, ownership of emerging and growing channelsanddevicescanbeasignificantstumbling block in the implementation of associated strategies and processes. Often there are invested individuals from product, marketing, customer experience, tech and elsewhere who all have a voice to be heard.
Figure 11 showed that optimisation is part ofthemobile-relatedactivitiesof49%of companies, and respondents were subsequently asked who was directly responsible for mobile optimisation. Marketing was selected by just under half (49%)ofrespondentsthisyear,comparedto58%lastyear(Figure 23).
Thisdecreasereflectsthefactthatoptimisation can become the concern of development / IT teams when a company’s capabilities and tools are less advanced, with development / IT and ecommerce teams now also selected by fairly large proportions ofcompanyrespondents(39%and29%respectively).Interestingly,9%ofcompaniessaid that no-one was responsible for mobile optimisation at their organisation, up from 4%lastyear.Itispossiblethattheoptionwas selected by those with a collaborative approach where no single team is solely responsible for optimisation, but primary ownership should, if best practice is followed, sit with marketing, and there is evidently development of capabilities required to ensure this is the case.
58%
39%
29%
15%
49%
34%
17%
16%
Marketing
Ecommerce team
Mobile team
0% 40% 80%20% 60%
Development team / IT
2014 2015
Company respondents
Figure 23: Who is directly responsible for mobile optimisation within your organisation?
Econsultancy / Adobe Quarterly Digital Intelligence Briefing Respondents 2015: 949 Respondents 2014: 225
16%15%Product team
12%12%CEO / senior management
4%5%Other
4%9%No-one

36 Quarterly Digital Intelligence Briefing: The Quest for Mobile Excellence In association with
An organisation-wide approach to mobile activities has been mooted as best practice by experts in digital transformation.7 Figure 24showsthat13%ofrespondentshavethis collaborative approach within their organisations, agreeing that ‘every team or department has a mobile-specific KPI to measure its effectiveness in achieving the company’s mobile strategy’.
Having a mobile ‘centre of excellence’ is often a feature of more digitally-advanced companies and, encouragingly, more than a fifth(22%)ofrespondingcompaniesagreethat they have a centralised mobile team. Reflectingtheimpactthatmobilehashadon marketers generally, almost a third of respondents agreed that mobile activities are central to their overall business and how they engage with customers8.
6%
5%
23%
17%
11%
23%
16%
20%
32%
36%
39%
Our mobile activities are central to our overall business and how we engage with customers
Everyteamordepartmenthasamobile-specificKPItomeasureits effectiveness in achieving the company’s mobile strategy
0% 40% 80%20% 60% 100%
Wehaveacentralisedmobileteam(e.g.centreofexcellence)thatisresponsiblefordefininganintegratedstrategyfor
reaching and engaging consumers across mobile experiences
Company respondents
Figure 24: Thinking about your organisation, please indicate whether you agree or disagree with the following statements.
Econsultancy / Adobe Quarterly Digital Intelligence Briefing Respondents: 509
Strongly agree Agree Neutral Disagree Strongly disagree
16%
26%
28%
What single thing would most help you address your pain points around mobile optimisation?
“Aspecificownerofthemobileexperienceandauthoritytobeadecisionmaker.”
“Beingabletoownandbuildourownmobileexperiences–zeroinfluenceonthem.”
“Mobile knowledge, as mobile is horizontal across company – everyone owns a small share but don’t have the knowledge to exploit it.”
“Single responsible team.”
“Setting up internal development team for mobile.”
“A dedicated team working towards it.”
“Building the right teams to manage the implementation and integration to other parts of the organisation.”
Company respondents
7 https://econsultancy.com/reports/digital-marketing-organisational-structures-and-resourcing-best-practice-guide 8 Note that the survey title mentioned mobile, therefore respondents are more likely to be interested in mobile and see it as an important channel.
2%
Almost a third of respondents agreed that mobile activities are central to their overall business

37Quarterly Digital Intelligence Briefing: The Quest for Mobile Excellence In association with
38 Quarterly Digital Intelligence Briefing: The Quest for Mobile Excellence In association with
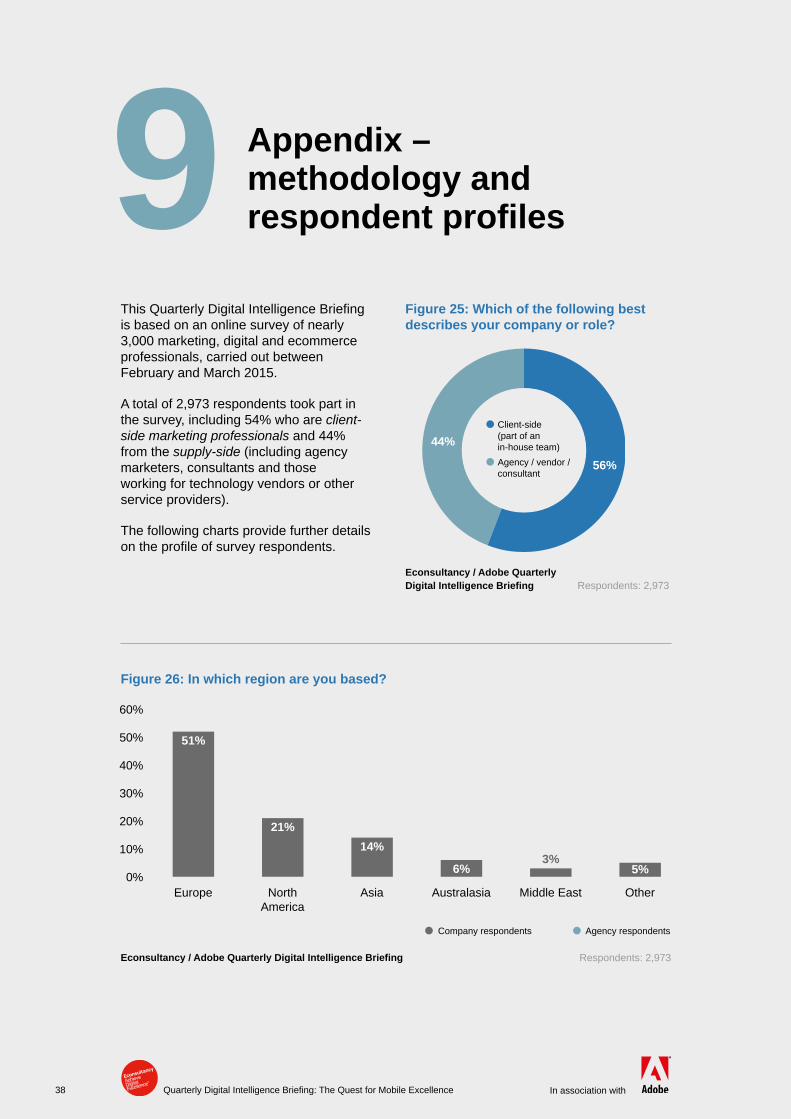
Appendix – methodology and respondent profiles 9
ThisQuarterlyDigitalIntelligenceBriefingis based on an online survey of nearly 3,000 marketing, digital and ecommerce professionals, carried out between February and March 2015.
A total of 2,973 respondents took part in thesurvey,including54%whoareclient-side marketing professionalsand44%from the supply-side(includingagencymarketers, consultants and those working for technology vendors or other serviceproviders).
The following charts provide further details ontheprofileofsurveyrespondents.
56%
44%
Figure 25: Which of the following best describes your company or role?
Econsultancy / Adobe Quarterly Digital Intelligence Briefing Respondents: 2,973
Client-side (partofan in-houseteam)
Agency / vendor / consultant
Figure 26: In which region are you based?
60%
50%
40%
30%
20%
10%
0%Europe
51%
North America
21%
Asia
14%
Australasia
6%
Other
5%
Econsultancy / Adobe Quarterly Digital Intelligence Briefing Respondents: 2,973
Company respondents Agency respondents
Middle East
3%

39Quarterly Digital Intelligence Briefing: The Quest for Mobile Excellence In association with
38%9%
8%7%
5%4%4%
3%
UK
Germany
Italy
France
Netherlands
Sweden
Spain
Belgium
Switzerland
Denmark
Finland
Austria
Norway
Luxembourg
Other
Respondents based in EuropeFigure 27: In which of the following countries are you based?
1%1%
2%2%
1%
14%
0% 10%5% 15% 20% 25% 30% 40%
Econsultancy / Adobe Quarterly Digital Intelligence Briefing Respondents: 1,401
1%
35%

40 Quarterly Digital Intelligence Briefing: The Quest for Mobile Excellence In association with
40%
11%
10%
8%
21%
14%
30%
5%
Manager
Board level / business owner
Junior executive
0% 20% 50%10% 30% 40%
Senior director / Director
Company respondents Agency respondents
Figure 28: What best describes your position at your company?
Econsultancy / Adobe Quarterly Digital Intelligence Briefing Company respondents: 1,536Agency respondents: 1,214
7%4%Analyst
6%16%Consultant
3%3%CMO / VP
2%2%CIO / CTO
13%5%Other
39%10%9%
8%5%
4%4%
13%
Marketing
IT
Ecommerce
Web development
Operations
Sales
Content / editorial
Customer service
Analytics team
Separate mobile team
Other
Company respondents
Figure 29: In which business function do you work?
2%3%3%
Econsultancy / Adobe Quarterly Digital Intelligence Briefing Respondents: 1,537
0% 20% 50%10% 30% 40%

41Quarterly Digital Intelligence Briefing: The Quest for Mobile Excellence In association with
Figure 31: Are you more focused on B2B or B2C marketing?
45%
40%
35%
30%
25%
20%
15%
10%
5%
0%B2C marketing B2B marketing B2BandB2C(equally)
40%
25%
35%
Econsultancy / Adobe Quarterly Digital Intelligence Briefing Company respondents: 1,536Agency respondents: 1,214
25%
34%
41%
Company respondents Agency respondents
11%11%
10%9%
8%7%
6%5%5%5%
3%
Financial services
Retail
Technology
Media
Charities,GovernmentandNonProfit
Professional Services
Travel&Leisure
ConsumerGoods
Healthcare and Pharma
Manufacturing
Telecoms
Automotive
GamingandGambling
Other
Company respondents
Figure 30: In which business sector is your organisation?
Econsultancy / Adobe Quarterly Digital Intelligence Briefing Respondents: 1,506
0% 10% 20%5% 15%
3%
16%1%

42 Quarterly Digital Intelligence Briefing: The Quest for Mobile Excellence In association with
Figure 32: What is your annual company revenue?
50%
45%
40%
35%
30%
25%
20%
15%
10%
5%
0%
Econsultancy / Adobe Quarterly Digital Intelligence Briefing Company respondents: 935 Agency respondents: 710
Less than £1 million
24%
47%
£1 - £10 million
21%
29%
£10 - £50 million
13% 12%
£50 - £150 million
9%
4%
£150 million - £1 billion
16%
4%
More than £1 billion
18%
4%
Company respondents Agency respondents

in association with
Quarterly Digital Intelligence BriefingThe Quest for Mobile Excellence
Published April 2015
All rights reserved. No part of this publication may be reproduced or transmitted in any form or by any means, electronic or mechanical, including photocopy, recording or any information storage and retrieval system, without prior permission in writing from the publisher.
Copyright © Econsultancy.com Ltd 2015
Econsultancy London Wells Point 79 Wells Street London W1T 3QN United Kingdom
Telephone: +44 207 269 1450
http://econsultancy.com [email protected]
Econsultancy New York 350 7th Avenue, Suite 307 New York, NY 10001 United States
Telephone: +1 212 971 0630
Econsultancy Singapore 20 Collyer Quay #23-01 Singapore 049319
Telephone: +65 6653 1911