quarter 1/2008 interim report · 2007, ise’s results are fully consolidated in deutsche börse...
TRANSCRIPT
Quarter 1/2008Interim Report
DtB_ZB_01-08_01_neu:Layout 1 25.04.2008 14:10 Uhr Seite 5
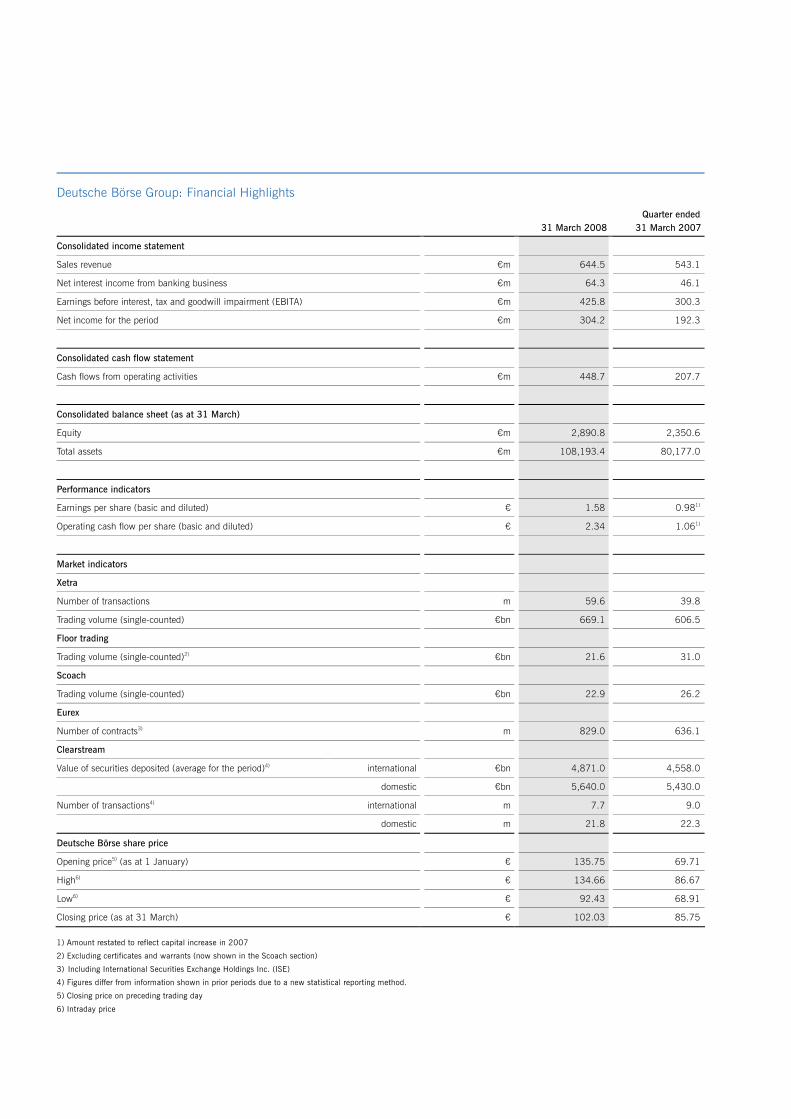
Deutsche Börse Group: Financial Highlights
Quarter ended 31 March 2008 31 March 2007
Consolidated income statement
Sales revenue €m 644.5 543.1
Net interest income from banking business €m 64.3 46.1
Earnings before interest, tax and goodwill impairment (EBITA) €m 425.8 300.3
Net income for the period €m 304.2 192.3
Consolidated cash flow statement
Cash flows from operating activities €m 448.7 207.7
Consolidated balance sheet (as at 31 March)
Equity €m 2,890.8 2,350.6
Total assets €m 108,193.4 80,177.0
Performance indicators
Earnings per share (basic and diluted) € 1.58 0.981)
Operating cash flow per share (basic and diluted) € 2.34 1.061)
Market indicators
Xetra
Number of transactions m 59.6 39.8
Trading volume (single-counted) €bn 669.1 606.5
Floor trading
Trading volume (single-counted)2) €bn 21.6 31.0
Scoach
Trading volume (single-counted) €bn 22.9 26.2
Eurex
Number of contracts3) m 829.0 636.1
Clearstream
Value of securities deposited (average for the period)4) international €bn 4,871.0 4,558.0
domestic €bn 5,640.0 5,430.0
Number of transactions4) international m 7.7 9.0
domestic m 21.8 22.3
Deutsche Börse share price
Opening price5) (as at 1 January) € 135.75 69.71
High6) € 134.66 86.67
Low6) € 92.43 68.91
Closing price (as at 31 March) € 102.03 85.75
1) Amount restated to reflect capital increase in 2007
2) Excluding certificates and warrants (now shown in the Scoach section)
3) Including International Securities Exchange Holdings Inc. (ISE)
4) Figures differ from information shown in prior periods due to a new statistical reporting method.
5) Closing price on preceding trading day
6) Intraday price

Management Report 1
Deutsche Börse achieves record results in Q1/2008
Sales revenue grew by 19 percent year-on-year to €644.5 million (Q1/2007: €543.1 million).
Net interest income from banking business rose by 39 percent to €64.3 million (Q1/2007: €46.1 million).
Total costs amounted to €316.1 million in the first quar-ter, on a level with the prior-year quarter (Q1/2007: €313.3 million).
Earnings before interest, tax and goodwill impairment (EBITA) rose by 42 percent to €425.8 million (Q1/2007: €300.3 million).
Earnings per share (basic and diluted) amounted to €1.58 for an average of 192.1 million shares (Q1/2007: €0.98 for 195.3 million shares).
Operating cash flow per share rose to €2.34 (Q1/2007: €1.06).
Results of the International Securities Exchange Holdings Inc. (ISE) subgroup are now fully consolidated for the first time after completion of the acquisition on 19 December 2007.
A dividend of €2.10 per share will be proposed to the Annual General Meeting, an increase of 24 percent.
As a result of the German tax reform and the planned relocation of parts of the Group to Eschborn, Deutsche Börse Group is expecting a tax rate of below 30 percent for 2008.
During the course of the repayment of the bridge loan to finance the ISE acquisition, Deutsche Börse AG is-sued a five-year bond with a volume of €500 million and a coupon of 5.0 percent in April 2008. The bond is rated “AA” by Standard & Poor’s.
Development of Deutsche Börse AG shares since the beginning of Q1/2008
Order book turnover of Deutsche Börse share
Dow Jones EURO STOXX 50® (EUR) (Return)1)
Daily Deutsche Börse closing share priceDAX® performance1)
1) Index-linked, closing price on 28 December 2007
Quoted price € Turnover €m
0
2,1002,100
1,2001,200
600600
300300
70
100100
110110
120120
130130
140140
8080
9090
900900
1,5001,500
1,8001,800
28.1
2.
31.1
2.-
4.1
.
7.1
.-11.1
.
14.1
.-18.1
.
21.1
.-25.1
.
28.1
.-1.2
.
4.2
.-8.2
.
11.2
.-15.2
.
18.2
.-22.2
.
25.2
.-29.2
.
3.3
.-7.3
.
10.3
.-14.3
.
17.3
.–21.3
.
24.3
.–28.3
.
31.3
.-4.4
.
7.4
.-11.4
.
14.4
.-18.4
.
21.4
.-25.4
.
28.4
.-2.5
.

2 Management Report Financial Statements Notes
Group Interim Management Report
Deutsche Börse AG prepared this quarterly financial report in accordance with Inter-national Financial Reporting Standards (IFRSs) as adopted by the EU. As stipulated by the WpHG (Wertpapierhandelsgesetz – German Securities Trading Act), it is sup-plemented by a Group interim management report. This report also takes into account the requirements of German Accounting Standard (GAS) 16 (near final draft). Results of operations, financial position and net assets
Results of operations After completion of the acquisition of ISE in December 2007, ISE’s results are fully consolidated in Deutsche Börse Group’s Q1/2008 interim report. All disclosures relating to ISE’s financial indicators refer to the ISE sub-group, including integration costs and synergy effects. Deutsche Börse Group’s sales revenue rose by 19 percent in the first quarter to €644.5 million (Q1/2007: €543.1 million). The Group recorded growth in all market seg-ments, with the strongest increase in sales revenue achieved by the Eurex derivatives market. Even exclud-ing the contribution by ISE amounting to €59.6 million, the Group expanded its business by 8 percent and posted all-time record sales revenue. Despite the additional costs resulting from the consolida-tion of ISE, costs remained on a level with the previous year at €316.1 million (Q1/2007: €313.3 million). The main reasons for this are the effects of the restructuring
program announced last year, which are reflected in each segment, lower provisions for the phantom stock option plan and exceptional costs in the first quarter of 2007. The costs include amortization of intangible assets from the purchase price allocation for the ISE transaction amounting to €9.2 million. The overall ISE costs in the first quarter of 2008 amounted to €36.1 million. Ad-justed for these costs, the Group’s total costs were re-duced by 11 percent. Deutsche Börse Group’s EBITA increased to €425.8 mil-lion, a year-on-year increase of 42 percent (Q1/2007: €300.3 million). The significant increase in EBITA is due primarily to higher sales revenue accompanied by compa-rable costs. In addition, EBITA contains a one-time gain of €9.2 million reported in other operating income relat-ing to the termination of a joint venture between ISE Ventures LLC and TSX Group Inc. (Toronto Stock Ex-change). Including this one-time gain, ISE’s EBITA con-tribution amounted to €32.8 million. The Company increased earnings before tax (EBT) by 45 percent to €439.4 million (Q1/2007: €303.4 mil-lion). In addition to the significant increase in EBITA, exchange rate differences had a positive effect on EBT. These unrealized exchange rate gains arose in the course of the financing of the ISE acquisition. They amounted to €24.9 million and were recognized in the financial result. Sales revenue from ISE’s derivatives, stock exchange and market data business is reported in the Eurex segment. The Swiss Exchange AG’s indirect share in the subgroup ISE‘s post-tax earnings is shown within minority interest.
Sales revenue and EBITA by quarter
€ millions
Sales revenue EBITA
Q1/2007 Q2/2007 Q3/2007 Q4/2007 Q1/2008
00
100100
300300
400400
500500
600600
700700
300.3321.8
368.3
543.1 542.5 561.9
355.5
537.7
200200
425,8
644,5
Management Report 3
Xetra segment Sales revenue rose by 4 percent to €115.7 million (Q1/2007: €111.0 million).
Costs were up slightly year-on-year at €48.3 million (Q1/2007: €46.8 million).
EBITA increased by 4 percent to €72.4 million (Q1/2007: €69.9 million).
The subprime crisis that had lifted trading activity on the markets in the second half of 2007 was still affecting business in the first quarter of 2008: the financial markets remained unsettled, and the key indices re-treated significantly since the beginning of the year. At the beginning of the quarter, this volatile environment had been accompanied by strong trading activity in the cash market. However, trading activity slowed during the course of the quarter and was down year-on-year – due in part to the lower number of trading days in March. The total number of transactions in electronic Xetra® trading grew by 50 percent to 59.6 million, and the trading vol-ume rose by 10 percent to €669.1 billion. At around €22.5 thousand, the average value of a Xetra transaction was lower year-on-year (Q1/2007: around €30.4 thou-sand). The main reason for this is the increase to 45 percent in the share of algorithmic trading (Q1/2007: 33 percent), in which order sizes tend to be smaller. Pricing models in the cash market reflect both volumes and the number of orders: the trading fees are calculated per executed order, depending on the order value.
Private investors in particular were increasingly reluctant to place orders: the floor-traded volume at the Frankfurt Stock Exchange fell by 30 percent year-on-year to €21.6 billion. In the wake of MiFID, which came into effect on 1 November 2007, part of the order volume shifted from floor trading to Xetra. Under the MiFID best execution rules, banks are required to execute their customers’ orders at the best possible terms. With Xetra BEST®, Deutsche Börse offers a function that allows private customers to benefit in all cases from improved prices compared with the Xetra benchmark price. As a result, Xetra – as the MiFID best execution platform with the highest liquidity and the best prices – was able to ex-tend its share of the German exchange market for trading leading German equities in the DAX® blue chip index in the first quarter of 2008 from around 97 to 99 percent. Scoach, the Deutsche Börse AG/Swiss Financial Market Services AG joint venture for certificates and warrants, looks back on a first quarter with difficult market condi-tions: because of the deteriorating market environment, the trading volume declined by 13 percent.
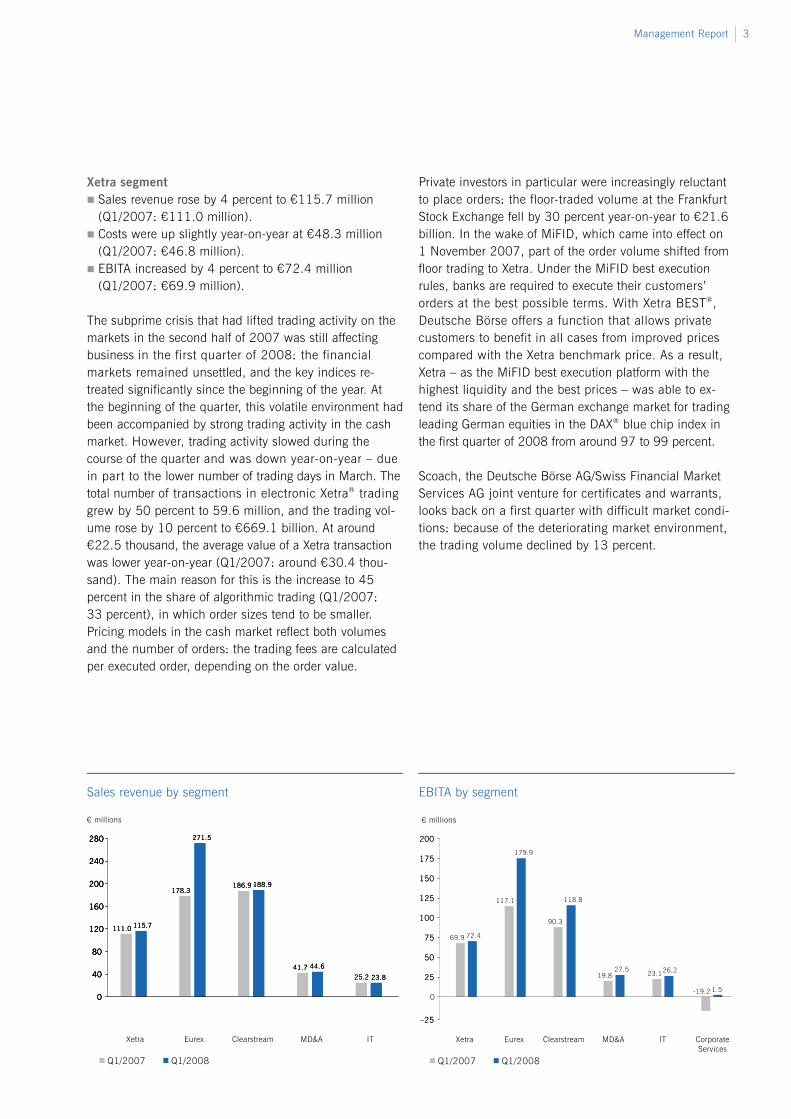
Sales revenue by segment EBITA by segment
€ millions
Q1/2007 Q1/2008
Xetra Eurex Clearstream MD&A IT
40
80
120
280
115.7
271.5
188.9
44.6
23.8
0
111.0
178.3186.9
41.725.2
160
200
240
40
80
120
280
115.7
271.5
188.9
44.6
23.8
0
111.0
178.3186.9
41.725.2
160
200
240
4040
8080
120120
280280
115.7
271.5
188.9
44.6
23.8
00
111.0
178.3186.9
41.725.2
160160
200200
240240
€ millions
Q1/2007 Q1/2008
Xetra Eurex Clearstream MD&A IT CorporateServices
0
2525
5050
7575
100100
125125
150150
200200
72.4
179.9
118.8
27.5 26.2
1.5
69.9
117.1
90.3
19.8 23.1
175175
–25–25
-19.2

4 Management Report Financial Statements Notes
Xetra segment: key indicators
Q1/2008 Q1/2007 ChangeTrading volume (single-counted) €bn €bn %
Xetra® 669.1 606.5 10
Floor1) 21.6 31.0 –30
Scoach 22.9 26.2 –13
Transactions m m %
Xetra (transactions) 59.6 39.8 50
1) Excluding certificates and warrants, which are shown in the row for the Scoach joint
venture
Xetra release 9.0 was launched on 28 April. As a result, trading in the approximately 300,000 products of the European Scoach exchange moved from floor trading at the Frankfurt Stock Exchange to the fully electronic Xetra platform. This gives Xetra market participants – more than 260 banks and securities trading firms, including 100 outside Germany – direct access to the broadest range of structured products worldwide. Xetra release 9.0 bundles the liquidity of securities of all asset classes on a single platform, and its fully electronic trading offers investors across Europe the fastest execution at the best prices.
Breakdown of sales revenue in the Xetra segment
The XTF Exchange Traded Funds® segment for ex-change-traded index funds (ETFs) maintained its Euro-pean market leadership. The XTF segment increased its trading volume by 32 percent in the first quarter of 2008
to €31.9 billion (Q1/2007: €24.1 billion). Investors benefit from the high liquidity and the broad product offering, with 316 ETFs at present. Deutsche Börse started trading in commodities at the end of 2007: Together with six prominent partners (Commerzbank AG, Deutsche Bank AG, DZ Bank AG, B. Metzler seel. Sohn & Co. KGaA, Bank Vontobel and Umicore AG & Co. KG), it has established the Deutsche Börse Commodities GmbH joint venture. The first prod-uct issued by Deutsche Börse Commodities is Xetra-Gold®, a physically covered bond. With this product, Deutsche Börse Group offers services on all levels of its integrated value chain. Xetra-Gold got off to a successful start: a stock of approximately 6 tons of gold has been built up by the end of March. With a share of around 40 percent of the order book volume in exchange traded commodities trading, Xetra-Gold became the German market leader right from the start in the first quarter of 2008. Eurex segment
Eurex sales revenue rose by 52 percent to €271.5 mil-lion (Q1/2007: €178.3 million)
Costs grew by 55 percent to €120.6 million year-on-year (Q1/2007: €77.8 million)
EBITA increased by 54 percent to €179.9 million (Q1/2007: €117.1 million)
The Eurex derivatives exchanges (incl. ISE) recorded a year-on-year increase of 30 percent in the contracts traded during the first quarter of 2008, to 829.0 million contracts (Q1/2007: 636.1 million, incl. ISE). Structural growth drivers described in the 2007 Annual Report continued to have a significant impact on the segment’s growth in Q1/2008. Eurex achieved the largest growth in European equity index derivatives (+45 percent), which became the most significant product segment with a total of 258.6 million contracts (Q1/2007: 178.6 million). Market uncertainties due to the subprime crisis coupled with volatile index levels drove market participants to hedge their positions with equity index derivatives. In the European equity derivatives segment, 98.9 million contracts were traded (Q1/ 2007: 85.2 million), an increase of 16 percent.

Management Report 5
European interest rate derivatives showed a volume in-crease of approximately 4 percent year-on-year, for a total of 211.7 million contracts traded (Q1/2007: 203.1 mil-lion). The stable long-term interest rate trend was in line with market expectations; market participants did not see much need to restructure their portfolios. Total volume for US options traded in the first quarter of 2008 increased 54 percent to a record 259.8 million contracts, compared to 169.2 million contracts traded in the first quarter of 2007. Strong volumes in US options were driven by vola-tility in the financial markets and by increased participa-tion from institutional investors.
Contract volumes in the derivatives market
Q1/2008 Q1/2007 Change m contracts m contracts %
European equity index derivatives 258.6 178.6 45
European equity derivatives 98.9 85.2 16
European interest rate derivatives 211.7 203.1 4
US options 259.8 169.2 54
Total 829.0 636.1 30
Segment costs were higher than in the same quarter of the previous year, mostly as a result of the ISE consolida-tion, higher sales related costs following the rise in vol-umes, and an increase in non-recoverable input tax.
The segment’s EBITA includes a one-time effect of €9.2 million in other operating income, associated with the termination of a joint venture between ISE Ventures LLC and the Canadian TSX Group Inc. On 24 February 2008, ISE and Osaka Securities Ex-change Co., Ltd. (OSE) signed a memorandum of agree-ment to create a joint venture to launch a new options trading platform in Japan. On 12 March 2008, Eurex, ISE, and The Options Clear-ing Corporation (OCC) announced their plan to create the first transatlantic trading and clearing link. Once imple-mented, Eurex customers will be able to access the full suite of options products available at ISE using their exist-ing connections and clearing accounts.
Implementation of the transatlantic link is expected in the second half of 2009, subject to all necessary regulatory approvals.
Breakdown of sales revenue in the Eurex segment
In the first quarter of 2008, Eurex Repo, which operates CHF and EUR repo markets, set several records. After its internationalization with additional European collaterals in 2007, the secured money market segment Euro GC Pool-ing® reached a new daily record on 24 February 2008 with an outstanding volume of €46.2 billion. Average outstanding volume in the first quarter also reached a new record with €32.7 billion, a plus of 197 percent against the previous year’s quarter (Q1/2007: €10.9 billion). Eurex Repo for all of its markets combined set a new record with an average outstanding volume of €110.7 billion in the first quarter, an increase of 27 per-cent year-on-year. Volumes in emission derivatives, which have been avail-able to Eurex members since the EEX/Eurex cooperation started on 5 December 2007, have increased signifi-cantly in the first quarter 2008 to 14.4 million tons (Q1/2007: 0.9 million tons). Currently, 205 participants from 19 countries are active on EEX (end of Q1/2007: 162 participants). Effective 1 January 2008, the Trader Development Pro-gram introduced in July 2007 was extended to Central and Eastern Europe with adjusted conditions. The pro-gram supports Eurex participants wishing to expand their
6 Management Report Financial Statements Notes
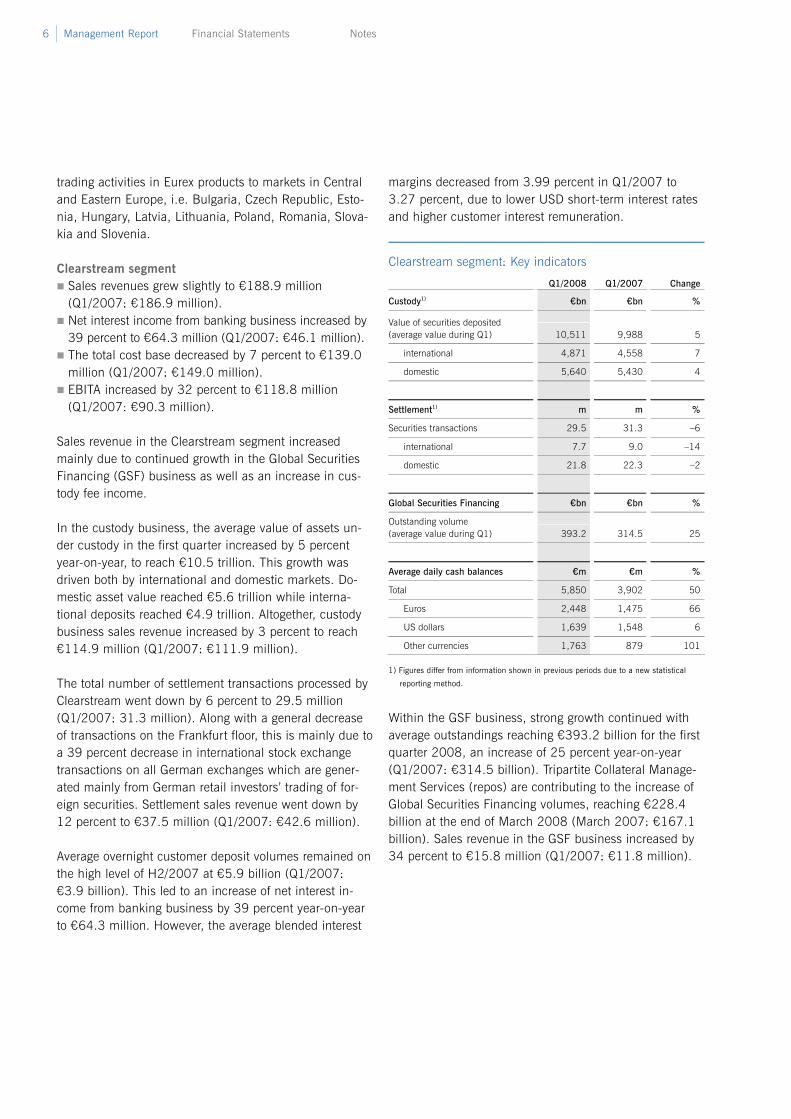
trading activities in Eurex products to markets in Central and Eastern Europe, i.e. Bulgaria, Czech Republic, Esto-nia, Hungary, Latvia, Lithuania, Poland, Romania, Slova-kia and Slovenia. Clearstream segment
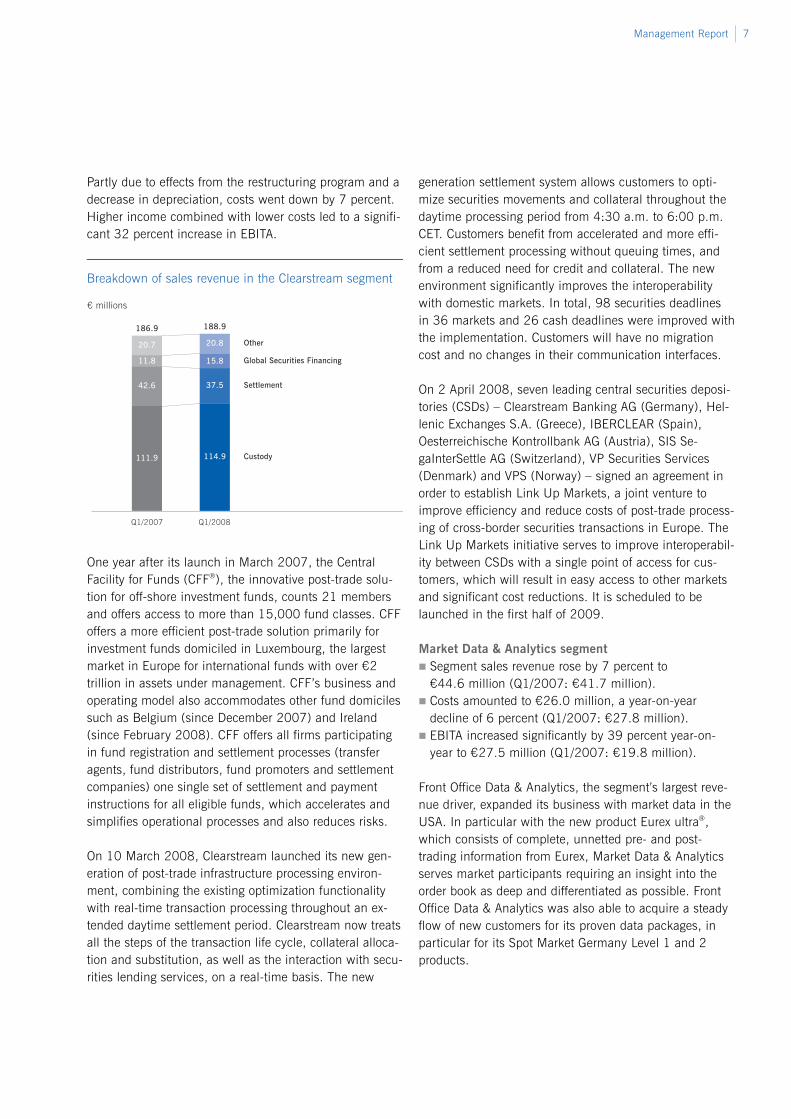
Sales revenues grew slightly to €188.9 million (Q1/2007: €186.9 million).
Net interest income from banking business increased by 39 percent to €64.3 million (Q1/2007: €46.1 million).
The total cost base decreased by 7 percent to €139.0 million (Q1/2007: €149.0 million).
EBITA increased by 32 percent to €118.8 million (Q1/2007: €90.3 million).
Sales revenue in the Clearstream segment increased mainly due to continued growth in the Global Securities Financing (GSF) business as well as an increase in cus-tody fee income. In the custody business, the average value of assets un-der custody in the first quarter increased by 5 percent year-on-year, to reach €10.5 trillion. This growth was driven both by international and domestic markets. Do-mestic asset value reached €5.6 trillion while interna-tional deposits reached €4.9 trillion. Altogether, custody business sales revenue increased by 3 percent to reach €114.9 million (Q1/2007: €111.9 million). The total number of settlement transactions processed by Clearstream went down by 6 percent to 29.5 million (Q1/2007: 31.3 million). Along with a general decrease of transactions on the Frankfurt floor, this is mainly due to a 39 percent decrease in international stock exchange transactions on all German exchanges which are gener-ated mainly from German retail investors’ trading of for-eign securities. Settlement sales revenue went down by 12 percent to €37.5 million (Q1/2007: €42.6 million). Average overnight customer deposit volumes remained on the high level of H2/2007 at €5.9 billion (Q1/2007: €3.9 billion). This led to an increase of net interest in-come from banking business by 39 percent year-on-year to €64.3 million. However, the average blended interest
margins decreased from 3.99 percent in Q1/2007 to 3.27 percent, due to lower USD short-term interest rates and higher customer interest remuneration.
Clearstream segment: Key indicators
Q1/2008 Q1/2007 Change
Custody1) €bn €bn %
Value of securities deposited (average value during Q1) 10,511 9,988 5
international 4,871 4,558 7
domestic 5,640 5,430 4
Settlement1) m m %
Securities transactions 29.5 31.3 –6
international 7.7 9.0 –14
domestic 21.8 22.3 –2
Global Securities Financing €bn €bn %
Outstanding volume (average value during Q1) 393.2 314.5 25
Average daily cash balances €m €m %
Total 5,850 3,902 50
Euros 2,448 1,475 66
US dollars 1,639 1,548 6
Other currencies 1,763 879 101
1) Figures differ from information shown in previous periods due to a new statistical
reporting method.
Within the GSF business, strong growth continued with average outstandings reaching €393.2 billion for the first quarter 2008, an increase of 25 percent year-on-year (Q1/2007: €314.5 billion). Tripartite Collateral Manage-ment Services (repos) are contributing to the increase of Global Securities Financing volumes, reaching €228.4 billion at the end of March 2008 (March 2007: €167.1 billion). Sales revenue in the GSF business increased by 34 percent to €15.8 million (Q1/2007: €11.8 million).
Management Report 7
Partly due to effects from the restructuring program and a decrease in depreciation, costs went down by 7 percent. Higher income combined with lower costs led to a signifi-cant 32 percent increase in EBITA.
Breakdown of sales revenue in the Clearstream segment
One year after its launch in March 2007, the Central Facility for Funds (CFF®), the innovative post-trade solu-tion for off-shore investment funds, counts 21 members and offers access to more than 15,000 fund classes. CFF offers a more efficient post-trade solution primarily for investment funds domiciled in Luxembourg, the largest market in Europe for international funds with over €2 trillion in assets under management. CFF’s business and operating model also accommodates other fund domiciles such as Belgium (since December 2007) and Ireland (since February 2008). CFF offers all firms participating in fund registration and settlement processes (transfer agents, fund distributors, fund promoters and settlement companies) one single set of settlement and payment instructions for all eligible funds, which accelerates and simplifies operational processes and also reduces risks. On 10 March 2008, Clearstream launched its new gen-eration of post-trade infrastructure processing environ-ment, combining the existing optimization functionality with real-time transaction processing throughout an ex-tended daytime settlement period. Clearstream now treats all the steps of the transaction life cycle, collateral alloca-tion and substitution, as well as the interaction with secu-rities lending services, on a real-time basis. The new
generation settlement system allows customers to opti-mize securities movements and collateral throughout the daytime processing period from 4:30 a.m. to 6:00 p.m. CET. Customers benefit from accelerated and more effi-cient settlement processing without queuing times, and from a reduced need for credit and collateral. The new environment significantly improves the interoperability with domestic markets. In total, 98 securities deadlines in 36 markets and 26 cash deadlines were improved with the implementation. Customers will have no migration cost and no changes in their communication interfaces. On 2 April 2008, seven leading central securities deposi-tories (CSDs) – Clearstream Banking AG (Germany), Hel-lenic Exchanges S.A. (Greece), IBERCLEAR (Spain), Oesterreichische Kontrollbank AG (Austria), SIS Se-gaInterSettle AG (Switzerland), VP Securities Services (Denmark) and VPS (Norway) – signed an agreement in order to establish Link Up Markets, a joint venture to improve efficiency and reduce costs of post-trade process-ing of cross-border securities transactions in Europe. The Link Up Markets initiative serves to improve interoperabil-ity between CSDs with a single point of access for cus-tomers, which will result in easy access to other markets and significant cost reductions. It is scheduled to be launched in the first half of 2009. Market Data & Analytics segment
Segment sales revenue rose by 7 percent to €44.6 million (Q1/2007: €41.7 million).
Costs amounted to €26.0 million, a year-on-year decline of 6 percent (Q1/2007: €27.8 million).
EBITA increased significantly by 39 percent year-on-year to €27.5 million (Q1/2007: €19.8 million).
Front Office Data & Analytics, the segment’s largest reve-nue driver, expanded its business with market data in the USA. In particular with the new product Eurex ultra®, which consists of complete, unnetted pre- and post-trading information from Eurex, Market Data & Analytics serves market participants requiring an insight into the order book as deep and differentiated as possible. Front Office Data & Analytics was also able to acquire a steady flow of new customers for its proven data packages, in particular for its Spot Market Germany Level 1 and 2 products.

8 Management Report Financial Statements Notes
The index business of Issuer Data & Analytics is currently the segment’s fastest-growing area. This area further expanded its business with foreign issuers. In the US, it acquired issuers who issue ETFs on DAX family indices. The license fees are based on the volume of assets under management. ETFs are well-established in the US and very popular with investors. In Back Office Data & Analytics, Avox Ltd. acquired fur-ther customers and increased sales revenue by 36 per-cent year-on-year. By contrast, the business with manda-tory data using the TRICE® system, which transmits data on reportable transactions to BaFin, declined in the first quarter. This is a result of MiFID rules, which specify that many transactions, including those in structured prod-ucts, no longer have to be reported. The Market Data & Analytics segment sold the terminal business of Infobolsa Deutschland, generating one-time proceeds of €0.7 million. Information Technology segment
External sales revenue generated by the IT segment fell slightly by 6 percent to €23.8 million (Q1/2OO7: €25.2 million).
Costs were also down somewhat year-on-year, at €103.9 million (Q1/2007: €104.8 million).
EBITA increased by 13 percent to €26.2 million (Q1/2007: €23.1 million).
External sales revenue declined slightly because of sig-nificantly lower floor trading activity. Although staff costs also declined in the IT segment, depreciation and amorti-zation expenses increased because of the investments in network performance and systems capacity. The system-atic technical upgrading of Xetra, Eurex and other appli-cations used in securities trading makes the systems faster and more stable, even under maximum load condi-tions. Internal sales revenue, which the IT segment gen-erates among other things with development and network services for the Group’s market segments, increased year-on-year. This was also reflected in the segment’s EBITA growth.
In recent months, Deutsche Börse has made significant improvements to its backbone telecommunications net-work that links major financial centers around the world. The upgrade is the segment’s response to the sharp rise in demand for maximum data through-put and extremely low-latency access facilities – both of which are crucial factors for algorithmic trading. For example, the capacity of the connection between London and Frankfurt was increased to five Gbit/s: this means that the entire content of an audio CD can be transmitted in only one second. Based on this upgrade, Eurex has been offering a new transaction service since April. This involves even faster and more efficient access to the Eurex trading system for high frequency trading strategies. Deutsche Börse’s performance has repeatedly convinced its customers: since presenting its Proximity Services offering in September 2006, the Information Technology segment has acquired 73 customers, primarily market participants trading Eurex products. These customers have located elements of their trading infrastructure in close proximity to Deutsche Börse’s trading systems and data processing services in Frankfurt. This minimizes delays in data transfers over greater distances (latency), providing trading participants with what is in some cases a considerable time advantage in implementing trading strategies where every millisecond counts. Financial position Operating cash flow In the first quarter of 2008, Deutsche Börse Group re-corded a 116 percent increase in cash flow from operat-ing activities to €448.7 million (Q1/2007: €207.7 mil-lion). The increase is attributable primarily to the higher net income for the period and to repayments of receiv-ables from the central counterparty (CCP) business out-standing at the year-end. Cash flows from investing activities declined to €–107.5 million (Q1/2007: €–181.7 million), primarily because of the changed maturities of cash investments.
Management Report 9
Cash flows from financing activities amount to €0.1 mil-lion (Q1/2007: €–125.2 million). This is due primarily to the fact that no funds were used to repurchase own shares in the first quarter of 2008. As a result, cash and cash equivalents amounted to €1,375.6 million at the end of the first quarter of 2008 (Q1/2007: €927.6 million). The strong cash flows from operating activities ensure the Group’s liquidity. At €439.6 million, free cash flow, i.e. cash flows from oper-ating activities less payments to acquire intangible assets and property, plant and equipment, significantly exceeded the previous year’s level (Q1/2007: €189.5 million). Capital management program Under its capital management program, Deutsche Börse AG distributes funds not required for the Group’s operating business to its shareholders. Deutsche Börse intends to continue its progressive dividend policy and distribute 40 to 60 percent of net income to shareholders. The remaining funds are earmarked for the continued repur-chase of own shares. These measures are implemented subject to special investment needs and capital require-ments. The program is the result of an intensive review of capital requirements, which considers the Group’s capital needs from legal, regulatory, credit rating and economic capital perspectives. To ensure the continued success of the Clearstream segment, which is active in securities custody and settlement, the Company aims to maintain Clearstream Banking S.A.’s strong “AA” credit rating. In addition, Deutsche Börse AG needs to maintain a strong credit profile for the benefit of its subsidiary Eurex Clear-ing AG. For their business activities, the customers expect the service provider to have a conservative interest cover-age and debt/equity ratio and thus maintain its ability to secure its strong credit ratings. The Deutsche Börse Group’s primary objective is therefore to ensure that the interest coverage ratio (ratio of EBITDA to interest cost on financial liabilities) does not fall below 16 at Group level and 25 in the Clearstream subgroup, and to ensure that tangible equity (equity in accordance with IFRS less goodwill) is at least €700 million at Clearstream Inter-national S.A. and at least €250 million at Clearstream Banking S.A. Additional aims include maintaining the subordinated profit participation rights with a volume of €150 million issued by Clearstream Banking S.A. to Deutsche Börse AG.
Since the launch of the capital management program in 2005, the Company has distributed around €0.6 billion as dividends and around €1.5 billion in the form of share buybacks. A further €403.0 million is scheduled for dis-tribution in May 2008. Of the 32.5 million shares repur-chased between 2005 and 2007, the Company has cancelled 28.6 million shares so far, most recently 5.0 million shares on 28 March 2008. A further 0.8 million shares were acquired by employees under the terms of the Group Share Plan. As at 31 March 2008, the remain-ing 3.1 million shares were held by the Company as treasury shares. Financing of the ISE acquisition The acquisition of ISE by Eurex was financed on the one hand using retained earnings. On the other hand, Deutsche Börse Group raised debt capital in the form of a bridge loan amounting to €1.0 billion and USD 0.7 bil-lion. After partial repayment of the loan already in Decem-ber 2007 the credit sum as at 31 March 2008 amounted to €1.0 billion and USD 0.5 billion. The bridge loan was arranged for a term of one year and with the option to extend it for a further year. In April 2008, the Company issued a €500 million euro bond with a five-year term and a coupon of 5.0 percent with the aim of repaying parts of the bridge loan. The remaining balance of the bridge loan will be refinanced by issuing further long-term debt in-struments and hybrid instruments. Dividend The Executive Board and Supervisory Board will propose to the AGM to be held on 21 May 2008 that a dividend for financial year 2007 of €2.10 per share (2006: €1.70 per share) be paid on 22 May 2008. This represents a 24 percent increase year-on-year. Based on this proposal, the distribution ratio is 44 percent of net income. Ad-justed for the sale of buildings in Luxembourg, the distri-bution ratio amounts to 51 percent (2006: 50 percent). With 191.9 million outstanding shares carrying dividend rights for financial year 2007, this would therefore result in a total distribution of €403.0 million (2006: €329.8 million).

10 Management Report Financial Statements Notes
Net assets Deutsche Börse Group’s noncurrent assets amounted to €4,128.9 million as at 31 March 2008 (Q1/2007: €1,893.3 million). Intangible assets of €3,243.1 million (2007: €1,201.4 million) accounted for the largest share of noncurrent assets. Intangible assets consist of the following items: goodwill of €1,895.9 million (Q1/2007: €1,069.9 million), which changed significantly due to the acquisition of ISE; other intangible assets of €1,226.7 million resulting from the ISE acquisition; and investments in trading and settlement systems, which are capitalized as software and amortized over their expected useful lives. The net carrying amount of software was €107.6 million as at 31 March 2008 (Q1/2007: €117.6 million). Property, plant and equipment declined, mainly due to the sale of a plot of land in the second quarter of 2007 and the sale and leaseback transaction for office real estate in Luxembourg belonging to Clearstream Interna-tional S.A. in the fourth quarter of 2007. Deutsche Börse Group’s financial assets increased signifi-cantly to €721.4 million (Q1/2007: €440.5 million) due to higher investments in noncurrent financial instruments as part of the liquidity management for Clearstream Banking S.A. and Clearstream Banking AG. Noncurrent assets were offset by equity amounting to €2,890.8 million (Q1/2007: €2,350.6 million) and noncurrent liabilities, mainly from deferred tax liabilities, of €687.2 million (Q1/2007: €611.7 million). The €499.9 million corporate bond included in noncurrent liabilities in the prior-year quarter was reclassified to other current liabilities because of its remaining term of only approximately two months. With an amount of €1.0 billion and USD 0.5 billion as at 31 March 2008, the bridge loan existing since the financing of the ISE acquisition accounts for the bulk of other bank loans and overdrafts.
Risk report
Deutsche Börse Group devotes considerable attention to risk mitigation and ensures that appropriate measures are taken to avoid, reduce and transfer, or intentionally accept, risk. The Group has adopted a standardized approach for measuring and reporting all operational, financial and business risks across its entire organization: the concept of “value at risk” (VaR). The various major individual risks defined in line with Deutsche Börse Group’s corpo-rate risk structure are calculated as VaR for the respective Group subsidiaries on a monthly basis and reported to the responsible executive boards. Equally, information on all material risks – whether existing or potential – and the related risk control measures are routinely reported on a monthly basis to the Executive Board and on a quarterly basis to the Supervisory Board. Information on these risks, when deemed necessary, is reported on an ad hoc basis to the Executive Board, including appropriate rec-ommendations, allowing them to take appropriate action. The Executive Board considers the risks for the Group to be limited and manageable. No significant changes in the risk profile are expected in the current financial year. Report on expected developments
The report on expected developments describes the ex-pected development of Deutsche Börse Group in financial year 2008. It contains statements and information on events in the future. These forward-looking statements and information are based on the Company’s expectations and assumptions at the time of publication of this report on expected developments. These expectations and as-sumptions are in turn subject to known and unknown risks and uncertainties. Numerous factors influence the success, the business strategy and the financial results of the Company. Many of these factors are outside the Com-pany’s control. Should one of the risks or uncertainties materialize or one of the assumptions made turn out to be incorrect, the actual development of the Company could deviate in either a positive or a negative way from the expectations and assumptions contained in the forward-looking statements and information in this report on expected developments.
Management Report 11
Development of results of operations For the remainder of the 2008 financial year, Deutsche Börse Group expects no significant deviations to the fore-casts for the development of the operating environment that were made in the consolidated financial statements for full-year 2007. Despite a possible recession in the US in the first six months of 2008, the Company believes that growth will continue in Europe, albeit at a slower pace. Based on the very good results for the first quarter of 2008, the Company is reiterating the expectations for 2008 presented in the 2007 annual report. Sales reve-nue in the Xetra cash market segment will continue to depend on equity market trends, equity market volatility and structural changes relating to trading activity. In con-trast to the cash market, the general trend on the finan-cial markets will play a subordinated role in the Eurex derivatives market segment. Additionally, further struc-tural growth in both segments is anticipated, including from customers’ use of fully computerized trading strate-gies, known as algorithmic trading. In addition to the European products, the integration of the US options business resulting from the acquisition of ISE will lead to further growth in the Eurex segment in the forecast pe-riod. For the Clearstream segment, the Group expects that the volume of bonds issued internationally will continue to grow faster than that of fixed-income securities issued nationally. Because of IFRS accounting requirements, which have an impact on ISE and Scoach, there is an earnings neutral adjustment to the costs expected by the Company for full-year 2008. At ISE, these requirements primarily mean an adjustment of costs because of the “activity remittance fee” payable to the SEC in accordance with section 31 of the Securities Exchange Act of 1934. At Scoach, they involve adjustments due to the migration of Scoach to the Xetra electronic trading platform on 28 April 2008 and a resulting change in the billing model. Both adjustments are earnings neutral, i.e. additional costs as against the original cost guidance are offset in full by a gross report-ing of revenue in the consolidated income statement. However, these requirements cause the Company to ad-just its expected total costs for 2008 by €35 million to €1,315 million. All other assumptions made as part of the original forecast of total costs remain unchanged.
Development of the Group’s financial position The Company expects its ongoing business activities to generate positive operating cash flow in remaining peri-ods of the current financial year. As part of its cash flow from investing activities, Deutsche Börse Group plans to invest around €80 million per year in intangible assets and property, plant and equipment (2007: €79.7 million). These investments will serve primarily to develop new and enhance existing products and services in the Xetra, Eurex and Clearstream segments.
12 Management Report Financial Statements Notes
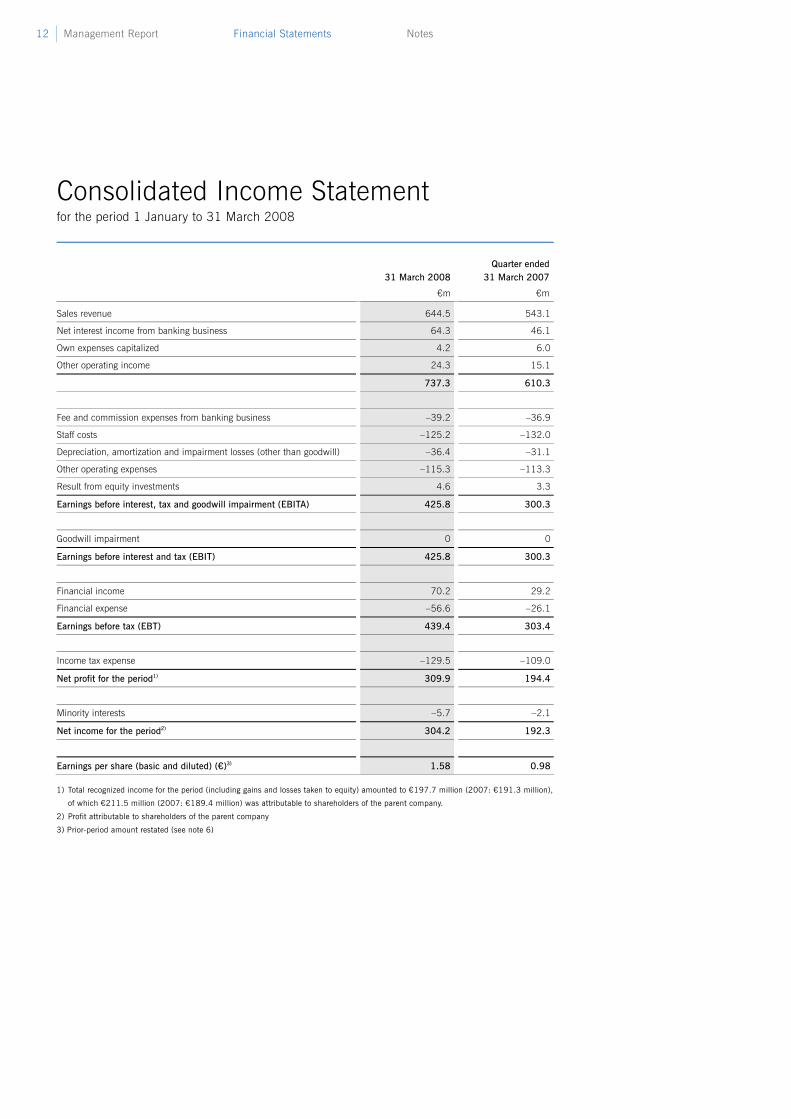
Consolidated Income Statement for the period 1 January to 31 March 2008
Quarter ended 31 March 2008 31 March 2007
€m €m
Sales revenue 644.5 543.1
Net interest income from banking business 64.3 46.1
Own expenses capitalized 4.2 6.0
Other operating income 24.3 15.1
737.3 610.3
Fee and commission expenses from banking business – 39.2 – 36.9
Staff costs – 125.2 – 132.0
Depreciation, amortization and impairment losses (other than goodwill) – 36.4 – 31.1
Other operating expenses – 115.3 – 113.3
Result from equity investments 4.6 3.3
Earnings before interest, tax and goodwill impairment (EBITA) 425.8 300.3
Goodwill impairment 0 0
Earnings before interest and tax (EBIT) 425.8 300.3
Financial income 70.2 29.2
Financial expense – 56.6 – 26.1
Earnings before tax (EBT) 439.4 303.4
Income tax expense – 129.5 – 109.0
Net profit for the period1) 309.9 194.4
Minority interests – 5.7 – 2.1
Net income for the period2) 304.2 192.3
Earnings per share (basic and diluted) (€)3) 1.58 0.98
1) Total recognized income for the period (including gains and losses taken to equity) amounted to €197.7 million (2007: €191.3 million),
of which €211.5 million (2007: €189.4 million) was attributable to shareholders of the parent company.
2) Profit attributable to shareholders of the parent company
3) Prior-period amount restated (see note 6)

Financial Statements 13
Consolidated Balance Sheet as at 31 March 2008
31 March 2008 31 Dec. 2007 31 March 2007
€m €m €m
ASSETS
Noncurrent assets
Intangible assets 3,243.1 3,419.8 1,201.4
Property, plant and equipment 92.2 98.3 236.2
Financial assets and investment property 721.4 630.2 440.5
Other noncurrent assets 72.2 35.5 15.2
4,128.9 4,183.8 1,893.3
Current assets
Financial instruments of Eurex Clearing AG 91,466.6 60,424.0 66,534.1
Current receivables and securities from banking business 8,900.6 9,619.7 8,804.4
Other receivables and other assets1) 442.6 660.8 360.1
Restricted bank balances 2,551.4 4,221.7 1,926.8
Other cash and bank balances 703.3 547.6 658.3
104,064.5 75,473.8 78,283.7
Total assets 108,193.4 79,657.6 80,177.0
EQUITY AND LIABILITIES
Equity
Shareholders’ equity 2,591.7 2,377.3 2,327.9
Minority interests 299.1 312.9 22.7
Total equity 2,890.8 2,690.2 2,350.6
Noncurrent liabilities
Provisions for pensions and other employee benefits 25.6 20.6 21.1
Other noncurrent provisions 72.7 118.4 64.5
Deferred tax liabilities 583.1 626.0 24.6
Interest-bearing liabilities 0.9 1.2 500.1
Other noncurrent liabilities 4.9 5.2 1.4
687.2 771.4 611.7
Current liabilities
Tax provisions 307.3 273.3 268.0
Other current provisions 130.6 205.0 146.5
Financial instruments of Eurex Clearing AG 91,466.6 60,424.0 66,534.1
Liabilities from banking business2) 8,211.9 9,125.9 8,137.7
Cash deposits by market participants 2,356.8 4,016.2 1,888.7
Other current liabilities 2,142.2 2,151.6 239.7
104,615.4 76,196.0 77,214.7
Total liabilities 105,302.6 76,967.4 77,826.4
Total equity and liabilities 108,193.4 79,657.6 80,177.0
1) Thereof €17.0 million (31 December 2007: €17.4 million and 31 March 2007: €14.0 million) with a remaining maturity
of more than one year from corporation tax credits in accordance with section 37 (5) KStG (Körperschaftsteuergesetz, the
German Corporation Tax Act)
2) Thereof €54.9 million (31 December 2007: €95.1 million and 31 March 2007: €0 million) liabilities to associates
14 Management Report Financial Statements Notes
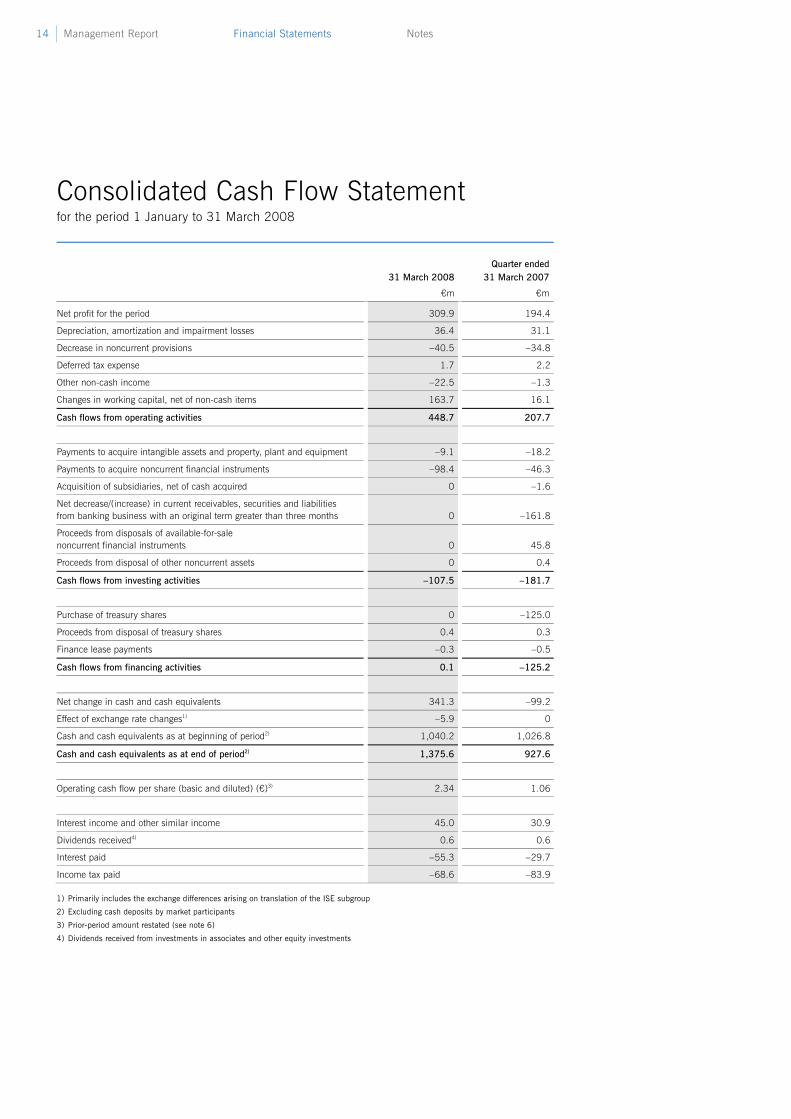
Consolidated Cash Flow Statement for the period 1 January to 31 March 2008
Quarter ended 31 March 2008 31 March 2007
€m €m
Net profit for the period 309.9 194.4
Depreciation, amortization and impairment losses 36.4 31.1
Decrease in noncurrent provisions – 40.5 – 34.8
Deferred tax expense 1.7 2.2
Other non-cash income – 22.5 – 1.3
Changes in working capital, net of non-cash items 163.7 16.1
Cash flows from operating activities 448.7 207.7
Payments to acquire intangible assets and property, plant and equipment – 9.1 – 18.2
Payments to acquire noncurrent financial instruments – 98.4 – 46.3
Acquisition of subsidiaries, net of cash acquired 0 – 1.6
Net decrease/(increase) in current receivables, securities and liabilities from banking business with an original term greater than three months 0 – 161.8
Proceeds from disposals of available-for-sale noncurrent financial instruments 0 45.8
Proceeds from disposal of other noncurrent assets 0 0.4
Cash flows from investing activities – 107.5 – 181.7
Purchase of treasury shares 0 – 125.0
Proceeds from disposal of treasury shares 0.4 0.3
Finance lease payments – 0.3 – 0.5
Cash flows from financing activities 0.1 – 125.2
Net change in cash and cash equivalents 341.3 – 99.2
Effect of exchange rate changes1) – 5.9 0
Cash and cash equivalents as at beginning of period2) 1,040.2 1,026.8
Cash and cash equivalents as at end of period2) 1,375.6 927.6
Operating cash flow per share (basic and diluted) (€)3) 2.34 1.06
Interest income and other similar income 45.0 30.9
Dividends received4) 0.6 0.6
Interest paid – 55.3 – 29.7
Income tax paid – 68.6 – 83.9
1) Primarily includes the exchange differences arising on translation of the ISE subgroup
2) Excluding cash deposits by market participants
3) Prior-period amount restated (see note 6)
4) Dividends received from investments in associates and other equity investments

Financial Statements 15
Consolidated Statement of Changes in Equity for the period 1 January to 31 March 2008
Quarter ended 31 March 2008 31 March 2007
€m €m
Subscribed capital
Balance as at 1 January 200.0 102.0
Retirement of treasury shares – 5.0 – 2.0
Balance as at 31 March 195.0 100.0
Share premium
Balance as at 1 January 1,242.0 1,340.0
Retirement of treasury shares 5.0 2.0
Balance as at 31 March 1,247.0 1,342.0
Treasury shares
Balance as at 1 January – 589.8 – 443.1
Purchase of treasury shares 0 – 125.0
Retirement of treasury shares 363.6 227.5
Sales within the Group Share Plan 0.7 0.6
Balance as at 31 March – 225.5 – 340.0
Revaluation surplus
Balance as at 1 January 32.1 12.9
Increase/(decrease) in share-based payments 2.2 0.3
Remeasurement of cash flow hedges – 14.7 0.1
Remeasurement of other financial instruments – 11.3 – 3.5
Deferred taxes on remeasurement of financial instruments 4.1 1.0
Balance as at 31 March 12.4 10.8
Accumulated profit
Balance as at 1 January 1,493.0 1,251.6
Net income for the period 304.2 192.3
Exchange rate differences and other adjustments – 105.3 – 1.3
Retirement of treasury shares – 363.6 – 227.5
Deferred taxes 34.5 0
Balance as at 31 March 1,362.8 1,215.1
Shareholders’ equity as at 31 March 2,591.7 2,327.9
Minority interests
Balance as at 1 January 312.9 19.9
Changes due to equity increases/reductions 0 0.9
Changes due to share in net gain of subsidiaries for the period 5.7 2.1
Exchange rate differences – 19.5 – 0.2
Balance as at 31 March 299.1 22.7
Total equity as at 31 March 2,890.8 2,350.6

16 Management Report Financial Statements Notes
Notes to the Interim Financial Statements 1. Accounting policies
These interim financial statements were prepared in accordance with the International Financial Reporting Standards (IFRSs) as adopted by the European Commission. The sig-nificant accounting policies applied by the Company to the consolidated financial state-ments for the year ended 31 December 2007 were also applied to the interim financial statements. In addition, IAS 34 (“Interim Financial Reporting”) was applied. In accordance with the provisions of WpHG (Wertpapierhandelsgesetz, German Securities Trading Act), these interim financial statements are supplemented by a Group interim management report. IFRIC 14 “IAS 19: The Limit on a Defined Benefit Asset, Minimum Funding Requirements and their Interaction”, which the IASB issued in 2007, is effective for financial years beginning on or after 1 January 2008. IFRIC 14 has not yet been endorsed by the EU. The first-time application therefore would have had no impact on Deutsche Börse Group’s interim financial statements and the conformity with IFRS as endorsed by the EU. 2. Group structure
The International Securities Exchange Holdings Inc. (ISE) was included in the consolidated financial statements as at 31 December 2007. The ISE subgroup’s income statement is included in the consolidated financial statements for the first time in the 2008 reporting period. On 26 March 2008, Deutsche Börse AG established Finnovation S.A., Luxembourg, a wholly owned subsidiary that was fully consolidated in the first quarter. Clearstream Services (UK) Ltd. was deconsolidated in the first quarter after its liquidation was completed.

Notes 17
3. Seasonal influences
The Group’s revenues are influenced more by the volatility and the transaction volume on the capital markets than by seasonal factors. Owing to a concentration of costs for projects only coming to completion in the fourth quarter, costs in the fourth quarter tend to be higher than in the first three quarters of the business year. 4. Total assets
The level of consolidated total assets depends to a significant extent on the open option transactions, bond forwards and repos settled via the central counterparty (CCP). The amount of receivables and the corresponding liabilities reported in relation to these trans-actions can fluctuate very widely on a daily basis in response to the actions of clearing members. The increase by €31.1 billion to €91.5 billion as at 31 March 2008 (31 De-cember 2007: €60.4 billion) is mainly due to the increase in volume of open repo trans-actions from €41.8 billion to €67.0 billion. Furthermore, the consolidated total assets of the Group are strongly influenced by the level of liabilities from banking business and, to a lesser extent, cash deposits by market partici-pants. The level of these two items, both of which reflect customer cash balances, can vary widely on a daily basis according to customers’ needs and actions. 5. Segment reporting
Composition of sales revenue by segment
Quarter ended 31 March 2008 31 March 2007
€m €m
Xetra 115.7 111.0
Eurex 271.5 178.3
Clearstream 188.9 186.9
Market Data & Analytics 44.6 41.7
Information Technology 23.8 25.2
Total 644.51) 543.1
Internal sales revenue Information Technology 102.0 98.6
1) Including sales revenue generated by ISE (ISE subgroup including synergy effects) in the amount of €59.6 million

18 Management Report Financial Statements Notes
Composition of net interest income from banking business
Quarter ended 31 March 2008 31 March 2007
€m €m
Gross interest income 132.4 84.0
Interest expense – 68.1 – 37.9
Total 64.3 46.1
Earnings before interest, tax and goodwill impairment (EBITA)
Quarter ended
31 March 2008 31 March 2007
€m €m
Xetra 72.4 69.9
Eurex 179.9 117.1
Clearstream 118.8 90.3
Market Data & Analytics 27.5 19.8
Information Technology 26.2 23.1
Corporate Services 1.5 – 19.2
Reconciliation – 0.5 – 0.7
Total 425.81) 300.3
1) Including EBITA generated by ISE (ISE subgroup including integration costs and synergy effects) in the amount of €32.8 million
Earnings before tax (EBT)
Quarter ended
31 March 2008 31 March 2007
€m €m
Xetra 72.4 69.9
Eurex 184.9 119.7
Clearstream 118.8 90.3
Market Data & Analytics 27.5 19.8
Information Technology 26.2 23.1
Corporate Services 10.0 – 18.7
Reconciliation – 0.4 – 0.7
Total 439.4 303.4

Notes 19
Investments in intangible assets, property, plant and equipment
Quarter ended 31 March 2008 31 March 2007
€m €m
Xetra 1.3 0.9
Eurex 4.1 4.2
Clearstream 1.6 3.3
Market Data & Analytics 0.2 0.5
Information Technology 4.2 11.0
Corporate Services 0.5 1.1
Reconciliation – 2.8 – 2.8
Total 9.1 18.2
Composition of depreciation, amortization and impairment losses (other than goodwill)
Quarter ended 31 March 2008 31 March 2007
€m €m
Xetra 2.5 2.4
Eurex 13.7 4.7
Clearstream 10.5 12.8
Market Data & Analytics 0.5 0.8
Information Technology 9.1 7.2
Corporate Services 2.5 5.7
Reconciliation – 2.4 – 2.5
Total 36.41) 31.1
1) Including depreciation, amortization and impairment losses of ISE in the amount of €10.4 million (of which intangible assets from
purchase price allocation: €9.2 million)
6. Earnings per share
Under IAS 33, earnings per share are calculated by dividing the net income for the period by the weighted average number of shares outstanding. On 8 June 2007, Deutsche Börse AG issued one bonus share for each existing share. The issue of bonus shares following a capital increase from share premium was resolved by the Annual General Meeting on 11 May 2007. The capital increase by €100 million, which increased the ordinary share capital to €200 million, was entered in the commercial register on 1 June 2007. The new shares carry dividend rights from the beginning of the 2007 financial year. In accordance with IAS 33, the number of ordinary shares outstanding before the issue of bonus shares is adjusted to present them as if the issue had occurred at the beginning of the earliest period presented. The prior-period figures have been restated accordingly.

20 Management Report Financial Statements Notes
There were the following potentially dilutive outstanding options or rights to purchase shares as at 31 March 2008:
Calculation of the number of potentially dilutive ordinary shares
Tranche Exercise price1) Adjusted exercise price in accordance
with IAS 33
Average number of outstanding options
Average price for the period2)
Number of potentially dilutive
ordinary shares
€ € 31 March 2008 € 31 March 2008
2004 26.88 26.88 20,454 110.99 31,000
2005 40.20 40.20 42,442 110.99 54,139
2006 65.62 69.24 55,790 110.99 41,971
20073) 0 56.63 106,222 110.99 52,024
20083) 0 95.27 51,011 110.99 7,224
1) The original issue prices of €51.84 for Tranche 2004 and €77.69 for Tranche 2005 were adjusted due to the reduction of the share
capital under the share buy-back program.
2) Volume-weighted average price of Deutsche Börse AG shares on Xetra for the period 1 January to 31 March 2008
3) This relates to allocated rights to shares (SBP shares) under the new Stock Bonus Program (SBP) launched in 2007 for senior executives
and Executive Board members. The number of SBP shares is determined by the business results and the degree to which targets have
been met. They have a two-year waiting period after they have been granted. Once the waiting period has expired, Deutsche Börse AG
may choose either to settle them in shares or in cash.
As the volume-weighted average share price was higher than the employees’ option-adjusted exercise prices, these options are considered dilutive under IAS 33. Earnings per share were unchanged due to the small number of potentially dilutive ordinary shares. There were no further rights to subscribe for shares that could have potentially diluted earnings per share either as at 31 March 2008 or as at 31 March 2007.
Calculation of earnings per share (basic and diluted) 31 March 2008 31 March 2007
Number of shares outstanding as at beginning of period 191,888,548 195,597,922
Number of shares outstanding as at 31 March 191,898,568 194,022,542
Weighted average number of shares outstanding 191,888,658 195,129,782
Number of potentially dilutive ordinary shares 186,358 149,944
Weighted average number of shares used to compute diluted earnings per share 192,075,016 195,279,726
Net income for the period (€m) 304.2 192.3
Earnings per share (basic and diluted) (€) 1.58 0.98
Notes 21
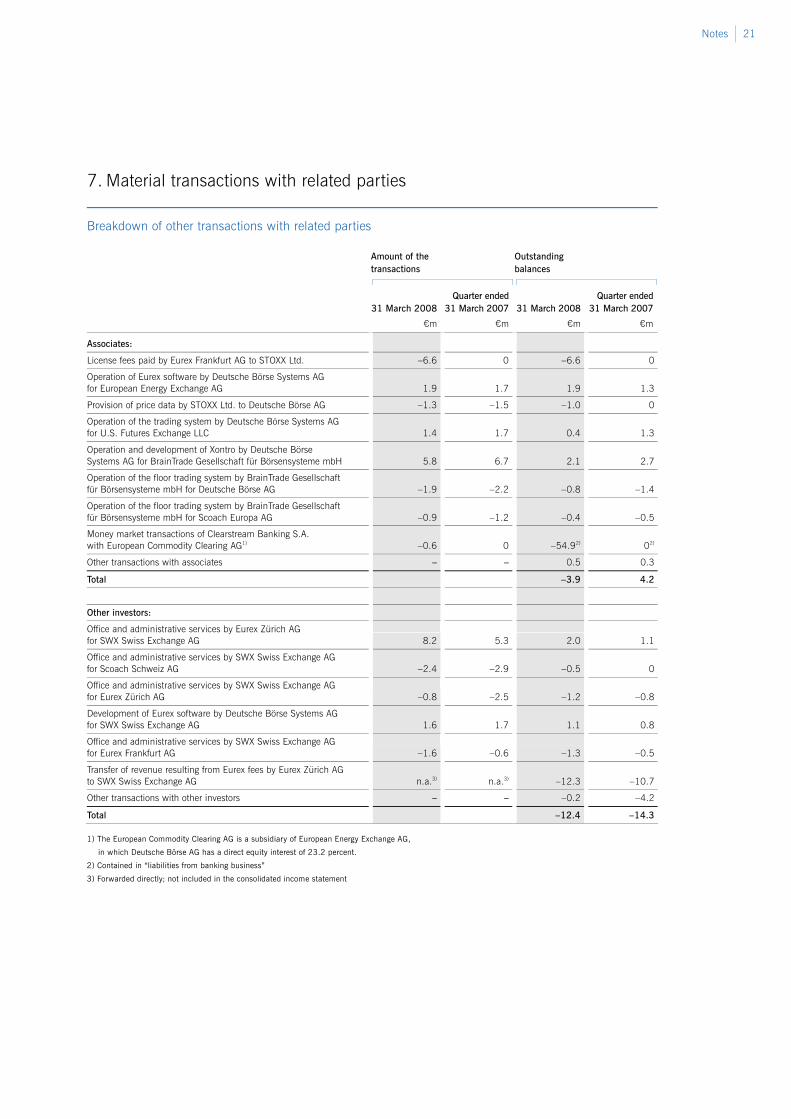
7. Material transactions with related parties
Breakdown of other transactions with related parties
Amount of the transactions
Outstanding balances
Quarter ended Quarter ended 31 March 2008 31 March 2007 31 March 2008 31 March 2007
€m €m €m €m
Associates:
License fees paid by Eurex Frankfurt AG to STOXX Ltd. – 6.6 0 – 6.6 0
Operation of Eurex software by Deutsche Börse Systems AG for European Energy Exchange AG 1.9 1.7 1.9 1.3
Provision of price data by STOXX Ltd. to Deutsche Börse AG – 1.3 – 1.5 – 1.0 0
Operation of the trading system by Deutsche Börse Systems AG for U.S. Futures Exchange LLC 1.4 1.7 0.4 1.3
Operation and development of Xontro by Deutsche Börse Systems AG for BrainTrade Gesellschaft für Börsensysteme mbH 5.8 6.7 2.1 2.7
Operation of the floor trading system by BrainTrade Gesellschaft für Börsensysteme mbH for Deutsche Börse AG – 1.9 – 2.2 – 0.8 – 1.4
Operation of the floor trading system by BrainTrade Gesellschaft für Börsensysteme mbH for Scoach Europa AG – 0.9 – 1.2 – 0.4 – 0.5
Money market transactions of Clearstream Banking S.A. with European Commodity Clearing AG1) – 0.6 0 – 54.92) 02)
Other transactions with associates – – 0.5 0.3
Total – 3.9 4.2
Other investors:
Office and administrative services by Eurex Zürich AG for SWX Swiss Exchange AG 8.2 5.3 2.0 1.1
Office and administrative services by SWX Swiss Exchange AG for Scoach Schweiz AG – 2.4 – 2.9 – 0.5 0
Office and administrative services by SWX Swiss Exchange AG for Eurex Zürich AG – 0.8 – 2.5 – 1.2 – 0.8
Development of Eurex software by Deutsche Börse Systems AG for SWX Swiss Exchange AG 1.6 1.7 1.1 0.8
Office and administrative services by SWX Swiss Exchange AG for Eurex Frankfurt AG – 1.6 – 0.6 – 1.3 – 0.5
Transfer of revenue resulting from Eurex fees by Eurex Zürich AG to SWX Swiss Exchange AG n.a.3) n.a.3) – 12.3 – 10.7
Other transactions with other investors – – – 0.2 – 4.2
Total – 12.4 – 14.3
1) The European Commodity Clearing AG is a subsidiary of European Energy Exchange AG,
in which Deutsche Börse AG has a direct equity interest of 23.2 percent.
2) Contained in “liabilities from banking business”
3) Forwarded directly; not included in the consolidated income statement
22 Management Report Financial Statements Notes
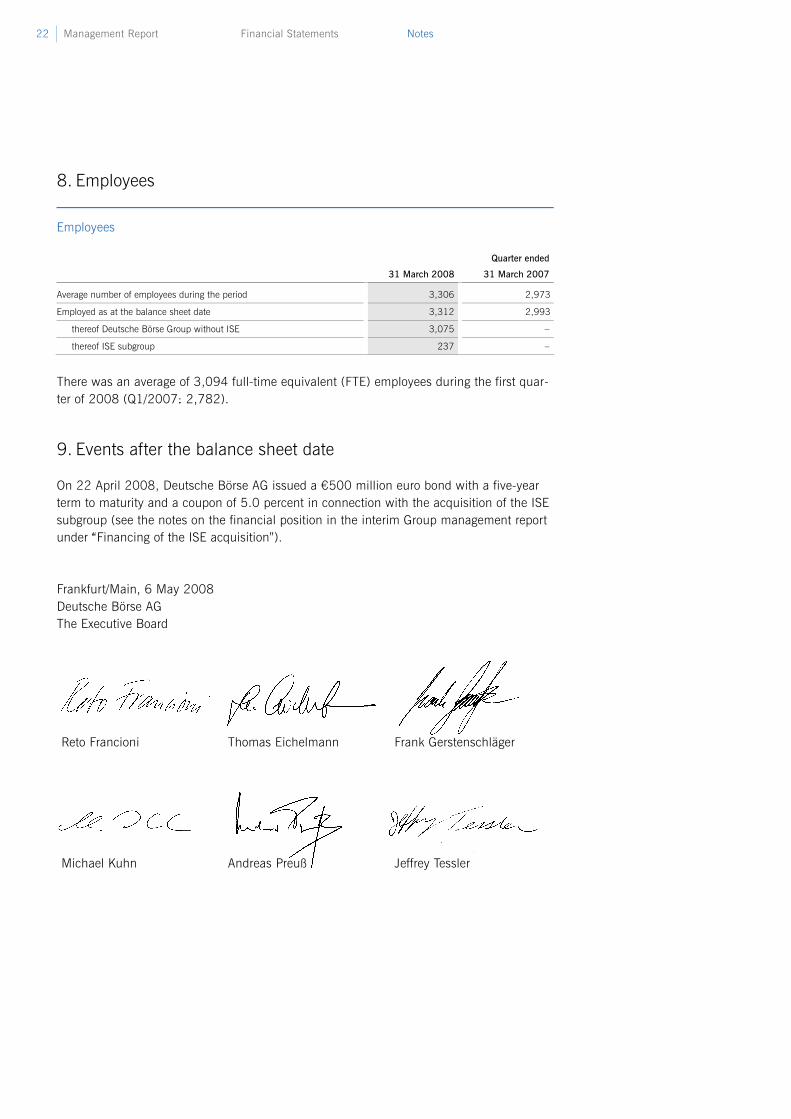
8. Employees
Employees
Quarter ended
31 March 2008 31 March 2007
Average number of employees during the period 3,306 2,973
Employed as at the balance sheet date 3,312 2,993
thereof Deutsche Börse Group without ISE 3,075 –
thereof ISE subgroup 237 –
There was an average of 3,094 full-time equivalent (FTE) employees during the first quar-ter of 2008 (Q1/2007: 2,782). 9. Events after the balance sheet date
On 22 April 2008, Deutsche Börse AG issued a €500 million euro bond with a five-year term to maturity and a coupon of 5.0 percent in connection with the acquisition of the ISE subgroup (see the notes on the financial position in the interim Group management report under “Financing of the ISE acquisition”). Frankfurt/Main, 6 May 2008 Deutsche Börse AG The Executive Board
Reto Francioni Thomas Eichelmann Frank Gerstenschläger
Michael Kuhn Andreas Preuß Jeffrey Tessler
Contact Investor Relations Phone +49-(0) 69- 2 11-1 16 70 Fax +49-(0) 69- 2 11-1 46 08 E-mail [email protected] www.deutsche-boerse.com/ir_e Additional copies of this interim report and the annual report 2007 may be obtained from the publications hotline of Deutsche Börse Group. Phone +49-(0) 69- 2 11-1 15 10 Fax +49-(0) 69- 2 11-1 15 11 Downloads at www.deutsche-boerse.com Reproduction – in whole or in part – only with the written permission of the publisher Registered trademarks DAX®, Eurex®, Euro GC Pooling®, FWB®, TRICE®, Xetra®, Xetra BEST®, Xetra-Gold® and XTF Exchange Traded Funds® are registered trademarks of Deutsche Börse AG. CFF® is a registered trademark of Clearstream International S.A. Dow Jones STOXX® and Dow Jones EURO STOXX 50® are registered trademarks of STOXX Ltd.

Published byDeutsche Börse AG60485 Frankfurt/MainGermanywww.deutsche-boerse.com
May 2008Order number 1010-2617
DtB_ZB_01-08_01_neu:Layout 1 25.04.2008 14:10 Uhr Seite 4