interim report quarter 1 / 2015 - deutsche börse · deutsche börse group: key figures quarter...
TRANSCRIPT

www.deutsche-boerse.com
Interim reportQuarter 1 / 2015

Deutsche Börse Group: key figures
Quarter ended 31 Mar 2015 31 Mar 2014
Consolidated income statement
Net revenue (total revenue less volume-related costs) €m 600.1 516.71)
Net interest income from banking business €m 8.4 10.91)
Operating costs €m – 293.0 – 247.8
Earnings before interest and tax (EBIT) €m 312.3 343.01)
Net income for the period €m 222.3 229.61)
Earnings per share (basic) € 1.21 1.251)
Consolidated cash flow statement
Cash flows from operating activities excluding CCP positions €m 258.4 53.2
Consolidated balance sheet (as at 31 March)
Non-current assets €m 14,576.3 11,625.41)
Equity €m 4,099.0 3,580.71)
Non-current interest-bearing liabilities €m 1,460.7 1,522.7
Performance indicators
Employees (average FTEs for the period) 4,431 3,753
EBIT margin, based on net revenue % 52 551) 2)
Tax rate % 26.0 26.03)
Gross debt / EBITDA 1.2 1.33)
Interest coverage ratio % 32.0 28.61)
The shares
Opening price4) € 59.22 60.20
High5) € 77.39 63.29
Low5) € 58.65 54.80
Closing price (as at 31 March) € 76.06 57.77
Market indicators
Eurex
Number of contracts m 543.8 540.9
Xetra and Börse Frankfurt
Trading volume (single-counted) €bn 412.7 331.9
Clearstream
Value of securities deposited (average for the period) €bn 13,158 12,045
Number of transactions m 37.3 33.1
Global Securities Financing (average outstanding volume for the period) €bn 628.4 580.0
Transparency and stability key figures
Proportion of companies listed in the Prime Standard (for shares) as a percentage of all listed companies6) % 87 83
Number of calculated indices 10,657 10,706
Number of sustainable index concepts 25 23
Availability of the cash market trading system (Xetra®) % 100 100
Availability of the derivatives market trading and clearing system of Eurex Exchange % 99.876 99.999
Market risk cleared via Eurex Clearing (gross monthly average) €bn 18,047 18,974
1) Figures restated: they also include interest income and expenses in the Eurex segment and a one-off gain of €10.6 million resulting from the adjustment of the fair value of the consideration transferred in connection with the acquisition of EEX as at 1 January 2014, which was reported in Q3/2014.
2) Adjusted for non-recurring earnings in connection with the merger of Direct Edge Holdings, LLC (Direct Edge) and BATS Global Markets, Inc. (BATS) 3) Adjusted for non-recurring items in connection with the merger of Direct Edge and BATS 4) Closing price on preceding trading day 5) Intraday price 6) Market capitalisation of companies listed in the Prime Standard (shares) in relation to the market capitalisation of all companies listed on the Frankfurt Stock
Exchange
Due to rounding, numbers presented throughout this document may not add up precisely to the totals provided and percentages may not precisely reflect the absolute figures.

3 Group management report
In a market environment supportive to trading, the Group recorded growth in all segments: net revenue increased by 16 per cent to €600.1 million (Q1/2014: €516.7 million). Operating costs totalled €293.0 million (Q1/2014: €247.8 million). Basic earnings per share amounted to €1.21 for an aver-age of 184.2 million shares, adjusted for non-recurring items to €1.24 (Q1/2014: €1.25 for 184.1 million shares; adjusted: €1.00).
The forecast range for net revenue in 2015 was adjusted upwards by €100 million, the forecast for operating costs by €50 million, as well as the forecast range for EBIT and net income by €50 million each.
As at 1 January 2015, EEX became the majority shareholder in Powernext SA. On 17 April, EPEX Spot SE, an EEX subsidiary, and APX Group announced that they intend to form a power exchange for Central Western Europe and the UK.
A dividend of €2.10 per share will be proposed to the Annual General Meeting on 13 May 2015. Carsten Kengeter has been a member of the Executive Board of Deutsche Börse since 4 April 2015.
He will take over the role of CEO effective 1 June 2015.
Q1/2015: Deutsche Börse Group’s grows in all segments and increases net revenue
Development of Deutsche Börse AG shares since the beginning of Q1/2015
0
10060
80
40
200
19.1
.-23.1
.
26.1
.-30.1
.
2.2
.-6.2
.
9.2
.-13.2
.
23.2
.-27.2
.
2.3
.-6.3
.
9.3
.-13.3
.
16.3
.-20.3
.
23.3
.-27.3
.
30.3
.-2.4
.
7.4
.-10.4
.
2.1
.
5.1
.-9.1
.
12.1
.-16.1
.
16.2
.-20.2
.
13.4
.-17.4
.
1) Index-linked, closing price on 30 December 2014
STOXX® Europe 600 Financials1)
Order book turnover of Deutsche Börse sharesDaily Deutsche Börse closing share priceDAX® performance1)
Quoted price € Turnover €m

4 Deutsche Börse Group interim report Q1/2015
Basic principles of the Group
The fundamental information about the Group described on pages 86 to 99 of the 2014 corporate report is still valid in principle. However, there have been changes to the basis of consolidation. To en-hance comparability between the first quarter of 2015 and the same period of the previous year, the changes to the basis of consolidation since 1 April 2014 are presented in addition to the changes in the reporting period. Changes to the basis of consolidation
Effective 1 January 2015, European Energy Exchange AG (EEX), Leipzig, Germany, acquired an interest of 53.34 per cent in Powernext SA, Paris, France, in exchange for 36.75 per cent of the shares of EPEX Spot SE, Paris, France. EEX increased its interest in Powernext SA to 55.8 per cent as a result of this transaction. As Powernext SA in turn holds 50 per cent of EPEX Spot SE, EEX also obtained a controlling interest in EPEX Spot SE and its two subsidiaries, EPEX Spot Schweiz AG, Zurich, Switzerland, and JV Epex-Soops B.V., Amsterdam, the Netherlands. All subsidiaries have been included in full in the consoli-dated financial statements since 1 January 2015. Clearstream Global Securities Services Limited (CGSS, formerly Citco Global Securities Services Ltd.), a hedge fund custody infrastructure operator, was acquired by Clearstream and has been consolidated since 3 October 2014. While revenue and costs have been allocated to the Clearstream segment since that date, the assets managed by CGSS are being included in Clearstream’s figures successively as the migration of the customer accounts progresses. Report on the economic position
Macroeconomic and sector-specific environment
The company’s business operations and macroeconomic and sector-related environment have not changed significantly compared with the presentation in the 2014 corporate report (pages 99 to 100 and 104 to 105). The main central banks maintained the strongly expansionary focus of their monetary policy in the first quarter of 2015. The European Central Bank (ECB) left its key interest rate at a histori-cally low level. Since September 2014, it has imposed a negative rate of 0.2 per cent on commercial bank deposits. In addition, the ECB initiated a programme for purchasing government bonds and other securities (quantitative easing) in March, under which it plans to purchase securities amounting to €60 billion per month to increase market liquidity and prevent deflation. The Federal Reserve Bank (the US central bank) also maintained its low interest rate policy in the first quarter of 2015. However, the market expects that the Federal Reserve will end its loose monetary policy before the ECB does. Stock market volatility, which is one of the main drivers of the Group’s trading business, was higher in the first quarter of 2015 than in the first quarter of 2014. Overall, the Group’s business environment has improved significantly since the end of the third quarter of 2014 thanks to the increase in volatility.
Group interim management report
5 Group management report
Other events in the first quarter of 2015 also led to additional trading impulses on the markets, such as the Swiss National Bank’s decision to discontinue its minimum exchange rate of CHF 1.20 per euro. Nevertheless, the capital market environment remains challenging for financial services providers and hence also for Deutsche Börse Group. Political conflict and economic instability in parts of Europe con-tinue to prevail and market participants remain cautious in view of the regulatory measures affecting the financial markets. According to its study published in April, the International Monetary Fund (IMF) expects economic activi-ty to increase by around 1.5 per cent in the euro zone as a whole in 2015 (January 2015: increase of 1.2 per cent) and to expand by around 1.6 per cent in Germany (January 2015: 1.3 per cent). The study forecasts economic growth of around 2.7 per cent in the UK (January 2015: 2.7 per cent) and of around 3.1 per cent in the USA (January 2015: 3.6 per cent). The IMF still forecasts the highest growth by far in 2015 – approximately 6.6 per cent – in Asian countries, and especially China, in anticipation of high domestic demand there. As a result of the divergence in estimates for the different economic regions, global economic growth is projected to be around 3.5 per cent in 2015. Thus, the IMF’s study shows that the situation in Europe recovered slightly better than it had been expected at the beginning of the year. There were no changes in the Group’s corporate strategy and management in the first quarter. For a comprehensive presentation, please refer to the details provided in the 2014 corporate report (pages 90 to 94). Research and development
As a service provider, Deutsche Börse Group does not engage in research and development activities comparable with those of manufacturing companies. However, Deutsche Börse does develop and operate its own trading and clearing systems as well as system solutions to achieve its structural growth objectives. Against this background, the company is constantly working to maintain and fur-ther increase the technology leadership and stability of its electronic systems – in the interests of its customers and the systemic stability of financial markets. This is why Deutsche Börse has significantly overhauled its trading and clearing systems, which go by the trade names T7 and C7. Other technically challenging projects include implementing the European Central Bank’s plans to create a uniform securities settlement throughout the EU (TARGET2-Securities). Further product and services develop-ment activities are described in more detail in the report on opportunities and in the report on ex-pected developments. Results of operations
Results of operations in the first quarter of 2015 In the cash and derivatives markets, there seems to be a gradual return of investor confidence in the euro zone. Investment capital that had been withdrawn from some European countries in the course of the euro currency crisis and the debt crisis and invested in the USA or Asia returned to Europe, leading to a significant increase in trading activity. In addition, exchange rate effects, especially the euro’s weak-ening against the US dollar, and higher index levels of the Group’s benchmark DAX® and STOXX® indices have provided additional momentum for some business areas. The cash market benefited, furthermore, from the ECB’s quantitative easing programme and the Swiss National Bank’s decision to discontinue the minimum exchange rate for the Swiss franc. The return of capital to euro products was also evident in the derivatives market, where equity index derivatives in particular experienced sharp growth. The upward trend in Clearstream’s business continued, with the volume of securities under custody rising to a record level in the first quarter; this was due to the continuing price gains of shares in the domestic

6 Deutsche Börse Group interim report Q1/2015
German market, to the devaluation of the euro against the US dollar and to additional business, among other factors. In addition, Clearstream recorded sustainable growth in its global securities financing ser-vices. The liquidity management services offered allow banks to deploy their capital and collateral as efficiently as possible. Deutsche Börse Group’s technology and market data business (Market Data + Services segment) also showed significant growth. Thus, Deutsche Börse Group’s net revenue rose by 16 per cent year-on-year to €600.1 million in total (Q1/2014: €516.7 million). The additional revenue from the consolidation of Powernext amounted to €17.8 million; Clearstream Global Securities Services Limited contributed revenue amounting to €6.1 million. Net revenue is composed of sales revenue plus net interest income from banking business and other operating income, less volume-related costs. Net interest income from banking business went down to €8.4 million in the first quarter of 2015 (Q1/2014: €10.9 million). In addition to income from the Clearstream segment, net interest income has also included interest income and expenses in the Eurex segment since the first quarter of 2015. This income is generated by the Group’s clearing houses from investing their clients’ cash collateral. Interest income and expenses were previously reported in the financial result. Prior-year figures have been restated accordingly in both cases. Operating costs amounted to €293.0 million, significantly above the previous year’s first quarter (Q1/2014: €247.8 million). In addition to consolidation effects of €16.0 million described above (see the “Changes to the basis of consolidation” section), this is primarily attributable to the scheduled increase in expenses for growth initiatives and infrastructure projects of €12.9 million. Exchange rate effects led to additional costs of €7.5 million and the Stock Bonus Plan (SBP), which is linked to Deutsche Börse’s share price performance, incurred higher costs of €7.2 million. However, various effects partially offset the increase of operating costs. The result from equity investments amounted to €5.2 million (Q1/2014: €74.1 million). The high level of the previous year’s result is attributable to non-recurring income of €62.7 million in connection with the merger of Direct Edge Holdings, LLC (Direct Edge) and BATS Global Markets, Inc. (BATS) at the
Net revenue and EBIT by quarter Composition of net revenue by segment
€ millions
Net revenueEBIT
Q1 / 2014 Q2 / 2014 Q3 / 2014 Q4 / 2014 Q1 / 2015
516.7491.2 495.6
544.3
600.1
343.0
238.6 221.6 208.1
312.3
600.1
516.7
€ millions
111.8
93.6
190.8
169.9
49.2
43.5
248.3209.7
Market Data + Services
Clearstream
Xetra
Eurex
Q1 / 2014 Q1 / 2015

7 Group management report
end of January 2014 and a one-off gain of €10.6 million resulting from the adjustment of the fair value of the consideration transferred in connection with the acquisition of EEX as at 1 January 2014, which was reported in Q3/2014. The Q1/2014 figures were restated accordingly. Adjusted for a non-recurring gain of €5.3 million due to the remeasurement of the shares in EPEX Spot SE in the course of the initial consolidation of Powernext SA as well as an impairment loss on the shares in Quadriserv Inc. amounting to €1.7 million, the result from equity investments was €1.6 million in Q1/2015 (Q1/2014: €0.8 million). The development of net revenue and operating costs resulted in EBIT of €312.3 million in the first quar-ter of 2015 (Q1/2014: €343.0 million including the one-off gains related to the merger of Direct Edge and BATS and the acquisition of EEX). Adjusted for non-recurring items, EBIT in Q1/2015 was €319.2 million (Q1/2014: €274.1 million). The Group’s financial result for the first quarter of 2015 improved to €5.7 million (Q1/2014: €–13.4 million). The significant year-on-year improvement was due to a positive exchange rate effect of €18.1 million in connection with a rise in the amount of US dollars held. The Group has accumulated these holdings over the past months and intends to use them to repay a bond of US$170 million matur-ing in June 2015. The adjusted tax rate in the first quarter of 2015 was 26.0 per cent (Q1/2014: 26.0 per cent, adjusted for non-recurring income related to the merger of Direct Edge and BATS). Consolidated net income for the first quarter of 2015 amounted to €222.3 million (Q1/2014: €229.6 million). Adjusted for special items, net income for the period was at €228.6 million (Q1/2014: €184.7 million). Basic earnings per share, based on the weighted average of 184.2 million shares outstanding, amount-ed to €1.21 in the first quarter of 2015 (Q1/2014: €1.25 for 184.1 million shares outstanding). Ad-justed for special items, basic earnings per share improved to €1.24 (Q1/2014: €1.00). Comparison of results of operations with the forecast for 2015 Deutsche Börse Group lifts its forecast range for financial year 2015 (see this interim report’s report on expected developments for details). This is due to the Group’s business development, which has been better than expected, the consolidation of APX Group and the strong appreciation of the US dol-lar vis-à-vis the euro.
Deutsche Börse AG share: key figures
Quarter ended 31 Mar 2015 31 Mar 2014 Earnings per share (basic) € 1.21 1.25
Earnings per share (basic, adjusted) € 1.24 1.00
Opening price1) € 59.22 60.20
High2) € 77.39 63.29
Low2) € 58.65 54.80
Closing price (as at 31 Mar) € 76.06 57.77
Number of shares (as at 31 Mar) m 193.0 193.0
Market capitalisation (as at 31 Mar) €bn 14.7 11.1
1) Closing price on preceding trading day 2) Intraday price

8 Deutsche Börse Group interim report Q1/2015
Eurex segment
Net revenue in the Eurex segment increased by 18 per cent year-on-year to €248.3 million (Q1/2014: €209.7 million). Thereof, €16.5 million was attributable to transaction fees and other revenue of Powernext which was consolidated for the first time.
EBIT amounted to €131.1 million (Q1/2014: €181.3 million). In the prior-year quarter, €62.7 million was attributable to non-recurring income that Deutsche Börse Group generated as a result of a revalua-tion of its shares in Direct Edge in connection with the merger of Direct Edge and BATS. €10.6 million was attributable to a one-off gain resulting from the adjustment of the fair value of the consideration transferred in connection with the acquisition of EEX as at 1 January 2014, which was reported in Q3/2014. The Q1/2014 figures were restated accordingly.
Powernext, in which Eurex subsidiary European Energy Exchange AG (EEX) holds a 55.8 per cent in-terest, has been consolidated since the first quarter of 2015; consequently, transaction fees and other revenue as well as costs are reported in the Eurex segment. The derivatives market environment in the first quarter of 2015 was more favourable than in the same period of the previous year: the higher equity market volatility and the gradual return of confidence in the European capital market among investors led to a year-on-year rise in trading activity among market participants. This trend particularly benefited equity index derivatives with futures and options on EURO STOXX and DAX index products. Added to this were macroeconomic developments, which led to addi-tional hedging requirements among investors. These included the low oil price and the appreciation of the Swiss franc following the Swiss National Bank’s decision to discontinue the minimum exchange rate. The number of futures and options contracts traded on the Eurex derivatives market rose by a total of 10 per cent to 416.2 million contracts (Q1/2014: 378.4 million). Including the International Securities Exchange (ISE), which showed a year-on-year decline in traded contracts in the first quarter of 2015, the trading volume in the Eurex segment was 543.8 million contracts (Q1/2014: 540.9 million). Equity index derivatives remained the highest-volume product group on the Eurex derivatives exchange; the number of traded contracts increased by 19 per cent in the first quarter of 2015 to 214.4 million (Q1/2014: 180.3 million). Net revenue from trading and clearing equity index derivatives also rose by 19 per cent to €102.8 million (Q1/2014: €86.1 million). However, trading volumes for European in-terest rate derivatives slightly declined to 123.9 million contracts in the first quarter of 2015 (Q1/2014: 127.0 million) due to persistently low interest rates, the ECB’s programme of large-scale government bond purchases and the unlikelihood of a change in the ECB’s loose monetary policy in the near future. Net revenue remained stable at €45.6 million (Q1/2014: €45.7 million). Volumes in the equity derivatives product group were up 9 per cent to 74.8 million contracts in the first quarter of 2015 (Q1/2014: 68.7 million); net revenue increased to €9.9 million (Q1/2014: €8.8 million). Volatility derivatives also continued to perform well. With 3.0 million contracts traded in the first quarter of 2015, the number increased by 27 per cent year-on-year (Q1/2014: 2.4 million). Derivatives on French and Italian government bonds achieved volumes of 13.2 million traded contracts, increasing by 63 per cent year-on-year (Q1/2014: 8.0 million). These products were introduced on Eurex in 2009 to round off the exchange’s long-term European interest rate derivatives offering.

9 Group management report
Breakdown of net revenue in the Eurex segment
The number of US options contracts on ISE decreased by 21 per cent year-on-year in the first quarter of 2015 to 127.6 million (Q1/2014: 162.5 million); the market share declined from 16.5 per cent to 14.1 per cent. Other established options exchanges, such as Amex or Arca, also lost market share in the first quarter of 2015. The beneficiaries were young exchanges, such as BATS or the MIAX Options Exchange, which used special incentive programmes to attract more order flow to their platforms. Gemini, the ISE marketplace geared primarily towards the trading requirements of private investors, has now firmly established itself as the second ISE trading platform for US options. ISE is planning to launch a third trading segment, ISE Mercury, to access further market segments in the future. The plan is for ISE Mercury to commence trading in the second half of 2015; like ISE and ISE Gemini, it will use Deutsche Börse Group’s existing T7 technology platform. Because revenue per traded contract remained relatively stable and due to exchange rate effects, ISE’s net revenue decreased only slightly to €21.4 million (Q1/2014: €22.4 million). Effective 1 January 2015, EEX became the majority shareholder in Powernext SA. This will enable it to further expand its position as a central marketplace for energy and energy-related products. Since then, trading in natural gas products has been pooled at Powernext under the brand PEGAS®. Through its investment in Powernext, EEX indirectly also became the majority shareholder in EPEX Spot, which op-erates the power spot markets covering Germany/Austria, France and Switzerland. Moreover, the power exchanges EPEX Spot and APX Group announced on 17 April that they intend to integrate their busi-nesses in order to form a power exchange for Central Western Europe and the UK. (For details, see the report on post-balance sheet date events). EEX recorded a very good first quarter. The volumes on the power spot and derivatives markets in-creased by 76 per cent to 786.7 TWh (Q1/2014: 445.8 TWh); in particular, the new products of EEX contributed to this growth. Trading volumes of gas products on the PEGAS platform doubled to 243.9 TWh (Q1/2014: 121.4 TWh). In both, the power and the gas markets, EEX attracted off-exchange (over-the-counter, OTC) trading volumes to its on-exchange trading platforms, thus winning market share at the expense of OTC trading. In emission rights trading, 161.4 tonnes of CO2 were traded, a decline of 28 per cent on the corresponding quarter in the previous year (Q1/2014: 223.6 tonnes of CO2). This development was influenced in particular by the European Commission’s decision to establish a market stability reserve to reduce supply on the market and thus increase prices.
248.3
209.7
€ millions
38.0
15.2
21.3
20.5
9.3
11.021.4
22.4 9.9
8.845.6
45.7
102.886.1
Commodities 1)
Other
Repo
US options
European equity derivatives
European interest rate derivatives
European index derivatives
1) Products traded at EEX and Eurex
Q1 / 2014 Q1 / 2015

10 Deutsche Börse Group interim report Q1/2015
Overall, through EEX and Powernext, net revenue in the commodities area more than doubled in the Eurex segment, to €38.0 million (Q1/2014: €15.2 million). In the first quarter of 2015, the average outstanding volume on Eurex Repo®, the marketplace for the collateralised money market as well as for the GC Pooling® (General Collateral Pooling) offering, in-creased by 9 per cent to €206.4 billion (Q1/2014: €188.5 billion, single-counted for both periods). Demand from investors for collateralised money market transactions again resulted in a positive trend of GC Pooling. Here, the average outstanding volume increased by 13 per cent to €168.3 billion (Q1/2014: €148.7 billion). In the euro repo market, average outstanding volumes were €38.1 billion, down 4 per cent on the prior-year quarter (Q1/2014: €39.8 billion, single-counted for both periods). Since the Swiss National Bank (SNB) has not carried out any monetary policy measures in repo and money mar-ket instruments since August 2011 and the outstanding Eurex Repo volume has expired, there will be no specific product offering in cooperation with the SNB in the foreseeable future. Consequently, the volume on the repo market in Swiss francs is no longer reported separately. As part of the GC Pooling offering, investors have been able to enter into transactions not only in euros and US dollars, but also in Swiss francs since December 2014. Net revenue in the repo business decreased to €9.3 million (Q1/2014: €11.0 million).
Eurex segment: key indicators Q1/2015 Q1/2014 Change Financial derivatives m contracts m contracts %
Total Eurex and ISE1) 543.8 540.9 1
European derivatives1) 2) 416.2 378.4 10
European equity index derivatives3) 214.4 180.3 19
European interest rate derivatives 123.9 127.0 – 2
European equity derivatives3) 74.8 68.7 9
US options (ISE) 127.6 162.5 – 21
Commodities4)5) TWh / m t C02 TWh / m t C02 %
Electricity 786.7 445.86) 76
Gas 243.9 121.4 101
Emissions trading 161.4 223.6 – 28
Repo business7)
8) €bn €bn %
Total Eurex Repo 206.4 188.5 9
GC Pooling® 168.3 148.7 13
Euro market 38.1 39.8 – 4
1) Prior-year figures adjusted for flexible options and EEX trading volume in derivatives which is now reported at EEX under Commodities (–0.2 million contracts in total).
2) The total shown does not equal the sum of the individual figures as it includes other traded products such as ETFs, volatility, agricultural and precious metals derivatives.
3) Dividend derivatives have been allocated to the equity index and equity derivatives. 4) Volume traded on EEX in terawatt-hours (TWh) for power and gas trading and in CO2 tonnes for trading in emission rights 5) Including volumes traded on Powernext, respectively EPEX; prior-year figures have been adjusted accordingly. 6) Thereof, 95.5 TWh are attributable to power trading at EPEX. 7) Average outstanding volume on Eurex Repo® (single-counted) 8) Since the Swiss National Bank no longer offers money market instruments through Eurex Repo, the volume in Swiss francs has ceased with immediate effect. The
average outstanding volumes on the repo market in Swiss francs amounted to €28.2 billion in the first quarter of 2014.
11 Group management report
EurexOTC Clear, the Eurex clearing offering for over-the-counter interest rate swaps, gained more new members, with leading national and international banks and asset managers joining in the first quarter, e.g. Landesbank Baden-Württemberg and Natixis, the corporate and investment banking arm of French Groupe BPCE. The total number of clearing members as at 31 March 2015 was 41; in total, around 75 customers have signed up for a connection. By being connected to EurexOTC Clear, market partici-pants can clear OTC interest rate swaps in advance of the introduction of a clearing obligation for these financial instruments when the European Market Infrastructure Regulation (EMIR) is implemented. In the first quarter of 2015, transactions totalling €76.7 billion were cleared via EurexOTC Clear (Q1/2014: €16.7 billion). As part of its expansion into Asia, Deutsche Börse Group received ‘in-principle’ regulatory clearance from the local financial supervisory authority in January 2015 to set up a clearing house in Singapore. The clearing house is expected to begin operations in 2016. Market participants will then be able to trade and clear Eurex’s benchmark derivatives during Asian trading hours, among others. Xetra segment
Net revenue rose by 13 per cent to €49.2 million (Q1/2014: €43.5 million). Deutsche Börse increased its EBIT by 16 per cent to €31.8 million (Q1/2014: €27.5 million).
Deutsche Börse Group’s cash market saw a very strong first quarter in 2015. After investors had with-drawn capital from Europe in recent years in the course of the debt crisis in certain European states, it is now gradually flowing back to Europe – particularly from the USA, where many investors expect to see interest rate policy reverse in the course of the year. German companies’ relatively good results of opera-tions and the stable economic environment make Germany an attractive destination for investors – something that is reflected in the record levels of the benchmark DAX index, among other things. In addition to the higher volatility compared with the previous year, the ECB’s low interest rate policy and its programme for purchasing government bonds and other securities, which was resolved in January and began in March, is also boosting trading activity in the cash market. As a result, March was the strongest month in a very good quarter overall. Trading volumes on Xetra® increased by 25 per cent year-on-year to €395.2 billion (Q1/2014: €316.3 billion). In the first quarter of 2015, the number of Xetra transactions increased by 11 per cent year-on-year to 61.4 million (Q1/2014: 55.5 million). The average value per transaction was €12.9 thousand (Q1/2014: €11.4 thousand). The Xetra segment generated a total of €32.9 million in net revenue from trading (Q1/2014: €28.2 million). The net reve-nue of the central counterparty for equities increased year-on-year in the first quarter, to €9.0 million (Q1/2014: €8.2 million). Other net revenue remained stable at €7.3 million (Q1/2014: €7.1 million).

12 Deutsche Börse Group interim report Q1/2015
With a trading volume of €17.5 billion in the first quarter of 2015, the Frankfurt Stock Exchange saw an increase of 12 per cent as against the previous year (Q1/2014: €15.6 billion). To raise the profile of equities among the public as an investment form and instrument for retirement provision, Deutsche Börse participated in the “Tag der Aktie” (“Equity Day”) on 16 March. On this date, investors were able to invest free of fees in DAX shares and selected DAX ETFs via participating banks and brokers. The order book turnover for DAX shares was six times higher than the daily average since the start of the year, while that for DAX ETFs saw an 18-fold increase. On Tradegate Exchange, which is operated by a company in which Deutsche Börse holds a majority interest, investors traded securities with a volume of €24.0 billion in the first quarter of 2015, a 52 per cent increase year-on-year (Q1/2014: €15.7 billion). Fifteen years ago, Deutsche Börse introduced a then little known investment product to Europe: exchange-traded funds (ETFs). On 11 April 2000, it launched trading in two ETFs on European indices. Thanks to their high level of transparency and favourable cost structure, ETFs have become a popular investment instrument among professional investors and, increasingly, private investors. As at 31 March 2015, a total of 1,055 ETFs were listed on Deutsche Börse (31 March 2014: 1,018 ETFs), meaning that it offers by far the largest selection of ETFs of all the European exchanges. The investment opportunities offered by exchange-traded funds now cover equity markets in many different regions and sectors, as well as numerous asset classes, including bonds, commodities and volatility. The fund assets under management held by ETF issuers reached a new record high of €345.4 billion (Q1/2014: €236.7 billion). The segment’s trading volume increased by 51 per cent to €51.1 billion in the first quarter of 2015 (Q1/2014: €33.8 billion) – also a record. Deutsche Börse share continues to have the largest share of the European market, at 33 per cent (Q1/2014: 32 per cent). ETFs have become a well-established investment instrument: the ETF trading volume on Xetra has grown from around €2 billion per month in the first five years to around €17 billion per month now. Besides the marketplace for ETFs, Deutsche Börse operates a segment for exchange-traded commodities (ETCs). Xetra-Gold®, a physically backed bearer bond issued by Deutsche Börse Commodities GmbH, is
Breakdown of net revenue in the Xetra segment
49.2
43.5
€ millions
7.3
7.19.0
8.2
32.928.2
Other 1)
Central counterparty for equities
Trading 2)
1) Including revenue from listing and Eurex Bonds2) The position “Trading” includes the Xetra® electronic trading system,
Börse Frankfurt as well as structured products trading.
Q1 / 2014 Q1 / 2015

13 Group management report
the most successful ETC product. Gold holdings reached a new record high of 55.4 tonnes in the first quarter of 2015 (31 March 2014: 46.4 tonnes). One gram of gold is deposited in the vaults for each unit certificate. At €35.57 (Xetra price on 31 March) per Xetra-Gold unit or per gram of gold, the current value of gold under custody is around €2.0 billion (31 March 2014: €1.4 billion). Of the ETCs that can be traded on Xetra, Xetra-Gold is by far the highest-volume security. In the first quarter of 2015, the order book turnover on Xetra amounted to 495.2 million, representing a 26 per cent share of the ETC market. In the listing business, Deutsche Börse recorded three new admissions in the first quarter of 2015: these were two IPOs with a placement volume totalling approximately €621 million and a tech-nical listing without a public offer. Furthermore, 23 companies implemented a capital increase; the placement volume amounted to around €3.5 billion. Additionally, two companies used the option of issuing corporate bonds in the Entry Standard for bonds. The issue volume as given in the prospectuses amounted to a total of €110 million.
Xetra segment: key indicators
Q1/2015 Q1/2014 Change €bn €bn % Trading volume (order book turnover, single-counted)
Xetra® 395.2 316.3 25
Börse Frankfurt 17.5 15.6 12
Tradegate Exchange 24.0 15.7 52
Clearstream segment
At €190.8 million, Clearstream registered a 12 per cent increase in net revenue against the prior-year period (Q1/2014: €169.9 million) in the first quarter of 2015. Of this, €6.1 million was attributable to CGSS net revenue in the investment fund business.
EBIT stood at €91.2 million in the first quarter of 2015 (Q1/2014: €84.5 million). Clearstream has owned CGSS in Cork, Ireland, since 3 October 2014. This subsidiary, which is fully consolidated, provides hedge fund trade execution and custody processing services for financial institu-tions. The average value of assets under custody in the first quarter of 2015 increased to a new record level of €13.2 trillion (Q1/2014: €12.0 trillion). This was due on the one hand to sustained equity price gains on the German domestic market, which increased the value of assets under custody to €6.2 trillion in Q1/2015 (Q1/2014: €5.7 trillion). On the other hand, international assets under custody, which mainly comprise off-exchange (over-the-counter, OTC) traded bonds, amounted to €7.0 trillion in the first quarter of 2015, significantly above last year (Q1/2014: €6.4 trillion). The growth of international assets under custody is partly due to the devaluation of the euro against the US dollar, which in turn has increased the euro value of assets denominated in dollars. Customer and busi-ness gains also contributed to growth. Net revenue in the custody business increased to €95.6 million in Q1/2015 (Q1/2014: €84.2 million).

14 Deutsche Börse Group interim report Q1/2015
Breakdown of net revenue in the Clearstream segment
The number of settlement transactions processed by Clearstream rose 13 per cent to 37.3 million (Q1/2014: 33.1 million). This increase was due to higher trading activity by market participants in the first quarter of 2015. At a total of 12.3 million transactions, Clearstream’s international settle-ment activity for Q1/2015 was 7 per cent higher year-on-year (Q1/2014: 11.4 million). Settlements of international OTC transactions increased by 7 per cent to 9.9 million (Q1/2014: 9.2 million), or 81 per cent of all international transactions. Settlements of stock exchange transactions rose by 8 per cent to 2.4 million (Q1/2014: 2.2 million), or 19 per cent of all international transactions. In the domestic business, settlement transactions climbed by 15 per cent to 25.0 million in the first quarter of 2015 (Q1/2014: 21.7 million), due to higher trading activity on the part of German retail investors. Of this figure, 65 per cent were stock exchange transactions and 35 per cent OTC trans-actions. Stock exchange transactions increased to 16.4 million (Q1/2014: 14.2 million), while OTC transactions rose to 8.6 million (Q1/2014: 7.5 million). Net revenue in the settlement busi-ness rose by 15 per cent in the first quarter of 2015, to €37.6 million (Q1/2014: €32.6 million).
190.8
169.9
€ millions
31.7
29.0
9.3
8.4
16.6
15.737.6
32.6
95.684.2
Other 1)
Net interest income from banking business
Global Securities Financing
Settlement
Custody
1) Including Connectivity and Reporting
Q1 / 2014 Q1 / 2015

15 Group management report
Clearstream segment: key indicators Q1/2015 Q1/2014 Change Custody €bn €bn %
Value of securities deposited (average value) 13,158 12,045 9
international 6,969 6,355 10
domestic 6,189 5,690 9
Settlement m m %
Securities transactions 37.3 33.1 13
international – OTC 9.9 9.2 7
international – on-exchange 2.4 2.2 8
domestic – OTC 8.6 7.5 15
domestic – on-exchange 16.4 14.2 16
Global Securities Financing €bn €bn %
Outstanding volume (average value) 628.4 580.0 8
Average daily cash balances €m €m %
Total1) 13,309 11,274 18
euros 5,241 4,760 10
US dollars 5,994 4,909 22
other currencies 2,073 1,605 29
1) Contains approximately €1.5 billion (Q1/2014: €1.2 billion) currently restricted by relevant EU and US sanction programmes
Within the Global Securities Financing (GSF) business, which includes triparty repo, securities lending and collateral management, average outstandings increased year-on-year to €628.4 million (Q1/2014: €580.0 million). Total net revenue in the GSF business was up 6 per cent to €16.6 million in Q1/2015 (Q1/2014: €15.7 million). Overnight customer cash deposits increased in the first quarter of 2015 to reach an average of €13.3 billion (Q1/2014: €11.3 billion). Adjusted for assets restricted by EU and US sanction pro-grammes, customer cash deposits increased to €11.8 billion (Q1/2014: €10.1 billion). Net interest income from Clearstream’s banking business rose 11 per cent to €9.3 million in Q1/2015 (Q1/2014: €8.4 million). Growth in cash deposits exceeded net interest income, reflecting sustained low interest rate levels. The success of Clearstream’s Investment Fund Services contributed positively to the custody and settle-ment business. In the first quarter of 2015, Clearstream processed 2.7 million transactions, a 23 per cent increase on the previous year (Q1/2014: 2.2 million). The average value of investment funds under custody for the first quarter of 2015 was €403.4 billion, 37 per cent higher than last year (Q1/2014: €294.3 billion). Market Data + Services segment
Net revenue rose by 19 per cent to €111.8 million (Q1/2014: €93.6 million). EBIT also increased significantly by 17 per cent year-on-year to €58.2 million (Q1/2014:
€49.7 million). The distribution of trading and market signals, as well as licences (Information business area) performed well in the first quarter of 2015: Lifted by higher sales of premium data products in particular, as well as non-recurring effects from an additional expense for prior years, net revenue rose in the first quarter of

16 Deutsche Börse Group interim report Q1/2015
2015 compared with the prior-year quarter to €45.1 million (Q1/2014: €35.3 million). Since 1 January 2015, Deutsche Börse has been the exclusive distributor of real-time market data from PEGAS – the data from the central EEX and Powernext gas trading platform – via its CEF® data feed. Customers benefit from improved access to market data for the pan-European gas market and are able to adapt their trading strategy in a timely manner. Deutsche Börse operates its Index business area via its subsidiary STOXX Ltd. Its revenue is generated from calculating and marketing indices and benchmarks that are used by banks and fund management companies mainly as underlyings or benchmarks for financial instruments and investment vehicles. In the first quarter of 2015, the index business continued its strong growth trend, with a 27 per cent in-crease in net revenue to €27.9 million (Q1/2014: €22.0 million). This growth was mostly attributable to the significant increase in the assets managed in ETFs traded at Deutsche Börse. Another factor con-tributing to this growth was the higher trading activity in equity index derivatives on Eurex Exchange. In the Tools business area, which includes the London-based software provider Impendium, the In-fobolsa cooperative venture, and revenue from technology solutions and connectivity services for trading and clearing participants, net revenue rose slightly to €28.2 million (Q1/2014: €27.4 million). The strategic cooperation with the BSE (formerly the Bombay Stock Exchange) was expanded: in future, BSE participants will be able to connect directly to Deutsche Börse’s N7 network via data centres (Access Points) in Hong Kong and Singapore. This means they will be able to use an established, highly resilient, low latency network for their trading activities. The BSE markets have been using T7, Deutsche Börse Group’s new trading architecture, since 2013. The Market Solutions business area consists primarily of development and operational services for exter-nal technology customers, such as partner exchanges and German regional exchanges. Net revenue in this business area increased to €10.6 million in the first quarter of 2015 (Q1/2014: €8.9 million), driven among other things by new customer contracts entered into in the second half of 2014.
Breakdown of net revenue in the Market Data + Services segment
111.8
93.6
€ millions
28.2
27.4
10.6
8.9
27.9
22.0
45.135.3
Tools
Market Solutions
Index
Information
Q1 / 2014 Q1 / 2015
1) 2014 fi gures of selected business areas restated due to changes in internal reporting; no restatement of total net revenue
17 Group management report
Financial position
Cash flow Deutsche Börse Group generated cash flow from operating activities before changes in reporting date-related CCP positions of €258.4 million in the first quarter of 2015 (Q1/2014: €53.2 million). The significant year-on-year increase in cash flows from operating activities is mainly due to a pay-ment of US$151.9 million made in the first quarter of 2014 in connection with the settlement the Group entered into with OFAC (U.S. Office of Foreign Assets Control). In addition, Deutsche Börse Group made tax payments in the amount of €46.2 million in the first quarter of 2015 (Q1/2014: €84.8 million). The higher tax payments in the previous year were largely attributable to a non-recurring expense for additional tax payments in Luxembourg for the years 2009 to 2011. The decrease in other non-cash income to €2.9 million (Q1/2014: €52.0 million) is primarily due to the remeasurement of the interest in Direct Edge in the first quarter of 2014 following the merger of Direct Edge and BATS. Deferred tax expenses dropped from €26.0 million in Q1/2014 to €2.2 million. The deferred tax ex-penses in the previous year were mainly attributable to a non-recurring effect in connection with the merger of Direct Edge and BATS. Including the changes in the CCP positions, cash flow from operating activities was €215.8 million (Q1/2014: €56.7 million). Cash inflows from investing activities amounted to €313.2 million in Q1/2015 (Q1/2014: cash inflows of €571.7 million). The increase can primarily be attributed to the following changes: Cash inflows due to maturing collateralised cash investments with an original maturity of more than
three months amounted to €430.6 million (Q1/2014: €588.2 million); in addition, securities of €5.3 million matured or were sold (Q1/2014: €81.9 million).
Moreover, the Group acquired securities with an original maturity of more than three months in an amount of €92.3 million (Q1/2014: €95.0 million).
Due to the consolidation of Powernext and EPEX as at 1 January 2015, cash flow resulted in an increase of €39.1 million. In the prior-year, cash funds increased by €61.5 million due to the consol-idation of the European Energy Exchange. Since no purchase price was payable in 2015 and 2014, there were no cash outflows.
At €34.6 million, investments in intangible assets and property, plant and equipment were above the prior-year level of €21.9 million; they related in particular to investments in the Clearstream (€18.2 million) and Eurex (€14.4 million) segments. These investments were primarily attributable to the expansion of settlement and collateral management systems (€11.9 million), as well as trading and clearing systems (€9.3 million).
There were no cash outflows from financing activities in the first quarter of 2015 (Q1/2014: cash outflows of €10.1 million). Cash inflows resulting from issuing commercial paper in an amount of €60.0 million (Q1/2014: €89.9 million) were matched by cash outflows of the same amount due to maturing commercial paper (Q1/2014: €100.0 million). Cash and cash equivalents as at 31 March 2015 thus amounted to €464.0 million (31 March 2014: €562.5 million).

18 Deutsche Börse Group interim report Q1/2015
Capital structure As a rule, the Group aims to achieve a dividend distribution ratio of 40 to 60 per cent of adjusted consolidated net income. Moreover, it implements share buy-backs in order to distribute to its sharehold-ers funds not required for the company’s operating business and its further development. This policy is determined at all times by the company’s capital requirements, which depend on the legal and regulatory framework as well as its credit rating, economic capital and liquidity needs. Customers of the company expect to have conservative interest coverage and debt/equity ratios and to maintain strong credit ratings. Deutsche Börse Group therefore continues to pursue its objective of achieving an interest coverage ratio (ratio of EBITDA to interest expenses from financing activities) of at least 16 at Group level in order to meet the rating agencies’ current requirements for an “AA” rating for Deutsche Börse AG. Deutsche Börse Group met this objective in Q1/2015, achieving an interest coverage ratio of 32.0 (Q1/2014: 28.6). This figure is based on a relevant interest expense of €11.0 million and an adjusted EBITDA of €352.5 million. Due to the successful refinancing accomplished in 2013, interest expense decreased significantly year-on-year. In addition, Deutsche Börse aims to achieve a ratio of interest-bearing gross debt to EBITDA of no more than 1.5 at Group level. This performance indicator also plays a material role in maintaining the parent company’s cur-rent “AA” rating. In the first quarter, the Group met the target ratio, at 1.2. This figure is based on gross debt of €1,679.2 million and an adjusted EBITDA of €352.5 million. Gross debt includes in-terest-bearing liabilities of €1,460.7 million and interest-bearing liabilities of €158.4 million that are reported under “other current liabilities” because they have a remaining maturity of less than twelve months at the balance sheet date, as well as commercial paper of €60.0 million outstanding at the end of the first quarter. Moreover, to ensure the continued success of the Clearstream segment, which is active in securities custody and settlement, the company aims to retain Clearstream Banking S.A.’s strong “AA” credit rating. Deutsche Börse AG also needs to maintain a strong credit profile to support activities at its Eurex Clear-ing AG subsidiary. For financial year 2014, Deutsche Börse AG is proposing to the Annual General Meeting to resolve payment of a dividend of €2.10 per no-par value share (financial year 2013: €2.10). This proposal represents a distribution ratio of 58 per cent, adjusted for merger and acquisition costs, as well as effi-ciency programme costs (2013: 61 per cent, adjusted for merger and acquisition costs, efficiency pro-gramme costs). For 184.2 million dividend-bearing no-par value shares, this would result in a total dividend of €386.8 million (2013: €386.6 million). Net assets
As at 31 March 2015, Deutsche Börse Group’s non-current assets amounted to €14,576.3 million (31 March 2014: €11,625.4 million). They consisted primarily of intangible assets and financial assets as well as of financial instruments of its central counterparties. Intangible assets primarily included goodwill of €2,377.8 million (31 March 2014: €2,079.5 million) and other intangible assets of €1,136.2 million (31 March 2014: €923.0 million). Non-current receivables and securities from bank-ing business of €1,390.7 million (31 March 2014: €1,271.9 million) accounted for the largest part of financial assets, which amounted to €1,667.5 million as at the balance sheet date (31 March 2014: €1,548.1 million). Non-current assets were matched by equity of €4,099.0 million (31 March 2014: €3,580.7 million). Non-current liabilities totalling €11,062.3 million (31 March 2014: €8,644.6 million) mainly related to financial instruments of the central counterparties amounting to €8,787.6 million (31 March 2014: €6,633.1 million), which are reported separately from the current financial instruments

19 Group management report
of the central counterparties due to a maturity of more than three months, interest-bearing liabilities of €1,460.7 million (31 March 2014: €1,522.7 million) as well as deferred tax liabilities of €515.3 million (31 March 2014: €289.9 million). Among other things, changes in current liabilities were the result of the increase in liabilities from banking business to €15,588.5 million (31 March 2014: €15,541.3 million). Commercial paper amounting to nominally €60.0 million was outstanding as at the end of the first quarter of 2015 (31 March 2014: €90.0 million). Report on post-balance sheet date events
On 17 April, the power exchanges EPEX Spot, an EEX subsidiary, and APX Group, including Belpex, announced that they intend to integrate their businesses in order to form a power exchange for Central Western Europe and the UK. Both companies have signed respective agreements. The integration will lead to a more effective governance and further facilitate the creation of a single European power market. Risk report
Deutsche Börse Group provides detailed information on its operating environment, strategy, principles, organisation, processes, methods and concepts of its risk management in its 2014 corporate report on pages 144 to 171. The assessment of operational, financial, business and project-related risks did not change significantly in the period under review. Operational risks for Deutsche Börse Group relate to availability, processing, material goods, as well as litigation and business practice. Further information concerning operational risk and the measures to mitigate them can be found in Deutsche Börse Group’s corporate report 2014 on pages 156 to 163. On 12 November 2012, the Chicago Board Options Exchange (CBOE) filed a patent infringement law suit against the International Securities Exchange (ISE) (the “CBOE Litigation”). In the CBOE Litigation, CBOE alleges US$525 million in damages for infringement of three patents, which relate to systems and methods for limiting market-maker risk. ISE believes that CBOE’s damages claim lacks merit be-cause it is unsupported by the facts and the law. ISE intends to vigorously defend itself in this lawsuit. Upon ISE’s motion, the case was stayed, pending the outcome of certain petitions filed by ISE with the U.S. Patent and Trademark Office (USPTO) in which ISE sought to invalidate the CBOE patents. On 2 March 2015, the USPTO has partially granted ISE’s petitions and has issued decisions determining that all three CBOE patents are at least insofar invalid as they constitute unpatentable abstract ideas. These decisions can be appealed by CBOE at the U.S. Court of Appeals for the Federal Circuit. In its 2012 corporate report, Deutsche Börse Group informed about proceedings, Peterson vs Clear-stream Banking S.A., the first Peterson proceeding, initiated by various plaintiffs seeking turnover of certain customer positions held in Clearstream Banking S.A.’s securities omnibus account with its US depository bank, Citibank NA, and asserting direct claims against Clearstream Banking S.A. for damages of US$250 million. That matter was settled between Clearstream Banking S.A. and the plaintiffs and the direct claims against Clearstream Banking S.A. were abandoned.

20 Deutsche Börse Group interim report Q1/2015
In July 2013, the US court ordered turnover of the customer positions to the plaintiffs, ruling that these were owned by Bank Markazi, the Iranian central bank. Bank Markazi appealed, and the decision was affirmed on 9 July 2014. Bank Markazi has sought review in the Supreme Court. Once that process is complete, if the funds are turned over, a related case, Heiser vs Clearstream Banking S.A., also seeking turnover of the same assets, will be dismissed. On 30 December 2013, a number of US plaintiffs from the first Peterson case, as well as other US plaintiffs, filed a complaint targeting turnover of certain blocked assets that Clearstream Banking S.A. holds as a custodian in Luxembourg. In 2014, the defendants in this action, including Clearstream Banking S.A., moved to dismiss the case. On 19 February 2015, the US court issued a decision grant-ing the defendants’ motions and dismissing the lawsuit. On 6 March 2015, the plaintiffs appealed the decision to the Second Circuit Court of Appeals. On 2 April 2014, Clearstream Banking S.A. was informed that the United States Attorney for the South-ern District of New York has opened a grand jury investigation against Clearstream Banking S.A. due to Clearstream Banking S.A.’s conduct with respect to Iran and other countries subject to US sanction laws. Clearstream Banking S.A. is cooperating with the US attorney. A dispute has arisen between MBB Clean Energy AG (MBB), the issuer of a bond eligible in Clearstream Banking AG, and end investors. MBB issued a first tranche of the bond in April 2013 and a second tranche of the bond in December 2013. The global certificates for the two tranches of the bond were delivered into Clearstream Banking AG by the paying agent of the issuer. The dispute relates to the non-payment of the second tranche of the bond with a nominal value of €500 million and the purported lack of validity of the bond. Clearstream Banking AG’s role in this case is primarily to have accepted the note in its system as national central securities depository. At this stage, it is unclear if and to what extent potential damages exist and if so who would ultimately be responsible. MBB, the relevant paying agent and Clearstream Banking AG have agreed on replacing the bond with a global certificate with a new ISIN for so-called qualified investors. The issuer of the bond has informed Clearstream Banking AG in November 2014 that the process designed to resolve the problem has been postponed. Deutsche Börse Group is exposed to financial risks mainly in the form of credit risk and liquidity risk in the financial institutions of the Clearstream Holding group and Eurex Clearing AG. In addition, the Group’s cash investments and receivables are subject to credit risk. The majority of cash investments involve short-term transactions that are collateralised, thus minimising liquidity risk as well as market risk from cash investments. Market risk is immaterial for the entire Group. Further information on finan-cial risks can be found on pages 163 to 169 of the 2014 corporate report. Business risk reflects the sensitivity of the Group to macroeconomic developments and its vulnerability to event risk, such as regulatory initiatives or changes in the competitive environment. In addition, it includes the Group’s strategic risk, which relates to the impact of risk on the business strategy and any resulting adjustment to the strategy. Furthermore, external factors such as the performance and volatility of the capital markets or a lack of investor confidence in the financial markets may impact financial performance. Further information concerning business risks can be found on pages 169 and 170 of the 2014 corporate report.
21 Group management report
Currently, the Group is pursuing several major projects. These are constantly monitored to identify risks at an early stage and enable appropriate countermeasures to be taken. Further information concerning project risks can be found in the 2014 corporate report on page 170. The Group evaluates its risk situation on an ongoing basis. Taking into account the stress test calcu-lations performed, the required economic capital and earnings at risk as well as the risk management system, which it considers to be effective, the Executive Board of Deutsche Börse AG is of the opinion that the risk-bearing capacity of the Group is sufficient. A significant change in the Group’s risk profile cannot be identified at present. Report on opportunities
Deutsche Börse Group’s management of opportunities aims to identify and assess opportunities as early as possible and to initiate appropriate measures in order to take advantage of opportunities and trans-form them into business success. At present, the Executive Board cannot identify any significant change in the Group’s opportunities that were described in detail in the 2014 corporate report on pages 172 to 178. As part of its growth strategy, Deutsche Börse Group has already made further progress relating to the structural growth opportunities in the first quarter described in the corporate report. Clearing of OTC derivatives: EMIR licence for Eurex Clearing
EurexOTC Clear, the clearing offering for over-the-counter interest rate swaps, gained more new members, with leading national and international banks and asset managers joining in the first quarter, e.g. Landesbank Baden-Württemberg and Natixis, the corporate and investment banking arm of French Groupe BPCE. The total number of clearing members as at 31 March 2015 was 41; in total, around 75 customers have signed up for a connection.
Structural growth opportunities
Collateral and liquidity management Clearstream further extended its collateral and liquidity management services in the first quarter of 2015. In March 2015, Clearstream Banking S.A. and ICE Clear Europe, the London-based central counterparty, have launched a new collateral management partnership which enables clearing members to use their assets held at Clearstream to manage their margin requirements. This link to the triparty collateral man-agement solution of Clearstream enables ICE Clear Europe members to deposit and use securities as collateral to cover their risk exposures within a highly automated and efficient collateral environment. Clearstream also announced its cooperation with Sumitomo Mitsui Banking Corporation. They are col-laborating with the aim of developing a collateral management service for their mutual customers. The service will enable mutual customers to consolidate their Japanese government bonds (JGBs) held across both institutions into one single pool to perform triparty collateral management transactions with any Clearstream collateral receiver. Expansion in Asia As a major milestone in its Asia strategy, the Group is also planning to build a local derivatives clearing infrastructure in order to support growth within the Asian region. In January 2015, Deutsche Börse
22 Deutsche Börse Group interim report Q1/2015
Group received ‘in-principle’ regulatory clearance from the local financial supervisory authority to set up a clearing house in Singapore. In addition, the strategic partnership between Deutsche Börse AG and China Construction Bank (CCB) announced at the end of March has opened up further opportunities for expansion in Asia. Potential formats include the expansion of CCB’s business activities in the European Union, for example through trading and clearing memberships of Xetra, Eurex as well as of the clearing house Eurex Clearing. Deutsche Börse and CCB are also looking to collaborate in the post-trade and custody areas. Another focus is the joint development of the offshore renminbi market in Germany and Europe. The two parties also plan to cooperate closely in the area of training and professional development to support these projects. Market data and IT Asia also offers growth opportunities for the Market Data + Services segment: the Group is planning further growth from distributing capital market data, indices and technology solutions. The strategic cooperation with Bombay Stock Exchange was expanded in the first quarter of 2015. In the future, BSE participants in certain overseas markets will be able to benefit from Deutsche Börse’s connectivity services. Starting in the second quarter of 2015, they will be able to use Deutsche Börse’s highly resilient, low latency N7 network services to connect to BSE back-ends in India via the Deutsche Börse data centres in the two major financial centres of Hong Kong and Singapore. This Deutsche Börse offering, which is aimed directly at market participants, will allow them to connect their trade settlement systems to the equity, derivative and currency exchanges operated by BSE. Cyclical opportunities In addition to structural growth opportunities, Deutsche Börse Group has cyclical opportunities. The uncertainty regarding global economic performance and developments in key interest rates going forward, which has dominated the market since the end of the third quarter of 2014, has increased volatility on the stock and interest rate markets. These developments again resulted in higher demand for hedging among market participants in the first quarter of 2015. As a result, trading volumes matched the high level achieved in Q4/2014. Although the company cannot influence these cyclical opportunities directly, they could lift Deutsche Börse Group’s net revenue and consolidated net income significantly. Report on expected developments
The report on expected developments describes how Deutsche Börse Group is expected to perform in financial year 2015. It contains statements and information on events in the future. These forward-looking statements and information are based on the company’s expectations and assumptions at the time of publication of this report. In turn, these are subject to known and unknown opportunities, risks and uncertainties. Numerous factors influence the Group’s success, its business strategy and financial results. Many of these factors are outside the company’s control. Should opportunities, risks, or uncer-tainties materialise or one of the assumptions made turn out to be incorrect, the actual development of the Group could deviate either positively or negatively from the expectations and assumptions contained in the forward-looking statements and information contained in this report on expected developments.

23 Group management report
Deutsche Börse Group is not planning any fundamental change to its operating policies in the coming
years.
Development of results of operations
For the remainder of financial year 2015, Deutsche Börse Group does not expect any material devia-
tion from the forecasts for its operating environment made in its 2014 consolidated financial state-
ments.
The Group has lifted its forecast range for net revenue by €100 million on the basis of the clearly posi-
tive business performance in the first quarter of 2015, the consolidation of the APX Group in the course
of 2015 and further effects from the significant appreciation of the US dollar vis-à-vis the euro. The
Group thus expects net revenue to increase to around €2,200 million to €2,400 million in 2015. In
addition, the company is anticipating operating costs of approximately €1,230 million (originally €1,180
million), adjusted for special factors. The increase of approximately €50 million as against the original
forecast is attributable to the consolidation of the APX Group (approx. €20–25 million), the exchange
rate effects described above (approx. €15 million) as well as the Stock Bonus Plan, which is linked to
share price performance (approx. €10 million). The Group is expecting that operating costs will again be
affected
by special factors of some €30 million, especially relating to costs for efficiency measures as well as
mergers and acquisitions.
The revision to the forecast range for net revenue also affects EBIT and net income for the year adjusted
for special factors. EBIT adjusted for special factors is expected to amount to between approximately
€975 million and €1,175 million (originally €925 million to €1,125 million). As before, the Group
anticipates a tax rate of approximately 26 per cent for the forecast period, adjusted for any special fac-
tors. The financial result will improve as a result of positive exchange rate effects in the first quarter of
2015 due to the increase in holdings of US dollars. Consolidated net income for the period is expected
to amount to approximately €675 million to €825 million (originally €625 million to €775 million),
adjusted for special factors in both cases.
The assumptions on which the forecast is based can be found on pages 178 to 185 of the 2014
corporate report.
Development of the Group’s financial position
The company expects cash flows from operating activities to remain clearly positive in the future; these
are Deutsche Börse Group’s main financing instrument. The company plans to invest amounts of
around €150 million per year in intangible assets and property at Group level. The investments will
serve primarily to develop new products and services in the Eurex and Clearstream segments and
enhance existing ones. The total mainly comprises investments in the trading infrastructure and risk
management functionalities.
As a rule, the Group aims to achieve a dividend distribution ratio of 40 to 60 per cent of adjusted con-
solidated net income. Moreover, it implements share buy-backs in order to distribute to its shareholders
funds not required for the Group’s operating business and its further development. This policy is deter-
mined at all times by the company’s capital requirements, which depend on the legal and supervisory
framework as well as requirements relating to its credit rating, economic capital and liquidity.

24 Deutsche Börse Group interim report Q1/2015
for the period 1 January to 31 March 2015
Quarter ended (restated)
Quarter ended Quarter ended Note 31 Mar 2015 31 Mar 2014 31 Mar 2014 €m €m €m
Sales revenue 679.8 589.8 589.8
Net interest income from banking business 8.4 10.9 8.4
Other operating income 4 5.2 3.2 3.2
Total revenue 693.4 603.9 601.4
Volume-related costs – 93.3 – 87.2 – 87.2
Net revenue (total revenue less volume-related costs) 600.1 516.7 514.2
Staff costs – 135.0 – 109.0 – 109.0
Depreciation, amortisation and impairment losses – 34.1 – 30.1 – 30.1
Other operating expenses 5 – 123.9 – 108.7 – 108.7
Operating costs – 293.0 – 247.8 – 247.8
Result from equity investments 5.2 74.1 63.5
Earnings before interest and tax (EBIT) 312.3 343.0 329.9
Financial income 19.4 0.2 3.2
Financial expense – 13.7 – 13.6 – 14.1
Earnings before tax (EBT) 318.0 329.6 319.0
Other tax – 0.4 – 0.4 – 0.4
Income tax expense – 82.1 – 91.3 – 91.3
Net profit for the period 235.5 237.9 227.3
thereof shareholders of parent company (net income for the period) 222.3 229.6 219.0
thereof non-controlling interests 13.2 8.3 8.3
Earnings per share (basic) (€) 14 1.21 1.25 1.19
Earnings per share (diluted) (€) 14 1.21 1.25 1.19
Consolidated income statement

25 Financial statements
for the period 1 January to 31 March 2015
Quarter ended (restated)
Quarter ended Quarter ended Note 31 Mar 2015 31 Mar 2014 31 Mar 2014 €m €m €m
Net profit for the period reported in consolidated income statement 235.5 237.9 227.3
Items that will not be reclassified to profit or loss:
Changes from defined benefit obligations 8 – 33.3 – 9.0 – 9.0
Deferred taxes 8.8 2.5 2.5
– 24.5 – 6.5 – 6.5
Items that may be reclassified subsequently to profit or loss:
Exchange rate differences1) 8 154.0 0.9 0.9
Remeasurement of cash flow hedges 0.7 0.6 0.6
Remeasurement of other financial instruments 5.5 – 1.2 – 1.2
Deferred taxes 8 – 76.8 0.1 0.1
83.4 0.4 0.4
Other comprehensive income after tax 58.9 – 6.1 – 6.1
Total comprehensive income 294.4 231.8 221.2
thereof shareholders of parent company 280.8 223.5 212.9
thereof non-controlling interests 8 13.6 8.3 8.3
1) Exchange rate differences include €0.6 million (31 March 2014: €0.3 million) that were taken directly to “accumulated profit” as part of the result from equity investments.
Consolidated statement of comprehensive income

26 Deutsche Börse Group interim report Q1/2015
as at 31 March 2015
Assets
Note 31 Mar 2015
(restated)
31 Dec 20142) 31 Dec 2014
(restated)
31 Mar 20143) 31 Mar 2014
€m €m €m €m €m
NON-CURRENT ASSETS
Intangible assets 6
Software 208.7 221.1 221.3 174.3 174.3
Goodwill 2,377.8 2,225.0 2,224.5 2,079.5 2,084.0
Payments on account and construction in progress 125.4 100.2 100.2 103.2 103.2
Other intangible assets 1,136.2 980.2 980.5 923.0 923.0
3,848.1 3,526.5 3,526.5 3,280.0 3,284.5
Property, plant and equipment 6
Fixtures and fittings 37.5 37.4 37.4 35.9 35.9
Computer hardware, operating and office equipment 62.9 62.3 62.3 63.4 63.4
Payments on account and construction in progress 1.2 1.2 1.2 0.1 0.1
101.6 100.9 100.9 99.4 99.4
Financial assets 7
Investments in associates and joint ventures 33.1 104.2 104.2 99.6 75.4
Other equity investments 213.6 166.8 166.8 152.3 152.3
Receivables and securities from banking business 1,390.7 1,305.0 1,305.0 1,271.9 1,271.9
Other financial instruments 29.1 25.8 25.8 23.9 23.9
Other loans 1.0 0.4 0.4 0.4 0.4
1,667.5 1,602.2 1,602.2 1,548.1 1,523.9
Financial instruments of the central counterparties 8,787.6 5,885.8 5,885.8 6,633.1 6,633.1
Other non-current assets 11.9 11.5 11.5 11.7 11.7
Deferred tax assets 159.6 140.3 140.3 53.1 53.1
Total non-current assets 14,576.3 11,267.2 11,267.2 11,625.4 11,605.7
CURRENT ASSETS
Receivables and other current assets
Financial instruments of the central counterparties 200,733.5 170,251.0 170,251.0 195,756.3 195,756.3
Receivables and securities from banking business 14,600.9 10,307.1 10,307.1 15,641.5 15,641.5
Trade receivables 423.9 342.9 342.9 415.2 415.2
Receivables from related parties 1.8 1.0 1.0 0.9 0.9
Income tax receivables1) 79.4 75.0 75.0 20.4 20.4
Other current assets 313.9 554.3 554.3 283.3 283.3
216,153.4 181,531.3 181,531.3 212,117.6 212,117.6
Restricted bank balances 36,038.9 22,283.5 22,283.5 19,580.8 19,580.8
Other cash and bank balances 929.6 826.1 826.1 792.0 792.0
Total current assets 253,121.9 204,640.9 204,640.9 232,490.4 232,490.4
Total assets 10 267,698.2 215,908.1 215,908.1 244,115.8 244,096.1
1) Thereof €6.8 million (31 December 2014: €6.8 million and 31 March 2014: €8.8 million) with a remaining maturity of more than one year from corporation tax
credits in accordance with section 37 (5) of the Körperschaftsteuergesetz (KStG, the German Corporation Tax Act)
2) The adjusted balance sheet as at 31 December 2014 reflects the changes resulting from the purchase price allocation for Global Securities Serivces Limited, Cork,
Ireland. For further details see note 2 of this interim report.
3) The adjusted balance sheet as at 31 March 2014 is the result of the correction according to IAS 8 (see note 1 of this interim report) and the adjustment of the
purchase price allocation for the European Energy Exchange AG, Leipzig, Germany (see note 2 of the interim report as at 30 September 2014).
Consolidated balance sheet

27 Financial statements
Equity and liabilities
Note 31 Mar 2015 (restated)
31 Dec 20142) 31 Dec 2014 (restated)
31 Mar 20143) 31 Mar 2014 €m €m Mio. € €m €m
EQUITY 8
Subscribed capital 193.0 193.0 193.0 193.0 193.0
Share premium 1,249.0 1,249.0 1,249.0 1,249.0 1,249.0
Treasury shares – 443.0 – 443.0 – 443.0 – 446.6 – 446.6
Revaluation surplus – 35.9 – 15.9 – 15.9 22.5 22.5
Accumulated profit 2,748.1 2,446.6 2,446.6 2,241.9 2,231.3
Shareholders’ equity 3,711.2 3,429.7 3,429.7 3,259.8 3,249.2
Non-controlling interests 387.8 322.4 322.4 320.9 311.8
Total equity 4,099.0 3,752.1 3,752.1 3,580.7 3,561.0
NON-CURRENT LIABILITIES
Provisions for pensions and other employee benefits 9 181.6 145.6 145.6 92.9 92.9
Other non-current provisions 104.5 110.5 110.5 102.6 102.6
Deferred tax liabilities 515.3 379.5 379.5 289.9 289.9
Interest-bearing liabilities 1,460.7 1,428.5 1,428.5 1,522.7 1,522.7
Financial instruments of the central counterparties 8,787.6 5,885.8 5,885.8 6,633.1 6,633.1
Other non-current liabilities 12.6 12.6 12.6 3.4 3.4
Total non-current liabilities 11,062.3 7,962.5 7,962.5 8,644.6 8,644.6
CURRENT LIABILITIES
Tax provisions 320.7 282.7 282.7 230.7 230.7
Other current provisions 113.5 108.1 108.1 112.0 112.0
Financial instruments of the central counterparties 199,668.4 169,001.9 169,001.9 195,746.3 195,746.3
Liabilities from banking business 15,588.5 11,487.1 11,487.1 15,541.3 15,541.3
Other bank loans and overdrafts 0.9 0.7 0.7 1.3 1.3
Trade payables 211.6 221.2 221.2 257.5 257.5
Liabilities to related parties 2.3 1.6 1.6 1.5 1.5
Cash deposits by market participants 36,037.7 22,282.4 22,282.4 19,580.8 19,580.8
Other current liabilities 593.3 807.8 807.8 419.1 419.1
Total current liabilities 252,536.9 204,193.5 204,193.5 231,890.5 231,890.5
Total liabilities 263,599.2 212,156.0 212,156.0 240,535.1 240,535.1
Total equity and liabilities 10 267,698.2 215,908.1 215,908.1 244,115.8 244,096.1

28 Deutsche Börse Group interim report Q1/2015
for the period 1 January to 31 March 2015
Quarter ended Twelve-months period as at Note 31 Mar 2015 31 Mar 2014
1) 31 Mar 2015 31 Mar 2014
1)
€m €m €m €m Net profit for the period 235.5 237.9 796.7 608.2
Depreciation, amortisation and impairment losses 6 34.1 30.1 128.8 120.6
Increase/(decrease) in non-current provisions – 7.7 – 6.9 – 5.1 – 14.5
Deferred tax expense/(income) 8 2.2 26.0 – 72.6 22.3
Cash flows from derivatives 0 0 0 – 2.5
Other non-cash (income)/expense – 2.9 – 52.0 – 8.2 – 33.5
Changes in working capital, net of non-cash items: – 3.0 – 181.9 47.8 4.7
(Increase)/decrease in receivables and other assets – 87.0 – 100.0 – 50.0 – 58.1
Increase/(decrease) in current liabilities 83.7 – 81.7 88.5 66.2
Increase in non-current liabilities 0.3 – 0.2 9.3 – 3.4
Net loss on disposal of non-current assets 0.2 0 2.6 – 1.1
Cash flows from operating activities excluding CCP positions 258.4 53.2 890.0 704.2
Changes from liabilities from CCP positions – 304.2 3.2 – 31.8 58.7
Changes in receivables from CCP positions 261.6 0.3 – 21.8 – 19.3
Cash flows from operating activities 215.8 56.7 836.4 743.6
Payments to acquire intangible assets – 26.7 – 20.4 – 109.2 – 100.5
Payments to acquire property, plant and equipment – 7.9 – 1.5 – 37.0 – 26.6
Payments to acquire non-current financial instruments – 126.6 – 133.7 – 360.1 – 135.8
Payments to acquire investments in associates and joint ventures – 0.6 – 1.2 – 13.0 – 36.3
Payments to acquire subsidiaries, net of cash acquired 39.1 58.4 – 8.1 63.6
Proceeds from the disposal of shares in associates and joint ventures 0 0 3.6 0
(Net increase)/net decrease in current receivables and securities from banking business with an original term greater than three months 430.6 588.2 – 225.7 – 104.0
Proceeds from disposals of available-for-sale non-current financial instruments 5.3 81.9 240.6 114.9
Cash flows from investing activities 313.2 571.7 – 508.9 – 224.7
Consolidated cash flow statement

29 Financial statements
Quarter ended Twelve-months period as at Note 31 Mar 2015 31 Mar 20141) 31 Mar 2015 31 Mar 20141) €m €m €m €m
Proceeds from sale of treasury shares 0 0 2.4 1.9
Payments to non-controlling interests 0 0 – 16.6 – 8.3
Repayment of long-term financing 0 0 0 – 797.8
Repayment of short-term financing – 60.0 – 100.0 – 1,165.0 – 1,280.0
Proceeds from short-term financing 60.0 89.9 1,134.8 1,369.7
Dividends paid 0 0 – 386.6 – 386.5
Cash flows from financing activities 0 – 10.1 – 431.0 – 1,101.0
Net change in cash and cash equivalents 529.0 618.3 – 103.5 – 582.1
Effect of exchange rate differences 3.5 0.4 5.0 – 3.1
Cash and cash equivalents as at beginning of period – 68.5 – 56.2 562.5 1,147.7
Cash and cash equivalents as at end of period 12 464.0 562.5 464.0 562.5
Additional information to payments reflected within cash flows from operating activities:
Interest income and other similar income 33.0 3.3 47.4 8.3
Dividends received 1.2 17.2 8.9 29.5
Interest paid – 21.9 – 7.6 – 66.0 – 93.9
Income tax paid – 46.2 – 84.8 – 198.4 – 128.3
1) The cash flow statements for the first quarter of 2014 and for the twelve-month period ended 31 March 2014 were adjusted due to the adjustment to the pur-chase price allocation for European Energy Exchange AG (EEX) and its subsidiaries effective 1 January 2014. Further details can be found in note 2 to the interim financial statements as at 30 September 2014.

30 Deutsche Börse Group interim report Q1/2015
for the period 1 January to 31 March 2015
thereof included in total comprehensive income
Quarter ended Quarter ended Note 31 Mar 2015 31 Mar 20141) 31 Mar 2015 31 Mar 20141)
€m €m €m €m
Subscribed capital
Balance as at 1 January 193.0 193.0
Balance as at 31 March 193.0 193.0
Share premium
Balance as at 1 January 1,249.0 1,249.0
Balance as at 31 March 1,249.0 1,249.0
Treasury shares
Balance as at 1 January – 443.0 – 446.6
Balance as at 31 March – 443.0 – 446.6
Revaluation surplus 8
Balance as at 1 January – 15.9 29.4 0 0
Changes from defined benefit obligations – 33.3 – 9.0 – 33.3 – 9.0
Remeasurement of other financial instruments 5.5 – 1.2 5.5 – 1.2
Remeasurement of cash flow hedges 0.7 0.6 0.7 0.6
Deferred taxes 7.1 2.7 7.1 2.7
Balance as at 31 March – 35.9 22.5
Accumulated profit 8
Balance as at 1 January 2,446.6 2,011.8 0 0
Net income for the period 222.3 229.6 222.3 229.6
Exchange rate differences and other adjustments 154.3 0.6 153.6 0.9
Deferred taxes – 75.1 – 0.1 – 75.1 – 0.1
Balance as at 31 March 2,748.1 2,241.9
Shareholders’ equity as at 31 March 3,711.2 3,259.8 280.8 223.5
Consolidated statement of changes in equity

31 Financial statements
thereof included in total comprehensive income
Quarter ended Quarter ended Note 31 Mar 2015 31 Mar 2014
1) 31 Mar 2015 31 Mar 2014
1) €m €m €m €m Shareholders’ equity (brought forward) 3,711.2 3,259.8 280.8 223.5
Non-controlling interests
Balance as at 1 January 322.4 231.4 0 0
Changes due to capital increases/(decreases) 8 51.8 81.2 0 0
Changes due to share in net income of subsidiaries for the period 8 13.2 8.3 13.2 8.3
Exchange rate differences and other adjustments 0.4 0 0.4 0
Total non-controlling interests as at 31 March 387.8 320.9 13.6 8.3
Total as at 31 March 4,099.0 3,580.7 294.4 231.8
1) The statement of changes in equity for the quarter ended 31 March 2014 was adjusted due to the adjustment to the purchase price allocation for European Energy Exchange AG (EEX) and its subsidiaries effective 1 January 2014. Further details can be found in note 2 to the interim financial statements as at 30 September 2014.

32 Deutsche Börse Group interim report Q1/2015
Basis of preparation
1. Accounting policies
Deutsche Börse AG (“the company”) is incorporated as a German stock corporation (“Aktiengesellschaft”) and is domiciled in Germany. The company’s registered office is in Frankfurt/Main. The interim financial statements have been prepared in compliance with the International Financial Report-ing Standards (IFRSs) and the related interpretations issued by the International Accounting Standards Board (IASB), as adopted by the European Union in accordance with Regulation No. 1606/2002 of the European Parliament and of the Council on the application of International Accounting Standards. As at 31 March 2015, there were no effective standards or interpretations not yet adopted by the Euro-pean Union that could affect the interim financial statements. Accordingly, the interim financial statements also comply with the IFRSs as issued by the IASB. In addition to the standards and interpretations applied as at 31 December 2014, the following amend-ments and interpretations were applied for the first time: IFRIC 21 “Levies” (May 2013) Amendments resulting from the “Annual Improvements Project 2010–2012” (December 2013) Amendments resulting from the “Annual Improvements Project 2011–2013” (December 2013) Furthermore, IAS 34 (“Interim Financial Reporting”) was applied in addition. The income tax expense for the interim reporting period was calculated using a forecast effective Group tax rate of 26 per cent. The nominal tax rates used when calculating the Group tax rate ranged between 12.5 and 45 per cent. Deferred tax assets were recognised for tax loss carryforwards at the end of the interim reporting period where these can be expected to be realised within the next five tax periods. Since 31 December 2014 and by the date of publication of this interim report, the IASB has issued no other standards which have not yet been adopted by the EU and which are relevant to Deutsche Börse AG. In accordance with the provisions of the Wertpapierhandelsgesetz (WpHG, German Securities Trading Act), these interim financial statements are supplemented by a Group interim management report. Neither report is subject to a statutory audit. Effective 1 January 2015, the interest result of the central counterparties is reported under “net interest income from banking business.” By investing their customers’ cash collateral, the clearing houses gener-ate interest income and expense, which have so far been included in the financial result. The reclassifi-cation is due to a change in the pricing model of Eurex Clearing AG effective 1 May 2015. The changed model provides for an interest-driven cash handling fee. Prior-year figures have been adjusted according-ly as shown in the following table:
Notes to the interim financial statements

33 Notes
Restatement of quarterly figures as at 31 March 2014
(restated) 31 Mar 20141) 31 Mar 2014 €m €m
Net interest income from banking business 10.9 8.4
Total revenue 603.9 601.4
Net revenue (total revenue less volume-related costs) 516.7 514.2
Earnings before interest and tax (EBIT) 343.0 329.9
Financial income 0.2 3.2
Financial expense – 13.6 – 14.1
Earnings before tax (EBT) 329.6 319.0
1) The restated quarterly figures as at 31 March 2014 also include effects resulting from the retrospective adjustment of the purchase price allocation for European Energy Exchange AG.
Correction according to IAS 8 In the 2013 corporate report on page 209, it was reported that financial assets of €44.8 million were identified during the purchase price allocation of European Energy Exchange AG (EEX) and its subsidiar-ies as at 1 January 2014. The fair value of these financial investments was €69.0 million at the acqui-sition date. Due to this retrospective adjustment, which was implemented in the third quarter of 2014 becoming effective as at 1 January 2014 (see note 1 of the interim report as at 30 September 2014), there will be the following changes in the consolidated balance sheet as at 31 March 2014. The posi-tion “investments in associates and joint ventures” increases by €24.2 million, the position “goodwill” decreases by €15.1 million and the position “non-controlling interests” increases by €9.1 million. There were no effects recognised in profit or loss.
Restatement of quarter figures as at 31 March 2014 and 30 June 2014 due to correction according to IAS 8
(restated) 31 Mar 2014 31 Mar 2014 30 Jun 2014 30 Jun 2014 €m €m €m €m
Goodwill1) 2,079.5 2,084.0 2,093.5 2,098.0
Investments in associates and joint ventures 99.6 75.4 100.4 76.2
Non-controlling interests 320.9 311.8 310.4 301.3
1) The restated quarterly figures as at 31 March 2014 and as at 30 June 2014 also include effects resulting from the retrospective adjustment of the purchase price allocation for European Energy Exchange AG (increase in goodwill of €10.6 million; for details see note 2 of the interim report as at 30 September 2014).
2. Group structure
The purchase price allocation for Clearstream Global Securities Services Limited, Cork, Irland (CGSS) was adjusted as at 31 March 2015 during the measurement period. The assessment of the fair value of the intangible assets that were acquired effective 3 October 2014 by Clearstream International S.A., Luxembourg, together with the shares of CGSS was revised in the first quarter of 2015. The previously assumed fair value of all acquired assets and liabilities amounting to €32.1 million as at the date of acquisition decreased by €0.5 million to €31.6 million. The goodwill resulting from the acquisition in-creased accordingly by €0.5 million from €15.1 million to €15.6 million and reflects mainly the ex-pected revenue-related synergies with existing and potential customers in the custody business as well as expected synergies in the form of uniform IT systems. The balance sheet as at 31 December has been adjusted accordingly.

34 Deutsche Börse Group interim report Q1/2015
The purchase price allocation for the acquisition of CGSS has therefore been completed and is presented in the following table:
Goodwill resulting from the business combination with Clearstream Global Securities Services Limited
Final goodwill
calculation 3 Oct 2014 €m
Consideration transferred 47.2
Acquired assets and liabilities
Customer relationships 15.8
Software 9.8
Database 5.9
Other assets and liabilities 0.1
Total assets and liabilities acquired 31.6
Goodwill (partly tax-deductible) 15.6
Effective 1 January 2015, European Energy Exchange AG, Leipzig, Germany, (EEX) acquired an interest of 53.34 per cent in Powernext SA, Paris, France, in exchange for 36.75 per cent of the shares of EPEX Spot SE, Paris, France. Since then, all natural gas activities of EEX group have been bundled with-in Powernext SA; EEX increased its interest in Powernext SA to 55.8 per cent as a result of this trans-action. As at the reporting date, the preliminary purchase price allocation resulted in total goodwill of €14.3 million, which mainly reflects synergies resulting from transfer of fully owned gas exchange busi-ness to Powernext SA. The preliminary allocation of the purchase price to the acquired assets and liabili-ties is shown in the table in note 2 of the 2014 corporate report. As Powernext SA in turn holds 50 per cent of EPEX Spot SE, EEX at the same time obtained a controlling interest in EPEX Spot SE and its two subsidiaries, EPEX Spot Schweiz AG, Zurich, Switzerland, and JV Epex-Soops B.V., Amster-dam, the Netherlands. All subsidiaries have been included in full in the consolidated financial state-ments since 1 January 2015. The consolidation of the EPEX Spot SE group generated a rise of €12.6 million in sales revenue as well as an increase of €1.3 million in earnings after tax and offsetting of non-controlling interests. The consolidation of Powernext SA generated a growth of €3.6 million in sales revenue as well as a decrease of €0.1 million in earnings after tax and offsetting of non-controlling interests. Moreover, on 1 January 2015, EEX acquired 50 per cent of the shares of Gaspoint Nordic A/S, Brøndby, Denmark, for a price of €600 thousand. The purchase price includes goodwill amounting to €280 thousand. As EEX exercises significant influence within the meaning of IAS 28, Gaspoint Nordic A/S has been classified as an associate and accounted for using the equity method since 1 January 2015. In the first quarter of 2015, the International Securities Exchange, LLC, New York, USA, (ISE) made an additional investment of US$30 million in The Options Clearing Corporation, Chicago, USA, (OCC) as part of their plan to fund increased regulatory capital requirements. ISE has also committed to a capital replenishment plan which provides up to an additional US$40 million of
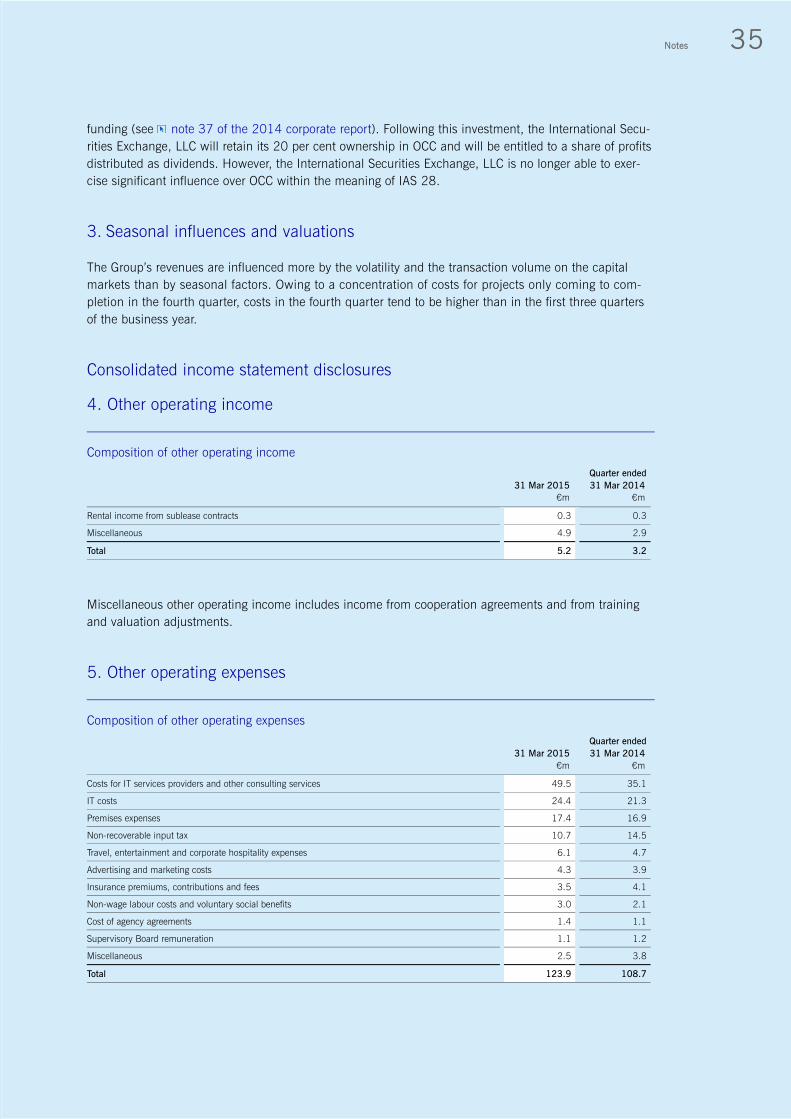
35 Notes
funding (see note 37 of the 2014 corporate report). Following this investment, the International Secu-rities Exchange, LLC will retain its 20 per cent ownership in OCC and will be entitled to a share of profits distributed as dividends. However, the International Securities Exchange, LLC is no longer able to exer-cise significant influence over OCC within the meaning of IAS 28. 3. Seasonal influences and valuations
The Group’s revenues are influenced more by the volatility and the transaction volume on the capital markets than by seasonal factors. Owing to a concentration of costs for projects only coming to com-pletion in the fourth quarter, costs in the fourth quarter tend to be higher than in the first three quarters of the business year. Consolidated income statement disclosures
4. Other operating income
Composition of other operating income
Quarter ended 31 Mar 2015 31 Mar 2014 €m €m Rental income from sublease contracts 0.3 0.3
Miscellaneous 4.9 2.9
Total 5.2 3.2
Miscellaneous other operating income includes income from cooperation agreements and from training and valuation adjustments. 5. Other operating expenses
Composition of other operating expenses
Quarter ended 31 Mar 2015 31 Mar 2014 €m €m Costs for IT services providers and other consulting services 49.5 35.1 IT costs 24.4 21.3 Premises expenses 17.4 16.9 Non-recoverable input tax 10.7 14.5 Travel, entertainment and corporate hospitality expenses 6.1 4.7 Advertising and marketing costs 4.3 3.9 Insurance premiums, contributions and fees 3.5 4.1 Non-wage labour costs and voluntary social benefits 3.0 2.1 Cost of agency agreements 1.4 1.1 Supervisory Board remuneration 1.1 1.2 Miscellaneous 2.5 3.8 Total 123.9 108.7
36 Deutsche Börse Group interim report Q1/2015
Costs for IT services providers and other consulting services relate mainly to expenses in connection with software development. These costs also contain costs of strategic and legal consulting services as well as of audit activities. Consolidated balance sheet disclosures
6. Intangible assets and property, plant and equipment
As at 31 March 2015, intangible assets amounted to €3,848.1 million (31 December 2014: €3,526.5 million). This item primarily consists of goodwill in the amount of €2,377.8 million (31 December 2014: €2,225.0 million), licences, trade names and customer relationships (position “other intangible assets” in the amount of €1,136.2 million; 31 December 2014: €980.2 million), internally developed software in the amount of €175.1 million (31 December 2014: €184.9 million) as well as payments on account and construction in progress of €125.4 million (31 December 2014: €100.2 million). The increase of €152.8 million in goodwill is mainly attributable to exchange rate effects. The increase of €156.0 million in other intangible assets is primarily due to the recognition of hidden reserves totalling €105.7 million in the course of the initial consolidation of Powernext SA and EPEX Spot SE group (see note 2) and due to exchange rate effects. The €9.8 million decline in internally developed software was primarily due to amortisation of €12.5 million. This was offset by currency translation effects of €1.6 million and additions to the basis of consolidation in the amount of €0.9 million. Property, plant and equipment totalled €101.6 million as at 31 March 2015 (31 December 2014: €100.9 million). 7. Financial assets
Financial assets amounted to €1,667.5 million as at 31 March 2015 (31 December 2014: €1,602.2 million). €85.7 million of this increase relates to receivables and securities from banking business. 8. Equity
In financial year 2015, equity increased by €346.9 million to €4,099.0 million (31 December 2014: €3,752.1 million). This was largely attributable to the consolidated net income for the period of €222.3 million and non-controlling interests of €51.8 million arising in connection with the initial consolidation of EPEX Spot SE, Paris, France, and Powernext SA, Paris, France, two subsidiaries of European Energy Exchange AG.

37 Notes
The decline of €33.3 million in the revaluation surplus is mainly due to the change in defined benefit obligations. Exchange rate differences and deferred taxes thereon in the total amount of €78.5 million had an impact on the change in equity. The increase of €13.2 million in non-controlling interests on the basis of realised profits and after ad-justment for dividend distributions contributed to the rise in equity. 9. Pension provisions
Pension provisions are measured using the projected unit credit method in accordance with IAS 19 on the basis of actuarial reports. As at 31 March 2015, the discount rate for pension plans and other em-ployee benefits was 1.60 per cent in Germany and Luxembourg (31 December 2014: 2.15 per cent; 31 March 2014: 3.20 per cent); in Switzerland the discount rate used was unchanged as against year-end 2014, at 1.10 per cent (31 March 2014: 2.00 per cent). 10. Interest-bearing liabilities
The increase in interest-bearing liabilities, which rose from €1,428.5 million as at 31 December 2014 to €1,460.7 million as at 31 March 2015 is mainly due to the strengthening of the US dollar exchange rate in the period under review. In addition, bonds maturing in the financial year with a carrying amount of €158.4 million (31 December 2014: €139.8 million) are reported under “other current liabilities”. 11. Total assets
The increase in consolidated total assets by €51.8 billion to €267.7 billion as at 31 March 2015 (31 December 2014: €215.9 billion) depends to a significant extent on the financial instruments of the central counterparties, receivables and liablities from banking business as well as cash deposits by mar-ket participants. The level of these items can vary widely on a daily basis according to customers’ needs and actions. 12. Fair value hierarchy
Financial assets and liabilities that are measured at fair value are allocated to the following three hierarchy levels: financial assets and liabilities are allocated to level 1 if there is a quoted price for iden-tical assets and liabilities in an active market. They are allocated to level 2 if the inputs on which fair value measurement is based are observable either directly or indirectly; these inputs must be based on market expectations. Financial assets and liabilities are allocated to level 3 if the fair value is determined on the basis of unobservable inputs.

38 Deutsche Börse Group interim report Q1/2015
As at 31 March 2015, financial assets and liabilities measured at fair value were allocated to the hier-archy levels 1 to 3 as follows:
Fair value hierarchy
Fair value as at
31 Mar 2015 thereof attributable to:
Level 1 Level 2 Level 3 €m €m €m €m
Recurrently carried at fair value
ASSETS
Financial assets held for trading
Derivatives
Non-current financial instruments of the central counterparties 8,787.6 8,787.6 0 0
Current financial instruments of the central counterparties 200,733.5 200,733.5 0 0
Current receivables and securities from banking business 47.1 0 47.1 0
Total 209,568.2 209,521.1 47.1 0
Available-for-sale financial assets
Equity instruments
Other equity investments 5.6 0 0 5.6
Total 5.6 0 0 5.6
Debt instruments
Other financial instruments 28.2 28.2 0 0
Non-current receivables and securities from banking business 1,390.7 1,390.7 0 0
Current receivables and securities from banking business 768.3 768.3 0 0
Total 2,187.2 2,187.2 0 0
Total assets 211,761.0 211,708.3 47.1 5.6
LIABILITIES
Financial liabilities held for trading
Derivatives
Non-current financial instruments of the central counterparties 8,787.6 8,787.6 0 0
Current financial instruments of the central counterparties 199,668.4 199,668.4 0 0
Liabilities from banking business 6.3 0 6.3 0
Other current liabilities 5.9 0 0 5.9
Contingent purchase price components
Other non-current liabilities 9.0 0 0 9.0
Total liabilities 208,477.2 208,456.0 6.3 14.9

39 Notes
As at 31 March 2014, financial assets and liabilities measured at fair value were allocated to the hierarchy levels 1 to 3 as follows:
Fair value hierarchy
Fair value as at 31 Mar 2014 thereof attributable to:
Level 1 Level 2 Level 3 €m €m €m €m
Recurrently carried at fair value
ASSETS
Financial assets held for trading
Derivatives
Non-current financial instruments of the central counterparties 6,633.1 6,633.1 0 0
Current financial instruments of the central counterparties 195,756.3 195,756.3 0 0
Current receivables and securities from banking business 0 0 0 0
Total 202,389.4 202,389.4 0 0
Available-for-sale financial assets
Equity instruments
Other equity investments 4.6 0 4.6 0
Total 4.6 0 4.6 0
Debt instruments
Other financial instruments 23.1 23.1 0 0
Non-current receivables and securities from banking business 1,271.9 1,271.9 0 0
Current receivables and securities from banking business 403.3 403.3 0 0
Total 1,698.3 1,698.3 0 0
Total assets 204,092.3 204,087.7 4.6 0
LIABILITIES
Financial liabilities held for trading
Derivatives
Non-current financial instruments of the central counterparties 6,633.1 6,633.1 0 0
Current financial instruments of the central counterparties 195,746.3 195,746.3 0 0
Liabilities from banking business 6.1 0 6.1 0
Other current liabilities 6.1 0 0 6.1
Total liabilities 202,391.6 202,379.4 6.1 6.1
In the first quarter of 2015, no reclassifications were made between the individual levels. Financial assets and financial liabilities listed in levels 2 and 3 are measured as follows: The derivatives listed in level 2 comprise forward foreign exchange transactions. The fair value of the forward foreign exchange transactions is determined on the basis of the forward foreign exchange rates for the remaining period to maturity as at the balance sheet date. They are based on observable market prices. The equity investments allocated to level 2 are measured on the basis of current, comparable market transactions.

40 Deutsche Börse Group interim report Q1/2015
As at the balance sheet date, the items allocated to level 3 and their measurements were as follows:
Development of financial instruments in level 3
Assets Liabilities Total
Other equity investments
Other non-current
liabilities Other current
liabilities €m €m €m €m
Balance as at 1 Jan 2015 5.6 – 9.1 – 5.9 – 9.4
Unrealised capital gains/(losses) recognised in income 0 0.1 0 0.1
Other operating income 0 0.1 0 0.1
Balance as at 31 Mar 2015 5.6 – 9.0 – 5.9 – 9.3
The value of the equity investments listed in level 3 is subject to an annual review by the issuer, and transactions initiated by the issuer may ensue in this process. The fair value of the contingent purchase price components reported under “other non-current liabilities” is firstly attributable to the acquisition of Impendium Systems Ltd. The fair value of this purchase price component amounted to €7.3 million as at the acquisition date. In the course of the first quarter of 2015, there were no material effects recognised in profit or loss. Secondly, the fair value includes a revenue-dependent purchase price component from the acquisition of Cleartrade Exchange (UK) Limited in the amount of €–1.7 million. The measurement of this component in the course of the financial year led to a material effect being recognised in profit or loss of €0.1 million. These two purchase price com-ponents are measured on the basis of internal discounted cash flow models, which discount the ex-pected future payment obligations to the measurement date using interest rates that are appropriate to the risk. Furthermore, as at the start of the year, derivative financial instruments belonging to an incentive pro-gramme amounting to €–5.9 million were allocated to level 3. The financial instruments are regularly measured at fair value through profit and loss using an internal model as at the quarterly balance sheet dates. The results from the subsequent measurement are recognised under “other operating expenses.” As at the balance sheet date 31 March 2015, there were no material effects recognised in profit or loss. The model takes into account the criteria underlying the conditional repayment of the grant made by Eurex Clearing AG. The criteria include, in particular, non-financial indicators as the expected number of customers in a specific market segment as well as expected trading volumes. They are continuously monitored, while taking possible adjustments into account; for this, information of customers is also used. Since there is an internal model, the parameters can be different as at the settlement date; how-ever, the derivative financial instrument will not exceed an amount of €–7.0 million; this amount arises if the beneficiaries of the incentive programme fulfil the conditions and a repayment of the contribution is not taken into consideration. The fair value of other financial assets and liabilities not measured at fair value is determined as follows: The euro and US dollar bonds issued by Deutsche Börse Group have a fair value of €1,755.4 million (31 December 2014: €1,688.4 million) and are reported under interest-bearing as well as current liabilities. The fair value of the euro bonds in the amount of €1,293.7 million is calculated on the basis of the quoted values of the bonds, and the fair value of the US dollar bonds in the amount of €461.7 million represents the present value of the cash flows relating to the private placements on the basis of market parameters. Consequently, the euro bonds are allocated to level 2 and the US dollar bonds to level 3.

41 Notes
The carrying amounts of the following items represent a reasonable approximation of their fair value: Unlisted equity instruments whose fair value generally cannot be reliably determined on a continuous
basis and which are reported under the “financial assets” item; these are carried at cost less any im-pairment losses
Other loans, which are reported under “financial assets” Other receivables and other assets as well as current receivables from banking business, to the extent
that these are measured at amortised cost Restricted bank balances Cash and other bank balances Cash deposits by market participants Other current liabilities Other disclosures
13. Reconciliation to cash and cash equivalents
Reconciliation to cash and cash equivalents
31 Mar 2015 1 Jan 2015 €m €m Restricted bank balances 36,038.9 22,283.5
Other cash and bank balances 929.6 826.1
less bank loans and overdrafts – 0.9 – 0.7
Financial instruments of the central counterparties (netted) 1,065.1 1,249.1
38,032.7 24,358.0
Reconciliation to cash and cash equivalents
Current receivables and securities from banking business 14,600.9 10,307.1
less loans to banks and customers with an original maturity of more than three months 0 – 563.0
less available-for-sale debt instruments – 543.4 – 401.1
Current liabilities from banking business – 15,588.5 – 11,487.1
Current liabilities from cash deposits by market participants – 36,037.7 – 22,282.4
– 37,568.7 – 24,426.5
Cash and cash equivalents 464.0 – 68.5

42 Deutsche Börse Group interim report Q1/2015
14. Earnings per share
Under IAS 33, earnings per share are calculated by dividing the net profit for the period attributable to shareholders of the parent company (net income for the period) by the weighted average number of shares outstanding. Diluted earnings per share are determined by adding the number of potentially dilutive ordinary shares that may be acquired under the Stock Bonus Plan (SBP) to the average number of shares. In order to calculate the number of potentially dilutive ordinary shares, the exercise prices were adjusted by the fair value of the services still to be provided. When determining diluted earnings per share, all SBP tranches for which cash settlement has not been resolved are assumed to be equity-settled – regardless of the actual accounting in accordance with IFRS 2. There were the following potentially dilutive rights to purchase shares as at 31 March 2015:
Calculation of the number of potentially dilutive ordinary shares
Tranche Exercise price
Adjustment of the exercise
price according to IAS 331)
Average number of
outstanding options
Average price for the period2)
Number of potentially
dilutive ordinary shares
€ € 31 Mar 2015 € 31 Mar 2015
20143) 0.00 40.28 38,673 69.06 16,117
1) According to IAS 33.47 (a) for share options and other share-based payment arrangements, the issue price and the exercise price shall include the fair value of any goods or services to be supplied to the entity in the future under the share option or other share-based payment arrangement.
2) Volume-weighted average price of Deutsche Börse AG shares on Xetra for the period 1 January to 31 March 2015 3) This relates to rights to shares under the Share Bonus Plan for senior executives. As the grant date for the 2014 tranche is not until the second quarter of 2015,
the number indicated for the balance sheet date may change subsequently.
As the volume-weighted average share price was higher than the adjusted exercise prices for the 2014 tranche, these options are considered dilutive under IAS 33 as at 31 March 2015.
Calculation of earnings per share (basic and diluted)
Quarter ended (restated)
Quarter ended 31 Mar 2015 31 Mar 2014 Number of shares outstanding as at beginning of period 184,186,855 184,115,657
Number of shares outstanding as at end of period 184,186,855 184,115,657
Weighted average number of shares outstanding 184,186,855 184,115,657
Number of potentially dilutive ordinary shares 16,117 35,461
1)
Weighted average number of shares used to compute diluted earnings per share 184,202,972 184,151,118
Net income for the period (€m) 222.3 229.6
Earnings per share (basic) (€) 1.21 1.25
Earnings per share (diluted) (€) 1.21 1.25
1) Adjusted for the tranches for which cash settlement was resolved

43 Notes
As at 31 March 2015, 148,199 options were excluded from the calculation of the weighted average number of potentially dilutive shares, as their effect during the period is not dilutive. 15. Segment reporting
Composition of sales revenue by segment
Quarter ended (restated)
Quarter ended 31 Mar 2015 31 Mar 2014 €m €m External sales revenue
Eurex 285.9 244.5
Xetra 57.2 50.3
Clearstream 226.4 200.8
Market Data + Services 110.3 94.2
Total external sales revenue 679.8 589.8
Internal sales revenue
Clearstream 2.1 1.9
Market Data + Services 9.9 7.8
Total internal sales revenue 12.0 9.7
Net interest income from banking business1)
Quarter ended (restated)
Quarter ended 31 Mar 2015 31 Mar 2014 €m €m
Gross interest income
Eurex 25.9 3.0
Clearstream 9.9 10.9
Total gross interest income 35.8 13.9
Interest expense
Eurex – 26.8 – 0.5
Clearstream – 0.6 – 2.5
Total interest expense – 27.4 – 3.0
Total 8.4 10.9
1) Including interest result of the central counterparties; prior-year figures have been adjusted accordingly: Q1/2014: +€3.0 million, –€0.5 million; Q2/2014: +€3.2 million, –€0.4 million; Q3/2014: +€0.4 million, –€0.7 million; Q4/2014: +€3.3 million, –€3.5 million

44 Deutsche Börse Group interim report Q1/2015
Net revenue
Quarter ended (restated)
Quarter ended 31 Mar 2015 31 Mar 2014 €m €m Eurex1) 248.3 209.7
Xetra 49.2 43.5
Clearstream 190.8 169.9
Market Data + Services 111.8 93.6
Total 600.1 516.7
1) Including interest result of the central counterparties; prior-year figures have been adjusted accordingly: Q1/2014: +€2.5 million, Q2/2014: +€2.8 million Q3/2014: –€0.3 million, Q4/2014: –€0.2 million
Operating costs
Quarter ended 31 Mar 2015 31 Mar 2014 €m €m Eurex 122.0 102.2
Xetra 17.8 16.3
Clearstream 99.6 85.3
Market Data + Services 53.6 44.0
Total 293.0 247.8
Earnings before interest and tax (EBIT)
Quarter ended (restated)
Quarter ended 31 Mar 2015 31 Mar 2014 €m €m Eurex1) 131.1 181.3
Xetra 31.8 27.5
Clearstream 91.2 84.5
Market Data + Services 58.2 49.7
Total 312.3 343.0
1) Including interest result of the central counterparties; prior-year figures have been adjusted accordingly: Q1/2014: +€2.5 million, Q2/2014: +€2.8 million Q3/2014: –€0.3 million, Q4/2014: –€0.2 million
Investment in intangible assets and property, plant and equipment
Quarter ended 31 Mar 2015 31 Mar 2014 €m €m Eurex 14.4 11.5
Xetra 0.4 0.2
Clearstream 18.2 9.8
Market Data + Services 1.6 0.4
Total 34.6 21.9

45 Notes
16. Financial liabilities and other risks Interest-bearing liabilities
The following payment obligations (recognised under the positions “interest-bearing liabilities” and “other current liabilities”) arose from the interest-bearing liabilities as at 31 March 2015:
Payment obligations from interest-bearing liabilities
Expected payment obligation1) 31 Mar 2015 €m Up to 1 year 199.0
1 to 5 years 910.1
More than 5 years 704.2
Total 1,813.3
1) The expected payments in US dollars were translated into euros at the applicable forward rate.
Other risks
Peterson vs Clearstream Banking S.A., Citibank NA et al. (“Peterson I”) and Heiser vs Clearstream Banking S.A. In its 2012 corporate report, Deutsche Börse Group informed about proceedings, Peterson vs Clear-stream Banking S.A., the first Peterson proceeding, initiated by various plaintiffs seeking turnover of certain customer positions held in Clearstream Banking S.A.’s securities omnibus account with its US depository bank, Citibank NA, and asserting direct claims against Clearstream Banking S.A. for damages of US$250 million. That matter was settled between Clearstream Banking S.A. and the plaintiffs and the direct claims against Clearstream Banking S.A. were dismissed. In July 2013, the US court ordered turnover of the customer positions to the plaintiffs, ruling that these were owned by Bank Markazi, the Iranian central bank. Bank Markazi appealed, and the decision was affirmed on 9 July 2014. Bank Markazi has sought review in the Supreme Court. Once that process is complete, if the funds are turned over, a related case, Heiser vs Clearstream Banking S.A., also seeking turnover of the same assets, will be dismissed. Peterson vs Clearstream Banking S.A. (“Peterson II”) On 30 December 2013, a number of US plaintiffs from the first Peterson case, as well as other US plaintiffs, filed a complaint targeting certain blocked assets that Clearstream Banking S.A. holds as a custodian in Luxembourg. In 2014, the defendants in this action, including Clearstream Banking S.A., moved to dismiss the case. On 19 February 2015, the US court issued a decision granting the defend-ants’ motions and dismissing the lawsuit. On 6 March 2015, the plaintiffs appealed the decision to the Second Circuit Court of Appeals.

46 Deutsche Börse Group interim report Q1/2015
Criminal investigations against Clearstream Banking S.A. On 2 April 2014, Clearstream Banking S.A. was informed that the United States Attorney for the South-ern District of New York has opened a grand jury investigation against Clearstream Banking S.A. due to Clearstream Banking S.A.’s conduct with respect to Iran and other countries subject to US sanction laws. Clearstream Banking S.A. is cooperating with the US attorney. Dispute between MBB Clean Energy AG and end investors A dispute has arisen between MBB Clean Energy AG (MBB), the issuer of a bond eligible in Clearstream Banking AG, and end investors. MBB issued a first tranche of the bond in April 2013 and a second tranche of the bond in December 2013. The global certificates for the two tranches of the bond were delivered into Clearstream Banking AG by the paying agent of the issuer. The dispute relates to the non-payment of the second tranche of the bond with a nominal value of €500 million and the purported lack of validity of the bond. Clearstream Banking AG’s role in this case is primarily to have accepted the note in its system as national central securities depository. At this stage, it is unclear if and to what extent potential damages exist and if so who would ultimately be responsible. MBB, the relevant paying agent and Clearstream Banking AG have agreed on replacing the bond with a global certificate with a new ISIN for so-called qualified investors. The issuer of the bond has informed Clearstream Banking AG in November 2014 that the process designed to resolve the problem has been postponed. CBOE vs ISE On 12 November 2012, the Chicago Board Options Exchange (CBOE) filed a patent infringement lawsuit against the International Securities Exchange (ISE) (the “CBOE Litigation”). In the CBOE Litiga-tion, CBOE alleges US$525 million in damages for infringement of three patents, which relate to systems and methods for limiting market-maker risk. ISE believes that CBOE’s damages claim lacks merit because it is unsupported by the facts and the law. ISE intends to vigorously defend itself in this lawsuit. Upon ISE’s motion, the case was stayed, pending the outcome of certain petitions filed by ISE with the U.S. Patent and Trademark Office (USPTO) in which ISE seeks to invalidate the CBOE patents. On 2 March 2015, the USPTO has partially granted ISE’s petitions and has issued decisions determin-ing that all three CBOE patents are at least insofar invalid as they constitute unpatentable abstract ideas. These decisions can be appealed by CBOE at the U.S. Court of Appeals for the Federal Circuit. In addition to the matters described above and in prior disclosures, Deutsche Börse Group is from time to time involved in various legal proceedings that arise in the ordinary course of its business. Deutsche Börse Group recognises provisions for litigation and regulatory matters when it has a present obligation from an event in the past, an outflow of resources with economic benefit to settle the obligation is prob-able and it is possible to reliably estimate the amount. In such cases, there may be an exposure to loss in excess of the amounts accrued. When these conditions are not met, Deutsche Börse Group does not recognise a provision. As a litigation or regulatory matter develops, Deutsche Börse Group evaluates on an ongoing basis whether the requirements to recognise a provision are met. Deutsche Börse Group may not be able to predict what the eventual loss or range of loss related to such matters will be. Deutsche Börse Group does not believe, based on currently available information, that the results of any of these various proceedings will have a material adverse effect on its financial statements as a whole.

47 Notes
Tax risks
Due to its business activities in various countries, Deutsche Börse Group is exposed to tax risks. A pro-cess has been developed to recognise and evaluate these risks, which – in the first place – are recog-nised depending on the probability they will arise. In a second step, these risks are measured on the basis of their expected value. In case it is more probable than not that the risks will arise, a tax provision is recognised. Deutsche Börse Group continuously reviews if the preconditions for the recognition of corresponding tax provisions are met. 17. Material transactions with related parties
The following table shows the material transactions with companies classified as related parties. All transactions were effected on an arm’s length basis.
Material transactions with associates
Amount of the transactions Outstanding balances
Quarter ended 31 Mar 2015 31 Mar 2014 31 Mar 2015 31 Mar 2014 €m €m €m €m
Loans from Deutsche Börse AG to Indexium AG1) 0 n.a. 0
1) n.a.
Loans from Deutsche Börse AG to Digital Vega FX Ltd. 0 0 0.4 0.3
Transactions within the framework of gold under custody between Deutsche Börse Commodities GmbH and Clearstream Banking AG – 1.1 – 0.8 – 0.4 – 0.3
Calculation services, provision of software solutions for indices and benchmark and operation of necessary software for Deutsche Börse AG by Indexium AG – 0.92) – 1.0 – 1.33) – 0.6
Calculation services, provision of software solutions for indices and benchmark and operation of necessary software for STOXX Ltd. by Indexium AG – 1.64) – 0.8 – 1.24) – 0.6
Operation and development of Xontro and provision of services within the scope of the operation of stock exchange by Deutsche Börse AG for BrainTrade Gesellschaft für Börsensysteme mbH 1.2 1.4 0.5 0.6
Provision of IT services in the Cloud Computing Capacity Trading area for Deutsche Börse Cloud Exchange AG by Deutsche Börse AG 0.1 n.a. 0 n.a.
Licence of operating and trading for Tradegate AG Wertpapierhandelsbank by Deutsche Börse AG 0.5 n.a. 0.1 n.a.
Provision of management services and charging-on of project costs (Market Coupling) for EPEX Spot SE by European Energy Exchange AG and affiliates5) n.a. n.a. n.a. n.a.
Loans from Deutsche Börse AG to Bondcube Limited 0 n.a. 0.66) n.a.
Provision of services by Hanweck Associates, LLC for Eurex Frankfurt AG within a project agreement 0 n.a. 0 n.a.
Other transactions with associates – – 0.1 0
1) Outstanding balance after impairment losses of €5.5 million on the loan granted to Indexium AG by Deutsche Börse AG 2) Thereof provisions for development costs amounting to €0.6 million 3) Thereof provisions for development costs amounting to €0.9 million 4) Thereof provisions for development costs amounting to €1.2 million 5) EPEX Spot SE has been fully consolidated in Deutsche Börse AG’s consolidated financial statements since 1 January 2015. 6) The loan agreement in the amount of £2.6 million entered into with Bondcube Limited in December 2014 is being paid out in tranches from January 2015
onwards.

48 Deutsche Börse Group interim report Q1/2015
Transactions with key management personnel
Key management personnel are persons who directly or indirectly have authority and responsibility for planning, directing and controlling the activities of Deutsche Börse Group. The Group defines the members of the Executive Board and the Supervisory Board as key management personnel for the purposes of IAS 24. In the first quarter of 2015, Deutsche Börse AG had the following business relations with entities whose key management personnel are, at the same time, key management personnel at entities within Deutsche Börse Group. On 30 July 2009, European Commodity Clearing Luxembourg S. à r.L., Luxembourg, (ECC Luxem-bourg) – a subsidiary of European Commodity Clearing AG and thus a member of the EEX group – entered into a managing director agreement with ffp Conseils SARL, Metz, France, for an indefinite period. The subject of the agreement is to provide a natural person for the function of managing director in the management of ECC Luxembourg. In addition to his/her position as managing director of ECC Luxembourg, this person is also a member of the key personnel at the parent company of ffp Conseils SARL, pmi Beratung GmbH. In the first quarter of 2015, ECC Luxembourg made payments of approximately €15 thousand for these managing director services. Moreover, a follow-on agreement for the provision of advisory services was entered into between Deutsche Börse AG and KM Networks GmbH, Hofheim, Germany, at the beginning of financial year 2015. A supervisory board member of European Energy Exchange AG is at the same time a member of the key personnel at the consultancy firm KM Networks. No payments were made in connection with these advisory services in the first quarter of 2015. 18. Employees
Employees
Quarter ended 31 Mar 2015 31 Mar 2014 Average number of employees during the period 4,725 4,009
Employed as at the balance sheet date 4,749 4,028
The increase in the number of employees results largely from changes to the basis of consolidation (485 employees). Since new jobs were created in connection with strategically important projects, the number of employees increased by 236 persons year-on-year as at the balance sheet date. There was an average of 4,431 full-time equivalent (FTE) employees during the first quarter of 2015 (Q1/2014: 3,753).

49 Notes
19. Events after the balance sheet date
On 17 April, the power exchanges EPEX Spot SE, an EEX subsidiary, and APX Group, including Belpex, announced that they intend to integrate their businesses in order to form a power exchange for Central Western Europe and the UK. Both companies have signed respective agreements. The integration will lead to a more effective governance and further facilitate the creation of a single Euro-pean power market. Frankfurt / Main, 29 April 2015 Deutsche Börse AG The Executive Board

Contact
Investor Relations
Phone +49-(0) 69- 2 11-1 16 70
Fax +49-(0) 69- 2 11-1 46 08
E-mail [email protected]
www.deutsche-boerse.com/ir_e
Publication date
29 April 2015
Publications service
The 2014 corporate report may be obtained from
the publications service of Deutsche Börse Group.
Phone +49-(0) 69- 2 11-1 15 10
Fax +49-(0) 69- 2 11-1 15 11
Downloads at www.deutsche-boerse.com/annualreport
Reproduction – in whole or in part – only with
the written permission of the publisher
Registered trademarks
CEF®, DAX®, Eurex®, Eurex Repo®, GC Pooling®,
Xetra® and Xetra-Gold® are registered trademarks
of Deutsche Börse AG.
STOXX® is a registered trademark of STOXX Ltd.
PEGAS® is a registered trademark of Powernext SA.
KOSPI is a registered trademark of
Korea Exchange, Inc.


Published byDeutsche Börse AG60485 Frankfurt /MainGermanywww.deutsche-boerse.com
Order number 1015-4573
Financial calendar29 April 2015Q1/2015 results
13 May 2015Annual General Meeting
2 June 2015Investor day
27 July 2015Half-yearly financial report
28 October 2015Q3/2015 results