quantitative trait loci mapping, genome-wide association
TRANSCRIPT
University of Arkansas, FayettevilleScholarWorks@UARK
Theses and Dissertations
12-2016
Quantitative Trait Loci Mapping, Genome-wideAssociation Analysis, and Gene Expression of SaltTolerance in SoybeanAilan ZengUniversity of Arkansas, Fayetteville
Follow this and additional works at: http://scholarworks.uark.edu/etd
Part of the Agronomy and Crop Sciences Commons, and the Plant Breeding and GeneticsCommons
This Dissertation is brought to you for free and open access by ScholarWorks@UARK. It has been accepted for inclusion in Theses and Dissertations byan authorized administrator of ScholarWorks@UARK. For more information, please contact [email protected], [email protected].
Recommended CitationZeng, Ailan, "Quantitative Trait Loci Mapping, Genome-wide Association Analysis, and Gene Expression of Salt Tolerance inSoybean" (2016). Theses and Dissertations. 1778.http://scholarworks.uark.edu/etd/1778
Quantitative Trait Loci Mapping, Genome-wide Association Analysis, and Gene Expression of Salt Tolerance in Soybean
A dissertation submitted in partial fulfillment of the requirements for the degree of
Doctor of Philosophy in Crop, Soil, and Environmental Sciences
by
Ailan Zeng Nanchang University
Bachelor of Science in Biological Engineering, 2007 University of Arkansas
Master of Science in Crop, Soil, and Environmental Sciences, 2012
December 2016 University of Arkansas
This thesis is approved for recommendation to the Graduate Council.
Dr. Pengyin Chen Dissertation Director
Dr. Ken Korth Dr. Floyd Hancock Committee Member Committee Member
Dr. Kristofor Brye Dr. Andy Pereira Committee Member Committee Member

ABSTRACT
Salt stress is a common abiotic stress causing yield reduction in soybean. There are differential
responses, namely tolerance (excluder) and intolerance (includer), among soybean germplasm. However,
the genetic and physiological mechanism for salt tolerance is not clear. Identification of novel QTL for salt
tolerance and genes that are differentially expressed under salt stress would help elucidate the salt
tolerance mechanism and facilitate the development of salt tolerant cultivars through marker assisted
selection (MAS). The objectives of this study were to identify new QTL or genes responsible for salt
tolerance using three approaches: QTL mapping, association analysis, and RNA sequencing (RNA-seq).
A salt-sensitive cultivar, RA-452, was crossed with a salt-tolerant cultivar, Osage, to develop an F4-
derived QTL mapping population. Composite interval mapping (CIM) analysis indicated that a major
chloride (Cl-)-tolerant QTL was confirmed and narrowed down on Chr. 3 in both NaCl and KCl treatments,
a novel Cl--tolerant QTL on Chr. 15 was identified in NaCl treatment, and a novel Cl--tolerant QTL on Chr.
13 was identified in KCl treatment. Based on the results from the screening of the RA-452 x Osage
mapping population, two F4:6 lines with extreme responses, most tolerant and most sensitive, were
selected for a time-course gene expression study. A total of 2374, 998, 1746, and 630 differentially
expressed genes (DEGs) between salt-tolerant line and salt-sensitive line, were found at 0, 6, 12, and 24
h, respectively. The gene expression profiles of six genes including Glyma.02G228100,
Glyma.03G031400, Glyma.04G180300, Glyma.04G180400, Glyma.05G204600, and Glyma.17G173200
were verified by qRT-PCR. In addition, a total of 283 diverse germplasm lines were obtained from the
Germplasm Resource Information Network (GRIN) and screened for salt stress response in greenhouse.
A total of 33,009 SNPs across 283 genotypes were employed in the association analysis with leaf
chloride concentration and leaf chlorophyll concentration. Association analysis results confirmed the salt-
tolerance QTL on Chr. 3 and revealed eight new putative QTL on Chr. 2, 7, 8, 10, 13, 14, 16, and 20.
These QTL and linked SNP markers will be useful for MAS in breeding salt-tolerant soybean varieties.

ACKNOWLEGEMENTS
I would like to thank my academic advisor Dr. Pengyin Chen for his tremendous support in my
Ph.D. study and research. He is an outstanding mentor by training me not only in conventional soybean
breeding, molecular breeding, data analysis, but also in social skills. I am eternally grateful for his
guidance.
I am also thankful to my committee members Dr. Ken Korth, Dr. Floyd Hancock, Dr. Andy
Pereira, and Dr. Kristofor Brye for their suggestions and input in my research projects.
I would like to thank all former and current members of the soybean breeding program for their
consistent help in my greenhouse and field experiments.
I am extremely thankful to my family members for their unconditional love, encouragement, and
patience.
DEDICATION
This dissertation is dedicated to all my lovely family members.

TABLE OF CONTENTS
CHAPTER 1 Introduction ........................................................................................................................... 1
Mechanism of salt tolerance ..................................................................................................................... 3
Molecular markers and quantitative trait loci (QTL) mapping in soybean ................................................. 6
Genome-wide association analysis and genomic selection in soybean ................................................... 8
RNA sequencing analysis in soybean ..................................................................................................... 13
Hypotheses ............................................................................................................................................. 15
Objectives ................................................................................................................................................ 15
References .............................................................................................................................................. 16
CHAPTER 2 Quantitative Trait Loci (QTL) for Chloride Tolerance in Osage Soybean ...................... 26
Abstract ................................................................................................................................................... 27
Introduction .............................................................................................................................................. 28
Materials and methods ............................................................................................................................ 30
Parental materials and population development ................................................................................. 30
Evaluation of salt tolerance ................................................................................................................. 31
DNA extraction .................................................................................................................................... 31
SNP marker screening ........................................................................................................................ 32
Data analysis ....................................................................................................................................... 32
Results .................................................................................................................................................... 32
Phenotypic data .................................................................................................................................. 32
Quantitative trait loci mapping in F4:6 populations by single nucleotide polymorphisms markers ....... 33
Discussion ............................................................................................................................................... 34
Acknowledgement ................................................................................................................................... 36
References .............................................................................................................................................. 37
CHAPTER 3 Genome-wide Association Study (GWAS) of Salt Tolerance in Worldwide Soybean
Germplasm Lines ...................................................................................................................................... 48
Abstract ................................................................................................................................................... 49
Introduction .............................................................................................................................................. 50
Materials and methods ............................................................................................................................ 52
Plant materials and evaluation of salt tolerance in greenhouse .......................................................... 52
Analysis of variance (ANOVA) and heritability ..................................................................................... 53
Genotyping and quality control ............................................................................................................. 53
Linkage disequilibrium estimation ........................................................................................................ 53
Population structure ............................................................................................................................. 54
Genome-wide association analysis ...................................................................................................... 54
Results .................................................................................................................................................... 55

Phenotypic data .................................................................................................................................. 55
Distribution of SNP Markers, linkage disequilibrium, and population structure .................................. 55
Genome-wide association analysis ..................................................................................................... 56
Discussion ............................................................................................................................................... 56
Acknowledgement ................................................................................................................................... 59
References .............................................................................................................................................. 60
CHAPTER 4 RNA Sequencing Analysis of Salt Tolerance in Soybean (Glycine max) ...................... 89
Abstract ................................................................................................................................................... 90
Introduction .............................................................................................................................................. 91
Materials and methods ............................................................................................................................ 92
Plant materials .................................................................................................................................... 92
Salt treatment ...................................................................................................................................... 93
RNA sequencing analysis ................................................................................................................... 93
Quantitative reverse transcription polymerase chain reaction (qRT-PCR) ......................................... 94
Results .................................................................................................................................................... 94
Numbers of differentially expressed genes (DEGs) at different time points ....................................... 94
Expression patterns of differentially expressed genes (DEGs) under salt stress ............................... 95
Comparison between the non-differentially expressed genes and differentially expressed genes overtime .............................................................................................................................................. 95
Annotation of differentially expressed genes (DEGs) under salt stress ............................................. 96
Verification of RNA-seq results by qRT-PCR ..................................................................................... 96
Discussion ............................................................................................................................................... 96
Acknowledgement ................................................................................................................................... 99
References ............................................................................................................................................ 100
Overall Conclusion ................................................................................................................................ 123
References ............................................................................................................................................ 125

LIST OF TABLES
Chapter 2
Table 1. Summary of single nucleotide polymorphism markers used in the initial screen of the parental genotypes and F4:6 population derived from RA-452 x Osage. ................................................................ 40
Table 2. Leaf chloride concentration (mg kg-1) of parents and F4:6 mapping population from RA-452 x Osage evaluated using (A) 120 mM NaCl or (B) 120 mM KCl over two months and (C) control. ............. 41
Table 3. Analysis of variance for leaf chloride concentration of 124 F4:6 population from the cross RA-452 x Osage under (A) 120 mM NaCl or (B) 120 mM KCl treatment in the greenhouse over two months in 2013. .......................................................................................................................................................... 42
Table 4. Single marker analysis of variance for chloride tolerance in 124 F4:6 lines derived from RA-452 x Osage evaluated using 120 mM NaCl or 120 mM KCl over two months in 2013. SNP, single nucleotide polymorphism. ............................................................................................................................................ 43
Table 5. Mean effect of single nucleotide polymorphism (SNP) marker alleles on chloride tolerance (leaf chloride concentration (mg kg-1)) in 124 F4:6 lines derived from RA-452 x Osage evaluated using 120 mM NaCl over two months in 2013. ........................................................................................................... 44
Table 6. Mean effect of single nucleotide polymorphism (SNP) marker alleles on chloride tolerance (leaf chloride concentration (mg kg-1)) in 124 F4:6 lines derived from RA-452 x Osage evaluated using 120 mM KCl over two months in 2013. ............................................................................................................. 45
Chapter 3
Table 1. The list of a total of 283 soybean cultivars screened for salt tolerance in greenhouse experiments in 2014 and 2015. .................................................................................................................. 63
Table 2. Distribution pattern of 283 cultivars in 29 countries. ..................................................................... 69
Table 3. Selected SNP markers in euchromatic and heterochromatic regions of each soybean chromosome for association analysis with leaf chloride concentration and leaf chlorophyll concentration. . .................................................................................................................................................................... 70
Table 4. Leaf chloride concentration (mg kg-1) (A) and leaf chlorophyll concentration (SPAD value) (B) of association mapping population (283 PIs) and checks (Osage and Dare) evaluated with 120 mM NaCl in 2014 and 2015. .......................................................................................................................................... 72
Table 5. Analysis of variance (ANOVA) for leaf chloride concentration (A) and leaf chlorophyll concentration (SPAD value) (B) of 283 PIs lines under 120 mM NaCl treatment in the greenhouse over two years. ................................................................................................................................................... 73
Table 6. Average linkage disequilibrium (LD) rate based on 33,009 SNPs within 10,000 kilo base pairs (kb) windows in the population of 283 plant introductions lines. ................................................................ 74
Table 7. Divergence among subpopulation and average distance (expected heterozygosity) among individuals in the same subpopulation. ...................................................................................................... 75
Table 8. List of SNPs significant associated with both leaf chloride concentration (mg kg-1) and leaf chlorophyll concentration (SPAD value) over two years based on GLM (-Log10 P ≥ 4.0, p <- 7.9 x10⁻⁵).
.................................................................................................................................................................... 76
Table 9. List of common significant SNPs between GLM and MLM models. ............................................ 81
Chapter 4
Table 1. Statistics of paired-end reads for soybean lines in the RNA-Seq experiments. ........................ 102

Table 2. Differentially expressed genes (DEGs) between salt-tolerant and salt-sensitive lines at each time point. ......................................................................................................................................................... 104
Table 3. Common differentially expressed genes (DEGs) among time points. ....................................... 105
Table 4. Differentially expressed (up/down-regulated) salt-stress responsive genes indicated by Log2 (fold change) (Log2 FC) in expression level of salt-tolerant to salt-sensitive lines at 0, 6, 12, 24 h, respectively. .................................................................................................................................................................. 106
Table 5. Consistently expressed salt-stress responsive genes indicated by Log2 (fold change) (Log2 FC) of expression level of salt-tolerant to salt-sensitive lines at 0, 6, 12, 24 h, respectively. .......................... 107
Table 6. Non-significant differentially expressed genes between salt-tolerant and salt-sensitive lines at 0 h and corresponding significant differential expressed genes between salt-tolerant and salt-sensitive lines at other time points. ....................................................................................................................................... 108
Table 7. Gene annotations of differentially expressed genes (DEGs) between salt-tolerant and salt-sensitive lines detected at all the time points. .......................................................................................... 109
Table 8. Gene annotations of differentially expressed genes (DEGs) between salt-tolerant and salt-sensitive lines at 6, 12, and 24 h, respectively, compared to non-differentially expressed genes at 0 h.
.................................................................................................................................................................. 111
Table 9. Primers used in the qRT-PCR analysis. .................................................................................... 113
Table 10. Log2 (fold change) (Log2 FC) of expression level of salt-tolerant to salt-sensitive lines at 0, 6, 12, and 24 h obtained from qRT-PCR analysis. ............................................................................................ 114
LIST OF FIGURES
Chapter 2
Figure 1. Distribution of leaf chloride concentration (mg kg-1) of 124 F4:6 lines from RA-452 x Osage evaluated under (A) 120 mM NaCl or (B) 120 mM KCl treatment in the greenhouse over two months in 2013. ........................................................................................................................................................... 46
Figure 2. Composite interval mapping using single nucleotide polymorphism markers for chloride tolerance quantitative trait loci in 124 F4:6 lines from RA-452 x Osage evaluated using two salt treatments (A-B) 120 mM NaCl; (C-D) 120 mM KCl. .................................................................................................... 47
Chapter 3
Figure 1. The distribution of leaf chloride concentration (mg kg-1) of 283 plant introduction (PIs) evaluated with 120 mM NaCl treatment in 2014 (A), 2015 (B), and for two-year combined (C). ................................ 82
Figure 2. The distribution of leaf chlorophyll concentrations (SPAD values) of 283 plant introduction (PIs) evaluated with 120 mM NaCl treatment in 2014 (A), 2015 (B), and for two-year combined (C). ............... 83
Figure 3. Distribution of minor allele frequencies (MAF) of 33,009 SNPs in the population of 283 plant introductions. .............................................................................................................................................. 84
Figure 4. Population structure results using 3,301 SNPs. The rate of change in the log probability of data (∆K) against the successive K values from the structure run. .................................................................... 85
Figure 5. Estimated population structure of 283 soybean genotypes (K=3). The x-axis is the genotype, and y-axis is the subpopulation membership. Colors represent the assigned subpopulations: red zone = subpopulation 1; green zone = subpopulation 2; blue zone = subpopulation 3.......................................... 86
Figure 6. Manhattan plot of –Log10(P) values for each SNP against chromosomal position for leaf chloride concentration in (A) 2014; (B) 2015; (C) combined chloride over 2014 and 2015. ....................... 87
Figure 7. Manhattan plot of –Log10(P) values for each SNP against chromosomal position for leaf chlorophyll concentrations (SPAD values) in (A) 2014; (B) 2015; (C) combined chlorophyll over 2014 and 2015. ........................................................................................................................................................... 88
Chapter 4
Figure 1. Soybean lines exposing to 250 mM NaCl solution for 0, 6, 12, and 24 h, respectively. ........... 115
Figure 2. Venn diagram showing overlapped differential expressed genes (DEGs) among different time points (0, 6, 12 and 24 h after the initiation of salt treatment). .................................................................. 116
Figure 3. Upregulated differentially expressed genes at 6, 12, and 24 h compared to 0 h, indicated by Log2 (fold change) of expression level of salt-tolerant to salt-sensitive lines. .......................................... 117
Figure 4. Downregulated differentially expressed genes at 6, 12, and 24 h compared to 0 h, indicated by Log2 (fold change) of expression level of salt-tolerant to salt-sensitive lines. .......................................... 118
Figure 5. Heatmap analysis of common differentially expressed genes at 0, 6, 12 and 24 h. The values used to draw heatmaps are Log2 (fold change) of expression level of salt-tolerant to salt-sensitive lines. .................................................................................................................................................................. 119
Figure 6. Heatmap analysis of differentially expressed genes at 12 h. The values used to draw heatmaps are Log2 (fold change) of expression level of salt-tolerant to salt sensitive lines. .................................... 120
Figure 7. Gene ontology categories for significant differentially expressed genes between salt-tolerant and salt-sensitive lines under salt stress. ................................................................................................. 121
Figure 8. The gene expression profile of Glyma.02G228100 and Glyma.05G204600 verified by qRT-PCR. .......................................................................................................................................................... 122

LIST OF SUBMITTED PAPERS
Chapter 2: Ailan Zeng, Laura Lara, Pengyin Chen*, Xiaoyan Luan, Floyd Hancock, Ken Korth, Kristofer Brye, Andy Pereira, and Chengjun Wu. 2016. Quantitative trait loci mapping for chloride tolerance in Osage soybean. Crop Sci. (In review) Chapter 3: Ailan Zeng, Pengyin Chen*, Ken Korth, Floyd Hancock, Andy Pereira, Kristofor Brye, and Chengjun Wu. 2016. Genome-wide association analysis of salt tolerance using worldwide soybean. Mol. Breed. (Accepted)

1
Chapter 1. Introduction
Soybean [Glycine max (L.) Merr.] is an important cash crop which returns the farmers 473 dollars
per planted acre in United States (Soystats, 2015). United States has 34% of world soybean production,
followed by Argentina, Brazil, and China (Soystats, 2015). Soybean is processed mainly for oil, and the
defatted or toasted soybean is used as soybean meal to feed animals. Soybeans provide 68% of world
protein meal and 27% of world vegetable oil in 2014 (Soy Stats, 2015). Up to 45% of soybean produced
in the United States was exported as the whole soybean, oil, and soybean meal in 2014; the largest
portion was exported to China where soybean was regarded as the staple food to provide the protein for
human diet (Soy Stats, 2015). Soybean yield has steadily risen from 33.3 to 47.8 bushel/acre in the past
two decades (Soystats, 2015), yield has to continue increasing to meet the demand of a growing world
population (Gerland et al., 2014). On the other hand, soybean yield and seed quality is constrained by
various abiotic stresses such as cold, salinity, drought, flooding, heat, and ozone, separately and in
combination (Frederick et al., 2001; Heggestad et al., 1985; Mann and Jaworski, 1970; Miller et al., 1989;
Nukaya et al., 1982; Scott et al., 1989); therefore, minimizing these losses is a major concern in soybean
breeding and production.
As a major abiotic stress, salinity or salt stress reduces more than 20% of soybean yield (Beecher
1994; Katerji et al., 2003). Salinity also causes slowed and stunted plant growth (Poljakoff-Mayber, 1975;
Essa, 2002), leaf chlorosis, leaf scorching, and leaf abscission (Parker et al., 1983). In addition, salt
stress adversely affects the height, biomass, number of internodes, branches, and pods, weight of 100
seed, seed protein concentration, nitrogen fixation efficiency, and the number and biomass of root
nodules (Abel and MacKenzie, 1964; Chang et al., 1994; Wan et al., 2002; Singleton and Bohlool, 1984;
Delgado et al., 1994; Elsheikh and Wood, 1995). Soil with electricity conductivity of its saturated paste
extract above 4 ds/m or 40 mM NaCl (U.S. Salinity Laboratory, 1947; USDA-ARS, 2008) is regarded as
saline. Approximately 7% (831 million hectares) of the global land (Martinez-Beltran and Manzur, 2005)
and 20% (45 million hectares) of irrigated land is affected by salt stress (FAO, 2002). Salt-affected arable
land will increase to 50% by 2050 (Blumwald and Grover, 2006). Soil salinization transforms the fertile
soils in irrigated lands to barren lands. There are two types of salinity which are primary salinity and
secondary salinity. Primary salinity occurs naturally, and may be caused by weathering of the parental

2
rocks, or oceanic salts transported by wind and rain; secondary salinity results from human activities such
as the use of salty irrigation water and insufficient leaching in agriculture (Rengasamy et al., 2006; Munns
and Tester, 2008). The estimated damage to the economic region of Colorado River Basin in United
States was 750 million dollars per year due to secondary salinity problems (Colorado River Basin Salinity
Control Forum, 1993). In recent years, Arkansas counties including Monroe, Cross, White, Desha, Chicot,
Poinsett and Ashley, have experienced salinity problems due to the salt concentration of irrigation water
and poor drainage (Chapman, 1995).
The salinity to which the soybeans are exposed could be minimized by reclamation including
scraping, flushing, and leaching, or drainage including surface drainage, subsurface drainage, and pump
drainage, or irrigation with high-quality water (Abrol et al., 1988; Oster et al., 1996). Development of salt-
tolerant cultivars provides a long-term solution to improve soybean production in saline soil. Soybean
germplasm lines have differential response to salt stress, namely salt-tolerant and salt-sensitive (Abel and
Mackenzie, 1964; El-samad and Shaddad, 1997; Shao et al., 1986; Shao et al., 1993; Yang and
Blanchar, 1993), salt tolerant lines could be directly selected through measuring plant response to salt
stress or indirectly selected by marker assisted selection (MAS). Once a salt tolerant genotype is
discovered, the salt tolerance trait could be transferred to further lines by breeding cycles (Shannon,
1985).
A number of methodologies have been proposed to evaluate soybean genotypes for salt
tolerance in the greenhouse. Leaf injury index (Shao et al., 1986), germination rate and leaf necrosis
(Shao et al., 1993), death plant rates (Shao et al., 1995), visual foliar symptoms (Valencia et al., 2008),
leaf scorch score (LSS) (Lee et al., 2004; Ledesma et al., 2016), leaf chlorophyll concentration (SPAD)
(Patil et al., 2016), and Cl- concentration in leaves (Lee et al., 2004; Ledesma et al., 2016) were used as
criteria to classify tolerant and sensitive genotypes. Significant difference on leaf scorch score and Cl-
concentration in leaves between tolerant and sensitive genotypes can be obtained after 12-15 days of
120 mM NaCl treatment in sandy soil in plastic pots (Ledesma et al., 2016). Determination of salt
tolerance can also be achieved by screening breeding lines using 100 mM NaCl in a sandy soil in plastic
cone-tainers (PC method) (Lee et al., 2004). Based on visual foliar symptoms, Cl- includer and Cl-

3
excluder can be identified using hydroponics with 120 mM NaCl (Valencia et al., 2008). In these salt-
tolerance screening methods, soybean seedlings at V1, V2 or V3 stages were exposed to constant levels
of salt solution in the greenhouse for around two weeks; visual foliar symptoms were scored, leave
samples were taken for Cl- concentration analysis. Most methods identified to identify salt-tolerance lines
in greenhouse is time-consuming, labor-intensive, stage-dependent, and environment dependent. The
efficiency of breeding salt-tolerance varieties can be enhanced by MAS. Molecular markers which are
closely linked to salt tolerance QTL are able to select out salt-tolerance lines indirectly.
Mechanism of salt tolerance
Soil salinity is mainly caused by ions such as Cl-, SO42-, HCO3
-, Na+, Ca2+, and Mg2+ (Bernstein,
1975). Soil salinity inhibits plant growth in two aspects. Osmotic stress of salts in the soil decreases water
availability to root. Salts can accumulate excessively within the plant and can cause ion toxicity
(Katsuhara and Kawasaki, 1996; Blumwald, 2000; Munns and Tester, 2008). Mechanisms of salt
tolerance in soybean fall into four categories, including maintenance of ion homeostasis, osmotic
adjustment, oxidative balance restoration, metabolic and structural adaptation (Phang et al., 2008).
Maintenance of ion homeostasis
Sodium Chloride (NaCl) is the predominant salt. Most studies in soybean indicated that salt-
induced damage in soybean is related to Cl- concentration in the aerial part (Abel and MacKenzie, 1964;
Abel, 1969). Salt-sensitive cultivars or chloride includers accumulate chloride in stems and leaves,
whereas salt-tolerant cultivars or chloride excluders exclude chloride (Abel and MacKenzie, 1964). Cl- is
more toxic than Na+ to seedlings of G. max, the injury of G. max is positively correlated with the Cl-
concentration in the leaves, and negatively associated with the Cl- concentration in the roots (Luo et al.,
2005b). Less Na+ is accumulated in leaves of salt-tolerant soybean than in salt-sensitive ones (Li et al.,
2006; Essa, 2002). Therefore, whether Na+ or Cl- is the primary factor for salt-induced mortality is still
unknown, and both homeostasis of Na+ and Cl- are vital to the salt tolerance in soybean. Ion transporters
which regulate ion homeostasis have been studied in the gene expression level in soybean. Cl-
homeostasis in soybean is controlled by Cl- channel which is localized in tonoplast (Li et al., 2006), and
the Cl- transporter is encoded by the putative chloride channel gene (GmCLC1) which is expressed both

4
in leaves and roots of soybean (Li et al., 2006). GmCLC1 ion transporter alleviates the toxic effects of
NaCl by sequestering Cl- from cytoplasm into vacuole (Li et al., 2006).
Na+ homeostasis in soybean is regulated through inter- and intracellular compartmentalization.
Na+ competes with K+ under saline condition, high K+: Na+ ratios improve plant resistance to salinity (Asch
et al., 2000). The Na+ - K+ exchange is regulated by Na+/H+ or K+/H+ antiporters and energized by H+-
ATPase (Lacan and Durand, 1996). Therefore, higher activity of H+-ATPase was observed in the
tonoplast of roots in salt-tolerant soybean than that of salt-sensitive ones (Yu et al., 2005). Na+/H+
antiporters include plant Na+-H+ exchanges (NHXs) which are located in tonoplast and SOS1 which are
located in plasma membrane (Shi et al., 2002). Two Na+-NHX homologs which were GmNHX1 and
GmNHX2, respectively, were found in soybean. GmNHX1 confers salt tolerance by sequestering Na+ to
vacuoles (Li et al., 2006). Na+ efflux in soybean is also controlled by soybean SOS1 homologue
(GmSOS1) (Phang, 2009). Cation/proton exchanger (CAX) family is also involved in ion regulation of
plant cells. The expression of soybean putative cation/proton antiporter (GmCAX1) was induced by PEG,
ABA, Ca2+, Na+, and Li+ treatments. GmCAX1 resulted in less Ca2+, Na+, and Li+ in the treatments than
that of the controls (Luo et al., 2005a).
Osmotic adjustment
High salt in the environment poses osmotic stress to soybeans. To cope with osmotic stress,
soybean plants experience osmotic adjustment by accumulating osmoprotectants and late
embryogenesis abundant (LEA) proteins. Major osmoprotectants involving the salt tolerance of soybean
includes glycinebetaine, trigonelline (TRG), pinitol, and proline. In response to salt stress, TRG
concentration is increased in salt tolerant soybeans but not in salt sensitive ones (Wood, 1999). Foliar
application of glycinebetaine serves as a potential strategy to enhance salt tolerance in soybean due to its
role in coping with drought stress in soybean (Agboma et al., 1997). Pinitol concentration is higher in the
soybean germplasm originating from arid or semiarid regions than those originating from humid regions
(Streeter et al., 2001). The increase of proline concentration in soybean is induced by the NaCl in the
environment (Guo and Weng, 2004). LEA proteins belong to the family of hydrophilic and thermostable
proteins, are classified into four groups 1- 4. Four soybean LEA genes, PM11 in group1, ZLDE-2 (group
5
2), PM30 (group 3) (Lan et al., 2005), and GmPM16 were cloned and expressed (Shih et al., 2004). The
expression of either PM11 or PM30 in Escherichia coli shortened the lag period and improved growth
under salt treatment, whereas expressing ZLDE-2 did not improve the growth in salt treatment (Lan et al.,
2005). GmP16 reduced the cellular damage by modifying the protein conformation and forming tight
cellular glasses (Shih et al., 2004).
Oxidative balance restoration
Reactive oxygen species (ROS) are generated as the byproduct of various metabolic pathways
(Foyer and Harbinson, 1994) in plants. The balance between ROS production and ROS scavenging,
maintains the normal metabolic activities in the cell. However, salt stress disturbs the balance between
ROS production and ROS scavenging. The salt-tolerant soybean germplasms generate greater levels of
antioxidative components than salt-sensitive germplasms in order to restore the balance or minimize
oxidative damage (Yu and Liu, 2003). A soybean putative purple acid phosphatases (GmPAP3) is
involved in ROS forming and /or scavenging under salt stress (Liao et al., 2003). The other potential gene
involving in the restoration of oxidative balance and conferring the tolerance to salt stress is soybean
putative antiquitin-like protein (GmTP55) (Rodrigues et al., 2006). Superoxide dismutase (SOD) which
serves as ROS scavengers plays a crucial role in salt tolerance of soybean, (Maxwell et al., 1999) by
alleviating the adverse effects of ROS (Liao et al., 2003).
Structural adaptation
Structural adaptations arise in the soybeans due to the saline habitat. Salt-gland-like structures,
capable of salt secretion, were found in the leaves and stems of wild soybean originating from saline
habitat (Lu et al., 1998; Wang et al., 1999; Liu et al., 2002) and one cultivated soybean (Li et al., 2003).
Glandular hair was observed to secrete large concentrations of Na+ and Cl- in wild soybean which were
subjected to excessive NaCl (Zhou and Zhao, 2003); however, the capability of salt secretion in cultivated
soybean needs to be further investigated (Phang et al., 2008). Proline-rich cell wall protein, encoded by
soybean proline-rich protein gene, SbPRP3, is stimulated to be expressed in large amounts in soybean
under salt stress in order to alter the cell wall structure (He et al., 2002). The ratio of saturated to
unsaturated fatty acids in the plasma membrane was also changed (Huang, 1996) and saturated fatty

6
acids in the plasma membrane were increased to enhance the salt tolerance of soybean (Surjus and
Durand, 1996). The ratio of phospholipids to galactolipid in the plasma membrane was greater in salt-
tolerant soybean than its salt-sensitive counterpart (Yu et al., 2005).
Metabolic adaptation
The expression of salt responsive genes are regulated by the activation or production of
transcriptional factors which are trigged by salinity stress signaling pathway. In ABA-independent
pathway, a group of soybean dehydration responsive element binding protein (GmDREBs) homologous
genes which are transcriptional factors, is induced by salt stress. GmDREB1 has greater expression
levels in salt-tolerant soybean than that in the salt-sensitive soybean (Chen et al., 2006). GmDREB2
enhanced the salt tolerance by activating expression of downstream genes (Chen et al., 2007).
GmDREBa and GmDREBb were significantly induced in the leaves while GmDREBc was significantly
induced in the roots by the salt stress (Li et al., 2005).
In ABA-dependent pathway, two soybean basic-leucine-zipper-like protein (bZIP-like) homologs,
which are G. max transcript-derived fragments (GmTDF-5) and GmbZIP132, are vital transcriptional
factors. GmTDF-5 expression increased dramatically at 72 h after the salt stress (Aoki et al., 2005).
GmbZIP132 conferred salt tolerance during germination stage instead of seedling stage (Liao et al.,
2008).
Molecular markers and quantitative trait loci (QTL) mapping in soybean
Molecular markers
The first soybean molecular genetic linkage map with restriction fragment length polymorphism
(RFLP) markers based on F2 lines were reported (Keim et al.,1990). Subsequently, a linkage map was
constructed based on recombinant inbred lines (RILs) using RFLPs, random amplified polymorphic DNA
(RAPD) markers, and amplified fragment length polymorphisms (AFLPs) (Keim et al., 1997). However,
RFLP, AFLP, and RAPD have complex banding patterns and low level of polymorphism. Simple
sequence repeat (SSR) which has a simple banding pattern and exhibits a high level of polymorphism,
were proposed and integrated into the soybean linkage map (Akkaya et al., 1992 and 1995). An

7
integrated soybean linkage map containing SSRs, RFLPs, RAPDs, and other markers was constructed
based on three RIL populations (Cregan et al., 1999); an updated integrated soybean linkage map
containing SSRs, RFLPs, RAPDs, and other markers was constructed using five RILs populations (Song
et al., 2004). Both of the integrated linkage maps had 20 linkage groups which were assumed to
correspond to the 20 pairs of soybean chromosomes. Recently, single nucleotide polymorphisms (SNPs)
markers which were claimed to be the most abundant molecular markers in eukaryotic genomes
(Brookes, 1999), were applied in plant breeding. With the availability of soybean expressed sequence tag
(EST) in GenBank, SNPs were discovered by comparing DNA sequences among diverse germplasms
(Choi et al., 2007). SNPs were mapped using three RIL mapping populations and resulted in the third
version of the soybean integrated linkage map (Choi et al., 2007). By virtue of a high-throughput SNP
detection system, GoldenGate (Illumina Inc., San Diego, CA), additional SNP markers were mapped and
integrated to the fourth version of the soybean integrated linkage map (Hyten et al., 2010). With the
advent of second generation sequencing technology and availability of Williams 82 Glyma1.01 whole
genome sequence (Schmutz et al., 2010), a total of 60,800 SNPs were selected for the design of
SoySNP50K iSelect SNP beadchip (Song et al., 2013). A total of 19,652 accessions in USDA Soybean
Germplasm Collection have been genotyped using SoySNP50K SNP beadchip, and the genotypic
information is available at Soybase (USDA, ARS Soybean Genetics and Genomics Database). Use of
SNP chip genotyping became a promising method for high-density linkage mapping and genome-wide
association analysis.
QTL mapping
In soybean, QTL mapping populations generally originate from parents that are contrasting in the
target trait of interest. F2 populations, back cross (BC) populations, recombinant inbred (RI) populations,
and double haploid (DH) populations are usually utilized for QTL mapping. RI populations produce near
homozygous lines after several rounds of meiosis during the breeding process. Due to higher rate of
segregation and recombination in RI lines than F2 segregates or backcross lines, QTL mapping using RI
lines have less linkage errors than using F2 or backcross populations. To date, QTL mapping has been
reported for a number of agronomic traits including yield (Zhang et al., 2016), protein (Kim et al., 2016),
8
oil (Brummer et al., 1997), disease resistance (Concibido et al., 2004), and stress tolerance (Lee et al.,
2004).
An F2 mapping population was developed from the cross of ‘S-100’ (salt tolerant) x ‘Tokyo’ (salt
sensitive); a major QTL for salt tolerance was identified on Chr. 3 in soybean using RFLP and SSR
markers (Lee et al., 2004). This major QTL flanking by Sat_091 and Satt237, explained 60% of the total
genetic variation for salt tolerance in the greenhouse (Lee et al., 2004). The salt tolerance QTL was
confirmed on Chr.3 in the F2 mapping population derived from a cross between the salt sensitive soybean
cultivar Jackson and a salt-tolerant wild soybean accession (JWS156-1), this QTL in wild soybean flanked
by SSR marker Satt237 and Satt255, explained 68.7% of the total genetic variance for salt tolerance
(Hamwieh and Xu, 2008). To identify QTLs for salt tolerance in soybean, two RIL mapping populations
were developed from crosses of FT-Abyara x C01 and Jin dou No. 6 x 0197; a major QTL was also
identified on Chr.3, accounting for 44 and 47% of the total variation for salt tolerance in the two
populations (Hamwieh et al., 2011). Therefore, the major QTL for salt tolerance on Chr. 3 is consistent
and stable across different genetic backgrounds and environments, the SSR markers Sat_091, Satt237,
and Satt255 can be used in marker assisted selection for salt tolerance lines.
Salt tolerance QTL was mapped on Chr. 3 in wild soybean plant introduction PI 483463 in a
genomic region between Satt255 and BARC-038333-10036 markers (Ha et al., 2013). The salt tolerance
QTL on Chr. 3 was also identified in wild soybean accession W05, explaining 55% of the total genetic
variation for salt tolerance (Qi et al., 2014). The salt tolerance locus was narrowed down to a genomic
region of 388 Kb using SSR and SNP markers, 43 predicted genes were pinpointed within this region
based on annotation of Williams 82 genome (Qi et al., 2014). In addition to the major salt tolerance QTL
on Chr. 3, two novel QTLs have been identified using Nannong 1138-2 x Kefeng No.1 RIL mapping
population, the QTL on Chr. 18 and Chr. 7 accounted for 11% and 20% of total genetic variation for salt
tolerance, respectively (Chen et al., 2008); however, these two novel QTLs are still need to be confirmed
in different genetic backgrounds.
Genome-wide association analysis and genomic selection in soybean
Genome-wide association mapping
9
Traditional QTL mapping using bi-parental population provides valuable insights to phenotypic
variation of target traits in soybean; however, a limited number of identified QTL have been investigated
on gene level (Price, 2006). Association mapping, also known as linkage disequilibrium (LD) mapping has
been brought up to investigate the traits down to the sequence level by exploiting the variation and extent
of LD within the population (Nordborg and Tavare, 2002). Association mapping generally is divided into
two categories which are candidate-gene association mapping and genome-wide association mapping.
Candidate-gene association is usually adopted if candidate genes for targeted traits are available;
genome-wide association mapping, also known as genome scan, search the whole genome
comprehensively for causal genetic variation. Due to insufficient DNA markers in early association
studies, the candidate-gene association was used to identify SNPs controlling the targeted traits (Wilson
et al., 2004). The occurrence of high throughput DNA sequencing technology provides a platform for
genome-wide association studies (GWAS). GWAS was conducted in soybean to identify markers linked
to iron deficiency chlorosis (Mamidi et al., 2011), chlorophyll (Hao et al., 2012), flowering time, maturity
dates, and plant height (Zhang et al., 2015).
An important factor to consider in the application of GWAS is the extent of linkage disequilibrium
(LD). LD refers to the degree of non-random association of alleles at different loci. LD is affected by
numerous factors, including recombination events, drift, selection, reproduction mode, and admixture
(Flint-Garcia et al., 2003; Gaut and Long, 2003). The factors such as inbreeding, small population size,
low recombination rate, population admixture, natural and artificial selection, lead to an increase in LD.
Other factors including outcrossing, high recombination rate, and high mutation rate, lead to a decrease in
LD (Gupta et al., 2005). The two most common used statistics to describe LD are r2 and D’. The r2 is
considered as the square of the Pearson’s correlation coefficients between two loci (Hill and Robertson,
1968), calculated using the following formula 𝑟2 = 𝐷2
𝑝𝐴𝑝𝑎𝑝𝐵𝑝𝑏 , where 𝑝𝐴 and 𝑝𝐵 are the frequency of the
allele A and B, respectively, where 𝐷 = 𝑝𝐴𝐵 − 𝑝𝐴𝑝𝐵, is the difference between observed haplotype
frequency (𝑝𝐴𝐵) and expected haplotype frequency. The D’ statistic is the partially normalized D value
based on the observed haplotype frequency, with the formulas as 𝐷′ = |𝐷|
min(𝑝𝐴𝑝𝑏,𝑝𝑎𝑝𝐵), 𝑖𝑓 𝐷 > 0 or 𝐷′ =
|𝐷|
min(𝑝𝐴𝑝𝐵,𝑝𝑎𝑝𝑏), 𝑖𝑓 𝐷 < 0 . Whereas D’ only measures recombination history, r2 summarizes both
10
recombination. The structure of LD across the genome determines the resolution of association mapping.
Soybean has a low level of genome-wide LD decay rates, r2 decays to <0.10 at genetic map distance >
2.5 cM (Zhu et al., 2003). The LD extends from 90 to 574 kb in G. max due to domestication and
increased self-fertilization (Hyten et al., 2007). In euchromatic regions of soybean, the mean LD (r2)
dropped to 0.2 within 360 Kbp, while the mean level of LD declined to 0.2 within 9600 Kbp in
heterochromatic regions of soybean (Hwang et al., 2014). A high marker density is required in the regions
with low LD for GWAS (Hwang et al., 2014).
One of the major uses of LD is to study marker-trait association in plant genomics research.
Compared to traditional linkage analysis, LD-based association mapping provides more precise location
of QTLs. Mapping a QTL within a narrow chromosome region is possible through LD, but not by linkage
analysis because recombination within a narrow chromosome region is not always available in a mapping
population (Mackay, 2001). Regression analysis is used to measure the LD between a marker and a QTL,
significant regressions indicate the association between the marker and phenotype (Remington et al.,
2001). The regression analysis can be also conducted by testing the association between marker
haplotypes and phenotype. Significant association between the marker haplotypes and phenotypic effects
provide more powerful evidence for the presence of a QTL (Meuwissen and Goddard, 2000). However,
genome-wide association studies are confronted by the problem of spurious association due to population
structure and familiar relatedness. To control the false association error rate, a number of statistical
models have been proposed. General linear model (GLM)-based methods including structured
association (Pritchard et al., 2001), genomic control (Devlin and Roeder, 1999), family-based tests of
association (Thomson 1995), and principal component analysis (Price et al., 2006), were initially used.
Mixed linear model (MLM)-based methods such as unified mixed-model method (Yu et al., 2006),
compressed MLM (Zhang et al., 2010), efficient mixed-model association (Zhou and Stephens, 2012),
and multi-locus mixed model (Segura et al., 2012) have been used to correct for genetic relatedness and
population structure, and have successfully increased the computational speed and reliability.
SoySNP50k iSelect BeadChip and SoySNP6k iSelect BeadChip (Illumina, San Diego, Calif. USA)
were used to screen elite soybean cultivars, general linear model (GLM) and mixed linear model (MLM)

11
were used to test associations between the SNPs and sudden death syndrome (SDS) (Wen et al., 2014).
Multiple novel loci were identified and previously reported loci were refined for SDS resistance (Wen et
al., 2014). To identify QTL controlling seed protein and oil, GWAS was performed on 298 soybean
germplasm accessions using SoySNP50K and GoldenGate assays. The association analysis indicated
that 40 SNPs distributed in 17 different genomic regions are significantly associated with seed protein, 25
SNPs in 13 different genomic regions are significantly associated with seed oil, of these markers, and
seven SNPs are significantly associated with both seed protein and oil (Hwang et al., 2014). The
previously reported QTL for seed protein and oil were confirmed and fine mapped using GWAS analysis
(Hwang et al., 2014). To detect the selection signatures within the Glycine max genome, GWAS analysis
was performed on 342 traditional landraces and 1062 improved soybean lines using GLM and MLM
models. A total of 417 SNPs of SoySNP50K were significantly associated with nine agronomic traits
including grain yield, plant height, lodging, maturity data, seed coat color, seed protein, oil concentration,
pubescence, and flower color. Previously reported QTLs/genes were fine mapped and new candidate loci
for nine agronomic traits were identified by means of association mapping (Wen et al., 2015). GWAS was
also conducted on 106 diverse soybean lines using an expedited single-locus mixed model (EMMAX) to
identify the salt tolerance genes (Patil et al., 2016). A total of 19 and 11 SNPs from SoySNP50K data
were associated with LSS and SPAD, respectively (Patil et al., 2016). A total of 401 and 328 SNPs from
whole-genome resequencing (WGRS) data were associated with LSS and SPAD, respectively (Patil et
al., 2016). The most significant SNP of WGRS data explained 63% of the phenotypic variation for LSS
(Patil et al., 2016).
Genomic selection
As an alternative marker-based approach, genomic selection holds great potential for plant
breeding to enhance genetic gain, by speeding up the breeding cycles. Instead of utilizing limited number
of significant linked molecular markers in conventional marker-assisted selection, genomic selection
estimates genome-wide molecular marker effects simultaneously, generates the genomic estimated
breeding value (GEBV) for lines, and selects the superior lines based on their GEBV (Bernardo and Yu,
2007; Piyasatian et al., 2007); therefore, genomic selection offers the potential for making selection for

12
individuals before phenotyping. Genomic selection has been extensively studied in animal breeding
(Hayes et al., 2009 and 2013; Legarra et al., 2008; Tribout et al., 2012), and is becoming a powerful tool
in plant breeding (Heffner et al., 2009; Jannink et al., 2010). Genomic prediction has been carried out in
maize (Huang et al., 2016), wheat (He et al., 2016; Battenfield et al., 2016), soybean (Xavier et al., 2016;
Zhang et al., 2016), rice (Onogi et al., 2016), and canola (Jan et al., 2016). In particular, the genomic
selection has been frequently and widely applied in wheat breeding. The prediction accuracy of genomic
selection in wheat breeding has been investigated using cross-validation methodology across multiple
environments (Dawson et al., 2013) and multiple breeding cycles (Michel et al., 2016). The genomic
selection has been assessed for quantitative traits (Heffner et al., 2011a; Poland et al., 2012), quality
traits (Heffner et al., 2011b), and disease resistance (Rutkoski et al., 2011, 2012, and 2014) in wheat
breeding. The most sophisticated statistical model for genomic selection in animal breeding, which
integrates pedigree, genomic, and phenotypic information (Misztal et al., 2009), has also been the first
and solely applied in wheat to evaluate the GEBV in plant breeding so far (Ashraf et al., 2016).
Unlike the extensive application of genomic selection in wheat, soybean breeding programs have
rarely addressed the application of genomic selection. Genomic selection has been evaluated in soybean
breeding for agronomic traits such as soybean cyst nematode resistance (Bao et al., 2014), seed weight
(Zhang et al., 2016), and yield components (Xavier et al., 2016). The genomic selection using the
genome-wide marker was shown to be more accurate than the conventional MAS strategy (Bao et al.,
2014). Genomic selection models which has been employed in soybean breeding included ridge-
regression best linear unbiased prediction (RR; Bernardo and Yu, 2007; Meuwissen et al., 2001), ridge-
regression best linear unbiased prediction with major genes fitted as fixed effects (RRF; Bao et al., 2014),
BayesA, BayesB, BayesC, Bayesian LASSO regression (BLR; de los Campos et al., 2009; Park and
Casella, 2008), reproducing kernel hilbert space (RKHS), standard genomic best linear unbiased
predictor (GBLUP; Gao et al., 2012) which only includes additive effects, extended version of GBLUP
which includes both additive effects and additive-by-additive effects (Cockerham 1954; Xu, 2013),
Bayesian Cp (BCP; Habier et al., 2011), support vector machine (SVM; Long et al., 2011), and random
forest (RF; González-Recio and Forni, 2011). However, only marker and phenotypic information were
integrated into those models to predict the GEBV in soybean breeding. In addition, additive linear models

13
such as RR and RRF models outperformed sophisticated models such as Bayesian and machine learning
in prediction accuracy (Bao et al., 2014). Extended version of GBLUP performed equivalently to the
standard GBLUP (Jarquin et al., 2014). The combination of Bayes B and RKHS models offered the
highest prediction accuracy (Xavier et al., 2016).
The training population size, the choice of prediction model, and marker density influence the
accuracy of genomic selection. The training population size is the main limiting factor for accuracy in
soybean, higher maker density does not lead to too much gain in predictive ability (Bao et al., 2014;
Xavier et al., 2016; Zhang et al., 2016) and the prediction models including a variable term improves
prediction accuracy (Xavier et al., 2016). The optimal training population size was suggested to be
between 1000 and 2000 (Xavier et al., 2016).
RNA-sequencing analysis in soybean
RNA-sequencing (RNA-Seq) technology applies the next generation sequencing (NGS) to the
complementary DNA (cDNAs) derived from transcript populations. RNA-Seq offers several advantages
over existing technologies such as DNA microarray and expressed sequenced tag (EST) sequencing. In
general, a population of RNA is converted to cDNA fragments; adaptors are attached to one end or both
ends of cDNA; short sequences from one end (single-end sequencing) or both ends (pair-end
sequencing) are obtained through NGS. First, RNA-Seq provides gene expression information without
previous genomic sequence knowledge and offers single-base resolution for annotation. Secondly, RNA-
Seq does not have lower and upper limit for quantification and offers more accurate quantification of
expression levels than DNA microarray. Finally, RNA-Seq requires less RNA sample by saving the
procedure of cloning (Wang et al., 2009). RNA-Seq has been utilized to study osmotic stress in sorghum
(Dugas et al., 2011), salt stress in barley (Ziemann et al., 2013), water-deficit stress in cotton (Bowman et
al., 2013), and drought stress in maize (Kakumanu et al., 2012), rice (Jo et al., 2014), and wheat (Okay et
al., 2014).
The first application of RNA-Seq in soybean was reported by Kim et al. (2011). The
transcriptomes of two near isogenic lines (NILs), one bacterial leaf pustule (BLP) susceptible soybean
and one BLP-resistant soybean, were analyzed by RNA-Seq at 0, 6, and 12 h after inoculation.

14
Comparative transcriptomic analysis found that a total of 1978 and 783 genes were up-and down-
regulated, respectively (Kim et al., 2011). The transcriptomes of ten near isogenic lines (NILs), each with
a unique Rps (resistant to Phytophthora sojae) gene, and the susceptible parent Williams were analyzed
pre- and post-inoculation using RNA-Seq. Comparative transcriptomic analysis identified differential
expressed genes (DEGs) associated with defense response to P. sojae (Lin et al., 2014). Furthermore,
RNA-Seq analysis was employed to discover novel transcriptional regions and splicing transcripts, tissue
preferentially expressed genes, stage preferentially expressed genes, and functional implication in
soybean (Severin et al., 2010; Wang et al., 2014; Jones and Vodkin, 2013). Comparative transcriptome
analysis identified a total of 6718 novel transcriptional regions, and 1834 genes exhibiting stage-
dependent, and 202 genes showing tissue-biased exon-skipping exons (Wang et al., 2014). Moreover,
more than 177 out of 2000 genes with preferential gene expression played important role in seed filling
stage (Severin et al., 2010). Over 100 genes involving basic components and processes were exclusively
and highly expressed in young seed stages, genes encoding storage proteins had the highest expression
levels at the stages of largest fresh seed weight, and genes encoding the hydrophilic proteins associated
with low water conditions were highly expressed at the dry seed stage (Jones and Vodkin 2013).
Belamkar et al. (2014) conducted a time-course RNA-Seq experiment to study differential gene
expression in soybean roots at 0, 1, 6, and 12 h after either dehydration or 100mM NaCl treatment. A
total of 4389 and 8077 differentially expressed genes were found in the roots of soybean cv. William 82 at
the V1 stage at least one of the three time points (1, 6, 12 h) under dehydration and 100mM NaCl. A total
of 16 homeodomain leucine zipper (HD-ZIP) homologous genes were differentially expressed in response
to 100mM NaCl. Six out of the 16 genes (Glyma01g04890, Glyma07g05800, Glyma16g02390,
Glyma13g05270, Glyma15g18320, and Glyma03g30200) have been reported to be induced by salt stress
in 14-day old soybean seedlings using microarray analysis (Chen et al., 2014). The gene Glyma13g05270
was downregulated while Glyma13g43350, Glyma13g38430 Glyma07g05800, Glyma16g02390, and
Glyma01g04890 were upregulated under salt stress. In addition to being used to explore the
transcriptome spanning the whole soybean genome under salt stress, RNA-Seq has been employed to
investigate on the coding region of a single candidate gene, Glyma03g32900.1, which was a causal gene
underlying the QTL GmSALT3 (salt tolerance-associated gene on chromosome 3) (Guan et al., 2014).

15
Two RNA pools consisting of either 20 salt-sensitive or 20 salt-tolerance F6 plants derived from the QTL
mapping population (Tiefeng 8 x 85-140) were analyzed by RNA-Seq. Glyma03g32900.1 cDNA from salt
tolerant variety Tiefeng 8 has a longer open reading frame (ORF) than that from salt sensitive variety 85-
140. (Guan et al., 2014). Salt tolerance in wild soybean has also been investigated by virtue of RNA-Seq.
RNA-Seq data was generated from total RNA of trifoliate and primary leaves, roots of young seedlings of
wild soybean germplasm W05 (Qi et al., 2014). For Na+ and K+ concentration analysis, tissues were
collected at 24 or 72 h after 100 mM NaCl treatment. The whole genome sequencing analysis indicated
that a novel gene Glysoja01g005509, GmCHX1 (G. max cation H+ exchangers) conferred the salt
tolerance in W05 (Qi et al., 2014).
Hypotheses
1) Bi-parental quantitative trait loci (QTL) mapping will identify new QTL and confirm the
previously reported QTL for salt tolerance in soybean.
2) By virtue of world-wide soybean germplasm with broad genetics bases and high density of
molecular markers, genome-wide association mapping will discover new QTL and fine map
the previously reported QTL for salt tolerance in soybean.
3) With the high throughput RNA sequencing technology, new genes conferring the salt
tolerance in soybean will be uncovered.
Objectives
The objectives of this study were to 1) identify new QTL/molecular markers and confirm
previously reported QTL/molecular markers for salt tolerance in soybean using two classical marker
assisted selection methodologies which are QTL mapping and genome-wide association mapping; 2)
uncover the genes conferring the salt tolerance at the gene expression level.
16
References
Abel, G.H., and A.J. MacKenzie. 1964. Salt tolerance of soybean varieties (Glycine max L. Merill) during germination and later growth. Crop Sci. 4:157-161.
Abel, G.H. 1969. Inheritance of the capacity for chloride inclusion and chloride exclusion by soybeans. Crop Sci. 9:697-698.
Abrol, I.P., J.S.P. Yadav, and F.I. Massoud. 1988. Saline soils and their management. In: Salt-affected soils and their management. FAO Soils Bulletin 39:19-25.
Agboma, P.C., T.R. Sinclair, K. Jokinen, P. Peltonen-Sainio, E. Pehu. 1997. An evaluation of the effect of exogenous glycinebetaine on the growth and yield of soybean: timing of application, watering regimes and cultivars. Field Crops Res. 54:51-64.
Akkaya, M.S., A.A. Bhagwat, and P.B. Cregan. 1992. Length polymorphisms of simple sequence repeat DNA in soybean. Genetics 132:1131-1139.
Akkaya, M.S., R.C. Shoemaker, J.E. Specht, A.A. Bhagwat, and P.B. Cregan. 1995. Integration of simple sequence repeat DNA markers into a soybean linkage map. Crop Sci. 35:1439-1445.
Aoki, A., A. Kanegami, M. Mihara, T. Kojima, M. Shiraiwa, and H. Takahara. 2005. Molecular cloning and characterization of a novel soybean gene encoding a leucine-zipper-like protein induced to salt stress. Gene 356:135-145.
Asch, F., M. Dingkuhn, K. Miezan, and K. Dörffling. 2000. Leaf K/Na ratio predicts salinity induced yield loss in irrigated rice. Euphytica 113:109-118.
Ashraf, B., V. Edriss, D. Akdemir, E. Autrique, D. Bonnett, J. Crossa, L. Janss, R. Singh, and J.L. Jannink. 2016. Genomic prediction using phenotypes from pedigreed lines with no marker data. Crop Sci. 56:957-964.
Bao, Y., T. Vuong, C. Meinhardt, P. Tiffin, R. Denny, S. Chen, H.T. Nguyen, J.H. Orf , and N.D. Young. 2014. Potential of association mapping and genomic selection to explore PI 88788 derived soybean cyst nematode resistance. Plant Genome 7:1-13.
Battenfield, S.D., C. Guzmán, R.C. Gaynor, R.P. Singh, R.J. Peña, S. Dreisigacker, A.K. Fritz, and J.A. Poland. 2016. Genomic selection for processing and end-use quality traits in the CIMMYT spring bread wheat breeding program. Plant Genome (available online).
Beecher, H.G. 1994. Effects of saline irrigation water on soybean yield and soil salinity in the Murrumbidgee Valley. Aust. J. Exp. Agr. 34:85-91.
Belamkar, V., N.T. Weeks, A.K. Bharti, A.D. Farmer, M.A. Graham, and S.B. Cannon. 2014. Comprehensive characterization and RNA-Seq profiling of the HD-Zip transcription factor family in soybean (Glycine max) during dehydration and salt stress. BMC Genomics 15:950-974.
Bernardo, R., and J. Yu. 2007. Prospects for genome wide selection for quantitative traits in maize. Crop Sci. 47:1082-1090.
Bernstein, L. 1975. Effects of salinity and sodicity on plant growth. Annu. Rev. Phytopathol. 13:295-312.
Blumwald, E. 2000. Sodium transport and salt tolerance in plants. Curr. Opin. Cell Biol. 12:431-434.
Blumwald, E., and A. Grover. 2006. Salt tolerance. In: Nigel G. Halford, editors, Current and future uses of genetically modified crops. John Wiley and Sons Ltd, UK. p. 206-224.
Bowman, M.J., W. Park, P.J. Bauer, J.A. Udall, J.T. Page, J. Raney, B.E. Scheffler, D.C. Jones, and B.T. Campbell. 2013. RNA-Seq transcriptome profiling of upland cotton (Gossypium hirsutum L.) root tissue under water-deficit stress. PloS one 8: p.e82634.

17
Brookes, A.J. 1999. The essence of SNPs. Gene 234:177-186.
Brummer, E.C., G.L. Graef, J. Orf, J.R. Wilcox, and R.C. Shoemaker. 1997. Mapping QTL for seed protein and oil concentration in eight soybean populations. Crop Sci. 37: 370-378.
Buttery, B.R., C.S. Tan, C.F. Drury, S.J. Park, R.J. Armstrong, and K.Y. Park. 1998. The effects of soil compaction, soil moisture and soil type on growth and nodulation of soybean and common bean. Can. J. Plant Sci. 78:571-576.
Caliskan, S., I. Ozkaya, M.E. Caliskan, and M. Arslan. 2008. The effects of nitrogen and iron fertilization on growth, yield and fertilizer use efficiency of soybean in a Mediterranean-type soil. Field Crop Res. 108:126-132.
Chang, R.Z., Y.W. Chen, G.H. Shao, and C.W. Wan. 1994. Effect of salt stress on agronomic characters and chemical quality of seeds in soybean. Soybean Sci. 13:101-105.
Chapman, S.L. 1995. Soil test note-no. ST003. Univ. of Arkansas. http://www.uark.edu/depts/soiltest/soiltest_notes/ST003.htm (accessed 26 May, 2015).
Chen, H., S. Cui, S. Fu, J. Gai, and D. Yu. 2008. Identification of quantitative trait loci associated with salt tolerance during seedling growth in soybean (Glycine max L.). Crop Pasture Sci. 59:1086-1091.
Chen, M., Q.Y. Wang, X. G. Cheng, Z.S. Xu, L.C. Li, X.G. Ye, L.Q. Xia, and Y.Z. Ma. 2007. GmDREB2, a soybean DRE-binding transcription factor, conferred drought and high-salt tolerance in transgenic plants. Biochem. Biophys. Res. Commun. 353:299-305.
Chen, X., Z. Chen, H. Zhao, Y. Zhao, B. Cheng, and Y. Xiang. 2014. Genome-wide analysis of soybean HD-zip gene family and expression profiling under salinity and drought treatments. PLoS One 9:e87156
Chen, Y., P. Chen, and B.G. de los Reyes. 2006. Differential responses of the cultivated and wild species of soybean to dehydration stress. Crop Sci. 46:2041-2046.
Choi, I.K., D.L. Hyten, L.K. Matukumalli, Q.J. Song, J.M. Chaky, C.V. Quigley, K. Chase, K.G. Lark, R.S. Reiter, M.S. Yoon, and E.Y. Hwang. 2007. A soybean transcript map: gene distribution, haplotype and single-nucleotide polymorphism analysis. Genetics 176:685-696.
Cockerham, C.C. 1954. An extension of the concept of partitioning hereditary variance for analysis of covariances among relatives when epistasis is present. Genetics 39:859-882.
Colorado River Basin Salinity Control Forum. 1993. 1993 review: water quality standards for salinity, Colorado River System. Bountiful Utah: Colorado River Basin Salinity Control Forum.
Concibido, V.C., B.W. Diers, and P.R. Arelli. 2004. A decade of QTL mapping for cyst nematode resistance in soybean. Crop Sci. 44:1121-1131.
Cregan, P.B., T. Jarvik, A.L. Bush, R.C. Shoemaker, K.G. Lark, A.L. Kahler, N. Kaya, T.T. VanToai, D.G. Lohnes, J. Chung, and J.E. Specht. 1999. An integrated genetic linkage map of soybean. Crop Sci.39:1464-1490.
Dawson, J.C., J.B. Endelman, N. Heslot, J. Crossa, J. Poland, S. Dreisigacker, Y. Manès, M.E. Sorrells, and J.L. Jannink. 2013. The use of unbalanced historical data for genomic selection in an international wheat breeding program. Field Crops Res. 154:12-22.
Delgado, M.J., F. Ligero, and C. Liuch. 1994. Effects of salt stress on growth and nitrogen fixation by pea, faba-bean, common bean and soybean plant. Soil Biol. Biochem. 26:371-376.
De los Campos, G., H. Naya, D. Gianola, J. Crossa, A. Legarra, E. Manfredi, K. Weigel, and J.M. Cotes. 2009. Predicting quantitative traits with regression models for dense molecular markers and pedigree. Genetics 182:375-385.

18
Devlin, B., and K. Roeder.1999. Genomic control for association studies. Biometrics 55:997-1004.
Dugas, D.V., M.K. Monaco, A. Olson, R.R. Klein, S. Kumari, D. Ware, and P.E. Klein. 2011. Functional annotation of the transcriptome of Sorghum bicolor in response to osmotic stress and abscisic acid. BMC genomics 12:514-534.
Elkins, D.M., G. Hamilton, C.K.Y. Chan, M.A. Briskovich, and J.W. Vandeventer. 1976. Effect of cropping history on soybean growth and nodulation and soil rhizobia. Agron. J. 68:513-517.
El-Samad, H.A., and M.A.K. Shaddad. 1997. Salt tolerance of soybean cultivars. Biol. Plantarum 39:263-269.
Elsheikh, E.A.E., and M. Wood. 1995. Nodulation and N2 fixation by soybean inoculated with salt-tolerant rhizobia or salt-sensitive bradyrhizobia in saline soil. Soil Biol. Biochem. 27:657-661.
Essa, T.A. 2002. Effect of salinity stress on growth and nutrient composition of three soybean (Glycine max L. Merrill) cultivars. J. Agron. Crop Sci. 188:86-93.
FAO. 2002. Crops and drops: making the best use of water for agriculture. http://www.fao.org/docrep/005/y3918e/y3918e10.htm (accessed 26 May, 2015)
Flint-Garcia, S.A., J.M. Thornsberry, and E.S. Buckler. 2003. Structure of linkage disequilibrium in plants. Annu. Rev. Plant Biol. 54:357-374.
Foyer, C.H., J. Harbinson, and P.M. Mullineaux. 1994. Oxygen metabolism and the regulation of photosynthetic electron transport. Causes of photooxidative stress and amelioration of defense systems in plants. pp.1-42.
Frederick, J.R., C.R. Camp, and P.J. Bauer. 2001. Drought-stress effects on branch and mainstem seed yield and yield components of determinate soybean. Crop Sci. 41:759-763.
Gao, H., O.F. Christensen, P. Madsen, U.S. Nielsen, Y. Zhang, M.S. Lund, and G. Su. 2012. Comparison on genomic predictions using three GBLUP methods and two single-step blending methods in the Nordic Holstein population. Genet. Sel. Evol. 44:8-15.
Gaut, B.S., and A.D. Long. 2003. The lowdown on linkage disequilibrium. Plant Cell 15:1502-1506.
Gerland, P., A.E. Raftery, H. Sevcikova, N. Li, D. Gu, T. Spoorenberg, L. Alkema, B.K. Fosdick, J. Chunn, N. Lalic, G. Bay, T. Buettner, G.K. Heilig, and J. Wilmoth. 2014. World population stabilization unlikely this century. Science 346:234-237.
González-Recio, O., and S. Forni. 2011. Genome-wide prediction of discrete traits using Bayesian regressions and machine learning. Genet. Sel. Evol. 43:7-18.
Guan, R., Y. Qu, Y. Guo, L. Yu, Y. Liu, J. Jiang, J. Chen, Y. Ren, G. Liu, L. Tian, and L. Jin. 2014. Salinity tolerance in soybean is modulated by natural variation in GmSALT3. Plant J. 80:937-950.
Guo, B., and Y. Weng. 2004. Salt tolerance mechanism and molecular markers of genes associated with salt tolerance in soybean. Chin. Bull. Bot. 21:113-120.
Gupta, P.K., S. Rustgi, and P.L. Kulwal. 2005. Linkage disequilibrium and association studies in higher plants: present status and future prospects. Plant Mol. Bio. 57: 461-485.
Ha, B.K., T.D. Vuong, V. Velusamy, H.T. Nguyen, J.G. Shannon, and J.D. Lee. 2013. Genetic mapping of quantitative trait loci conditioning salt tolerance in wild soybean (Glycine soja) PI 483463. Euphytica 193:79-88.
Habier, D., R.L. Fernando, K. Kizilkaya, and D.J. Garrick. 2011. Extension of the Bayesian alphabet for genomic selection. BMC bioinformatics 12:186-197.
Hamwieh, A., and D. Xu. 2008. Conserved salt tolerance quantitative trait locus (QTL) in wild and cultivated soybeans. Breed. Sci. 58:355-359.
19
Hamwieh, A., D.D. Tuyen, H. Cong, E.R. Benitez, R. Takahashi, and D.H. Xu. 2011. Identification and validation of a major QTL for salt tolerance in soybean. Euphytica 179:451-459.
Hao, D., M. Chao, Z. Yin, and D. Yu. 2012. Genome-wide association analysis detecting significant single nucleotide polymorphisms for chlorophyll and chlorophyll fluorescence parameters in soybean (Glycine max) landraces. Euphytica 186:919-931.
Hayes, B., P. Bowman, A. Chamberlain, and M. Goddard. 2009. Invited review: genomic selection in dairy cattle: progress and challenges. J. Dairy Sci. 92:433-443.
Hayes, B., H. Lewin, and M. Goddard. 2013. The future of livestock breeding: genomic selection for efficiency, reduced emissions intensity, and adaptation. Trends Genet. 29:206-214.
He, C.Y., J.S. Zhang, and S.Y. Chen. 2002. A soybean gene encoding a proline rich protein is regulated by salicylic acid, an endogenous circadian rhythm and by various stresses. Theor. Appl. Genet. 104:1125-1131.
Heffner, E.L., M.E. Sorrells, and J.L. Jannink. 2009. Genomic selection for crop improvement. Crop Sci. 49:1-12.
Heggestad, H.E., T.J. Gish, E.H. Lee, J.H. Bennett, and L.W. Douglass. 1985. Interaction of soil moisture and ambient ozone on growth and yields of soybean. Phytopathology 75:472-477.
He, S., A.W. Schulthess, V. Mirdita, Y.S. Zhao, V. Korzun, R. Bothe, E. Ebmeyer, J.C. Reif, and Y. Jiang. 2016. Genomic selection in a commercial winter wheat population. Theor. Appl. Genet. 129:641-651.
Heffner, E.L., J.L. Jannink, and M.E. Sorrells. 2011a. Genomic selection accuracy using multifamily prediction models in a wheat breeding program. Plant Genome 4:65-75.
Heffner, E.L., J.L. Jannink, H. Iwata, E. Souza, and M.E. Sorrells. 2011b. Genomic selection accuracy for grain quality traits in biparental wheat populations. Crop Sci. 51:2597-2606.
Hill, W.G., and A. Robertson. 1968. Linkage disequilibrium in finite populations. Theor. Appl. Genet. 38:226-231.
Huang, C.Y. 1996. Salt-stress induces lipid degradation and lipid phase transition in plasma membrane of soybean plants. Taiwania 41:96-104.
Huang, M., A. Cabrera, A. Hoffstetter, C. Griffey, D. Van Sanford, J. Costa, A. McKendry, S. Chao, and C. Sneller, 2016. Genomic selection for wheat traits and trait stability. Theor. Appl. Genet. 1-14.
Hwang, E.Y., Q. Song, G. Jia, J.E. Specht, D.L. Hyten, J. Costa, and P.B. Cregan. 2014. A genome-wide association study of seed protein and oil concentration in soybean. BMC Genomics 15:1-12.
Hyten, D.L., I.K. Choi, Q. Song, R.C. Shoemaker, R.L. Nelson, J.M. Costa, J.E. Specht, and P.B. Cregan. 2007. Highly variable patterns of linkage disequilibrium in multiple soybean populations. Genetics 174:1937-1944.
Hyten, D.L., I.K. Choi, Q.J. Song, J.E. Specht, T.E. Carter, R.C. Shoemaker, E.Y. Hwang, L.K. Matukumalli, and P.B. Cregan. 2010. A high density integrated genetic linkage map of soybean and the development of a 1536 universal soy linkage panel for QTL mapping. Crop Sci. 50:960-968.
Jannink, J.L., A.J. Lorenz, and H. Iwata. 2010. Genomic selection in plant breeding: From theory to practice. Briefings Funct. Genomics 9:166-177.
Jarquín, D., K. Kocak, L. Posadas, K. Hyma, J. Jedlicka, G. Graef, and A. Lorenz. 2014. Genotyping by sequencing for genomic prediction in a soybean breeding population. BMC genomics 15:740-749.

20
Jan, H.U., A. Abbadi, S. Lücke, R.A. Nichols, and R.J. Snowdon. 2016. Genomic prediction of testcross performance in canola (Brassica napus). PloS One, 11, p.e0147769.
Jo, K., H.B. Kwon, and S. Kim. 2014. Time-series RNA-seq analysis package (TRAP) and its application to the analysis of rice, Oryza sativa L. ssp. Japonica, upon drought stress. Methods 67:364-372.
Jones, S.I., and L.O. Vodkin. 2013. Using RNA-Seq to profile soybean seed development from fertilization to maturity. PLoS One 8: p.e59270.
Kakumanu, A., M.M. Ambavaram, C. Klumas, A. Krishnan, U. Batlang, E. Myers, R. Grene, and A. Pereira. 2012. Effects of drought on gene expression in maize reproductive and leaf meristem tissue revealed by RNA-Seq. Plant Physiol. 160: 846-867.
Katerji, N., J.W. Hoorn, A. Hamdy, and M. Mastrorilli. 2003. Salinity effect on crop development and yield, analysis of salt tolerance according to several classification methods. Agr. Water Manage. 62:37-66.
Katsuhara, M., and T. Kawasaki. 1996. Salt stress induced nuclear and DNA degradation in meristematic cells of barley root. Plant Cell Physiol. 37:169-173.
Keim, P., B.W. Diers, T.C. Olson, and R.C. Shoemaker. 1990. RFLP mapping in soybean: association between marker loci and variation in quantitative traits. Genetics 126:735-742.
Keim, P., J.M. Schupp, S.E. Travis, K. Clayton, T. Zhu, L. Shi, A. Ferreira, and D.M. Webb. 1997. A high-density soybean genetic map based on AFLP markers. Crop Sci. 37:537-543.
Kim, K.H., Y.J. Kang, D.H. Kim, M.Y. Yoon, J.K. Moon, M.Y. Kim, K. Van, and S.H. Lee. 2011. RNA-Seq analysis of a soybean near-isogenic line carrying bacterial leaf pustule-resistant and -susceptible alleles. DNA Res. 18:483-497.
Kim, M., S. Schultz, R.L. Nelson, and B.W. Diers. 2016. Identification and fine mapping of soybean seed protein QTL from PI 407788A on Chromosome 15. Crop Sci. 56:219-225.
Koenning, S.R., and K.R. Barker. 1995. Soybean photosynthesis and yield as influenced by Heterodera glycines, soil type and irrigation. J. Nematol. 27:51-62.
Lacan, D., and M. Durand. 1996. Na+/K+ exchange at the xylem/symplast boundary (Its significance in the salt sensitivity of soybean). Plant Physiol. 110:705-711.
Lan, Y., D. Cai, and Y. Zheng. 2005. Expression in Escherichia coli of three different soybean Late Embryogenesis Abundant (LEA) genes to investigate enhanced stress tolerance. J. Integr. Plant Biol. 47:613- 621.
Ledesma, F., C. Lopez, D. Ortiz, P. Chen, K.L. Korth, T. Ishibashi, A. Zeng, M. Orazaly, and L. Florez-Palacios. 2016. A simple greenhouse method for screening salt tolerance in soybean. Crop Sci. 56:585-594.
Lee, G.J., H.R. Boerma, M.R. Villagarcia, X. Zhou, T.E. Carter, Z. Li, and M.O. Gibbs. 2004. A major QTL conditioning salt tolerance in S-100 soybean and descendent cultivars. Theor. Appl. Genet. 109:1610-1619.
Legarra, A., C. Robert-Granié, E. Manfredi, and J.M. Elsen. 2008. Performance of genomic selection in mice. Genetics 180:611-618.
Li, G., G.Y. Wang, J.Z. Son, H. Gao, and J.M. Lu. 2003. Salt-resistant structures of leaves from Glycine max cultivar “Fendou 16”. J. Northeast Normal Univ. 4:109-111.
Li, W.Y.F., F.L. Wong, S.N. Tsai, T.H. Phang, G. Shao, and H.M. Lam. 2006. Tonoplast-located GmCLC1 and GmNHX1 from soybean enhance NaCl tolerance in transgenic bright yellow (BY)-2 cells. Plant Cell Environ. 29:1122-1137.

21
Liao, H., F.L. Wong, T.H. Phang, M.Y. Cheung, W.Y.F. Li, G. Shao, X. Yan, and H.M. Lam. 2003. GmPAP3, a novel purple acid phosphatase-like gene in soybean induced by NaCl stress but not phosphorus deficiency. Gene 318:103-111.
Lin, F., M. Zhao, D.D. Baumann, J. Ping, L. Sun, Y. Liu, B. Zhang, Z. Tang, E. Hughes, R. W. Doerge, and T.J. Hughes. 2014. Molecular response to the pathogen Phytophthora sojae among ten soybean near isogenic lines revealed by comparative transcriptomics. BMC Genomics 15:18-30.
Liu, G., X. Duan, J. Song, C. Zhou, and L. Han. 2002. A comparative study of structure of two species in Glycine soja. J. Changchun Teachers Coll. 21:52-54.
Li, X., A. Tian, G. Luo, Z. Gong, J. Zhang, and S. Chen. 2005. Soybean DREbinding transcription factors that are responsive to abiotic stresses. Theor. Appl. Genet. 110:1355-1362.
Long, N., D. Gianola, G.J. Rosa, and K.A. Weigel. 2011. Application of support vector regression to genome-assisted prediction of quantitative traits. Theor. Appl. Genet. 123:1065-1074.
Lu, J.M., Y.L. Liu, B. Hu, and B.C. Zhuang. 1998. The discovery of salt gland-like structure in Glycine soja. Chin. Sci. Bull. 43:2074-2078.
Luo, G.Z., H.W. Wang, J. Huang, A.G. Tian, Y.J. Wang, J.S. Zhang, and S.Y. Chen. 2005a. A putative plasma membrane cation/proton antiporter from soybean confers salt tolerance in Arabidopsis. Plant Mol. Biol. 59:809-820.
Luo, Q., B. Yu, and Y. Liu. 2005b. Differential sensitivity to chloride and sodium ions in seedlings of Glycine max and G. soja under NaCl stress. J. Plant Physiol. 9:1003-1012.
Mackay, T.F.C. 2001. The genetic architecture of quantitative traits. Annu. Rev. Genet. 33:303-339.
Mamidi, S., S. Chikara, R.J. Goos, D.L. Hyten, S.M. Moghaddam, P.B. Cregan, P.E. McClean. 2011. Genome-wide association analysis identifies candidate genes associated with iron deficiency chlorosis in soybean. Plant Genome 4:154-164.
Mann, J.D., and E.G. Jaworski. 1970. Comparison of stresses which may limit soybean yields. Crop Sci. 10:620-624.
Martinez-Beltran, J., and C.L. Manzur. 2005. Overview of salinity problems in the world and FAO strategies to address the problem. Proceedings of the international salinity forum, Riverside, CA, April, 311-313.
Meuwissen, T.H.E., and M.E. Goddard. 2000. Fine mapping of quantitative trait loci using linkage disequilibria with closely linked marker loci. Genetics 155:421-430.
Meuwissen, T., B. Hayes, and M. Goddard. 2001. Prediction of total genetic value using genome-wide dense marker maps. Genetics 157:1819-1829.
Michel, S., C. Ametz, H. Gungor, D. Epure, H. Grausgruber, F. Löschenberger, and H. Buerstmayr. 2016. Genomic selection across multiple breeding cycles in applied bread wheat breeding. Theor. Appl. Genet. 129:1179-1189.
Miller, J.E., S.H. Allen, S.F. Vozzo, R.B. Philbeck, and W.W. Heck. 1989. Effects of ozone and water stress, separately and in combination, on soybean yield. J. Environ. Qual. 18:330-336.
Misztal, I., A. Legarra, and I. Aguilar. 2009. Computing procedures for genetic evaluation including phenotypic, full pedigree, and genomic information. J. Dairy Sci. 92:4648-4655.
Munns, R., and M. Tester. 2008. Mechanisms of salinity tolerance. Annu. Rev. Plant Biol. 59:651-681.
Nordborg, M., and S. Tavaré. 2002. Linkage disequilibrium: what history has to tell us. Trends in Genet. 18:83-90.

22
Nukaya, A., M. Masui., and A. Ishida. 1982. Salt tolerance of green soybeans as affected by various salinities in sand culture. J. J.P.N. Soc. Hortic. Sci. 50:487-496.
Onogi, A., M. Watanabe, T. Mochizuki, T. Hayashi, H. Nakagawa, T. Hasegawa, and H. Iwata. 2016. Toward integration of genomic selection with crop modelling: the development of an integrated approach to predicting rice heading dates. Theor. Appl. Genet. 129:805-817.
Okay, S., E. Derelli, and T. Unver. 2014. Transcriptome-wide identification of bread wheat WRKY transcription factors in response to drought stress. Mol. Genet. Genomics 289:765-781.
Oster, J.D., I. Shainberg, and I.P. Abrol. 1996. Reclamation of salt-affected soil. In: M. Agassi, editor, Soil erosion, conservation and rehabilitation. Marcel Dekker, Inc., New York. p. 315-352.
Park, T., and G. Casella. 2008. The Bayesian LASSO. J. Am. Stat. Assoc. 103:681-686.
Parker, M.B., G.J. Gascho, and T.P. Gains. 1983. Chloride toxicity of soybeans grown on Atlantic Coast flatwoods soils. Agron. J. 75:439-443.
Phang, T.H., G. Shao, and H.M. Lam. 2008. Salt tolerance in soybean. J. Integr. Plant Biol. 50:1196-1212.
Phang, T.H., G. Shao, H. Liao, X. Yan, and H.M. Lam. 2009. High external phosphate (Pi) increases sodium ion uptake and reduces salt tolerance of ‘Pi‐ tolerant’soybean. Physiol. Plant. 135:412-425.
Poland, J., J. Endelman, J. Dawson, J. Rutkoski, S. Wu, Y. Manes, S. Dreisigacker, J. Crossa, H. Sánchez-Villeda, M. Sorrells, and J.L. Jannink. 2012. Genomic selection in wheat breeding using genotyping-by-sequencing. Plant Genome 5:103-113.
Patil, G., T. Do, T.D. Vuong, B. Valliyodan, J.D. Lee, J. Chaudhary, J.G. Shannon, and H.T. Nguyen. 2016. Genomic-assisted haplotype analysis and the development of high-throughput SNP markers for salinity tolerance in soybean. Sci. Rep. 6: 19199-19211.
Piyasatian, N., R.L. Fernando, and J.C.M. Dekkers. 2007. Genomic selection for marker-assisted improvement in line crosses. Theor. Appl. Genet. 115:665-674.
Poljakoff-Mayber, A. 1975. Morphological and anatomical changes in plants as a response to salinity stress. In: A. Poljakoff-Mayber and J. Gale, editors, Plants in saline environments, Springer Berlin Hedelberg, New York. p. 97-117.
Price, A.H. 2006. Believe it or not, QTLs are accurate! Trends Plant Sci. 11:213-216.
Price, A.L., N.J. Patterson, R.M. Plenge, M.E. Weinblatt, N.A. Shadick, and D. Reich. 2006. Principal components analysis corrects for stratification in genome-wide association studies. Nat. Genet. 38:904-909.
Pritchard, J.K., and P. Donnelly. 2001. Case-control studies of association in structured or admixed populations. Theor. Popul. Biol. 60:227-237.
Qi, X., M.W. Li, M. Xie, X. Liu, M. Ni, G. Shao, C. Song, A.K.Y. Yim, Y. Tao, F.L. Wong, and S. Isobe. 2014. Identification of a novel salt tolerance gene in wild soybean by whole-genome sequencing. Nat. Commun. 5:4340-4350.
Remington, D.L., J.M. Thornsberry, Y. Matsuoka, L.M. Wilson, S.R. Whitt, J. Doebley, S. Kresovich, M.M. Goodman, and E.S. Buckler. 2001. Structure of linkage disequilibrium and phenotypic associations in the maize genome. Proc. Natl. Acad. Sci. 98:11479-11484.
Rengasamy, P. 2006. World salinization with emphasis on Australia. J. Exp. Bot. 57: 1017-1023.
Rodrigues, S.M., M.O. Andrade, A.P. Gomes, F.M. Damatta, M.C. Baracat-Pereira, and E.P. Fontes. 2006. Arabidopsis and tobacco plants ectopically expressing the soybean antiquitin-like ALDH7
23
gene display enhanced tolerance to drought, salinity, and oxidative stress. J. Exp. Bot. 57:1909-1918.
Rosadi, R.A.B., M. Senge, K. Ito, and J.T. Adomako. 2007. The effect of water deficit in typical soil types on the yield and water requirement of soybean (Glycine max [L.] Merr.) in Indonesia. JARQ 41:47-52.
Rutkoski, J., J. Benson, Y. Jia, G. Brown-Guedira, J.L. Jannink, and M. Sorrells. 2012. Evaluation of genomic prediction methods for Fusarium head blight resistance in wheat. Plant Genome 5:51-61.
Rutkoski, J.E., E.L. Heffner, and M.E. Sorrells. 2011. Genomic selection for durable stem rust resistance in wheat. Euphytica 179:161-173.
Rutkoski, J.E., J.A. Poland, R.P. Singh, J. Huerta-Espino, S. Bhavani, H. Barbier, M.N. Rouse, J.L. Jannink, and M.E. Sorrells. 2014. Genomic selection for quantitative adult plant stem rust resistance in wheat. Plant Genome 7:3-12.
Schmutz, J., S.B. Cannon, J.Schlueter, J. Ma, T. Mitros, W. Nelson, D.L. Hyten, Q. Song, J.J. Thelen, J. Cheng, and D. Xu. 2010. Genome sequence of the palaeopolyploid soybean. Nature 463:178-183.
Scott, H.D., J. Deangulo, M.B. Daniels, and L.S. Wood. 1989. Flood duration effects on soybean growth and yield. Agron. J. 81:631-636.
Segura, V., B.J. Vihjalmsson, A. Platt, A. Korte, U. Seren, Q. Long, and M. Nordborg. 2012. An efficient multi-locus mixed-model approach for genome-wide association studies in structured populations. Nat. Genet. 44:825-830.
Severin, A.J., J.L. Woody, Y.T. Bolon, B. Joseph, B.W. Diers, A.D. Farmer, G.J. Muehlbauer, R.T. Nelson, D. Grant, J.E. Specht, and M.A. Graham. 2010. RNA-Seq Atlas of Glycine max: a guide to the soybean transcriptome. BMC plant biol. 10:1-16.
Shannon, M.C. 1985. Principles and strategies in breeding for higher salt tolerance. Plant Soil 89:714-719.
Shao, G.H., J.Z. Song, and H.L. Liu. 1986. Preliminary studies on the evaluation of salt tolerance in soybean varieties. Acta. Agron. Sin. 6:30-35.
Shao, G.H., C.W. Wan, R.Z. Chang, and Y.W. Chen. 1993. Preliminary study on the damage of plasma membrane caused by salt stress. Crops 1:39-40.
Shao, G.H., R.H. Chang, and Y.W. Chen. 1995. Screening for salt tolerance to soybean cultivars of the United States. Soybean Genet. Newslett. 22:32-42.
Shi, H., F.J. Quintero, J.M. Pardo, and J.K. Zhu. 2002. The putative plasma membrane Na+/H+ antiporter SOS1 controls long-distance Na+ transport in plants. Plant Cell 14:465-477.
Shih, M., S.C. Lin, J.S. Hsieh, C.H. Tsou, T.Y. Chow, T.P. Lin, and C.H. Yue-ie. 2004. Gene cloning and characterization of a soybean (Glycine max L.) LEA protein, GmPM16. Plant Mol. Biol. 56:689-703.
Singleton, P.W., and B.B. Bohlool.1984. Effect of salinity on nodule formation by soybean. Plant Physiol. 74:72-76.
Song, Q.J., L.F. Marek, R.C. Shoemaker, K.G. Lark, V.C. Concibido, X. Delannay, J.E. Specht, and P.B. Cregan. 2004. A new integrated genetic linkage map of the soybean. Theor. Appl. Genet.109:122-128.

24
Song, Q.J., D.L. Hyten, G.F. Jia, C.V. Quigley, E.W. Fickus, R.L. Nelson, and P.B. Cregan. 2013. Development and evaluation of SoySNP50K, a high-density genotyping array for soybean. PLoS One 8:e54985.
Soy Stats. 2015. A reference guide to important soybean facts & figures. http://soystats.com/ (accessed 26 May, 2015).
Streeter, J.G., D.G. Lohnes, and R.J. Fioritto. 2001. Patterns of pinitol accumulation in soybean plants and relationships to drought tolerance. Plant Cell Environ. 24:429-438.
Surjus, A., and M. Durand. 1996. Lipid changes in soybean root membranes in response to salt treatment. J. Exp. Bot. 47:17-23.
Thomson, G. 1995. Mapping disease genes: family-based association studies. Am. J. Hum. Genet. 57:487-498.
Tribout, T., C. Larzul, and F. Phocas. 2012. Efficiency of genomic selection in a purebred pig male line. J. Anim. Sci. 90:4164-4176.
USDA-ARS. 2008. Research Databases. Bibliography on Salt Tolerance. Brown, G.E.Jr. Salinity Lab. US Dep. Agric. Agric. Res. Serv. Riverside, CA.
U.S. Regional Salinity Laboratory. 1947. Laboratory Staff, L.A. Richards, Editor. Multilithed.
Valencia, R., P. Chen, T. Ishibashi, and M. Conatser. 2008. A rapid and effective method for screening salt tolerance in soybean. Crop Sci. 48:1773-1779.
Wan, C., G. Shao, Y. Chen, and S. Yan. 2002. Relationship between salt tolerance and chemical quality of soybean under salt stress. Chin. J. Oil Crop Sci. 24:67-72.
Wang, G., C. Zhang, J. Lu, and J. Li. 1999. Structural comparison of Glycine soja in different ecological environments. Chin. J. Appl. Environ. Biol. 10:696-698.
Wang, L., C. Cao, Q. Ma, Q. Zeng, H. Wang, Z. Cheng, G. Zhu, J. Qi, H. Ma, H. Nian, and Y. Wang. 2014. RNA-seq analyses of multiple meristems of soybean: novel and alternative transcripts, evolutionary and functional implications. BMC plant biol.14:169-187.
Wang, Z., M. Gerstein, and M. Synder. 2009. RNA-Seq: a revolutionary tool for transcriptomics. Nat. Rev. Genet. 10:57-63.
Wen, Z., R. Tan, J. Yuan, C. Bales, W. Du, S. Zhang, M.I. Chilvers, C. Schmidt, Q. Song, P.B. Cregan, and D. Wang. 2014. Genome-wide association mapping of quantitative resistance to sudden death syndrome in soybean. BMC Genomics 15:1-11.
Wen, Z.X., J.F. Boyse, Q. Song, P.B. Cregan, and D. Wang. 2015. Genomic consequences of selection and genome-wide association mapping in soybean. BMC Genomics 16:671-684.
Wilson, L.M., S.R. Whitt, A.M. Ibáñez, T.R. Rocheford, M.M. Goodman, and E.S. Buckler. 2004. Dissection of maize kernel composition and starch production by candidate gene association. Plant Cell 16:2719-2733.
Wood, A.J. 1999. Comparison of salt-induced osmotic adjustment and trigonelline accumulation on two soybean cultivars. Biol. Plant. 42:389-394.
Xavier, A., W.M. Muir, and K.M. Rainey. 2016. Assessing predictive properties of genome-wide selection in soybeans. G3:116:121.
Xu, Y., G. Wang, J. Jin, J. Liu, Q. Zhang, and X. Liu. 2009. Bacterial communities in soybean rhizosphere in response to soil type, soybean genotype, and their growth stage. Soil Biol. Biochem. 41:919-925.
25
Xu, S. 2013. Genetic mapping and genomic selection using recombination breakpoint data. Genetics 195:1103-1115.
Yang, J., and R.W. Blanchar. 1993. Differentiating chloride susceptibility in soybean cultivars. Agron. J. 85:880-885.
Yu, B.J., H.M. Lam, G.H. Shao, and Y.L. Liu. 2005. Effects of salinity on activities of H+-ATPase, H+-PPase and membrane lipid composition in plasma membrane and tonoplast vesicles isolated from soybean (Glycine max L.) seedlings. J. Environ. Sci. 17:259-262.
Yu, B.J., and Y.L. Liu. 2003. Effects of salt stress on the metabolism of active oxygen in seedlings of annual halophyte Glycine soja. Acta Bot. Boreal.-Occident. Sin. 23:18-22.
Yu, J., G. Pressoir, W.H. Briggs, I.V. Bi, M. Yamasaki, J.F. Doebley, M.D. McMullen, B.S. Gaut, D.M. Nielsen, J.B. Holland, and S. Kresovich. 2006. A unified mixed-model method for association mapping that accounts for multiple levels of relatedness. Nat. Genet. 38:203-208.
Zhang, J., Q. Song, P.B. Cregan, and G.L. Jiang. 2016. Genome-wide association study, genomic prediction and marker-assisted selection for seed weight in soybean (Glycine max). Theor. Appl. Genet.129:117-130.
Zhang, J., Q. Song, P.B. Cregan, R.L. Nelson, X. Wang, J.Wu, and G. Jiang. 2015. Genome-wide association study for flowering time, maturity dates and plant height in early maturing soybean (Glycine max) germplasm. BMC Genomics 16:217-227.
Zhang, Z., E. Ersoz, C.Q. Lai, R.J. Todhunter, H.K. Tiwari, M.A. Gore, P.J. Bradbury, J. Yu, D.K. Arnett, J.M. Ordovas, and E.S. Buckler. 2010. Mixed linear model approach adapted for genome-wide association studies. Nat. Genet. 42:355-360.
Zhou, S., and K. Zhao. 2003. Discussion on the problem of salt gland of Glycine soja. Acta Bot. Sin. 45:574-580.
Zhou, X., and M. Stephens. 2012. Genome-wide efficient mixed model analysis of association studies. Nat. Genet. 44:821-824.
Zhu, Y.L., Q.J. Song, D.L. Hyten, C.P. Van Tassell, L.K. Matukumalli, D.R. Grimm, S.M. Hyatt, E.W. Fickus, N.D. Young, and P.B. Cregan. 2003. Single-nucleotide polymorphism in soybean. Genetics 163:1123-1134.
Ziemann, M., A. Kamboj, R.M. Hove, S. Loveridge, A. El-Osta, and M. Bhave. 2013. Analysis of the barley leaf transcriptome under salinity stress using mRNA-Seq. Acta. Physiol. Plant. 35:1915-1924.

26
Chapter 2. Quantitative Trait Loci (QTL) for Chloride Tolerance in Osage Soybean
Ailan Zeng, Laura Lara, Pengyin Chen*, Xiaoyan Luan, Floyd Hancock, Ken Korth, Kristofor Brye, and
Andy Pereira
Ailan Zeng, Laura Lara, Pengyin Chen*, Kristofor Brye, and Andy Pereira, Department of Crop, Soil, and
Environmental Sciences, University of Arkansas, Fayetteville, AR 72701; Xiaoyan Luan, Soybean
Research Institution, Heilongjiang Academy of Agricultural Sciences, China 150086; Floyd Hancock,
Former Monsanto Soybean Breeder, 2711 Blacks Ferry Road, Pocahontas, AR 72455; Ken Korth,
Department of Plant Pathology, University of Arkansas, Fayetteville, AR 72701.
* Author for correspondence
Abbreviations: QTL, quantitative trait loci; SNP, single nucleotide polymorphisms; MAS, marker assisted
selection

27
ABSTRACT
Salt is a severe abiotic stress that reduces soybean yield by more than 20% in saline soils and
irrigated fields. Marker assisted selection (MAS) is an efficient method to identify salt-tolerant soybean
lines. Osage is a salt-tolerant and high-yielding cultivar in the Mid-south of the USA, and is a distant
progeny tracing five generations back to S-100. The objective of this study was to determine the
inheritance of salt tolerance in ‘Osage’ soybean by identifying the quantitative trait loci (QTL). A chloride
includer, RA-452, was crossed with a chloride excluder, Osage, to develop an F4:6 mapping population.
The F4:6 lines were genotyped by 5403 single nucleotide polymorphism (SNP) markers spanning 20
chromosomes (Chr.), of which 1269 were polymorphic. The salt-stress response of F4:6 lines along with
parental genotypes was evaluated in the greenhouse in April and June 2013. Three different treatments,
namely, 120 mM NaCl, 120 mM KCl, and water, were initiated at the V1 stage and continued for 18 - 21
days. The leaf chloride concentrations were quantified by inductively coupled plasma optical emission
spectroscopy. Composite interval mapping (CIM) analysis indicated that a major chloride (Cl-)-tolerant
QTL was confirmed and narrowed down on Chr. 3 in both NaCl and KCl treatments, a novel Cl--tolerant
QTL on Chr. 15 was identified in the NaCl treatment, and a novel Cl-- tolerant QTL on Chr. 13 was
identified in the KCl treatment. Two annotated genes, Glyma.13G161800 and Glyma.15G091600, were
proposed to be the candidate gene conferring the Cl- tolerance within the QTL region on Chr. 13 and 15,
respectively. A total of 27 SNP markers which were significant associated with Cl- tolerance could be
used for MAS in breeding salt-tolerant soybean lines. However, to be claimed as stable QTLs responsible
for salt-tolerance, the novel QTLs on Chr.13 and 15 should be confirmed across diverse genetic
populations.

28
INTRODUCTION
Although saline land in the United States is mainly present in western arid and semi-arid areas
(McKell et al., 1986), salinity problems have become common in Arkansas mainly due to irrigation water
with high concentration of chloride (Cl-) (Chapman, 1995). As the primary source of irrigation water, the
Mississippi River Valley alluvial aquifer in eastern Arkansas has been reported to have a chloride
concentration up to 1639 mg/L (Kresse and Clark, 2008). Groundwater has accounted for 66% of
irrigation water supply in Arkansas (Kenny et al., 2009), where intensive pumping for groundwater
lowered water tables and caused intrusion of saline water into freshwater (Ghassemi et al., 1995). The
use of irrigation water containing more than 100 mg/L Cl- may result in chloride toxicity problems
(Ghassemi et al., 1995; Snyder et al., 2001). In addition to the irrigation water, excessive applications of
fertilizers, manures, or waste materials have resulted in salt accumulation in some soils (Yang and
Blanchar, 1993; Snyder et al., 2001).
Soybean varieties are generally sensitive to salt stress, which reduces more than 20% of
soybean yield (Katerji et al., 2003). The most abundant salt in the soil is NaCl and Cl- is more toxic than
Na+ to G. max (Luo et al., 2005). However, soybean varieties have different capacities for chloride
inclusion and exclusion. Chloride excluders hold Cl- in the roots and stems, thus, have minimal Cl-
concentrations in the leaves and do not show leaf scorching, while chloride includers have greater
concentrations of chloride in the leaves and develop leaf scorching (Abel, 1969; Luo et al., 2005).
Development of salt-tolerant cultivars is an effective method of combating salt-related yield loss. Direct
screening for salt-tolerant lines, by virtue of leaf scorching score or Cl- concentrations in the leaves, has
been conducted for over 30 years (Parker et al., 1983; Yang and Blachar, 1993; Pantalone et al., 1997;
Xu et al., 1999; Agarwal et al., 2015). Field screening (Lee et al., 2004), hydroponic methods (Valencia et
al., 2008), and plastic container methods (Lee et al., 2008) have been used for evaluation of salt-stress
response in soybean. However, the salt-tolerance trait has relative low heritability and is sensitive to
environmental variation because salt tolerance is a quantitative trait. Consequently, salt tolerance
determination is usually not made until the moment of cultivar release (Shannon and Carter, 2003).
29
Therefore, little progress has been made in the development of salt-tolerant varieties through
conventional breeding.
Quantitative trait loci (QTL) mapping and marker assisted selection (MAS) promise to make
progress for breeding salt-tolerant varieties through underlying the mechanisms and identifying the
QTL/genes. Bi-parental QTL mapping populations have been developed using salt-tolerant and salt-
sensitive varieties as parents. A major QTL explaining up to 45% of total genetic variation for salt
tolerance, was first reported on Chr. 3 (LG N) in the region between simple sequence repeat (SSR)
marker Satt237 and Sat_091 using Tokyo x S-100 mapping population, where the soybean variety S-100
was claimed to carry the salt tolerance allele (Lee et al., 2004). Hamwiech et al. (2011) confirmed the salt-
tolerance QTL on Chr. 3 (LG N) near the SSR marker Sat_091 using C01 x FT-Abyara mapping
population; however, a SSR marker allele for salt-tolerance in FT-Abyara was claimed to be different from
that in S-100. Concibido et al. (2015) also confirmed the major QTL on Chr. 3 and narrowed down the
QTL region into 1.2 Mega base (Mb). In addition, Cl--tolerant associated SNP markers were also patented
(Concibido et al., 2015). In addition to the major salt-tolerance QTL on Chr. 3, two novel major QTLs have
been identified using Nannong 1138-2 x Kefeng No.1 mapping population, where the QTL on LG G (Chr.
18) and the QTL on LG M (Chr. 7) accounted for 11% and 20% of total genetic variation for salt tolerance,
respectively (Chen et al., 2008).
In the previous studies of salt-tolerance QTL mapping, salt-stress response was commonly
evaluated with NaCl treatment. However, salt-stress symptoms were induced not only due to the toxicity
of Na+ and Cl-, but also because of the low ratio of K+ to Na+. Potassium chloride has been widely used as
a potassium (K+) fertilizer in the soybean production. As an essential element for plant growth, K+ plays a
vital role in maintaining turgor pressure under salt stress, and high K+: Na+ ratios improve salt tolerance of
plants (Asch et al., 2000). In contrast, soybean plants receiving KCl fertilizer developed scorched leaves,
and had eight times as much leaf Cl- concentrations as in plants not receiving KCl fertilizer (Parker et al.,
1983). Therefore, it is of practical value to develop salt-tolerant varieties under KCl stress using either
conventional breeding or MAS methods. So far, little effort has been made in phenotypic screening or
salt-tolerance QTL mapping under KCl stress, and the mechanism or QTL controlling KCl tolerance has

30
not been investigated. In this study, both NaCl and KCl treatments were used to screen the QTL mapping
population. The availability of Soy6k SNP chip provides a high density of molecular markers covering the
whole genome and make the discovery of all the potential salt-tolerance QTL throughout the whole
genome possible. The objective of this study was to determine the mechanism of salt tolerance in ‘Osage’
cultivar by identifying new QTLs/markers associated with Cl- tolerance, and confirming the previous
reported QTL for NaCl tolerance. New QTLs for salt tolerance were expected to be identified in current
mapping population and the major QTL on Chr. 3 was expected to be confirmed.
MATERIALS AND METHODS
Parental Material and Population Development
The Cl- excluder (salt-tolerant) cultivar Osage and Cl- includer (salt-sensitive) cultivar RA-452
were used as the parental material. Osage is a maturity group V conventional cultivar, derived from Hartz
5545 x KS4895 and released by the Arkansas Agricultural Experimental Station (Chen et al., 2007).
Osage has purple flowers, gray pubescence and a tan pod. RA-452 is a maturity group IV cultivar,
derived from Williams x Essex, and developed by Rohm and Haas Seeds. RA-452 has white flowers, gray
pubescence, and a tan pod. The cross RA-452 x Osage was made in the field in 2008 at the Agricultural
Experiment Station, University of Arkansas in Fayetteville, AR. The F1 plants were grown and confirmed
as true hybrids using morphological markers in the field in Fayetteville, AR in 2009. The F2 population
was grown in Fayetteville, AR in summer 2010. F3 seed were sent to a Costa Rica winter nursery in
winter 2010, and 150 F3 single plants were pulled to form the genetic population. F3:4 lines were planted in
Fayetteville, AR in summer 2011, and 150 F4 single plants were pulled in fall 2011. These 150 F4 single
plants were planted in summer 2012. Seed were bulk-harvested from each of 124 F4:5 lines. Field plots
were furrow-irrigated and managed using cultural practices described by Tacker and Vories (1998).
Tillage with chisel plow and disc was used to prepare the field, and fertilization was applied based on soil
test results. Pre-plant and post-emergence herbicides were applied at the label rates to control the weed.
The soil at the Fayetteville station was mapped as Pembroke silt loam (fine-silty, mixed, active, mesic
Mollic Paleudalfs) (Soil Survey Staff, 2011). The previous crop at the Fayetteivlle field was wheat.

31
Subsequently, these 124 F4:6 lines were planted in the greenhouse for tissue sample collection and
evaluation of salt tolerance.
Evaluation of Salt Tolerance
A total of 124 F4:6 lines derived from RA-452 x Osage, along with parental genotypes were
evaluated for salt tolerance in the greenhouse (25 ± 2 °C, 14 h photoperiod) at the Rosen Center at
University of Arkansas in April and June 2013. Each line was planted in six pots, with two pots exposed to
a 120 mM NaCl treatment, two pots exposed to a 120 mM KCl treatment, and two pots exposed to tap
water. Ten seeds were sown per pot, where the pot was filled with sandy loam soil (66% sand, 26% silt
and 8% clay) collected from Kibler, AR. Seedlings were fertilized once per week by Miracle-Gro®. All
Purpose Plant Food (The Scotts Miracle-Gro Company, Marysville, Ohio). Treatments were initiated at
the V1 stage (one set of unfolded trifoliolate leaves) and continued until the date that Osage had no foliar
symptoms, while RA-452 showed obvious foliar symptoms. A volume of 3.5 L of salt (NaCl or KCl or
water) solution was added to the plastic trays containing the pots and maintained for 2 h daily. The
solution was removed from the trays immediately after the 2-h treatment each day (Ledesma et al., 2016).
After the last day of treatment, the plant leaves in each pot were harvested and were dried in a forage
dryer (48 °C) for one week. Subsequently, the leaf samples were ground to fine powder using a coffee
bean grinder (Krups®, Shelton, CT). The fine-powder sample was used for chloride extraction and
quantified by inductively coupled plasma optical emission spectroscopy (ICP-OES) as described by
Wheal et al. (2010). The chloride concentration was expressed as mg kg-1.
DNA Extraction
A total of 124 F4:6 lines derived from RA-452 x Osage along with the parental genotypes, were
planted in the greenhouse with 10 seeds per pot. Tissue samples were bulk-harvested from each line.
Leaf samples were stored at -80 °C until DNA extraction. Total genomic DNA were extracted using the
CTAB (cetyltrimethylammonium bromide) method (Kisha et al., 1997). The DNA were dissolved by 0.1 ×
TE buffer and the concentration was measured using Bio-Tek PowerWave XS Microplate
Spectrophotometer (BioTek Instruments, Winooski, VT). The DNA solutions were stored at -80°C.
32
SNP Marker Screening
For genetic map construction, a total of 124 F4:6 lines (RA-452 x Osage) and parents were
genotyped with 5403 SNP markers (dbSNP-NCBI, 2012) (Table 1) using the Illumina Infinium®
Genotyping HD BeadChip (6k SNPs) on Illumina iScan (Illumina, San Diego, CA) at the genotyping core
facility of Michigan State University, East Lansing, MI. Each 4 µl sample with >200 ng/µl genomic DNA
were used for SNP analysis. Intensities of the bead fluorescence were detected using the Illumina
iScanTM Reader and the allele call for each SNP locus were performed using llumina’s BeadStudioTM
software 28 (Illumina, San Diego, CA, v3.2.23). Three genotypes were represented by the counted
alleles: AA, BB and AB. (Wang D.C., 2012, unpublished).
Data Analysis
The Shapiro-Wilk (w) statistic from JMP 9.0 (JMP®, SAS Institute) was used to test the normality
of the leaf chloride concentrations distribution for the F4:6 lines. Broad-sense heritability (H2) of leaf
chloride concentrations was calculated using the following equation (Greene et al., 2008): 𝐻2 =
𝜎𝑔
2
𝜎𝑔2+
𝜎𝑔𝑥𝑒2
𝑒+
𝜎2
𝑟𝑒
, where 𝜎𝑔2 is the genetic variance, 𝜎𝑔𝑥𝑒
2 is the genotype by month (environment) interaction, 𝜎2
is the error variance, r is the number of replications, and e is the number of environments (month). The
associations between chloride concentrations and molecular markers were tested by a single factor
analysis of variance (ANOVA) at the 0.05 significance level using the PROC GLM procedure of SAS 9.4
(SAS Institute, Cary, NC). Linkage maps were constructed using JoinMap 4.0 (Van Ooijen, 2006) and the
threshold for logarithm of odds (LOD) for linkage group construction was set as 3.0. Regression mapping
of each chromosome/linkage group (LG) were performed with a Kosambi mapping function (Kosambi,
1944). The composite interval mapping (CIM) was performed using QTL Cartographer 2.5 (Basten et al.,
1999). One thousand permutations with a walk speed of 1cM and experiment-wise α=0.05 were adopted
to establish the empirical significance threshold (Churchill and Doerge, 1994). MapChart (Voorrips, 2002)
was used to create the LOD plots based on JoinMap 4.0 and QTL Cartographer 2.5 data.
RESULTS
Phenotypic Data

33
Chloride excluder, Osage, exhibited lower leaf chloride concentration than chloride includer, RA-
452, by 23,422 to 47,725 mg kg-1 in both of the salt treatments in this study (Table 2). The leaf chloride
concentration differential between excluder and includer parents was consistent in both of the salt
treatments. Compared to the salt treatments, the water treatment had negligible accumulation of chloride
in the leaves (Table 2). Under the salt treatments, the range of leaf chloride concentration in the mapping
population exceeded the leaf chloride range of Osage and RA-452, which indicated the presence of the
transgressive segregation, and the mean of the population was close to the average of the parents. The
normality tests using the Shapiro-Wilk statistic showed that the leaf chloride concentrations were normally
distributed across time (Fig.1 and Table 2), indicating that leaf chloride concentration is a quantitative trait
controlled by multiple genes or QTLs. However, the 120 mM KCl treatment resulted in up to twice as
much leaf chloride concentration accumulation in both parental genotypes and mapping population as the
120 mM NaCl treatment (Table 2). Under NaCl treatment, the genotype and month variance were both
significant. The temperature in greenhouse in June was three Celsius higher than that (25 °C) in April.
Month accounted for the largest percentage of variance, followed by genotype (Table 3). However,
chloride data from the two months were highly correlated and most of the genotypes in the population
ranked similarly between the two months, as reflected by the insignificantly genotype by month variance
components. Under KCl treatment, the genotype accounted for largest percentage of variance. As a
result, relatively high broad-sense heritability (H2) estimates (0.76 for NaCl treatment, 0.65 for KCl
treatment) with the month as the environment factor were obtained for leaf chloride concentration based
on variance components.
Quantitative Trait Loci Mapping in F4:6 Populations by Single Nucleotide Polymorphisms Markers
A total of 5403 SNP markers distributed on 20 chromosomes were used to genotype F4:6 lines. A
total of 1269 SNP loci (23%) were polymorphic and mapped on 20 chromosomes (Table 1), generating a
high-density soybean linkage map with an average coverage of 1.77 cM per marker (Table 1).
In the single-marker analysis, 20 SNP markers on Chr. 3 and four SNP markers on Chr. 15 were
significantly associated with leaf chloride concentration in the two environments (months) in both NaCl
and KCl treatments, while three SNP markers on Chr. 13 were significantly associated with leaf chloride

34
concentration in two environments (months) in KCl treatment (Table 4). On average, under NaCl
treatment, the Osage allele decreased the leaf chloride concentration by 1,211 to 16,207 mg kg-1 (Table
5). Under KCl treatment, the Osage allele on Chr. 3 decreased the leaf chloride concentration by 10,478
to 16,993 mg kg-1. However, the RA-452 allele on Chr. 13 decreased the leaf chloride concentration by
1,094 to 2,463 mg kg-1 (Table 6). The average leaf chloride concentration across the two months was
used to conduct the CIM. The CIM analysis indicated two QTLs for NaCl tolerance, which were a major
QTL on Chr. 3 and a minor QTL on Chr. 15, explaining 54 and 9% of phenotypic variation for Cl-1
tolerance, respectively. In contrast, the CIM analysis showed two QTLs for KCl tolerance as well, which
were a major QTL on Chr. 3 and a minor QTL on Chr. 13, explaining 36 and 6% of phenotypic variation
for Cl-1 tolerance, respectively. The major QTL on Chr. 3 identified in the NaCl treatment was the same as
that in the KCl treatment. The common QTL was flanked by Gm03_39491355 and Gm03_41605831 (Fig.
2). The QTL on Chr. 15 was flanked by Gm15_6646246 and Gm15_7147226, while the QTL on Chr. 13
was flanked by Gm13_27665585 and Gm13_28206014 (Fig. 2).
DISCUSSION
Previous studies on identifying soybean salt-tolerance QTL usually adopted NaCl treatment for
phenotyping (Lee et al., 2004; Chen et al., 2008; Hamwiech et al., 2011). In this study, both NaCl and KCl
treatments were applied for salt-tolerance screening. The KCl treatment imposed a more severe salt
stress than the NaCl, as indicated by greater accumulation of leaf chloride concentration under KCl
treatment. It was likely due to the nutrient role played by K+ in soybean growth and the synchronous
transport of K+ and Cl-. In comparison to the salt treatment, the water treatment resulted in negligible
accumulation of leaf chloride concentration as expected (Table 2).
The genotype by month interaction was not significant for salt-tolerance evaluation in F4:6 lines in
both NaCl and KCl treatments (Table 3), as expected for controlled environments in the greenhouse.
However, the month effect was significant in NaCl treatment, it is likely due to that pots were exposed to
the treatment for different number of days in April and June, respectively, since the treatments were
continued until the parental genotypes started to show the contrasting foliar symptoms in each month,
which continued18 and 21 days for April and June, respectively. The heritability of NaCl tolerance (0.76)

35
and the heritability for KCl tolerance (0.65) in this study were greater than that reported by Lee et al.
(2004), probably due to the larger population size and greater uniformity of the treatment design in
comparison to the study reported by Lee et al. (2004). In both treatments, significant differences among
genotypes were present for salt tolerance.
The 20 genetic maps were constructed using a F4:6 mapping population derived from RA-452 x
Osage with a total of 1269 SNP markers provided a high maker density of linkage maps for searching the
potential QTL for salt tolerance. Osage is a high-yielding variety in the Mid-south of USA, is used as
USDA yield check, and is a distant progeny tracing five generations back to S-100 (Chen et al., 2007). As
expected, the Cl- tolerance QTL on Chr. 3 was identified in this study. However, the salt-tolerance QTL on
Chr.3 in our mapping population (39,491,355 - 41,605,831 bp) was about 1Mb away from the QTL region
(38,104,512 - 38,834,849 bp) reported by Lee et al. (2004). The salt-tolerance QTL on Chr. 3 (39,491,355
- 41,605,831 bp) in our mapping population was in the same QTL region (39,551,106 - 40,761,388 bp)
reported by Concibido et al. (2015).
Moreover, the major QTL on Chr. 3 was common between the NaCl and KCl treatments, which
was in agreement with the statement that the soybean gene Ncl on Chr. 3 conferred the salt tolerance by
synchronously regulating Na+, K+, and Cl- (Do et al., 2016). In addition, 20 SNP markers on Chr. 3, which
were significantly associated with Cl- tolerance in this study, can be used in MAS for salt tolerance. Also,
the physical positions of those 20 SNP markers were similar to that of the patented markers for Cl-
tolerance proposed by Concibido et al. (2015). Two novel Cl- tolerance QTL were reported in this study,
based on the Gmax 275 Wm82.a2.v1. annotation database (Nordberg et al., 2014): one QTL region on
Chr. 13 reported in KCl treatment contained 67 annotated genes, including one gene Glyma.13G161800
which belongs to voltage-gated chloride channel family protein; the other QTL region on Chr.15 reported
in NaCl treatment contained 59 genes, including one gene Glyma.15G091600 which belongs to early
responsive to dehydration stress protein family. However, the salt tolerance QTLs on Chr. 7 and Chr. 18
(Chen et al., 2008) were not confirmed in our mapping population.
In conclusion, the major Cl--tolerance QTL was confirmed in both NaCl and KCl treatments, while
two novel Cl--tolerance QTL were identified in the NaCl and KCl treatments. The associated SNP markers

36
could be potentially used for MAS on salt tolerance in soybean. The functions of two genes,
Glyma.13G161800 and Glyma.15G091600, deserves further investigation. Furthermore, as a stable salt-
tolerant and high-yielding variety, Osage is a desirable genotype to be used as parent in soybean
breeding program.
Acknowledgements
This work was supported by Arkansas Soybean Promotion Board and United Soybean Board.

37
References
Abel, G.H. 1969. Inheritance of the capacity for chloride inclusion and chloride exclusion by soybeans. Crop Sci. 9:697-698.
Agarwal, N., K. Ashok, S. Agarwal, and A. Singh. 2015. Evaluation of soybean (Glycine max L.) cultivars under salinity stress during early vegetative growth. Int. J. Curr. Microbiol. App. Sci. 4:123-124.
Asch, F., M. Dingkuhn, K. Miezan, and K. Dorffling. 2000. Leaf K/Na ratio predicts salinity induced yield loss in irrigated rice. Euphytica 113:109-118.
Basten, C.J., B.S. Weir, and Z.B. Zeng. 1999. QTL Cartographer, version 1.13. Dep. of Statistics, North Carolina State Univ., Raleigh, NC.
Chapman, S.L. 1995. Soil test note-no. ST003. Univ. of Arkansas.
http://www.uark.edu/depts/soiltest/soiltest_notes/ST003.htm (accessed 20 June 2015).
Chen, H., S. Cui, S. Fu, J. Gai, and D. Yu. 2008. Identication of quantitative trait loci associated with salt tolerance during seedling growth in soybean (Glycine max L.). Aust. J. Agric. Res. 59:1086-1091.
Chen, P., C.H. Sneller, L.A. Mozzoni, and J.C. Rupe. 2007. Registration of ‘Osage’soybean. J. Plant
Regist. 1:89-92.
Churchill, G.A., and R.W. Doerge. 1994. Empirical threshold values for quantitative trait mapping. Genetics 138:963-971.
Concibido, V.C., I. Husic, N. Lafaver, B.L. Vallee, J. Narvel, J. Yates, and X.H. Ye. 2015. Molecular markers associated with chloride tolerant soybeans. U.S. Patent Application 14/424, 454, filed august 28, 2013.
Do, T.D., H. Chen, V.T.T. Hien, A. Hamwieh, T. Yamada, T. Sato, Y. Yan, H. Cong, H. M. Shono, K. Suenaga, and D. Xu. 2016. Ncl Synchronously Regulates Na+, K+, and Cl− in Soybean and
Greatly Increases the Grain Yield in Saline Field Conditions. Sci. Rep. 6.
Ghassemi, F., A.J. Jakeman, and H.A. Nix. 1995. Salinisation of land and water resources: human causes, extent, management and case studies. CAB lnternational.
Greene, N.V., K.E. Kenworthy, K.H. Quesenberry, J.B. Unruh, and J.B. Sartain. 2008. Variation and
heritability estimates of common carpetgrass. Crop Sci. 48:2017-2025.
Hamwieh, A., D.D. Tuyen, H. Cong, E.R. Benitez, R. Takahashi, and D.H. Xu. 2011. Identification and validation of a major QTL for salt tolerance in soybean. Euphytica 179:451-459.
JMP®, Version 9.0. SAS Institute Inc., Cary, NC, 1989-2007.
Katerji, N., J.W. Hoorn, A. Hamdy, and M. Mastrorilli. 2003. Salinity effect on crop development and yield, analysis of salt tolerance according to several classification methods. Agric. Water Manage, 62:37-66.
Kenny, J.F., N.L. Barber, S.S. Hutson, K.S. Linsey, J.K. Lovelace, and M.A. Maupin. 2009. Estimated use of water in the United States in 2005. U.S. Geological Survey:1344.
Kisha, T., C.H. Sneller, and B.W. Diers. 1997. Relationship between genetic distance among parents and genetic variance in populations of soybean. Crop Sci. 37:1317-1325.
Kosambi, D.D. 1944. The estimation of map distance from recombination values. Annu. Eugen. 12:172-175.
38
Kresse, T.M., and B.R. Clark. 2008. Occurrence, distribution, sources, and trends of elevated chloride concentrations in the Mississippi River Valley alluvial aquifer in southeastern Arkansas: U.S. Geological Survey Scientific Investigations Report. 2008-5193. P34.
Ledesma, F., C. Lopez, D. Ortiz, P. Chen, K.L. Korth, T. Ishibashi, A. Zeng, M. Orazaly, and L. Florez-Palacios. 2016. A Simple Greenhouse Method for Screening Salt Tolerance in Soybean. Crop Sci. 56:585-594.
Lee, G.J., H.R. Boerma, M.R. Villagarcia, X. Zhou, T.E. Carter, Z. Li, and M.O. Gibba. 2004. A major QTL conditioning salt tolerance in S-100 soybean and descendent cultivars. Theor. Appl. Genet.109:1610-1619.
Lee, J.D., S.L. Smothers, D. Dunn, M. Villagarcia, C.R. Shumway, T. Carter, and J.G. Shannon. 2008. Evaluation of a simple method to screen soybean genotypes for salt tolerance. Crop Sci. 48:2194-2200.
Luo, Q.Y., B.J. Yu, and Y.L. Liu. 2005. Differential sensitivity to chloride and sodium ions in seedlings of Glycine max and G. soja under NaCl stress. J. Plant Physiol. 162:1003-1012.
McKell, C.M., J.R. Goodin, and R.L. Jefferies. 1986. Saline land of the United States of America and Canada. Reclam. Reveg. Res. 5:159-165.
Nordberg, H., M. Cantor, S. Dusheyko, S. Hua, A. Poliakov, I. Shabalov, T. Smirnova, I.V. Grigoriev, and I. Dubchak. 2014. The genome portal of the Department of Energy Joint Genome Institute: 2014 updates. Nucleic Acids Res. 42:D26-3.
Pantalone, V.R., W.J. Kenworthy, L.H. Slaughter, and B.R. James. 1997. Chloride tolerance in soybean and perennial Glycine accessions. Euphytica 97:235-239.
Parker, M.B., G.J. Gascho, and T.P. Gains. 1983. Chloride toxicity of soybeans grown on Atlantic Coast flatwoods soils. Agron. J. 75:439-443.
SAS Institute. 2004. The SAS system for Windows. Release 9.4. SAS Institute, Cary, NC.
Shannon, J.G., and T.E. Carter. 2003. Development of soybeans for tolerance to abiotic stress. In: Victor HT (ed) Asociacion Argentina De Productores En Siembra Directa XI No-till congress proceedings. Rosario, Provincia De Santa Fe, Argentina. August 25-28, AAPRESID, Rosario, Argentina, pp 139-149.
Snyder, C., W. Sabbe, S. Chapman, and M. Daniels. 2001. Fertilization and liming practices. In Arkansas soybean handbook. University of Arkansas Cooperative Extension Service Publication MP.197:2-26.
Soil Survey Staff. 2011. Natural resources conservation service, United State department of agriculture, web soil survey. Available online at http://websoilsurvey.nrcs.usda.gov. Accessed on October 2016.
Tacker, P., and E. Vories. 1998. Irrigation, In Arkansas soybean handbook. University of Arkansas. Cooperative extension service, p. 42-49.
Valencia, R., P. Chen, T. Ishibashi, and M. Conatser. 2008. A rapid and effective method for screening salt tolerance in soybean. Crop Sci. 48:1773-1779.
Van Ooijen, J.W. 2006. JoinMap 4, software for the calculation of genetic linkage maps in experimental populations. Kyazma B.V., Wageningen, the Netherlands.
Voorrips, R.E. 2002. MapChart: software for the graphical presentation of linkage maps and QTLs. J. Hered. 93:77-78.
Wheal, M.S., and T.P. Lyndon. 2010. Chloride analysis of botanical samples by ICP-OES. J. Anal. At. Spectrom 25:1946-1952.

39
Xu, Z., R. Chang, L. Que, J. Sun, and X. Li. 1999. Evaluation of soybean germplasm in China. p.156-165. In H.E. Kauffman (ed.) Proc. World soybean Res. Conf., 6th, Chicago, IL. 4-7 Aug. 1999. Superior printing. Champagne, IL.
Yang, J., and R.W. Blanchar. 1993. Differentiating chloride susceptibility in soybean cultivars. Agron. J. 85:880-885.

40
Table 1. Summary of single nucleotide polymorphism markers used in the initial screen of the parental genotypes and F4:6 population derived from RA-452 x Osage.
Chr. † LG ‡ Length § No. of markers ¶
Marker coverage #
Polymorphic SNPs ††
Polymorphic SNP coverage ‡‡
1 D1a 97.29 221 0.44 45 2.16 2 D1b 135.54 302 0.45 57 2.38 3 N 96.07 246 0.39 58 1.66 4 C1 112.20 245 0.46 73 1.54 5 A1 86.75 260 0.33 46 1.89 6 C2 136.51 284 0.48 85 1.61 7 M 132.49 293 0.45 99 1.34 8 A2 144.35 357 0.40 77 1.87 9 K 95.02 234 0.41 52 1.83 10 O 132.89 280 0.47 81 1.64 11 B1 115.97 245 0.47 35 3.31 12 H 109.78 232 0.47 38 2.89 13 F 118.30 333 0.36 82 1.44 14 B2 100.27 247 0.41 64 1.57 15 E 98.11 277 0.35 89 1.10 16 J 90.46 217 0.42 19 4.76 17 D2 118.32 246 0.48 42 2.82 18 G 107.09 342 0.31 69 1.55 19 L 101.14 290 0.35 80 1.26 20 I 112.77 252 0.45 78 1.45 Mean 112.07 270 0.42 63 1.77 Total 5403 1269
† Chromosome. ‡ Linkage group. § Chromosome length in centimorgans based on GmConsensus 4.0 map on SoyBase (http://www.soybase.org) ¶ Number of markers screened for each chromosome. # Chromosome length per SNP marker (total chromosome length/number of SNP markers screened). †† Number of polymorphic SNP markers screened for each chromosome. ‡‡ Chromosome length per polymorphic SNP marker (total chromosome length/number of polymorphic SNP markers).

41
Table 2. Leaf chloride concentrations (mg kg-1) of parents and F4:6 mapping population from RA-452 x Osage evaluated using (A) 120 mM NaCl or
(B) 120 mM KCl over two months and (C) control.
(A)
(B)
(C)
120 mM NaCl
Month
F4:6 population Osage RA-452
Prob < W†
Mean Range Mean SD Mean SD
April, 2013 61,253 27,488 – 88,950 31,680 6,988 64,845 6,066 0.5037
June, 2013 83,307 26,970 – 118, 328 74,532 13,089 114,025 19,843 0.9984
120 Mm KCl
Month
F4:6 population Osage RA-452
Prob < W† Mean Range Mean SD Mean SD
April, 2013 112,446 72,660 – 151,200 77,000 3,208 124,725 12,622 0.6973
June, 2013 116,523 63,676 – 145,475 106,092 3,192 129,514 18,877 0.9718
Water
Mean Range
Osage 218 RA-452 1,152 F4:6 population 810 89 – 2,184
†Shapiro-Wilk value for the normality test
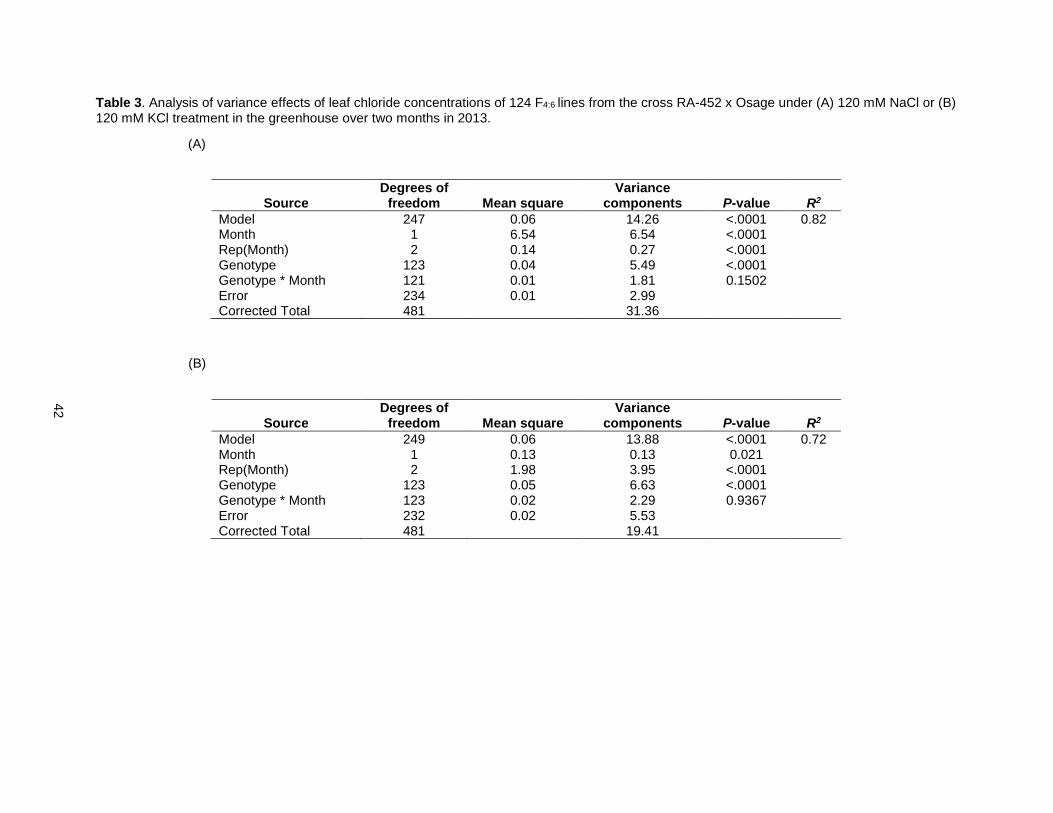
42
Table 3. Analysis of variance effects of leaf chloride concentrations of 124 F4:6 lines from the cross RA-452 x Osage under (A) 120 mM NaCl or (B) 120 mM KCl treatment in the greenhouse over two months in 2013.
(A)
(B)
Source Degrees of
freedom Mean square Variance
components P-value R2
Model 247 0.06 14.26 <.0001 0.82 Month 1 6.54 6.54 <.0001 Rep(Month) 2 0.14 0.27 <.0001 Genotype 123 0.04 5.49 <.0001 Genotype * Month 121 0.01 1.81 0.1502 Error 234 0.01 2.99 Corrected Total 481 31.36
Source Degrees of
freedom Mean square Variance
components P-value R2
Model 249 0.06 13.88 <.0001 0.72 Month 1 0.13 0.13 0.021 Rep(Month) 2 1.98 3.95 <.0001 Genotype 123 0.05 6.63 <.0001 Genotype * Month 123 0.02 2.29 0.9367 Error 232 0.02 5.53 Corrected Total 481 19.41
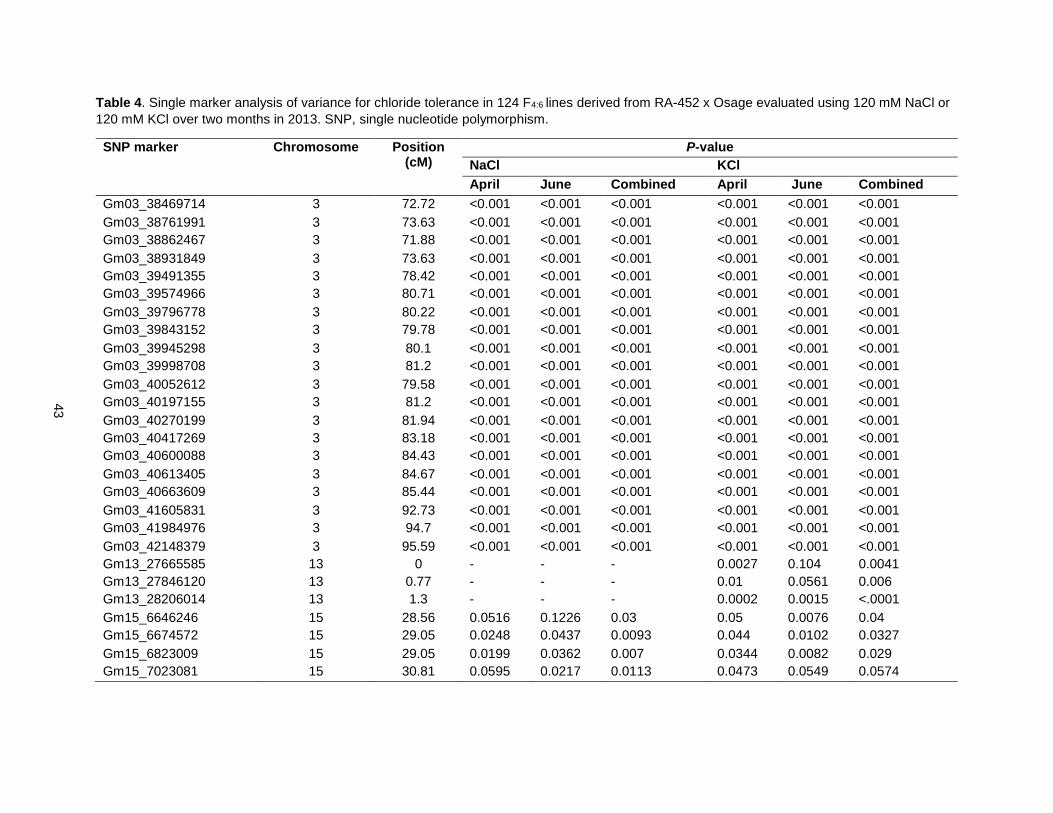
43
Table 4. Single marker analysis of variance for chloride tolerance in 124 F4:6 lines derived from RA-452 x Osage evaluated using 120 mM NaCl or
120 mM KCl over two months in 2013. SNP, single nucleotide polymorphism.
SNP marker Chromosome Position (cM)
P-value
NaCl KCl
April June Combined April June Combined
Gm03_38469714 3 72.72 <0.001 <0.001 <0.001 <0.001 <0.001 <0.001
Gm03_38761991 3 73.63 <0.001 <0.001 <0.001 <0.001 <0.001 <0.001
Gm03_38862467 3 71.88 <0.001 <0.001 <0.001 <0.001 <0.001 <0.001
Gm03_38931849 3 73.63 <0.001 <0.001 <0.001 <0.001 <0.001 <0.001
Gm03_39491355 3 78.42 <0.001 <0.001 <0.001 <0.001 <0.001 <0.001
Gm03_39574966 3 80.71 <0.001 <0.001 <0.001 <0.001 <0.001 <0.001
Gm03_39796778 3 80.22 <0.001 <0.001 <0.001 <0.001 <0.001 <0.001
Gm03_39843152 3 79.78 <0.001 <0.001 <0.001 <0.001 <0.001 <0.001
Gm03_39945298 3 80.1 <0.001 <0.001 <0.001 <0.001 <0.001 <0.001
Gm03_39998708 3 81.2 <0.001 <0.001 <0.001 <0.001 <0.001 <0.001
Gm03_40052612 3 79.58 <0.001 <0.001 <0.001 <0.001 <0.001 <0.001
Gm03_40197155 3 81.2 <0.001 <0.001 <0.001 <0.001 <0.001 <0.001
Gm03_40270199 3 81.94 <0.001 <0.001 <0.001 <0.001 <0.001 <0.001
Gm03_40417269 3 83.18 <0.001 <0.001 <0.001 <0.001 <0.001 <0.001
Gm03_40600088 3 84.43 <0.001 <0.001 <0.001 <0.001 <0.001 <0.001
Gm03_40613405 3 84.67 <0.001 <0.001 <0.001 <0.001 <0.001 <0.001
Gm03_40663609 3 85.44 <0.001 <0.001 <0.001 <0.001 <0.001 <0.001
Gm03_41605831 3 92.73 <0.001 <0.001 <0.001 <0.001 <0.001 <0.001
Gm03_41984976 3 94.7 <0.001 <0.001 <0.001 <0.001 <0.001 <0.001
Gm03_42148379 3 95.59 <0.001 <0.001 <0.001 <0.001 <0.001 <0.001
Gm13_27665585 13 0 - - - 0.0027 0.104 0.0041
Gm13_27846120 13 0.77 - - - 0.01 0.0561 0.006
Gm13_28206014 13 1.3 - - - 0.0002 0.0015 <.0001
Gm15_6646246 15 28.56 0.0516 0.1226 0.03 0.05 0.0076 0.04
Gm15_6674572 15 29.05 0.0248 0.0437 0.0093 0.044 0.0102 0.0327
Gm15_6823009 15 29.05 0.0199 0.0362 0.007 0.0344 0.0082 0.029
Gm15_7023081 15 30.81 0.0595 0.0217 0.0113 0.0473 0.0549 0.0574

44
Table 5. Mean effect of single nucleotide polymorphism (SNP) marker alleles on chloride tolerance (leaf chloride concentration (mg kg-1)) in 124 F4:6 lines derived from RA-452 x Osage evaluated using 120 mM NaCl over two months in 2013.
SNP markers Chr. † NaCl (April) NaCl (June) NaCl (combined)
R2 P1 ‡ P2§ Diff. ¶ P1 P2 Diff. P1 P2 Diff.
Gm03_38469714 3 68512 53042 15470 89462 78962 10500 78987 66030 12957 0.34 Gm03_38761991 3 68596 53002 15594 90014 79247 10767 79305 66151 13154 0.35 Gm03_38862467 3 68637 53002 15635 89529 79247 10282 79083 66151 12933 0.33 Gm03_38931849 3 68694 53002 15692 90057 79247 10810 79376 66151 13225 0.35 Gm03_38976026 3 68702 53002 15700 89418 79247 10171 79060 66151 12910 0.33 Gm03_39491355 3 68123 51268 16855 89086 79074 10013 78605 65171 13434 0.36 Gm03_39574966 3 69254 51312 17942 90259 79087 11172 79681 65199 14482 0.42 Gm03_39796778 3 69435 51380 18055 90226 79265 10961 79753 65322 14430 0.42 Gm03_39843152 3 69483 51597 17886 90290 79380 10910 79809 65488 14321 0.43 Gm03_39945298 3 69483 51010 18473 90290 79627 10663 79809 65318 14491 0.42 Gm03_39998708 3 69048 51373 17675 89703 79433 10269 79376 65403 13972 0.38 Gm03_40052612 3 69325 51453 17871 90189 78974 11214 79756 65214 14543 0.42 Gm03_40197155 3 68889 51380 17509 89888 79265 10624 79389 65322 14066 0.39 Gm03_40270199 3 69712 51104 18608 90358 78773 11585 79959 64938 15020 0.47 Gm03_40417269 3 69985 50871 19114 90084 78882 11202 79962 64877 15085 0.48 Gm03_40600088 3 70530 50477 20053 90861 78293 12568 80616 64385 16231 0.54 Gm03_40613405 3 70764 50520 20244 91019 78170 12849 80809 64345 16464 0.56 Gm03_40663609 3 70573 50288 20285 90842 78556 12286 80630 64422 16207 0.54 Gm03_41605831 3 68622 52493 16129 88959 79907 9052 78724 66200 12525 0.32 Gm03_41984976 3 68865 51720 17145 88906 80245 8661 78819 65982 12836 0.31 Gm03_42148379 3 68354 52909 15445 88645 79980 8666 78433 66444 11989 0.28 Gm15_6646246 15 62697 61272 1425 85973 84895 1079 74294 73083 1211 0.06 Gm15_6674572 15 62979 61160 1819 86269 84911 1358 74581 73035 1546 0.08 Gm15_6823009 15 62979 61053 1926 86269 85044 1225 74581 73048 1532 0.08 Gm15_7023081 15 62809 60894 1914 86561 84684 1878 74641 72789 1852 0.08
†Chromosome. ‡RA-452 allele effect. §Osage allele effect. ¶Allelic difference (RA-452 allele effect – Osage allele effect).

45
Table 6. Mean effect of single nucleotide polymorphism (SNP) marker alleles on chloride tolerance (leaf chloride concentration (mg kg-1)) in 124
F4:6 lines derived from RA-452 x Osage evaluated using 120 mM KCl over two months in 2013.
SNP markers Chr. † KCl (April) KCl (June) KCl (combined)
R2 P1 ‡ P2§ Diff. ¶ P1 P2 Diff. P1 P2 Diff.
Gm03_38469714 3 117554 106323 11232 121527 111804 9724 119541 109063 10478 0.15 Gm03_38761991 3 118204 106621 11583 121851 111796 10056 120028 109208 10819 0.16 Gm03_38862467 3 118431 106621 11810 122578 111796 10782 120504 109208 11296 0.17 Gm03_38931849 3 118481 106621 11861 122126 111796 10330 120304 109208 11095 0.17 Gm03_38976026 3 117834 106621 11213 122041 111796 10245 119937 109208 10729 0.16 Gm03_39491355 3 117133 105500 11633 122009 110113 11896 119571 107807 11764 0.19 Gm03_39574966 3 119350 105694 13657 123027 109886 13142 121189 107790 13399 0.25 Gm03_39796778 3 119438 105388 14049 123270 109932 13338 121354 107660 13694 0.26 Gm03_39843152 3 119711 105363 14348 123435 110054 13381 121573 107708 13864 0.28 Gm03_39945298 3 119711 106151 13560 123435 109284 14150 121573 107718 13855 0.26 Gm03_39998708 3 119035 105906 13129 122798 109945 12854 120917 107925 12991 0.23 Gm03_40052612 3 119771 105103 14669 123375 109976 13398 121573 107540 14033 0.27 Gm03_40197155 3 118841 105388 13452 122654 109932 12722 120747 107660 13087 0.23 Gm03_40270199 3 120160 104116 16044 123609 109594 14015 121885 106855 15030 0.32 Gm03_40417269 3 120908 102877 18031 123968 108990 14978 122438 105933 16505 0.39 Gm03_40600088 3 120841 103135 17706 123562 109168 14394 122202 106152 16050 0.36 Gm03_40613405 3 121514 102728 18786 123944 109186 14757 122729 105957 16771 0.4 Gm03_40663609 3 121480 102640 18841 123858 108712 15145 122669 105676 16993 0.41 Gm03_41605831 3 119682 104010 15672 120893 111722 9171 120288 107866 12422 0.22 Gm03_41984976 3 120002 104662 15340 121078 110862 10216 120540 107762 12778 0.21 Gm03_42148379 3 119830 104897 14932 120940 111888 9051 120385 108393 11992 0.19 Gm13_27665585 13 114610 115086 -476 117449 119161 -1712 116029 117124 -1094 0.11 Gm13_27846120 13 114012 115324 -1312 117326 119592 -2266 115669 117458 -1789 0.1 Gm13_28206014 13 114527 116477 -1950 117517 120494 -2977 116022 118486 -2463 0.19
†Chromosome. ‡RA-452 allele effect. §Osage allele effect. ¶Allelic difference (RA-452 allele effect – Osage allele effect).

46
Figure 1. Distribution of leaf chloride concentration (mg kg-1) of 124 F4:6 lines from RA-452 x Osage
evaluated under (A) 120 mM NaCl or (B) 120 mM KCl treatment in the greenhouse over two months in
2013.
(A)
Num
ber
of
lines
Leaf chloride concentration (mg kg-1)
Osage RA-
452
Leaf chloride concentration (mg kg-1)
Osage RA-
452
Num
ber
of
lines
(B)

47
Figure 2. Composite interval mapping using single nucleotide polymorphism markers for chloride
tolerance quantitative trait loci in 124 F4:6 lines from RA-452 x Osage evaluated using two salt treatments
(A-B) 120 mM NaCl; (C-D) 120 mM KCl.
Gm03_29320280.0
Gm03_51655117.0
Gm03_478212715.0
Gm03_1055207829.0
Gm03_3171148734.0
Gm03_3596859943.0
Gm03_3681600651.0
Gm03_3876199178.0Gm03_3949135580.0Gm03_3999870881.0
Gm03_4160583193.0
Gm03_43355787112.0
Gm03_45416367118.0Gm03_46592189122.0
Sa
lt_T
ole
ran
ce
_Q
TL
1(N
aC
l)
0
1
2
3
4
5
6
7
8
9
10
11
12
13
3
Salt_Tolerance_QTL1(NaCl)
Gm15_6303310.0Gm15_9484123.6Gm15_18420534.6Gm15_316042310.7Gm15_384597115.0Gm15_452237417.8Gm15_520368520.7Gm15_604755726.0Gm15_664624628.6Gm15_682300930.1Gm15_714722630.8Gm15_734386633.2Gm15_763717440.4Gm15_905830346.6Gm15_916444650.4Gm15_994853754.1
Gm15_1142117966.2
Gm15_1318003980.7Gm15_1414626484.5Gm15_1478033986.4Gm15_1517815987.8Gm15_1589638789.8
Gm15_48313076120.5Gm15_49318218122.8
sa
lt_to
lera
nce
_Q
TL
2(N
aC
l)
0.0
0.5
1.0
1.5
2.0
2.5
3.0
3.5
4.0
4.5
5.0
15
salt_tolerance_QTL2(NaCl)
Gm03_29320280.0
Gm03_51064597.0
Gm03_478212715.0
Gm03_1055207829.0Gm03_3095579033.0
Gm03_3601841243.0
Gm03_3617832751.0
Gm03_3846971473.0Gm03_3949135579.0Gm03_3984315280.0Gm03_4041726983.0Gm03_4060008884.0Gm03_4066360985.0Gm03_4160583193.0Gm03_4214837996.0
Gm03_43355787104.0
Gm03_45416367118.0Gm03_46214163121.0
Sa
lt_T
ole
ran
ce
_Q
TL
1(K
Cl)
0
1
2
3
4
5
6
7
8
9
10
11
12
13
3
Salt_Tolerance_QTL1(KCl)
Gm13_276655850.0
Gm13_282060146.3
Gm13_3347104429.0
Gm13_3446572034.8Gm13_3474823336.8Gm13_3503281838.6Gm13_3481819340.9Gm13_3603170242.3Gm13_3631691644.0Gm13_3663372146.9
Gm13_3813384056.7
Gm13_3906552864.8Gm13_4105791365.5Gm13_4136574267.0Gm13_4131268968.0
sa
lt_to
lera
nce
_Q
TL
2(K
Cl)
0.0
0.5
1.0
1.5
2.0
2.5
3.0
3.5
4.0
4.5
5.0
13
salt_tolerance_QTL2(KCl)
Chr. 3 Chr. 15
Chr. 3 Chr. 13
Chr. 3
(A) (B)
(C) (D)
48
Chapter 3. Genome-wide Association Study (GWAS) of Salt Tolerance in Worldwide Soybean
Germplasm Lines
Ailan Zeng, Pengyin Chen*, Ken Korth, Floyd Hancock, Andy Pereira, and Kristofor Brye
Ailan Zeng, Pengyin Chen, Kristofor Brye, and Andy Pereira, Department of Crop, Soil, and
Environmental Sciences, University of Arkansas, Fayetteville, AR 72701; Ken Korth, Department of Plant
Pathology, University of Arkansas, Fayetteville, AR 72701; Floyd Hancock, Former Monsanto Soybean
Breeder, 2711 Blacks Ferry Road, Pocahontas, AR 72455.
* Author for correspondence
Abbreviations: SNP, single nucleotide polymorphisms; GWAS, genome-wide association study; MAS,
marker assisted selection.

49
ABSTRACT
Salt is a severe abiotic stress causing soybean yield loss in saline soils and irrigated fields.
Marker assisted selection (MAS) is a powerful genomic tool for increasing the efficiency of breeding salt-
tolerant soybean varieties. The objectives of this study were to uncover novel single nucleotide
polymorphisms (SNPs) and quantitative trait loci (QTL) associated with salt tolerance, and to confirm the
previously identified genomic regions and SNPs for salt tolerance. A total of 283 diverse soybean plant
introductions (PIs) were screened for salt tolerance in the greenhouse based on leaf chloride
concentration and leaf chlorophyll concentration after 12 - 18 days of 120 mM NaCl treatment. A total of
33,009 SNPs across 283 genotypes were used in the association analysis with leaf chloride
concentration and leaf chlorophyll concentration. Genome-wide association mapping showed that 45
SNPs representing nine genomic regions on Chromosome (Chr.) 2, 3, 7, 8, 10, 13, 14, 16, and 20 were
significant associated with both leaf chloride concentration and leaf chlorophyll concentration in 2014,
2015, and combined across years. A total of 31 SNPs on Chr. 3 were mapped at or near the previously
reported major salt-tolerance QTL. The significant SNP on Chr. 2 was also in proximity to the previously
reported SNP for salt tolerance. The other significant SNPs represent seven putative novel QTLs for salt
tolerance. The significant SNP markers on Chr. 2, 3, 14, 16, and 20, which were identified in both GLM
and MLM models, were highly recommended for MAS in breeding salt-tolerant soybean varieties. In
summary, novel QTLs and SNPs for salt-tolerance were identified by GWAS analysis, indicating that salt-
tolerance in soybean is controlled by multiple QTLs/genes. Further research should be carried out to
pinpoint the genes within the novel salt-tolerance QTL region and to study the gene functions.

50
INTRODUCTION
Soybean (Glycine max) is grown globally mainly for its protein and oil. However, soil salinity
caused more than 20% in soybean dry matter reduction over one month (Katerji et al., 2003). Therefore,
maximizing soybean yield potential depends on increases in salt tolerance to some extent. Soybean
germplasm lines range widely in their response to salt stress (Shao et al., 1986). Salt-tolerant soybean
lines (chloride excluder) accumulate less chloride concentration in leaves than salt-sensitive lines
(chloride includer) (Lee et al., 2004; Ledesma et al., 2016), whereas chloride excluders have higher leaf
chlorophyll concentration than chloride includers under salt stress (Patil et al., 2016). Evaluation of salt-
tolerance in the greenhouse is time-consuming, labor-intensive, and costly (Valencia et al., 2008;
Ledesma et al., 2016), and selection of salt-tolerant lines in the field is not accurate since the salt
concentration varies in the field. Bi-parental quantitative trait loci (QTL) mapping has been implemented
to reveal the mechanisms for salt tolerance in soybean, and molecular markers including simple
sequence repeats (SSRs) and single nucleotide polymorphism (SNPs) have been reported to be
significantly associated with salt tolerance (Lee et al. 2004; Hamwiech et al. 2011).
Compared to bi-parental QTL mapping, genome-wide association mapping provides more precise
location of QTLs. The advance of next generation sequencing (NGS) provides a platform for genome-
wide association studies (GWAS). Genome-wide association studies have been carried out to identify
markers associated with iron-deficiency chlorosis (Mamidi et al., 2011), chlorophyll (Hao et al., 2012),
seed protein and oil (Hwang et al., 2014), sudden death syndrome (SDS) (Wen et al., 2014, 2015), grain
yield, lodging, seed coat color, pubescence, flower color (Wen et al., 2015), flowering time, maturity
dates, and plant height in soybean (Wen et al., 2015; Zhang et al., 2015).
An important factor to consider in the application of GWAS is the extent of linkage disequilibrium
(LD), which refers to the degree of non-random association of alleles at different loci. The structure of LD
across the genome determines the resolution of association mapping (Zhu et al., 2008). The average LD
(r2) decayed to 0.2 within 360 kilo base pairs (kb) and 9600 kb in euchromatic and heterochromatic
regions, respectively (Hwang et al., 2014). A high marker density is required for the regions with low LD
for GWAS (Hwang et al., 2014). The other problem confronted by GWAS is the potential spurious
association caused by population structure and familiar relatedness. To control the false association

51
error rate, a general linear model (GLM) considering population structure (Pritchard et al., 2001) was
initially employed. Mixed linear model (MLM)-based methods such as unified mixed-model method (Yu et
al., 2006) and compressed MLM (Zhang et al., 2010), have been used to correct for genetic relatedness
and population structure.
Although salt tolerance in soybean has been studied using various germplasm lines, including
domesticated soybean (Glycine max) and wild soybean (Glycine soja), the major soybean QTL
conferring salt tolerance has been consistently mapped on Chromosome (Chr.) 3 (Lee et al., 2004;
Hamwieh and Xu, 2008; Hamwiech et al., 2011; Guan et al., 2014; Qi et al., 2014; Concibido et al.,
2015). Thus, a worldwide collection of diverse soybean plant introductions (PIs) included in genome-wide
association analysis (GWAS) provides a potential broad genetic basis for underlying the mechanism of
salt tolerance. The availability of SoySNP50K has paved the way for identification of single nucleotide
polymorphism (SNP) markers associated with salt tolerance in soybean using GWAS. The GWAS of salt
tolerance in soybean at the V1 stage (i.e. vegetative stage with one set of unfolded trifoliolate leaves)
was initially carried out by Huang (2013) using 192 diverse soybean germplasm lines, of which, 61%
originated from the United States. A total of 62 SNP markers on Chr. 2, 3, 5, 6, 8, and 18 from
SoySNP50K data, were significantly associated with leaf scorch score (LSS) at the V1 stage under salt
stress (Huang 2013). Kan et al. (2015) conducted GWAS on an association mapping panel consisting of
191 soybean landraces for salt tolerance at germination. One SNP on Chr. 9 and seven SNPs on Chr. 2,
3, 9, 12, and 13 were significantly associated with the germination index ratio and germination rate ratio,
respectively (Kan et al., 2015). Patil et al. (2016) performed GWAS on a panel of 106 soybean lines for
salt tolerance at the V2 stage (i.e. vegetative stages with two sets of unfolded trifoliolate leaves). A total
of 19 and 11 SNPs on Chr. 3 from SoySNP50K data were associated with LSS and leaf chlorophyll
concentrations which were expressed as SPAD value (indexed chlorophyll content reading), respectively
(Patil et al., 2016). Through whole-genome resequencing (WGRS), a total of 401 and 328 SNPs on Chr.
3 were identified to be significantly associated with LSS and SPAD (Patil et al., 2016). In this study, we
collected 283 plant introduction lines distributed in 29 countries worldwide to provide a wide genetic basis
for GWAS. Two salt-tolerance indicators, leaf chloride concentration and leaf chlorophyll concentration
were utilized for salt- tolerance evaluation at the V1 stage. The objectives of this study were to uncover
52
novel genomic regions and SNP markers for salt tolerance, and to confirm the previously identified
genomic regions and SNP markers associated with salt tolerance by GWAS. New QTLs for salt tolerance
were expected to be identified in the current association mapping population and the QTLs identified in
my bi-parental QTL mapping population were expected to be confirmed.
MATERIALS AND METHODS
Plant Materials and Evaluation of Salt Tolerance in Greenhouse
A total of 283 plant introductions (PIs) (Table 1) were obtained from the USDA Soybean
Germplasm Collection. Maturity group (MG) of these PIs ranged from 000 – VIII. 49% of PIs were from
the United States, Russia, China, Germany, and Bulgaria; the rest were from 24 different countries (Table
2). Two hundred and eighty-three PIs were planted in a randomized complete block design with two
replications in December 2014 and June 2015 in the greenhouse (25 ± 2 °C, 14 h photoperiod) of Rosen
Center at University of Arkansas. The chloride-excluder (salt-tolerant) cultivar Osage (Chen et al., 2007)
and chloride-includer (salt-sensitive) cultivar Dare (Brim, 1966) were used as checks. For each line, 10
seeds were sown in a 8.9-cm plastic pot (Plasticflowerpots.net, Lake Worth, FL) containing approximately
300g sandy loam (Kibler, AR) as the growth medium. Soil particle analysis based on a 2-hour hydrometer
method described by Arshad et al. (1996) showed that the sandy loam consists of 66% sand, 26% silt
and 8% clay. Pots were placed in trays (45 cm x 65 cm x 2.5 cm, U.S.Plastic Corp., Lima, OH) for
watering and salt treatment. At the VC stage (i.e. vegetative stage with unifoliolate leaves unrolled),
plants were thinned to five plants per pot. Seedlings were fertilized once per week with Miracle-Gro®. All
Purpose Plant Food (The Scotts Miracle-Gro Company, Marysville, Ohio). Salt treatment using 120 mM
NaCl solution was initiated at the V1 stage (i.e. vegetative stage with one set of unfolded trifoliolate
leaves). Salt treatments were performed for 2 h per day and continued until the checks showed
contrasting leaf symptoms after 12 - 18 days. After the last day of treatment, leaf chlorophyll
concentration was measured on the top, secondary, fully expanded leaves in triplicate. Leaf chlorophyll
concentration, expressed as SPAD value (indexed chlorophyll content reading), was measured with a
chlorophyll meter (Konica Minolta SPAD-502) and averaged over three sample readings. Subsequently,
the plant leaves in each pot were harvested and were dried in a forage dryer (48 °C) for one week. The
leaf samples were ground to a fine powder using a coffee bean grinder (Krups®, Shelton, CT). The fine-

53
powder sample was used for chloride extraction and quantified by inductively coupled plasma optical
emission spectroscopy (ICP-OES) as described by Wheal et al. (2010). The leaf chloride concentration
was expressed as mg kg-1.
Analysis of Variance (ANOVA) and Heritability
The descriptive statistics for leaf chloride concentration and leaf chlorophyll concentration of the
population and the checks were obtained from JMP 9.0 (JMP®, SAS Institute). Broad-sense heritability
(H2) of leaf chloride concentration and leaf chlorophyll concentration were calculated using the following
equation (Greene et al., 2008): 𝐻2 = 𝜎𝑔
2
𝜎𝑔2+
𝜎𝑔𝑥𝑒2
𝑒+
𝜎2
𝑟𝑒
, where 𝜎𝑔2 is the genetic variance, 𝜎𝑔𝑥𝑒
2 is the genotype
by year interaction, 𝜎2 is the error variance, r is the number of replications, and e is the number of years.
Analysis of variance (ANOVA) and the estimation of variance components were performed using the
PROC MIXED procedure of SAS 9.4 (SAS Institute, Cary, NC), where genotype was considered as a
fixed effect and replication nested with year was used as a random effect.
Genotyping and Quality Control
Genotypic data from ~ 42,509 SNPs for a total of 283 soybean genotypes were obtained from the
Illumina Infinium SoySNP50K BeadChip database (Song et al., 2013). A total of 290 SNPs, which were
located at scaffolds, were excluded from further analysis. Markers with a missing rate greater than 2%
and minor allele frequency (MAF) < 5% were ruled out from further analysis. Subsequently, a total of
33,009 SNPs (Table 3) with MAF ≥ 5% across 283 genotypes were employed in the association analysis
with leaf chloride concentration and leaf chlorophyll concentration.
Linkage Disequilibrium Estimation
Pairwise linkage disequilibrium (LD) between markers was calculated as squared correlation
coefficient (r2) of alleles using 33,009 SNPs. The calculation of LD was based on 10 mega base pairs
(Mb) windows using R package synbreed (Wimmer et al., 2012). The r2 was calculated separately for
euchromatic and heterochromatic regions in each chromosome because of the substantial difference in
recombination rate between these two regions. The physical lengths of euchromatic and heterochromatic
regions (Table 3) were obtained from Gmax 1.01 reference genome (Soybase, 2016). The LD decay rate
54
of the population, defined as the chromosomal distance where the LD decays to half of its maximum
value (Huang et al., 2010), was calculated using R script developed by Marroni et al. (2011).
Population Structure
All 33,009 SNP markers were sorted by chromosome and physical distance. One SNP marker
was selected every 10 SNP markers based on the physical distance, and 3301 out of 33,009 SNP
markers were used to infer the population structure by STRUCTURE 2.3.4 (Pritchard et al., 2000). The
hypothetical number of subpopulations (K) was set from 1 to 10, and five independent iterations were
performed for each K. Admixture and allele frequencies correlated models were used. The burn-in
iteration was 10,000, followed by 25,000 Markov Chain Monte Carlo (MCMC) replications. The optimum
value of K was determined by plotting the rate of change in the log probability of data (∆K) against the
successive K values (Evanno et al., 2005). The K value was considered to be optimum while ∆K reached
the maximum. The population structure (Q matrix) was generated as the STRUCTURE result. Missing
genotypes were imputed by k-nearest-neighbors with euclidean distance, and the kinship matrix (K) was
calculated by Centered-IBS method (Endelman and Jannink, 2012) using TASSEL 5.0.
Genome-wide Association Analysis
General linear model (GLM) considering population structure (Q matrix) and mixed linear model
(MLM) accounting for both population structure (Q matrix) and kinship (K matrix) were implemented in the
TASSEL 5.0 (Bradbury et al., 2007) for genome-wide association analysis. For the GLM analysis, the
equation was y = μ + Xα + Pβ + e; for MLM analysis, the equation was y = μ + Xα + Pβ + Zu + e, where y
is N x1 vector of best linear unbiased predictors (BLUPs) of genetic effect (N is the population size), μ is
the overall mean, X is the incidence matrix relating to the PI lines to the marker effects α, P is the
incidence matrix relating to the PI lines to population structure effects β, Z is the incidence matrix relating
to the PI lines to kinship effects u, and e is the random error term. For GLM with Q matrix model, 10,000
permutation runs were conducted to find out the significant SNP markers associated with leaf chloride
concentration and leaf chlorophyll concentration (Bradbury et al., 2007). The significance threshold for
SNP-trait association was determined by false discovery rate (FDR) using smoother method (Storey and
Tibshirani, 2003), the SNPs with qFDR < 0.01 or p < 7.9 x 10⁻⁵ in GLM and the SNPs with qFDR < 0.01 or
p < 7.9 x 10⁻³ in MLM, were considered to be significant. For MLM, optimum compression level was used

55
in TASSEL 5.0 (Bradbury et al., 2007). Manhattan plots of – Log10 (P) values for each SNP vs.
chromosomal position was generated as the TASSEL results.
RESULTS
Phenotypic Data
The leaf chloride concentrations of 283 PIs ranged from 21,985 to 106,399 with an average of
64,056 mg kg-1 in 2014, and ranged from 6,295 to 83,350 with an average of 35,730 mg kg-1 in 2015
(Table 4 and Fig. 1). The average leaf chloride concentration of the chloride-excluder Osage was 32,636
and 7,383 mg kg-1 in 2014 and 2015, respectively (Table 4). In contrast, the average leaf chloride
concentration of the chloride-includer Dare was 89,209 and 47,525 mg kg-1 in 2014 and 2015,
respectively (Table 4). Leaf chlorophyll concentrations (SPAD values) were significantly negatively
correlated with leaf chloride concentration under salt stress (r2 = - 0.71). The chloride-excluder Osage
exhibited greater SPAD values than chloride-includer Dare (Table 4). The SPAD values of the 283 PIs
ranged from 16.4 to 43.7 with an average of 29.9 in 2014, and ranged from 15.6 to 44.9 with an average
of 32.3 in 2015 (Table 4 and Fig. 2). Both genotype and year variances were significant (Table 5).
However, both leaf chloride and leaf chlorophyll concentrations from two years were highly correlated and
most of the genotypes in the population ranked similarly between two years, as reflected by the
insignificant genotype x year variance components. As a result, relatively high broad-sense heritability
(H2) estimates (0.76 for leaf chloride concentration, 0.65 for leaf chlorophyll concentration) with the year
as the environment factor were obtained based on variance components.
Distribution of SNP Markers, Linkage Disequilibrium, and Population Structure
A total of 33,009 SNPs were employed for GWAS analysis of salt-tolerance traits, resulting in a
marker density of 59 SNPs per Mb in euchromatic region and 18 SNPs per Mb in heterochromatic region
(Table 3). Minor allele frequency (MAF) of SNPs ranged from 0.05 to 0.50 with an average of 0.30 (Fig.
3). The linkage disequilibrium (LD) decayed at 348 kb and 4,838 kb in euchromatic region and
heterochromatic region, respectively (Table 6). STRUCTURE analysis indicated that the calculated ∆K
reached the maximum while K=3, suggesting that three subpopulations contains all PIs with the greatest

56
possibility (Fig. 4 and 5). Significant divergence among subpopulations and average distance among
populations in the same population were obtained (Table 7). None of the subpopulations had PI lines
exclusively from one country (Table 7 and Fig. 5).
Genome-wide Association Analysis
For the GLM model, a total of 45 SNPs distributed on Chr. 2, 3, 7, 8, 10, 13, 14, 16, and 20 were
significantly associated with both leaf chloride concentration and leaf chlorophyll concentration in 2014,
2015, and combined across years (Table 8). The GWAS analysis based on the average phenotypic data
over years indicated that the major alleles on Chr. 2 and Chr. 7 decreased the leaf chloride concentration
by up to 17,492 mg kg-1 and increased the leaf chlorophyll concentration by up to 6.6, while three major
alleles on Chr. 3 decreased the chloride concentration by up to 14,809 mg kg-1 and increased the leaf
chlorophyll index by up to 4.6. Meanwhile, the other 36 major alleles on Chr. 3, 8, 10, 13, 14, 16, and 20
increased the leaf chloride concentration by up to 26,345 mg kg-1 and decreased leaf chlorophyll by up to
6.9. Overall, the significant SNPs associated with salt tolerance explained 8 - 52% of phenotypic variation
for leaf chloride concentration, and 8 - 42% of phenotypic variation in leaf chlorophyll concentration. For
the MLM model, a total of 47 SNPs on Chr. 3 were significantly associated with both leaf chloride
concentration and leaf chlorophyll concentration in 2014, 2015, and combined across years. Among those
markers, 27 significant SNPs on Chr. 3, which were stable across years and traits, were detected in both
GLM and MLM models (Table 9). The SNP markers ss715581136 on Chr. 2 and ss715637438 on Chr.
20, which were significantly associated with both leaf chloride concentration and leaf chlorophyll
concentration in 2014, 2015, and combined across years in GLM model (Table 8), were also detected to
be significantly associated with leaf chloride concentration in 2014, 2015, and combined across years in
MLM model (Table 9 and Fig. 6). Also, the SNP markers ss715618712 on Chr. 14 and ss715624611 on
Chr. 16 which were significantly associated with both leaf chloride concentration and leaf chlorophyll
concentration in 2014, 2015, and combined across years in the GLM model (Table 8), were also identified
to be significantly associated with leaf chlorophyll index in 2014, 2015, and combined across years in
MLM model (Table 9 and Fig. 7).
DISCUSSION

57
The increases in NaCl concentrations in the growing media were significantly associated with leaf
chloride concentration (Ledesma et al., 2016) and leaf chlorophyll concentration which expressed as
SPAD value (Lenis et al., 2011). Leaf chloride concentration were negatively correlated with leaf
chlorophyll concentrations under salt stress (Patil et al., 2016). Both leaf chloride concentration and leaf
chlorophyll concentration were used as the indicators of salt tolerance in this study. The significant
negative correlation between leaf chloride concentration and leaf chlorophyll concentration in this study
indicated that reliable phenotypic data were generated. An important feature of GWAS was the broad
genetic variation in the mapping population, which consisted of diverse germplasm resources. In order to
capture all the possible alleles relating to salt tolerance, 283 PI lines were collected from 29 different
countries (Table 1). The mapping population showed a wide range of leaf chloride concentration and
SPAD value (Table 4), indicating that salt tolerance is controlled by a few QTL. Variation of genotype by
year interaction was not significant for leaf chloride concentration and SPAD value (Table 5), as expected
for controlled environments in the greenhouse. However, the variation of year effect was significant. It is
likely due to pots being exposed to the treatment for different number of days in 2014 and 2015,
respectively. Because the treatments were continued until the checks started to show the contrasting
foliar symptoms in each year, it continued 18 and 12 days for 2014 and 2015, respectively. Significant
differences among genotypes were present for both indicators of salt tolerance.
The linkage disequilibrium (LD) decay distances in euchromatic and heterochromatic regions,
which were 348 kb and 4,838 kb, respectively (Table 6), were similar to those reported by Zhang et al.
(2016). The 33,009 SNPs gave an average marker distance of 16.9 kb and 55.6 kb in euchromatic and
heterochromatic regions, respectively, which were much lower than the LD decay distance. Therefore, the
high density of SNPs in this study provided robust genotypic data for the association analysis. In the
GWAS analysis, population structure and relative kinship may cause spurious association between traits
and markers (Yu et al., 2006). General linear model corrects for population structure, while MLM takes
both population structure and familiar relatedness into account. Both GLM and MLM control the genomic
inflation effectively, and have been widely used in GWAS of soybean traits (Wen et al., 2014; Wen et al.,
2015; Zhang et al., 2016). In this study, three subpopulations, as suggested by STRUCTURE analysis,
were used to remove the spurious association caused by population structure. Mixed linear model was

58
also conducted at the optimum compression level since compressed MLM was demonstrated to be more
powerful and effective in association studies (Zhang et al., 2010).
A major soybean QTL conferring salt tolerance has been consistently mapped on Chr. 3 (Lee et
al., 2004; Hamwiech et al., 2011; Huang 2013; Guan et al., 2014; Concibido et al., 2015; Patil et al.,
2016). In this study, the major QTL on Chr. 3 was confirmed and narrowed down to a region of 1.86 Mb,
which was flanked by SNP marker ss715585943 and ss715586154. Moreover, the salt-tolerance gene
Glyma03g32900 (40,623,066 – 40,634,451) reported by Guan et al. (2014) and Patil et al. (2016) was
also located near the SNP marker ss715586154 (40,440,832). A total of 18 of 31 significant SNPs for
both leaf chloride concentration and SPAD value on Chr. 3 can be considered as major SNPs with
explanation of phenotypic variation greater than 10%. The SNPs significant associated with both leaf
chloride concentration and SPAD value over years were also detected on Chr. 2, 7, 8, 10, 13, 14, 16, and
20 in GLM model. Huang (2013) reported that three SNPs on Chr. 2 and two SNPs on Chr. 8 were
significantly associated with leaf scorch score at the V1 stage under salt stress. The significant SNP on
Chr. 2 identified in this study was in proximity to those detected by Huang (2013). However, the
significant SNP on Chr. 8 in this study was about 18 Mb away from those reported by Huang (2013). The
SNP ss715581136 on Chr. 2, and ss715618138 and ss715618731 on Chr. 14 can also be considered as
major SNPs since they explained greater than 10% of phenotypic variation for both leaf chloride
concentration and SPAD value (Table 8). Major alleles of 80% of SNPs significantly associated with salt
tolerance in this population study contributed to the increase of leaf chloride concentration in soybean
under 120 mM NaCl treatment, which was in agreement with the conclusion that soybean are generally
sensitive to salt stress (Launchli, 1984). Minor alleles of most of the significant SNPs on Chr. 3
contributed to the decrease in leaf chloride concentration under salt stress, which was in agreement with
previously reports (Huang, 2013). However, minor alleles of three significant SNPs on Chr. 3, three SNPs
on Chr. 7, and one SNP on Chr. 13, accounted for the increase of the leaf chloride concentration under
salt stress in this study (Table 8). Overall, the significant SNP markers on Chr. 2, 3, 14, 16, and 20, which
were identified in both GLM and MLM models (Table 9), are highly recommended for marker assisted
selection in breeding salt-tolerant soybean lines. Moreover, it was concluded that the SNPs and QTLs for
salt tolerance at germination (Kan et al., 2015) were different from those identified at vegetative stages
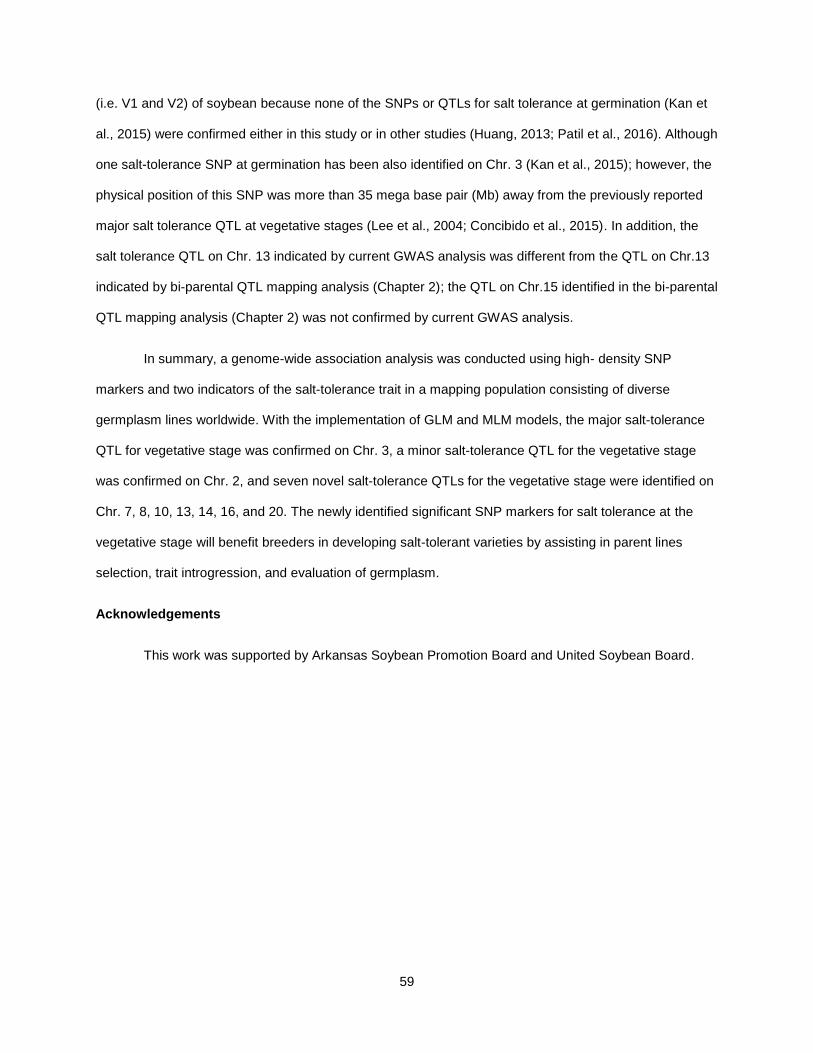
59
(i.e. V1 and V2) of soybean because none of the SNPs or QTLs for salt tolerance at germination (Kan et
al., 2015) were confirmed either in this study or in other studies (Huang, 2013; Patil et al., 2016). Although
one salt-tolerance SNP at germination has been also identified on Chr. 3 (Kan et al., 2015); however, the
physical position of this SNP was more than 35 mega base pair (Mb) away from the previously reported
major salt tolerance QTL at vegetative stages (Lee et al., 2004; Concibido et al., 2015). In addition, the
salt tolerance QTL on Chr. 13 indicated by current GWAS analysis was different from the QTL on Chr.13
indicated by bi-parental QTL mapping analysis (Chapter 2); the QTL on Chr.15 identified in the bi-parental
QTL mapping analysis (Chapter 2) was not confirmed by current GWAS analysis.
In summary, a genome-wide association analysis was conducted using high- density SNP
markers and two indicators of the salt-tolerance trait in a mapping population consisting of diverse
germplasm lines worldwide. With the implementation of GLM and MLM models, the major salt-tolerance
QTL for vegetative stage was confirmed on Chr. 3, a minor salt-tolerance QTL for the vegetative stage
was confirmed on Chr. 2, and seven novel salt-tolerance QTLs for the vegetative stage were identified on
Chr. 7, 8, 10, 13, 14, 16, and 20. The newly identified significant SNP markers for salt tolerance at the
vegetative stage will benefit breeders in developing salt-tolerant varieties by assisting in parent lines
selection, trait introgression, and evaluation of germplasm.
Acknowledgements
This work was supported by Arkansas Soybean Promotion Board and United Soybean Board.
60
References
Arshad, M.A., B. Lowery, and B. Grossman. 1996. Physical tests for monitoring soil quality. Methods for assessing soil quality, Jan(methodsforasses):123-141.
Bradbury, P.J., Z. Zhang, D.E. Kroon, T.M. Casstevens, Y. Ramdoss, and E.S. Buckler. 2007. TASSEL: Software for association mapping of complex traits in diverse samples. Bioinformatics 23:2633-2635.
Brim, C.A.1966. Dare Soybeans1 (Reg. No. 50). Crop Sci. 6:95.
Chen, P., C.H. Sneller, L.A. Mozzoni, and J.C. Rupe. 2007. Registration of ‘Osage’ soybean. Plant Regist. 1:89-92.
Concibido, V.C., I. Husic, N. Lafaver, B.L. Vallee, J. Narvel, J. Yates, and X.H. Ye. 2015. Molecular markers associated with chloride tolerant soybeans. U.S. Patent Application 14/424, 454, filed august 28, 2013.
Endelman, J.B., and J.L. Jannink. 2012. Shrinkage estimation of the realized relationship matrix. G3 2:1405-1413.
Evanno, G., S. Regnaut, and J. Goudet. 2005. Detecting the number of clusters of individuals using the software STRUCTURE: a simulation study. Mol. Ecol. 14:2611-2620.
Greene, N.V., K.E. Kenworthy, K.H. Quesenberry, J.B. Unruh, and J.B. Sartain. 2008. Variation and heritability estimates of common carpetgrass. Crop Sci. 48:2017-2025.
Guan, R., Y. Qu, Y. Guo, L. Yu, Y. Liu, J. Jiang, J. Chen, Y. Ren, G. Liu, L. Tian, and L. Jin. 2014. Salinity tolerance in soybean is modulated by natural variation in GmSALT3. Plant J. 80:937-950.
Hao, D., M. Chao, Z. Yin, D. Yu. 2012. Genome-wide association analysis detecting significant single nucleotide polymorphisms for chlorophyll and chlorophyll fluorescence parameters in soybean (Glycine max) landraces. Euphytica 186:919-931.
Hamwieh, A., and D.H. Xu. 2008. Conserved salt tolerance quantitative trait locus (QTL) in wild and cultivated soybeans. Breed. Sci. 58:355–359.
Hamwieh, A., D.D. Tuyen, H. Cong, E.R. Benitez, R. Takahashi, and D.H. Xu. 2011. Identification and validation of a major QTL for salt tolerance in soybean. Euphytica 179:451-459.
Huang, L. 2013. Genome-wide association mapping identifies QTLs and candidate genes for salt tolerance in soybean. Thesis (M.S.), University of Arkansas.
Huang, X., X. Wei, T. Sang, Q. Zhao, Q. Feng, Y. Zhao, C. Li, C. Zhu, T. Lu, Z. Zhang, and M. Li. 2010. Genome-wide association studies of 14 agronomic traits in rice landraces. Nat. Genet. 42:961-967.
Hwang, E.Y., Q. Song, G. Jia, J.E. Specht, D.L. Hyten, J. Costa, and P.B. Cregan. 2014. A genome-wide association study of seed protein and oil concentration in soybean. BMC Genomics 15:1-25.
JMP®, Version 9.0. SAS Institute Inc., Cary, NC, 1989-2007.
Kan, G., W. Zhang, W. Yang, D. Ma, D. Zhang, D. Hao, Z. Hu, and D. Yu. 2015. Association mapping of soybean seed germination under salt stress. Mol. Genet. Genomics 290:2147-2162.
Katerji, N., J.W. Hoorn, A. Hamdy, and M. Mastrorilli. 2003. Salinity effect on crop development and yield, analysis of salt tolerance according to several classification methods. Agr. Water Manage 62:37-66.
Launchli, A. 1984. Salt exclusion: an adaptation of legumes for crops and pastures under saline conditions. In: Staples RC, Toeniessen GH (eds) Salinity tolerance in plants. Strategies for crop improvement. Wiley, New York, pp 171–187.

61
Ledesma, F., C. Lopez, D. Ortiz, P. Chen, K.L. Korth,T. Ishibashi, A. Zeng, M. Orazaly, and L. Florez-Palacios. 2016. A Simple Greenhouse Method for Screening Salt Tolerance in Soybean. Crop Sci. 56:585-594.
Lee, G.J., H.R. Boerma, M.R. Villagarcia, X. Zhou, T.E. Carter, Z. Li, and M.O. Gibba. 2004. A major QTL conditioning salt tolerance in S-100 soybean and descendent cultivars. Theor. Appl. Genet.109:1610-1619.
Lenis, J.M., M. Ellersieck, D.G. Blevins, D. A. Sleper, H.T. Nguyen, D. Dunn, J.D. Lee, and J.G. Shannon. 2011. Differences in ion accumulation and salt tolerance among Glycine accessions. J. Agron. Crop Sci. 197:302-310.
Mamidi, S., S. Chikara, R.J. Goos, D.L. Hyten, S.M. Moghaddam, P.B. Cregan, and P.E. McClean. 2011. Genome-wide association analysis identifies candidate genes associated with iron deficiency chlorosis in soybean. Plant Genome 4:154-164.
Marroni, F., S. Pinosio, G. Zaina, F. Fogolari, N. Felice, F. Cattonaro, and M. Morgante. 2011. Nucleotide diversity and linkage disequilibrium in Populus nigra cinnamyl alcohol dehydrogenase (CAD4) gene. Tree Genet. Genomes 7:1011-1023.
Patil, G., T. Do, T.D. Vuong, B. Valliyodan, J.D. Lee, J. Chaudhary, J.G. Shannon, and H. T. Nguyen. 2016. Genomic-assisted haplotype analysis and the development of high-throughput SNP markers for salinity tolerance in soybean. Sci. Rep. 6:1-13.
Pritchard, J.K., M. Stephens, and P. Donnelly. 2000. Inference of population structure using multilocus genotype data. Genetics 155:945-959.
Pritchard, J.K., and P. Donnelly. 2001. Case-control studies of association in structured or admixed populations. Theor. Popul. Biol. 60:227-237.
Qi, X., M.W. Li, M. Xie, X. Liu, M. Ni, G. Shao, C. Song, A.K.Y. Yim, Y. Tao, F.L. Wong, and S. Isobe. 2014. Identification of a novel salt tolerance gene in wild soybean by whole-genome sequencing. Nat. Commun. 5:4340-4350.
SAS Institute. 2004. The SAS system for Windows. Release 9.4. SAS Institute, Cary, NC.
Shao, G.H., J.Z. Song, and H.L. Liu. 1986. Preliminary studies on the evaluation of salt tolerance in soybean varieties. Acta. Agron. Sin. 6:30-35.
Wen, Z., R. Tan, J. Yuan, C. Bales, W. Du, S. Zhang, M.I. Chilvers, C. Schmidt, Q. Song, P.B. Cregan, and D. Wang. 2014. Genome-wide association mapping of quantitative resistance to sudden death syndrome in soybean. BMC Genomics 15:1-11.
Wen, Z.X., J.F. Boyse, Q. Song, P.B. Cregan, and D. Wang. 2015. Genomic consequences of selection and genome-wide association mapping in soybean. BMC Genomics 16:671-684.
Wheal, M.S., and T.P. Lyndon. 2010. Chloride analysis of botanical samples by ICP-OES. J. Anal. At. Spectrom 25:1946-1952.
Wimmer, V., T. Albrecht, H.J. Auinger, and C.C. Schon. 2012. Synbreed: a framework for the analysis of genomic prediction data using R. Bioinformatics 28:2086-2087.
Pritchard, J.K., M. Stephens, and P. Donnelly. 2000. Inference of population structure using multilocus genotype data. Genetics 155:945-959.
Song, Q., D.L. Hyten, G. Jia, C.V. Quigley, E.W. Fickus, R.L. Nelson, and P.B. Cregan. 2013. Development and evaluation of SoySNP50K, a high-density genotyping array for soybean. PLoS One 8:p.e54985.
Storey, J.D., and R. Tibshirani. 2003. Statistical significance for genomewide studies. Proc. Natl. Acad. Sci. 100:9440-9445.

62
Valencia, R., P. Chen, T. Ishibashi, and M. Conatser. 2008. A rapid and effective method for screening salt tolerance in soybean. Crop Sci. 48:1773-1779.
Yu, J., G. Pressoir, W.H. Briggs, I.V. Bi, M. Yamasaki, J.F. Doebley, M.D. McMullen, B.S. Gaut, D.M. Nielsen, J.B. Holland, and S. Kresovich. 2006. A unified mixed-model method for association mapping that accounts for multiple levels of relatedness. Nat. Genet. 38:203-208.
Zhang, Z., E. Ersoz, C.Q. Lai, R.J. Todhunter, H.K. Tiwari, M.A. Gore, P.J. Bradbury, J. Yu, D.K. Arnett, J.M. Ordovas, and E.S. Buckler. 2010. Mixed linear model approach adapted for genome-wide association studies. Nat. Genet. 42:355-360.
Zhang, J., Q. Song, P.B. Cregan, R.L. Nelson, X. Wang, J.Wu, and G. Jiang. 2015. Genome-wide association study for flowering time, maturity dates and plant height in early maturing soybean (Glycine max) germplasm. BMC Genomics 16:217-227.
Zhang, J., Q. Song, P.B. Cregan, and G.L. Jiang. 2016. Genome-wide association study, genomic prediction and marker-assisted selection for seed weight in soybean (Glycine max). Theor. Appl. Genet.129:117-130.
Zhu, C., M. Core, E. Buckler, and J. Yu. 2008. Status and prospects of association mapping in plants. Plant Genome 1:5-20.

63
Table 1. The list of a total of 283 soybean cultivars screened for salt tolerance in greenhouse experiments in 2014 and 2015.
Plant introduction Cultivar name MG† Country‡
PI546043 OT89-05 0 Canada PI548311 Capital 0 Canada PI548498 Acme 0 Canada PI548504 Altona 0 Canada PI548593 Maple Arrow 0 Canada PI548594 Maple Presto 0 Canada PI548607 Portage 0 Canada PI572242 RCAT Angora II Canada PI591429 OT93-26 0 Canada PI591431 OT94-49 0 Canada PI596527 Lesoy 273 0 Canada PI518663 Avery IV USA PI518668 TN 4-86 IV USA PI518671 Williams 82 III USA PI527704 A6785 VI USA PI536637 Perrin VIII USA PI543793 Delsoy 4500 IV USA PI543832 Buckshot 723 VII USA PI548268 T291H III USA PI548436 Acadian VIII USA PI548440 Armredo VI USA PI548476 Nela VIII USA PI548477 Ogden VI USA PI548533 CLARK IV USA PI548546 Custer IV USA PI548604 Pershing IV USA PI548659 Braxton VII USA PI548660 Bragg VII USA PI548663 Dowling VIII USA PI548666 Hardee VIII USA PI548698 Yelnanda VIII USA PI548969 Alamo IX USA PI548970 Foster VIII USA PI548974 Bedford V USA PI548991 TN 5-85 V USA PI553039 Davis VI USA PI553045 Cook VIII USA PI553052 NAROW V USA PI567788 Bienville VIII USA PI567790 Curtis VI USA PI567791 Kino VI USA PI584506 Carver VII USA PI593653 Crowley V USA PI595099 G93-9223 VII USA PI598222 TN 4-94 IV USA PI629013 S96-2692 V USA PI633610 Desha VI USA PI633736 S97-1688 V USA PI633970 OZARK VI USA PI636460 TN03-350 VI USA
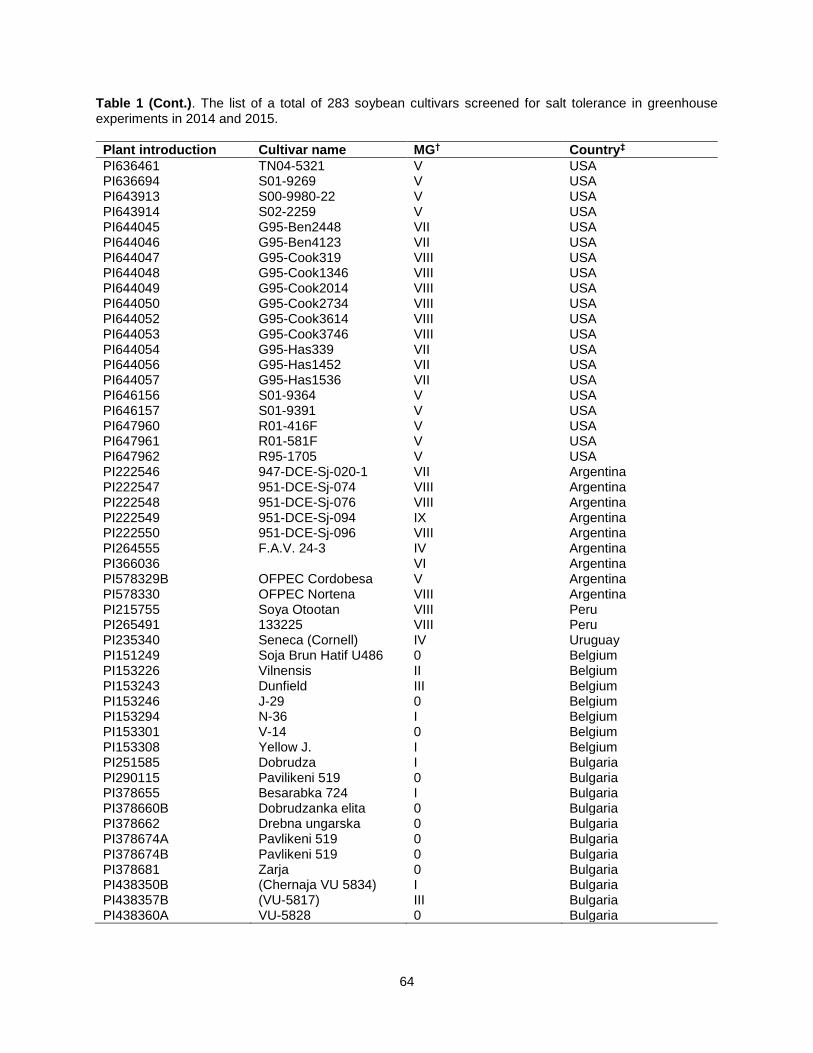
64
Table 1 (Cont.). The list of a total of 283 soybean cultivars screened for salt tolerance in greenhouse experiments in 2014 and 2015.
Plant introduction Cultivar name MG† Country‡
PI636461 TN04-5321 V USA PI636694 S01-9269 V USA PI643913 S00-9980-22 V USA PI643914 S02-2259 V USA PI644045 G95-Ben2448 VII USA PI644046 G95-Ben4123 VII USA PI644047 G95-Cook319 VIII USA PI644048 G95-Cook1346 VIII USA PI644049 G95-Cook2014 VIII USA PI644050 G95-Cook2734 VIII USA PI644052 G95-Cook3614 VIII USA PI644053 G95-Cook3746 VIII USA PI644054 G95-Has339 VII USA PI644056 G95-Has1452 VII USA PI644057 G95-Has1536 VII USA PI646156 S01-9364 V USA PI646157 S01-9391 V USA PI647960 R01-416F V USA PI647961 R01-581F V USA PI647962 R95-1705 V USA PI222546 947-DCE-Sj-020-1 VII Argentina PI222547 951-DCE-Sj-074 VIII Argentina PI222548 951-DCE-Sj-076 VIII Argentina PI222549 951-DCE-Sj-094 IX Argentina PI222550 951-DCE-Sj-096 VIII Argentina PI264555 F.A.V. 24-3 IV Argentina PI366036 VI Argentina PI578329B OFPEC Cordobesa V Argentina PI578330 OFPEC Nortena VIII Argentina PI215755 Soya Otootan VIII Peru PI265491 133225 VIII Peru PI235340 Seneca (Cornell) IV Uruguay PI151249 Soja Brun Hatif U486 0 Belgium PI153226 Vilnensis II Belgium PI153243 Dunfield III Belgium PI153246 J-29 0 Belgium PI153294 N-36 I Belgium PI153301 V-14 0 Belgium PI153308 Yellow J. I Belgium PI251585 Dobrudza I Bulgaria PI290115 Pavilikeni 519 0 Bulgaria PI378655 Besarabka 724 I Bulgaria PI378660B Dobrudzanka elita 0 Bulgaria PI378662 Drebna ungarska 0 Bulgaria PI378674A Pavlikeni 519 0 Bulgaria PI378674B Pavlikeni 519 0 Bulgaria PI378681 Zarja 0 Bulgaria PI438350B (Chernaja VU 5834) I Bulgaria PI438357B (VU-5817) III Bulgaria PI438360A VU-5828 0 Bulgaria
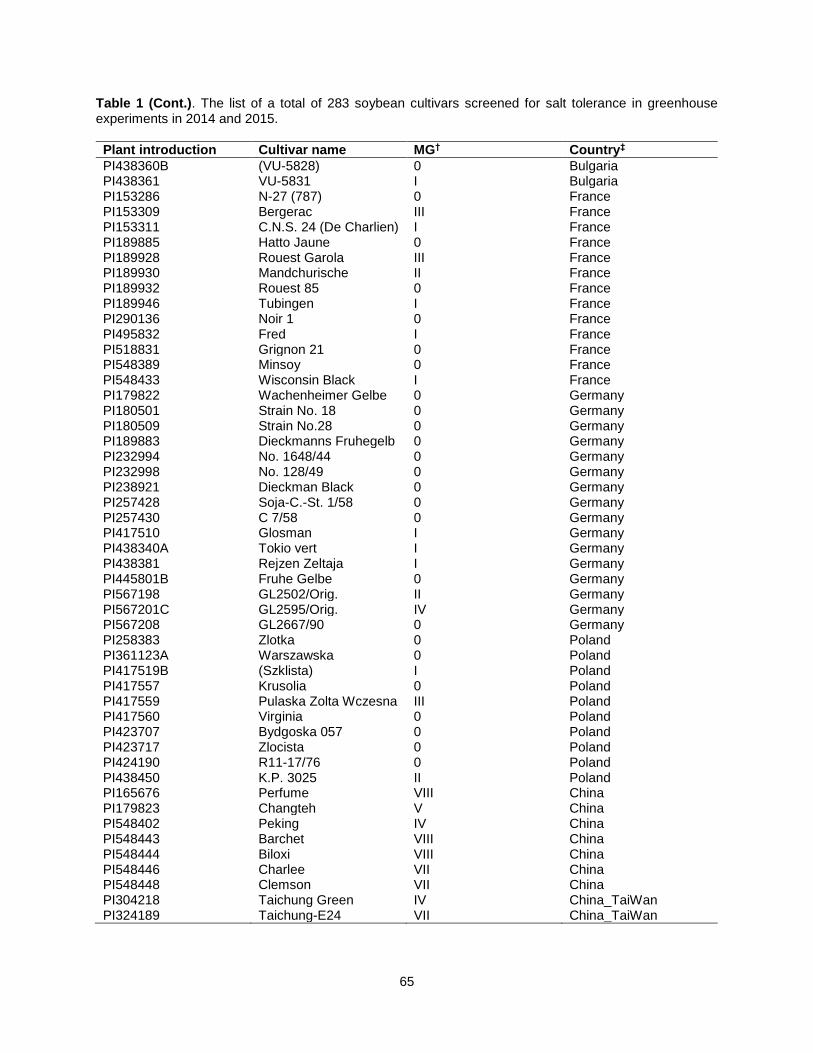
65
Table 1 (Cont.). The list of a total of 283 soybean cultivars screened for salt tolerance in greenhouse experiments in 2014 and 2015.
Plant introduction Cultivar name MG† Country‡
PI438360B (VU-5828) 0 Bulgaria PI438361 VU-5831 I Bulgaria PI153286 N-27 (787) 0 France PI153309 Bergerac III France PI153311 C.N.S. 24 (De Charlien) I France PI189885 Hatto Jaune 0 France PI189928 Rouest Garola III France PI189930 Mandchurische II France PI189932 Rouest 85 0 France PI189946 Tubingen I France PI290136 Noir 1 0 France PI495832 Fred I France PI518831 Grignon 21 0 France PI548389 Minsoy 0 France PI548433 Wisconsin Black I France PI179822 Wachenheimer Gelbe 0 Germany PI180501 Strain No. 18 0 Germany PI180509 Strain No.28 0 Germany PI189883 Dieckmanns Fruhegelb 0 Germany PI232994 No. 1648/44 0 Germany PI232998 No. 128/49 0 Germany PI238921 Dieckman Black 0 Germany PI257428 Soja-C.-St. 1/58 0 Germany PI257430 C 7/58 0 Germany PI417510 Glosman I Germany PI438340A Tokio vert I Germany PI438381 Rejzen Zeltaja I Germany PI445801B Fruhe Gelbe 0 Germany PI567198 GL2502/Orig. II Germany PI567201C GL2595/Orig. IV Germany PI567208 GL2667/90 0 Germany PI258383 Zlotka 0 Poland PI361123A Warszawska 0 Poland PI417519B (Szklista) I Poland PI417557 Krusolia 0 Poland PI417559 Pulaska Zolta Wczesna III Poland PI417560 Virginia 0 Poland PI423707 Bydgoska 057 0 Poland PI423717 Zlocista 0 Poland PI424190 R11-17/76 0 Poland PI438450 K.P. 3025 II Poland PI165676 Perfume VIII China PI179823 Changteh V China PI548402 Peking IV China PI548443 Barchet VIII China PI548444 Biloxi VIII China PI548446 Charlee VII China PI548448 Clemson VII China PI304218 Taichung Green IV China_TaiWan PI324189 Taichung-E24 VII China_TaiWan
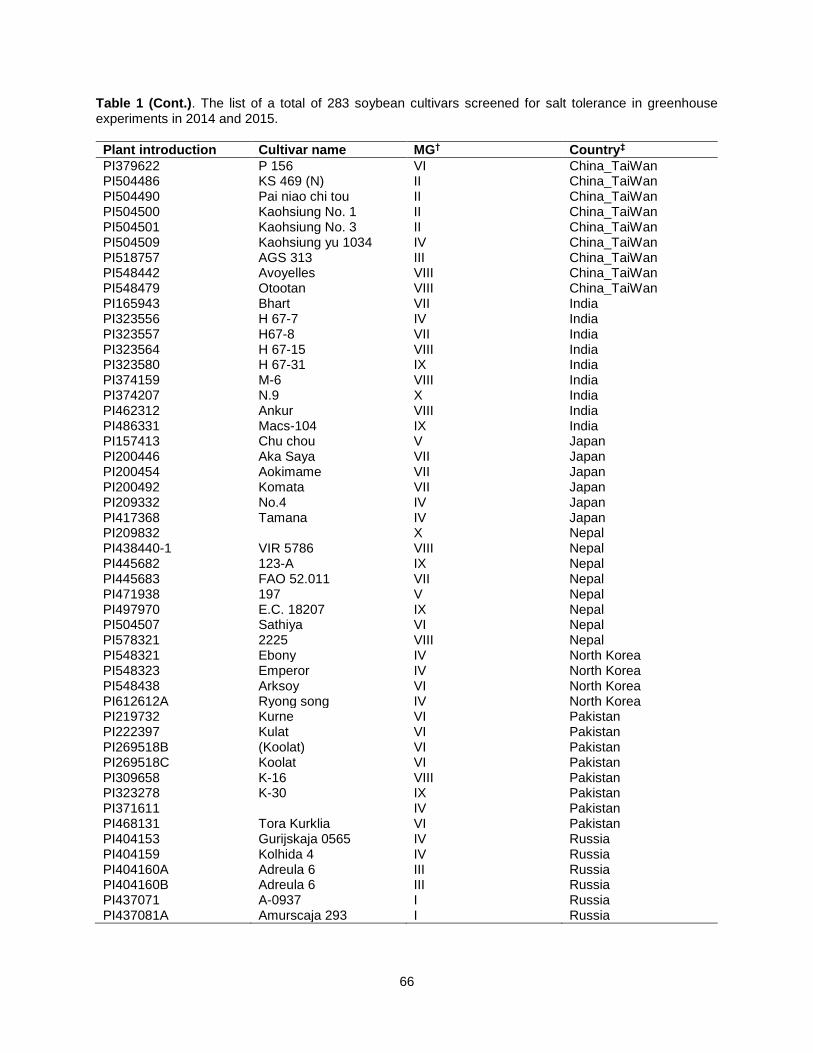
66
Table 1 (Cont.). The list of a total of 283 soybean cultivars screened for salt tolerance in greenhouse experiments in 2014 and 2015.
Plant introduction Cultivar name MG† Country‡
PI379622 P 156 VI China_TaiWan PI504486 KS 469 (N) II China_TaiWan PI504490 Pai niao chi tou II China_TaiWan PI504500 Kaohsiung No. 1 II China_TaiWan PI504501 Kaohsiung No. 3 II China_TaiWan PI504509 Kaohsiung yu 1034 IV China_TaiWan PI518757 AGS 313 III China_TaiWan PI548442 Avoyelles VIII China_TaiWan PI548479 Otootan VIII China_TaiWan PI165943 Bhart VII India PI323556 H 67-7 IV India PI323557 H67-8 VII India PI323564 H 67-15 VIII India PI323580 H 67-31 IX India PI374159 M-6 VIII India PI374207 N.9 X India PI462312 Ankur VIII India PI486331 Macs-104 IX India PI157413 Chu chou V Japan PI200446 Aka Saya VII Japan PI200454 Aokimame VII Japan PI200492 Komata VII Japan PI209332 No.4 IV Japan PI417368 Tamana IV Japan PI209832 X Nepal PI438440-1 VIR 5786 VIII Nepal PI445682 123-A IX Nepal PI445683 FAO 52.011 VII Nepal PI471938 197 V Nepal PI497970 E.C. 18207 IX Nepal PI504507 Sathiya VI Nepal PI578321 2225 VIII Nepal PI548321 Ebony IV North Korea PI548323 Emperor IV North Korea PI548438 Arksoy VI North Korea PI612612A Ryong song IV North Korea PI219732 Kurne VI Pakistan PI222397 Kulat VI Pakistan PI269518B (Koolat) VI Pakistan PI269518C Koolat VI Pakistan PI309658 K-16 VIII Pakistan PI323278 K-30 IX Pakistan PI371611 IV Pakistan PI468131 Tora Kurklia VI Pakistan PI404153 Gurijskaja 0565 IV Russia PI404159 Kolhida 4 IV Russia PI404160A Adreula 6 III Russia PI404160B Adreula 6 III Russia PI437071 A-0937 I Russia PI437081A Amurscaja 293 I Russia
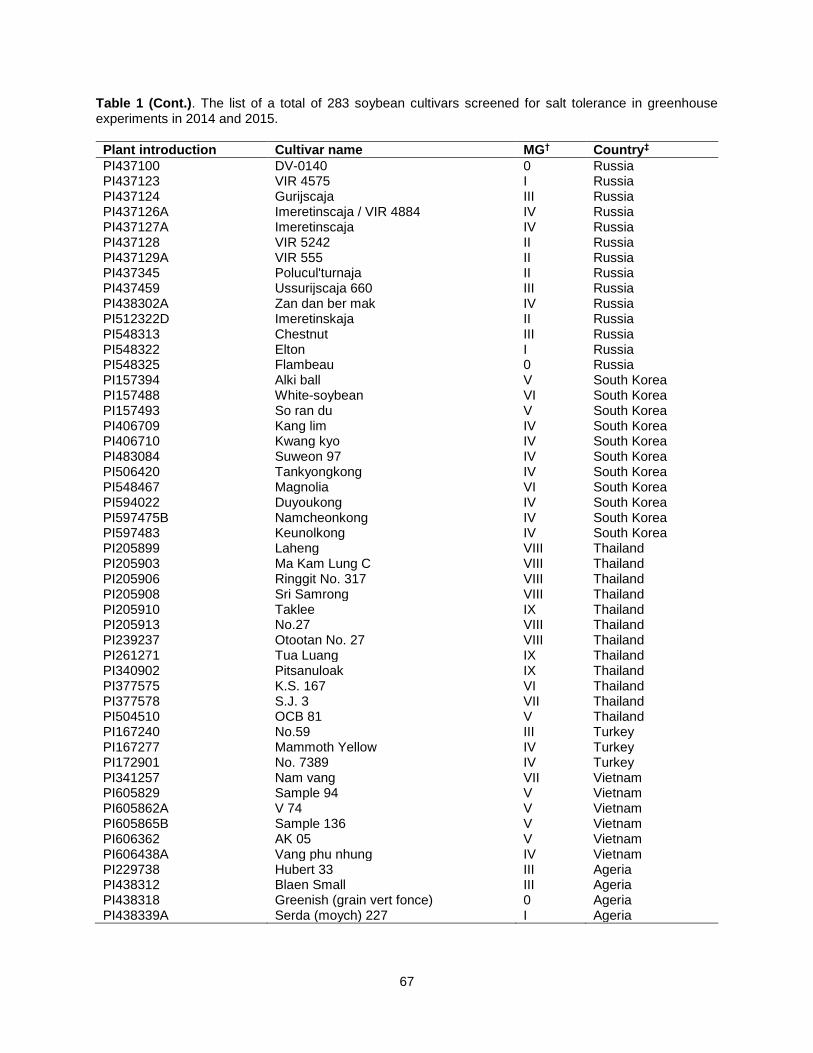
67
Table 1 (Cont.). The list of a total of 283 soybean cultivars screened for salt tolerance in greenhouse experiments in 2014 and 2015.
Plant introduction Cultivar name MG† Country‡
PI437100 DV-0140 0 Russia PI437123 VIR 4575 I Russia PI437124 Gurijscaja III Russia PI437126A Imeretinscaja / VIR 4884 IV Russia PI437127A Imeretinscaja IV Russia PI437128 VIR 5242 II Russia PI437129A VIR 555 II Russia PI437345 Polucul'turnaja II Russia PI437459 Ussurijscaja 660 III Russia PI438302A Zan dan ber mak IV Russia PI512322D Imeretinskaja II Russia PI548313 Chestnut III Russia PI548322 Elton I Russia PI548325 Flambeau 0 Russia PI157394 Alki ball V South Korea PI157488 White-soybean VI South Korea PI157493 So ran du V South Korea PI406709 Kang lim IV South Korea PI406710 Kwang kyo IV South Korea PI483084 Suweon 97 IV South Korea PI506420 Tankyongkong IV South Korea PI548467 Magnolia VI South Korea PI594022 Duyoukong IV South Korea PI597475B Namcheonkong IV South Korea PI597483 Keunolkong IV South Korea PI205899 Laheng VIII Thailand PI205903 Ma Kam Lung C VIII Thailand PI205906 Ringgit No. 317 VIII Thailand PI205908 Sri Samrong VIII Thailand PI205910 Taklee IX Thailand PI205913 No.27 VIII Thailand PI239237 Otootan No. 27 VIII Thailand PI261271 Tua Luang IX Thailand PI340902 Pitsanuloak IX Thailand PI377575 K.S. 167 VI Thailand PI377578 S.J. 3 VII Thailand PI504510 OCB 81 V Thailand PI167240 No.59 III Turkey PI167277 Mammoth Yellow IV Turkey PI172901 No. 7389 IV Turkey PI341257 Nam vang VII Vietnam PI605829 Sample 94 V Vietnam PI605862A V 74 V Vietnam PI605865B Sample 136 V Vietnam PI606362 AK 05 V Vietnam PI606438A Vang phu nhung IV Vietnam PI229738 Hubert 33 III Ageria PI438312 Blaen Small III Ageria PI438318 Greenish (grain vert fonce) 0 Ageria PI438339A Serda (moych) 227 I Ageria
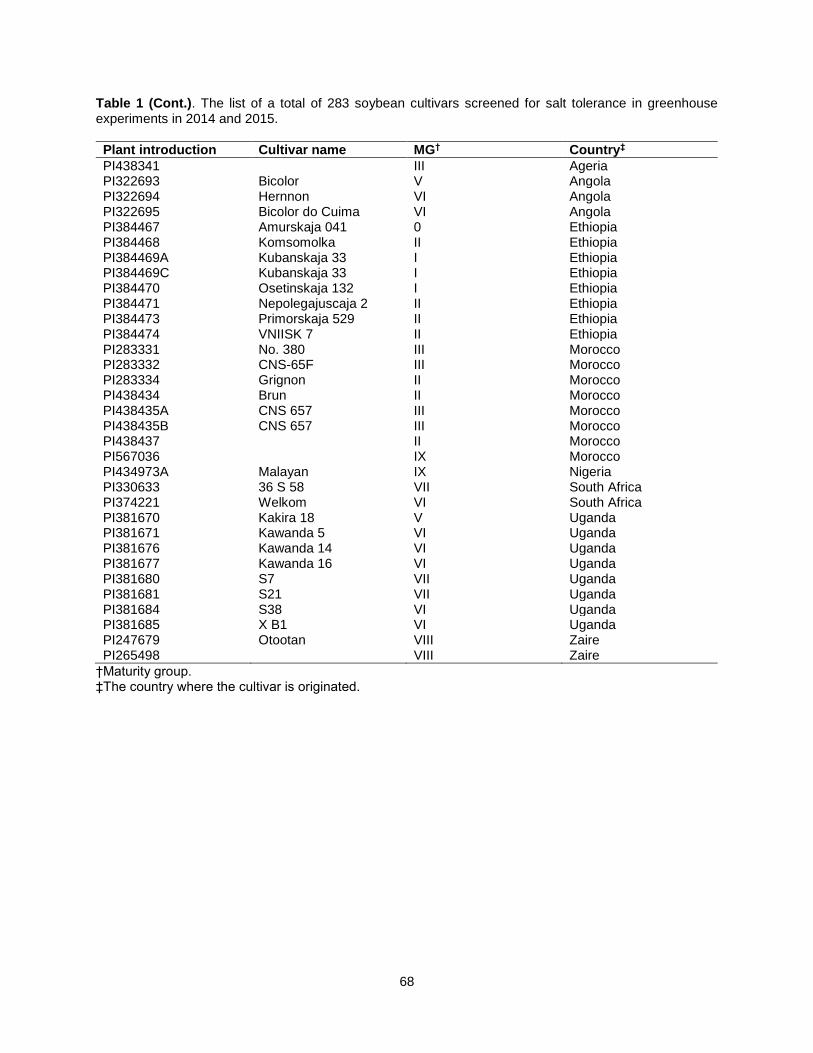
68
Table 1 (Cont.). The list of a total of 283 soybean cultivars screened for salt tolerance in greenhouse experiments in 2014 and 2015.
Plant introduction Cultivar name MG† Country‡
PI438341 III Ageria PI322693 Bicolor V Angola PI322694 Hernnon VI Angola PI322695 Bicolor do Cuima VI Angola PI384467 Amurskaja 041 0 Ethiopia PI384468 Komsomolka II Ethiopia PI384469A Kubanskaja 33 I Ethiopia PI384469C Kubanskaja 33 I Ethiopia PI384470 Osetinskaja 132 I Ethiopia PI384471 Nepolegajuscaja 2 II Ethiopia PI384473 Primorskaja 529 II Ethiopia PI384474 VNIISK 7 II Ethiopia PI283331 No. 380 III Morocco PI283332 CNS-65F III Morocco PI283334 Grignon II Morocco PI438434 Brun II Morocco PI438435A CNS 657 III Morocco PI438435B CNS 657 III Morocco PI438437 II Morocco PI567036 IX Morocco PI434973A Malayan IX Nigeria PI330633 36 S 58 VII South Africa PI374221 Welkom VI South Africa PI381670 Kakira 18 V Uganda PI381671 Kawanda 5 VI Uganda PI381676 Kawanda 14 VI Uganda PI381677 Kawanda 16 VI Uganda PI381680 S7 VII Uganda PI381681 S21 VII Uganda PI381684 S38 VI Uganda PI381685 X B1 VI Uganda PI247679 Otootan VIII Zaire PI265498 VIII Zaire
†Maturity group. ‡The country where the cultivar is originated.
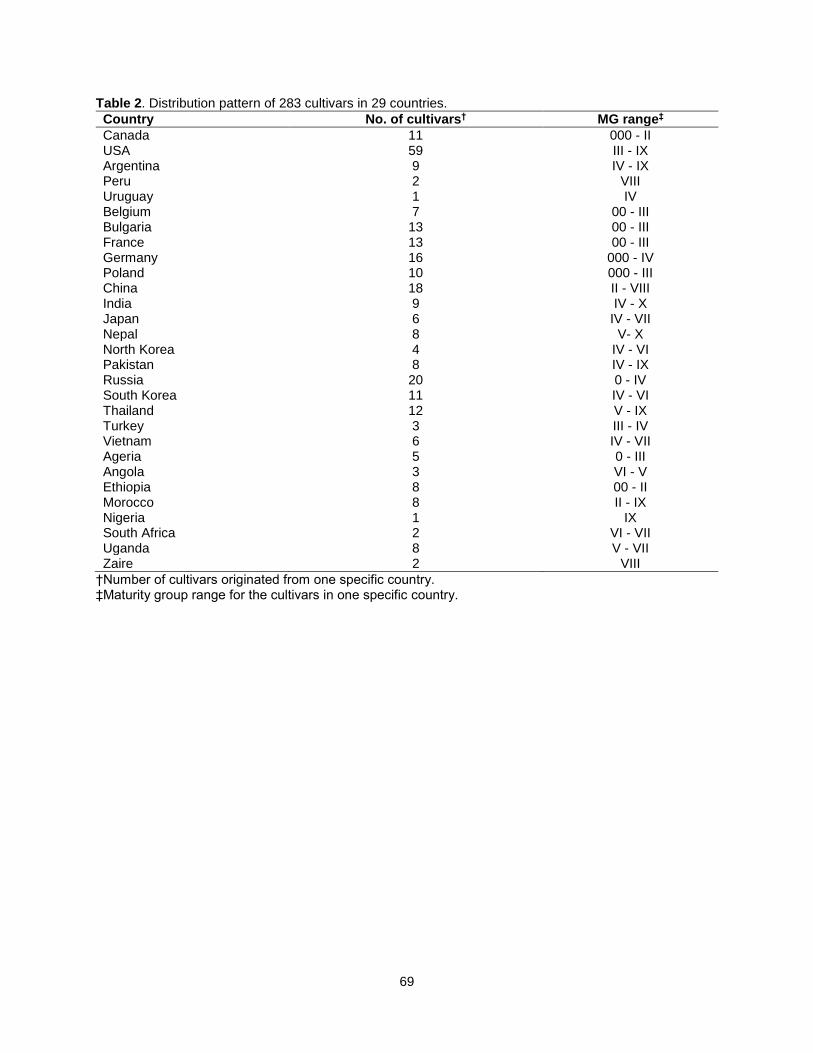
69
Table 2. Distribution pattern of 283 cultivars in 29 countries.
Country No. of cultivars† MG range‡
Canada 11 000 - II USA 59 III - IX Argentina 9 IV - IX Peru 2 VIII Uruguay 1 IV Belgium 7 00 - III Bulgaria 13 00 - III France 13 00 - III Germany 16 000 - IV Poland 10 000 - III China 18 II - VIII India 9 IV - X Japan 6 IV - VII Nepal 8 V- X North Korea 4 IV - VI Pakistan 8 IV - IX Russia 20 0 - IV South Korea 11 IV - VI Thailand 12 V - IX Turkey 3 III - IV Vietnam 6 IV - VII Ageria 5 0 - III Angola 3 VI - V Ethiopia 8 00 - II Morocco 8 II - IX Nigeria 1 IX South Africa 2 VI - VII Uganda 8 V - VII Zaire 2 VIII
†Number of cultivars originated from one specific country. ‡Maturity group range for the cultivars in one specific country.
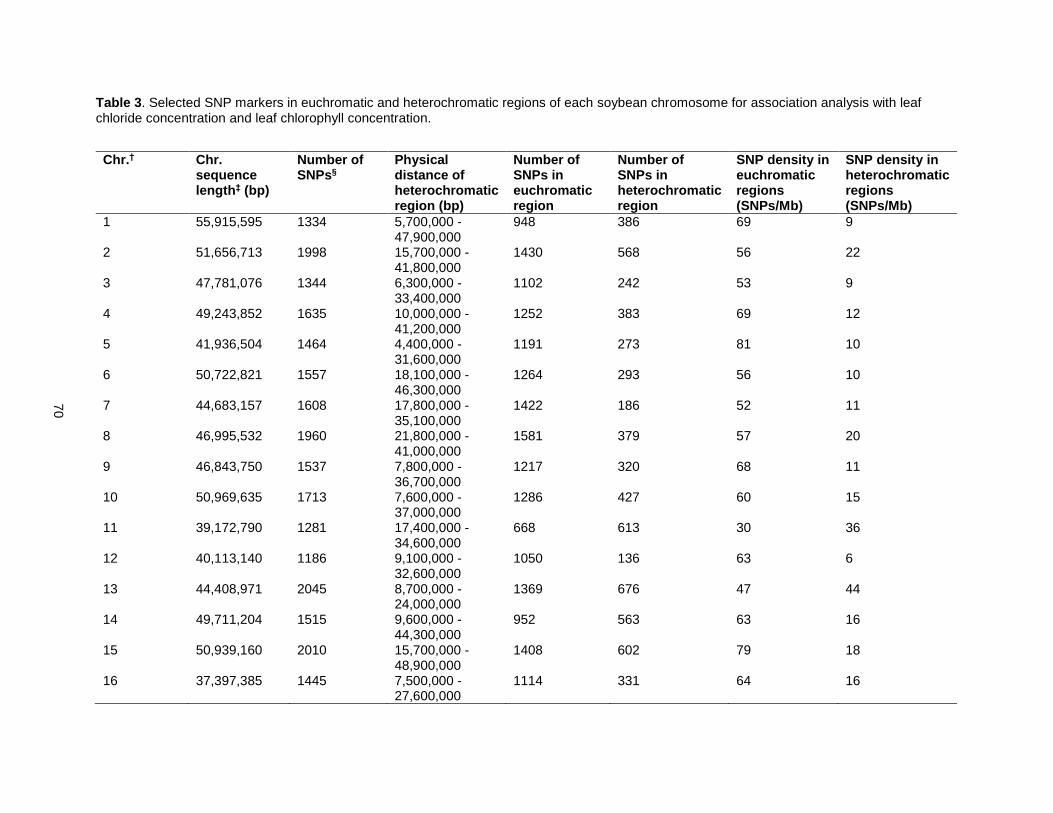
70
Table 3. Selected SNP markers in euchromatic and heterochromatic regions of each soybean chromosome for association analysis with leaf chloride concentration and leaf chlorophyll concentration.
Chr.† Chr. sequence length‡ (bp)
Number of SNPs§
Physical distance of heterochromatic region (bp)
Number of SNPs in euchromatic region
Number of SNPs in heterochromatic region
SNP density in euchromatic regions (SNPs/Mb)
SNP density in heterochromatic regions (SNPs/Mb)
1 55,915,595 1334 5,700,000 - 47,900,000
948 386 69 9
2 51,656,713 1998 15,700,000 - 41,800,000
1430 568 56 22
3 47,781,076 1344 6,300,000 - 33,400,000
1102 242 53 9
4 49,243,852 1635 10,000,000 - 41,200,000
1252 383 69 12
5 41,936,504 1464 4,400,000 - 31,600,000
1191 273 81 10
6 50,722,821 1557 18,100,000 - 46,300,000
1264 293 56 10
7 44,683,157 1608 17,800,000 - 35,100,000
1422 186 52 11
8 46,995,532 1960 21,800,000 - 41,000,000
1581 379 57 20
9 46,843,750 1537 7,800,000 - 36,700,000
1217 320 68 11
10 50,969,635 1713 7,600,000 - 37,000,000
1286 427 60 15
11 39,172,790 1281 17,400,000 - 34,600,000
668 613 30 36
12 40,113,140 1186 9,100,000 - 32,600,000
1050 136 63 6
13 44,408,971 2045 8,700,000 - 24,000,000
1369 676 47 44
14 49,711,204 1515 9,600,000 - 44,300,000
952 563 63 16
15 50,939,160 2010 15,700,000 - 48,900,000
1408 602 79 18
16 37,397,385 1445 7,500,000 - 27,600,000
1114 331 64 16

71
Table 3 (Cont.). Selected SNP markers in euchromatic and heterochromatic regions of each soybean chromosome for association analysis with leaf chloride concentration and leaf chlorophyll concentration.
Chr.† Chr. sequence length‡ (bp)
Number of SNPs§
Physical distance of heterochromatic region (bp)
Number of SNPs in euchromatic region
Number of SNPs in heterochromatic region
SNP density in euchromatic regions (SNPs/Mb)
SNP density in heterochromatic regions (SNPs/Mb)
17 41,906,774 1649 16,100,000 - 38,100,000
1104 545 55 25
18 62,308,140 2661 7,500,000 - 52,800,000
811 1850 48 41
19 50,589,441 1816 7,200,000 - 34,000,000
1209 607 51 23
20 46,773,167 1251 3,500,000 - 32,500,000
978 273 55 9
Mean 59 18 Total 33,009 23,356 9653
†Chromosme. ‡The sequence length of the chromosome in basepair (bp). §Total number of SNPs in the chromomsome.

72
Table 4. Leaf chloride concentration (mg kg-1) (A) and leaf chlorophyll concentration (SPAD value) (B) of association mapping population (283 PIs) and checks (Osage and Dare) evaluated with 120 mM NaCl in 2014 and 2015.
(A)
Year
Mapping population (283 PIs)
Osage (chloride excluder)
Dare (chloride includer)
Mean Range Mean Range Mean Range
2014 64,056 21,985 - 106,399 32,636 16,890 - 45,645 89,209 75,900 - 107,850 2015 35,730 6,295 - 83,350 7,383 3,809 - 13,389 47,525 39,662 - 56,840
(B)
Year
Mapping population (283 PIs)
Osage (chloride excluder)
Dare (chloride includer)
Mean Range Mean Range Mean Range
2014 29.9 16.4 - 43.7 38.0 30.9 - 47.1 26.1 13.9 - 34.1 2015 32.3 15.6 - 44.9 42.5 34.5 - 46.8 30.5 21.8 - 39.0

73
Table 5. Analysis of variance (ANOVA) for leaf chloride concentration (A) and leaf chlorophyll concentration (SPAD values) (B) of 283 PIs lines under 120 mM NaCl treatment in the greenhouse over two years.
(A)
(B)
Source Degrees of freedom F value P-value R2
Model 567 3.28 <.0001 0.8 Year 1 527.33 <.0001 Rep(Year) 2 0.63 0.5322 Genotype 282 3.42 <.0001 Genotype * Year 282 1.27 0.0123 Error 482 Corrected Total 1049
Source Degrees of freedom F value P-value R2
Model 567 1.68 <.0001 0.6 Year 1 21.59 <.0001 Rep(Year) 2 0.36 0.6987 Genotype 282 2.08 <.0001 Genotype * Year 282 1.22 0.0271 Error 564 Corrected Total 1131

74
Table 6. Average linkage disequilibrium (LD) rate based on 33,009 SNPs within 10,000 kilo base pairs
(kb) windows in the population of 283 plant introductions lines.
Chromosome LD† decay rate (kb)
Euchromatic region Heterochromatic region
1 321 3336 2 273 1849 3 44 595 4 88 4788 5 855 15 6 1307 425 7 592 11832 8 102 514 9 531 4808 10 695 10550 11 123 160 12 289 127 13 264 1179 14 44 20284 15 801 938 16 3.52 3733 17 334 5000 18 272 17481 19 13 7585 20 4 1569
Average 348 4838
†Pairwise LD between markers was calculated as the squared allele frequency correlation among loci
(r2).

75
Table 7. Divergence among subpopulation and average distance (expected heterozygosity) among
individuals in the same subpopulation.
Subpopulation groups
FST† Heterozygosity Number of genotypes
Subpopulation 1 0.4572 0.2422 56 (3 Argentina; 1 Nepal; 1 South Korea; 50 USA; 1 Zaire)
Subpopulation 2 0.3208 0.2918 111 (2 Ageria; 1 Angola; 5 Argentina; 3 Belgium; 3 Bulgaria; 15 China; 1 Ethiopia; 3 France; 2 Germany; 9 India; 6 Japan; 1 Morocco; 7 Nepal; 1 Nigeria; 2 North Korea; 7 Pakistan; 2 Peru; 3 Poland; 6 Russia; 4 South Korea; 12 Thailand; 2 Turkey; 2 Uganda; 5 USA; 6 Vietnam; 1 Zaire)
Subpopulation 3 0.3027 0.3021 116 (3 Ageria; 2 Angola; 1 Argentina; 4 Belgium; 10 Bulgaria; 11 Canada; 3 China; 7 Ethiopia; 10 France; 14 Germany; 7 Morocco; 2 North Korea; 1 Pakistan; 7 Poland; 14 Russia; 2 South Africa; 6 South Korea; 1 Turkey; 6 Uganda; 1 Uruguay; 4 USA)
†Fixation index as a measure of genetic differentiation.

76
Table 8. List of SNPs significant associated with both leaf chloride concentration (mg kg-1) and leaf chlorophyll concentration (SPAD values) over
two years based on GLM (-Log10 P ≥ 4.0, p <- 7.9 x10⁻⁵).
SNP ID Chr† Position (bp)
Alleles‡ MAF§ Year Leaf chloride concentration SPAD values
- Log 10 P R2 Diff# - Log 10 P R2 Diff
ss715581136 2 13098947 T:C 0.1 2014 5.5 7.2 -16729.2 5.8 7.8 5.2 2015 7.4 9.8 -18253.8 8.9 11.3 8.0 Com¶ 7.8 10.2 -17491.5 10.0 13.0 6.6 ss715585865 3 37902931 C:T 0.3 2014 6.0 7.8 14138.3 4.3 5.6 -3.5 2015 13.1 17.0 16814.3 5.8 7.2 -4.3 Com 10.9 14.1 15476.3 6.8 8.7 -3.9 ss715585870 3 37984044 A:G 0.2 2014 6.9 9.0 15738.7 4.3 5.5 -3.8 2015 13.4 17.4 18487.0 5.3 6.7 -5.0 Com 11.8 15.2 17112.8 6.5 8.3 -4.4 ss715585874 3 38037948 T:C 0.3 2014 9.3 12.1 15284.8 5.1 6.6 -3.2 2015 16.2 20.7 15661.9 5.6 7.1 -3.2 Com 15.0 19.2 15473.3 7.3 9.3 -3.2 ss715585876 3 38045898 C:T 0.3 2014 8.8 11.6 14935.9 4.8 6.3 -3.1 2015 15.7 20.1 15468.0 5.4 6.8 -3.2 Com 14.5 18.5 15201.9 7.0 8.9 -3.2 ss715585877 3 38047240 A:G 0.3 2014 8.0 10.8 14299.1 4.4 5.8 -3.0 2015 14.8 19.6 14986.4 4.9 6.3 -3.0 Com 13.4 17.8 14642.7 6.3 8.3 -3.0 ss715585878 3 38048300 C:T 0.3 2014 9.3 12.1 15284.8 5.1 6.6 -3.2 2015 16.2 20.7 15661.9 5.6 7.1 -3.2 Com 15.0 19.2 15473.3 7.3 9.3 -3.2 ss715585883 3 38103441 C:A 0.3 2014 11.7 15.3 18764.7 6.4 8.4 -4.1 2015 22.6 28.0 20931.6 9.9 12.7 -5.5 Com 20.1 25.1 19848.2 11.1 14.3 -4.8 ss715585889 3 38139117 T:C 0.3 2014 9.6 12.7 14771.1 10.1 13.4 -4.4 2015 15.3 19.9 15475.0 6.3 8.1 -3.7 Com 14.8 19.2 15123.0 11.0 14.2 -4.0 ss715585890 3 38140216 A:G 0.3 2014 9.5 12.5 14597.5 9.5 12.7 -4.2 2015 15.4 19.8 15459.0 6.2 7.8 -3.7 Com 14.8 19.0 15028.3 10.6 13.6 -4.0 ss715585896 3 38183067 A:C 0.5 2014 10.3 13.5 15343.0 6.6 8.8 -3.5 2015 16.0 20.6 14840.0 7.3 9.3 -3.5 Com 15.7 20.1 15091.5 9.5 12.3 -3.5
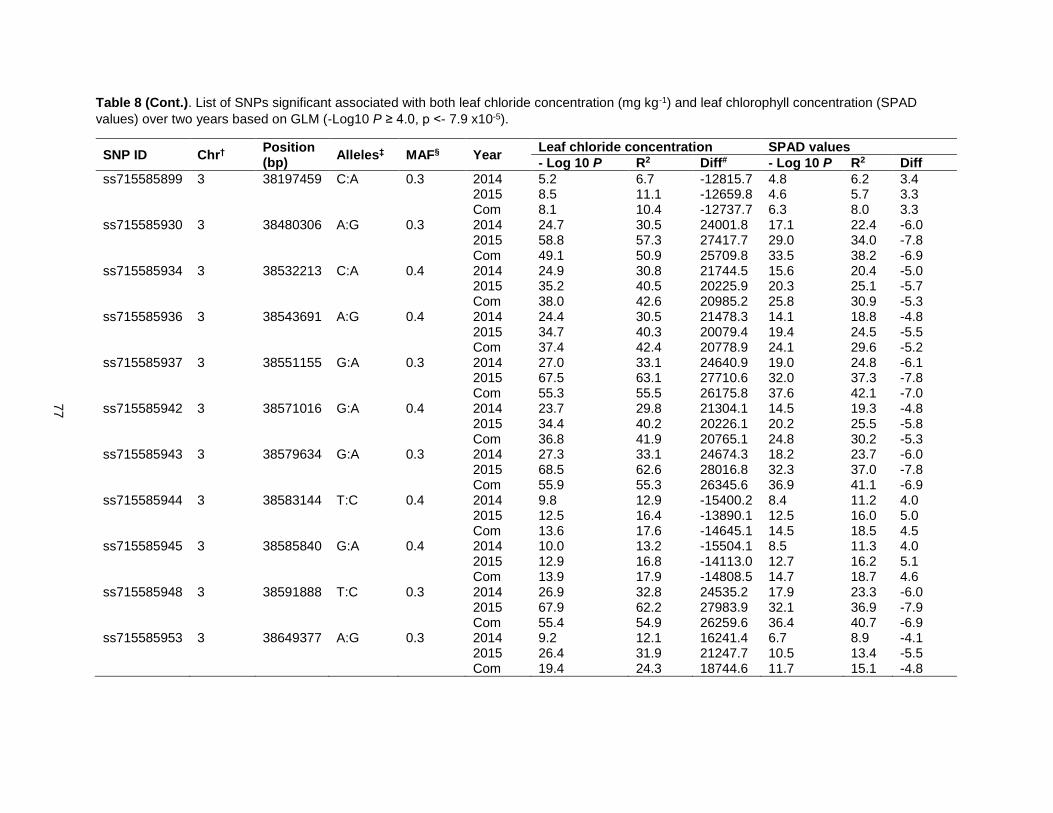
77
Table 8 (Cont.). List of SNPs significant associated with both leaf chloride concentration (mg kg-1) and leaf chlorophyll concentration (SPAD
values) over two years based on GLM (-Log10 P ≥ 4.0, p <- 7.9 x10⁻⁵).
SNP ID Chr† Position (bp)
Alleles‡ MAF§ Year Leaf chloride concentration SPAD values
- Log 10 P R2 Diff# - Log 10 P R2 Diff
ss715585899 3 38197459 C:A 0.3 2014 5.2 6.7 -12815.7 4.8 6.2 3.4 2015 8.5 11.1 -12659.8 4.6 5.7 3.3 Com 8.1 10.4 -12737.7 6.3 8.0 3.3 ss715585930 3 38480306 A:G 0.3 2014 24.7 30.5 24001.8 17.1 22.4 -6.0 2015 58.8 57.3 27417.7 29.0 34.0 -7.8 Com 49.1 50.9 25709.8 33.5 38.2 -6.9 ss715585934 3 38532213 C:A 0.4 2014 24.9 30.8 21744.5 15.6 20.4 -5.0 2015 35.2 40.5 20225.9 20.3 25.1 -5.7 Com 38.0 42.6 20985.2 25.8 30.9 -5.3 ss715585936 3 38543691 A:G 0.4 2014 24.4 30.5 21478.3 14.1 18.8 -4.8 2015 34.7 40.3 20079.4 19.4 24.5 -5.5 Com 37.4 42.4 20778.9 24.1 29.6 -5.2 ss715585937 3 38551155 G:A 0.3 2014 27.0 33.1 24640.9 19.0 24.8 -6.1 2015 67.5 63.1 27710.6 32.0 37.3 -7.8 Com 55.3 55.5 26175.8 37.6 42.1 -7.0 ss715585942 3 38571016 G:A 0.4 2014 23.7 29.8 21304.1 14.5 19.3 -4.8 2015 34.4 40.2 20226.1 20.2 25.5 -5.8 Com 36.8 41.9 20765.1 24.8 30.2 -5.3 ss715585943 3 38579634 G:A 0.3 2014 27.3 33.1 24674.3 18.2 23.7 -6.0 2015 68.5 62.6 28016.8 32.3 37.0 -7.8 Com 55.9 55.3 26345.6 36.9 41.1 -6.9 ss715585944 3 38583144 T:C 0.4 2014 9.8 12.9 -15400.2 8.4 11.2 4.0 2015 12.5 16.4 -13890.1 12.5 16.0 5.0 Com 13.6 17.6 -14645.1 14.5 18.5 4.5 ss715585945 3 38585840 G:A 0.4 2014 10.0 13.2 -15504.1 8.5 11.3 4.0 2015 12.9 16.8 -14113.0 12.7 16.2 5.1 Com 13.9 17.9 -14808.5 14.7 18.7 4.6 ss715585948 3 38591888 T:C 0.3 2014 26.9 32.8 24535.2 17.9 23.3 -6.0 2015 67.9 62.2 27983.9 32.1 36.9 -7.9 Com 55.4 54.9 26259.6 36.4 40.7 -6.9 ss715585953 3 38649377 A:G 0.3 2014 9.2 12.1 16241.4 6.7 8.9 -4.1 2015 26.4 31.9 21247.7 10.5 13.4 -5.5 Com 19.4 24.3 18744.6 11.7 15.1 -4.8

78
Table 8 (Cont.). List of SNPs significant associated with both leaf chloride concentration (mg kg-1) and leaf chlorophyll concentration (SPAD
values) over two years based on GLM (-Log10 P ≥ 4.0, p <- 7.9 x10⁻⁵).
SNP ID Chr† Position (bp)
Alleles‡ MAF§ Year Leaf chloride concentration SPAD values
- Log 10 P R2 Diff# - Log 10 P R2 Diff
ss715586057 3 39303211 G:A 0.1 2014 4.7 6.0 10449.0 6.0 7.9 -3.6 2015 10.6 13.9 13989.5 6.0 7.7 -3.8 Com 8.6 11.3 12219.2 8.1 10.6 -3.7 ss715586063 3 39357229 C:T 0.2 2014 5.7 7.4 6821.1 6.7 9.0 -6.0 2015 13.2 17.2 18646.9 6.1 7.8 1.6 Com 10.7 13.9 12734.0 8.7 11.2 -2.2 ss715586070 3 39403852 G:T 0.1 2014 5.2 6.7 10704.0 7.0 9.3 -3.9 2015 11.8 15.4 14607.8 5.2 6.5 -3.2 Com 9.5 12.5 12655.9 8.1 10.5 -3.5 ss715586082 3 39510751 G:T 0.1 2014 5.3 6.8 10660.5 6.1 8.1 -3.7 2015 12.6 16.5 16298.9 5.7 7.3 -3.9 Com 10.0 13.0 13479.7 8.0 10.4 -3.8 ss715586086 3 39600402 T:C 0.1 2014 4.5 5.7 9411.5 5.1 6.6 -3.2 2015 9.2 12.1 13254.8 4.6 5.7 -3.3 Com 7.8 10.1 11333.1 6.5 8.3 -3.2 ss715586087 3 39601253 G:A 0.1 2014 4.5 5.6 9380.0 5.0 6.5 -3.2 2015 9.1 11.9 13173.0 4.5 5.6 -3.3 Com 7.7 10.0 11276.5 6.4 8.1 -3.2 ss715586094 3 39693677 A:G 0.1 2014 4.5 5.6 9380.0 5.0 6.5 -3.2 2015 9.1 11.9 13173.0 4.5 5.6 -3.3 Com 7.7 10.0 11276.5 6.4 8.1 -3.2 ss715586095 3 39708387 A:G 0.1 2014 4.4 5.6 9275.2 4.7 6.2 -3.1 2015 8.6 11.2 12737.2 4.5 5.6 -3.3 Com 7.4 9.6 11006.2 6.2 8.0 -3.2 ss715586102 3 39759678 T:C 0.1 2014 4.5 5.7 9365.6 5.8 7.7 -3.4 2015 10.9 14.3 14022.6 5.8 7.3 -3.5 Com 8.5 11.1 11694.1 7.9 10.1 -3.4 ss715586154 3 40440832 G:A 0.1 2014 5.0 6.5 18987.6 6.0 8.1 -6.5 2015 8.0 10.6 21370.8 4.4 5.6 -5.6 Com 7.6 10.1 20179.2 7.0 9.2 -6.0 ss715597790 7 38606673 G:A 0.2 2014 4.1 5.2 -12669.9 4.2 5.3 3.9 2015 4.4 5.5 -12399.1 7.2 9.3 6.0 Com 5.1 6.5 -12534.5 7.7 9.9 5.0

79
Table 8 (Cont.). List of SNPs significant associated with both leaf chloride concentration (mg kg-1) and leaf chlorophyll concentration (SPAD
values) over two years based on GLM (-Log10 P ≥ 4.0, p <- 7.9 x10⁻⁵).
SNP ID Chr† Position (bp)
Alleles‡ MAF§ Year Leaf chloride concentration SPAD values
- Log 10 P R2 Diff# - Log 10 P R2 Diff
ss715597794 7 38623703 C:T 0.2 2014 4.3 5.4 -12727.0 4.2 5.4 3.9 2015 4.5 5.6 -12470.2 7.5 9.6 6.0 Com 5.3 6.7 -12598.6 7.9 10.2 5.0 ss715597821 7 38800856 T:C 0.2 2014 5.1 6.5 -13710.6 4.9 6.3 4.2 2015 6.9 9.0 -15024.7 11.4 14.7 7.3 Com 7.1 9.2 -14367.7 10.8 14.0 5.7 ss715601563 8 37018844 T:C 0.4 2014 4.2 5.2 8032.1 4.5 5.8 -2.8 2015 6.5 8.4 10377.4 4.9 6.1 -3.6 Com 6.3 8.0 9204.8 6.4 8.1 -3.2 ss715607372 10 44402011 C:T 0.5 2014 5.1 6.6 3883.4 4.5 5.8 -1.3 2015 6.2 8.2 5139.0 4.5 5.7 -1.5 Com 6.8 8.8 4511.2 6.1 7.8 -1.4 ss715607376 10 44420445 C:T 0.5 2014 5.0 6.5 3530.5 5.0 6.6 -1.5 2015 6.4 8.4 4978.3 4.7 5.9 -1.5 Com 6.8 8.9 4254.4 6.5 8.5 -1.5 ss715616115 13 39607602 C:A 0.3 2014 4.8 6.1 -8511.2 4.7 6.0 2.7 2015 10.1 13.2 -12224.4 6.2 7.8 3.6 Com 8.4 10.9 -10367.8 7.3 9.4 3.2 ss715618138 14 2684853 C:A 0.2 2014 6.8 9.0 14149.3 5.5 7.2 -3.6 2015 7.2 9.5 11753.0 6.5 8.3 -3.7 Com 8.5 11.2 12951.2 8.1 10.6 -3.7 ss715618149 14 2714940 T:C 0.2 2014 6.1 8.0 13056.8 4.6 5.9 -3.2 2015 6.5 8.5 10662.8 5.3 6.7 -3.1 Com 7.6 10.0 11859.8 6.7 8.7 -3.1 ss715618712 14 4123566 G:T 0.1 2014 6.5 8.5 15631.8 6.4 8.4 -4.6 2015 4.6 5.7 10919.0 6.4 8.1 -4.9 Com 6.7 8.7 13275.4 8.7 11.2 -4.8 ss715618731 14 4161326 G:A 0.3 2014 8.0 10.5 13499.2 6.5 8.6 -5.2 2015 5.3 6.8 6285.6 5.1 6.4 -3.3 Com 8.1 10.5 9892.4 7.8 10.1 -4.3 ss715624611 16 33415484 G:A 0.1 2014 4.8 6.1 12311.8 6.1 8.0 -4.0 2015 6.2 8.0 11121.3 7.0 8.9 -3.9 Com 6.5 8.4 11716.5 8.9 11.5 -4.0
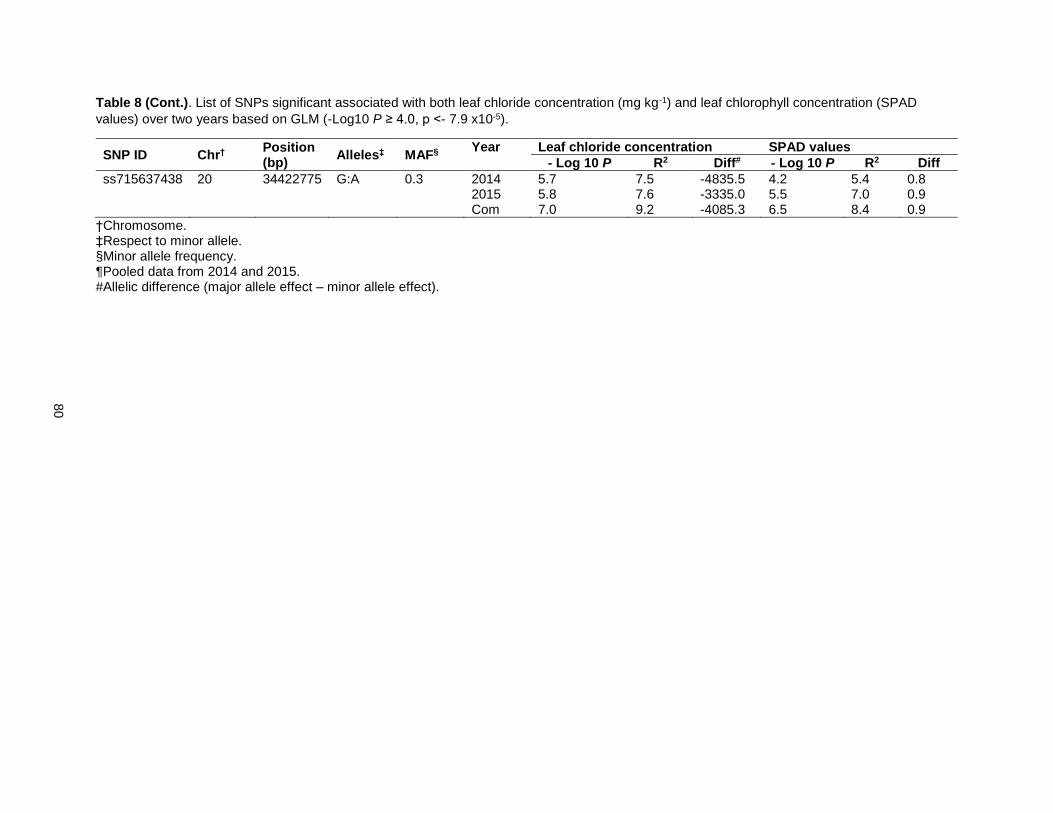
80
Table 8 (Cont.). List of SNPs significant associated with both leaf chloride concentration (mg kg-1) and leaf chlorophyll concentration (SPAD
values) over two years based on GLM (-Log10 P ≥ 4.0, p <- 7.9 x10⁻⁵).
SNP ID Chr† Position (bp)
Alleles‡ MAF§ Year Leaf chloride concentration SPAD values
- Log 10 P R2 Diff# - Log 10 P R2 Diff
ss715637438 20 34422775 G:A 0.3 2014 5.7 7.5 -4835.5 4.2 5.4 0.8 2015 5.8 7.6 -3335.0 5.5 7.0 0.9 Com 7.0 9.2 -4085.3 6.5 8.4 0.9
†Chromosome. ‡Respect to minor allele. §Minor allele frequency. ¶Pooled data from 2014 and 2015. #Allelic difference (major allele effect – minor allele effect).
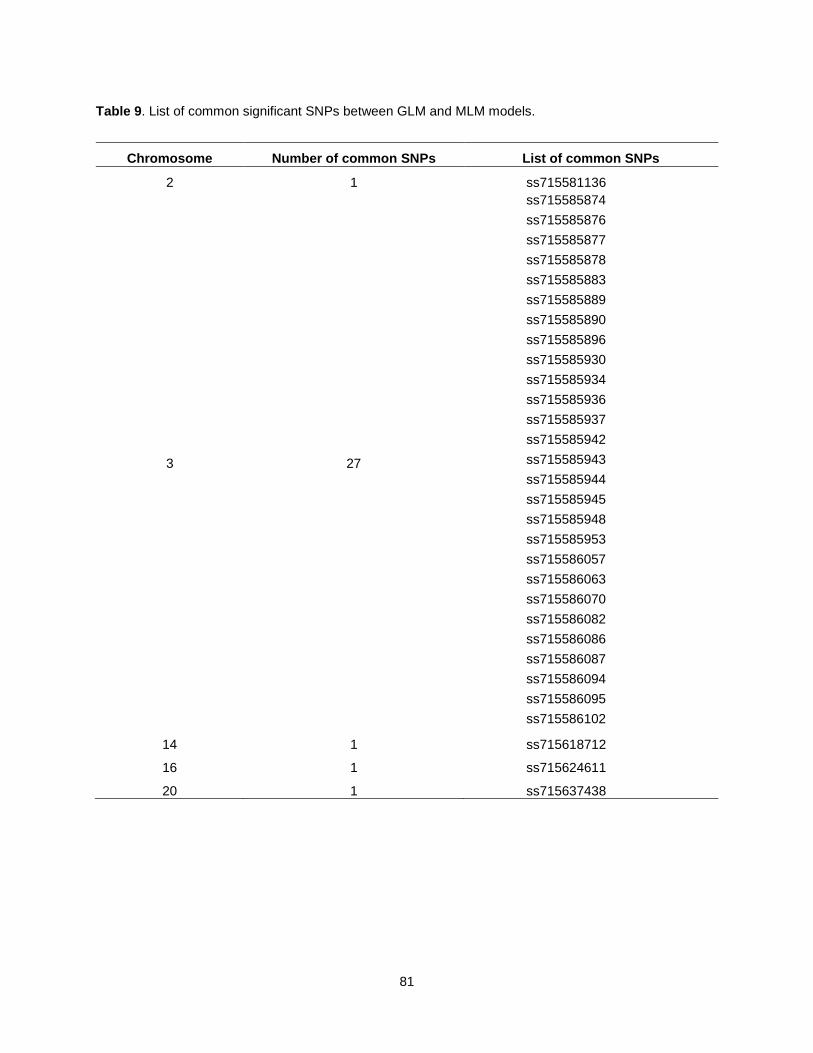
81
Table 9. List of common significant SNPs between GLM and MLM models.
Chromosome Number of common SNPs List of common SNPs
2 1 ss715581136
3 27
ss715585874
ss715585876
ss715585877
ss715585878
ss715585883
ss715585889
ss715585890
ss715585896
ss715585930
ss715585934
ss715585936
ss715585937
ss715585942
ss715585943
ss715585944
ss715585945
ss715585948
ss715585953
ss715586057
ss715586063
ss715586070
ss715586082
ss715586086
ss715586087
ss715586094
ss715586095
ss715586102
14 1 ss715618712
16 1 ss715624611
20 1 ss715637438
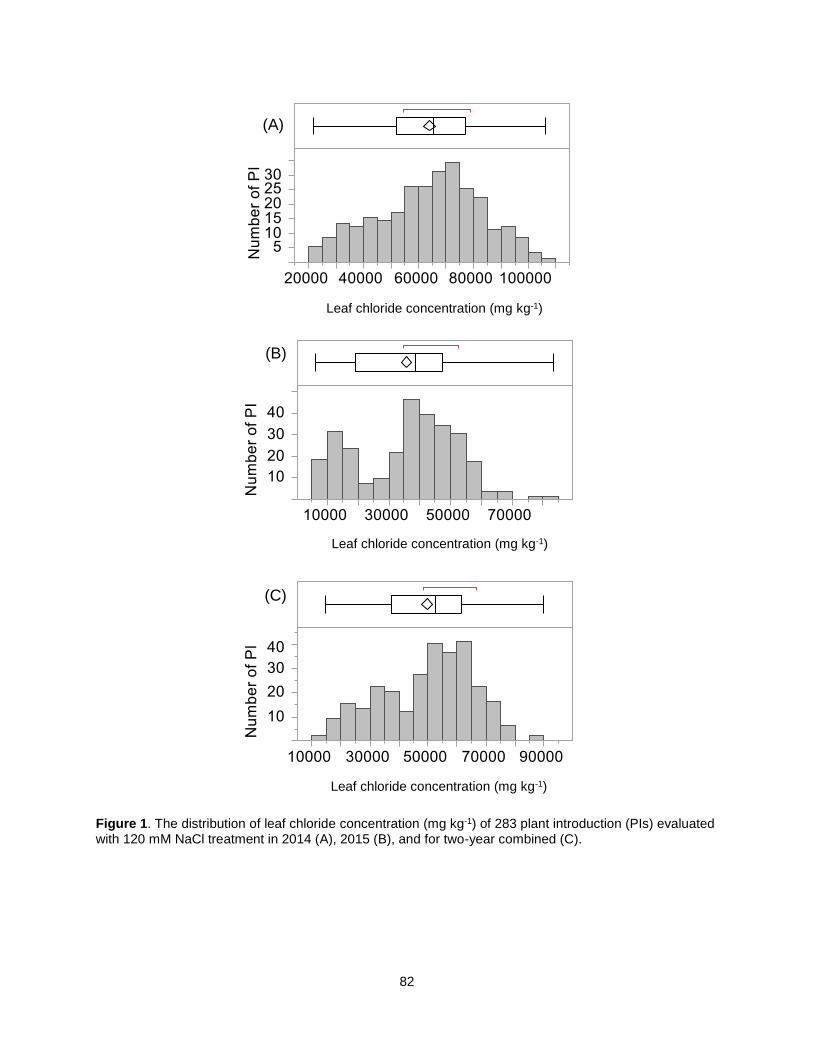
82
Figure 1. The distribution of leaf chloride concentration (mg kg-1) of 283 plant introduction (PIs) evaluated with 120 mM NaCl treatment in 2014 (A), 2015 (B), and for two-year combined (C).
(A)
(B)
(C)
Leaf chloride concentration (mg kg-1)
Leaf chloride concentration (mg kg-1)
Leaf chloride concentration (mg kg-1)

83
Figure 2. The distribution of leaf chlorophyll concentrations (SPAD values) of 283 plant introduction (PIs) evaluated with 120 mM NaCl treatment in 2014 (A), 2015 (B), and for two-year combined (C).
SPAD value
SPAD value
SPAD value
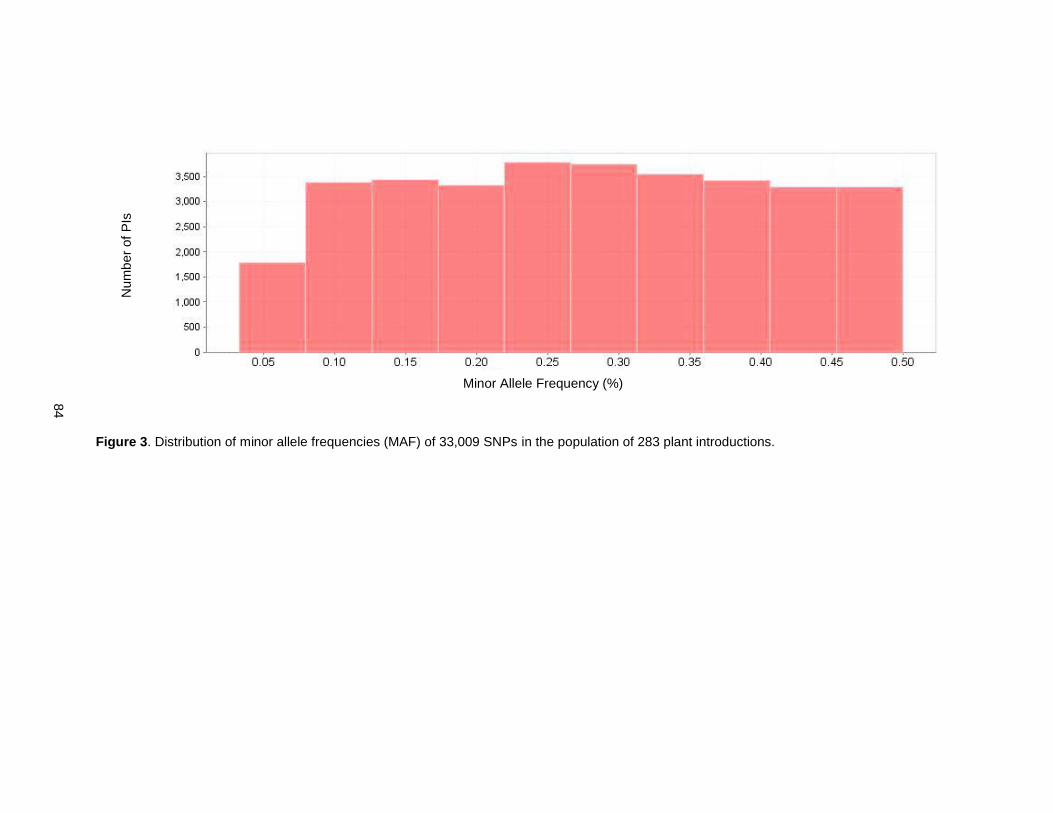
84
Figure 3. Distribution of minor allele frequencies (MAF) of 33,009 SNPs in the population of 283 plant introductions.
Minor Allele Frequency (%)
Num
ber
of
PIs

85
Figure 4. Population structure results using 3,301 SNPs. The rate of change in the log probability of data
(∆K) against the successive K values from the structure run.
∆K = mean(|L’’(K)|) / sd(L(K))
∆K
2 3 4 5 6 7 8 9
K
200
400
600
800
0
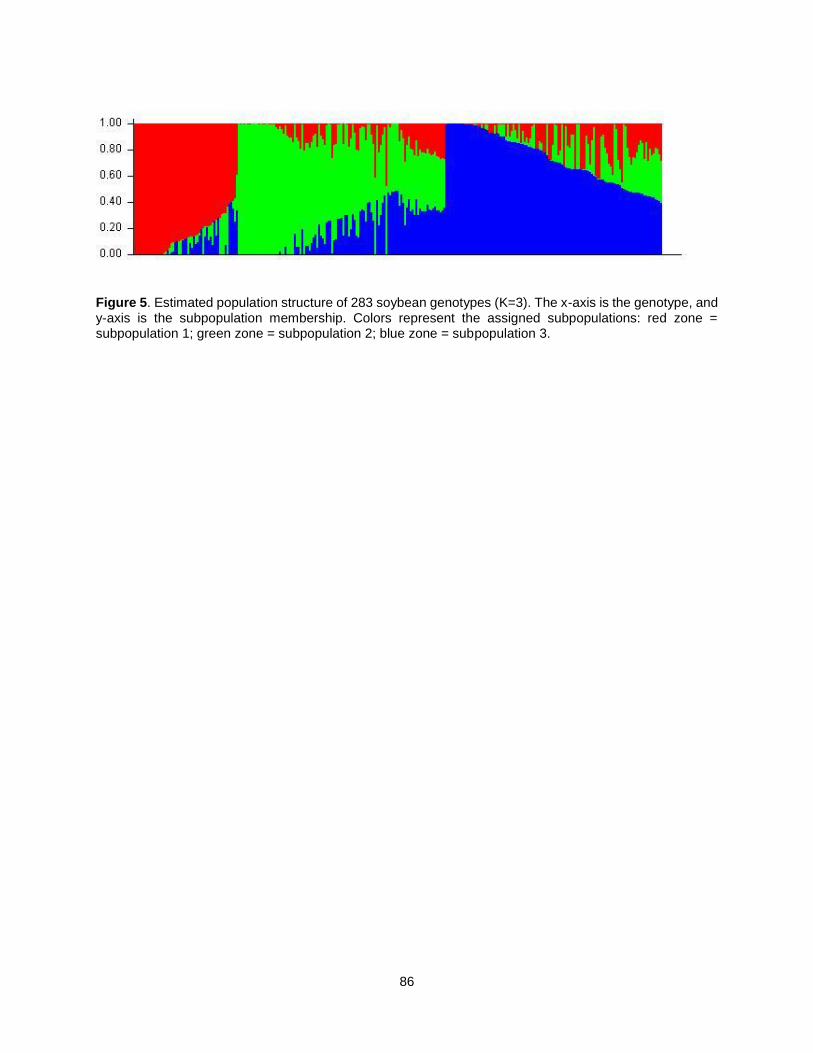
86
Figure 5. Estimated population structure of 283 soybean genotypes (K=3). The x-axis is the genotype, and y-axis is the subpopulation membership. Colors represent the assigned subpopulations: red zone = subpopulation 1; green zone = subpopulation 2; blue zone = subpopulation 3.
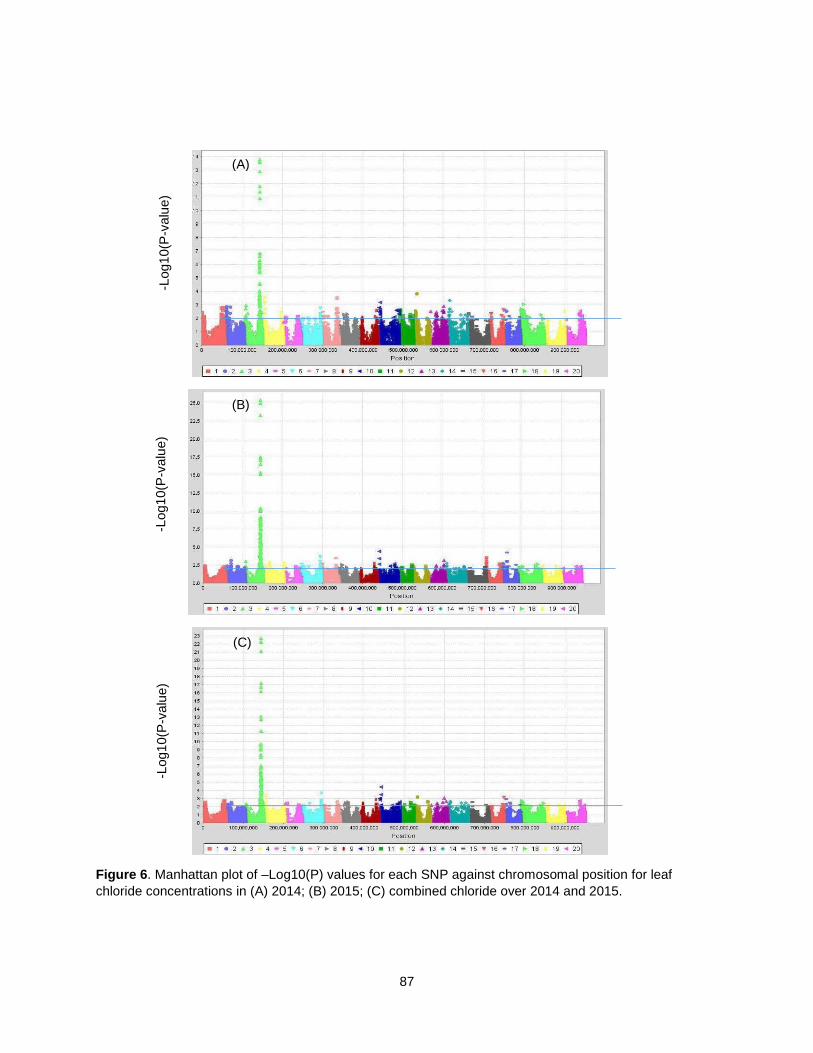
87
Figure 6. Manhattan plot of –Log10(P) values for each SNP against chromosomal position for leaf
chloride concentrations in (A) 2014; (B) 2015; (C) combined chloride over 2014 and 2015.
-Log1
0(P
-valu
e)
(A) -L
og1
0(P
-valu
e)
-Log1
0(P
-valu
e)
(C)
(B)

88
Figure 7. Manhattan plot of –Log10(P) values for each SNP against chromosomal position for leaf
chlorophyll concentrations (SPAD values) in (A) 2014; (B) 2015; (C) combined chlorophyll over 2014 and
2015.
-Log1
0(P
-valu
e)
-Log1
0(P
-valu
e)
-Log1
0(P
-valu
e)
(A)
(B)
(C)

89
Chapter 4. RNA Sequencing Analysis of Salt Tolerance in Soybean (Glycine max)
Ailan Zeng, Pengyin Chen*, Ken Korth, Jieqing Ping, Julie Thomas, Chengjun Wu, Subodh Srivastava,
Andy Pereira, Floyd Hancock, Kristofor Brye, and Jianxin Ma
Ailan Zeng, Pengyin Chen*, Chengjun Wu, Julie Thomas, Andy Pereira, and Kristofor Brye, Department
of Crop, Soil, and Environmental Sciences, University of Arkansas, Fayetteville, AR 72701; Subodh
Srivasta, Department of Genetics and Biochemistry, Clemson University, Clemson, SC 29634; Ken Korth,
Department of Plant Pathology, University of Arkansas, Fayetteville, AR 72701; Jieqing Ping and Jianxin
Ma, Department of Agronomy, Purdue University, West Lafayette, IN 47907; Floyd Hancock, Former
Monsanto Soybean Breeder, 2711 Blacks Ferry Road, Pocahontas, AR 72455.
* Author for correspondence
Keywords: RNA-sequencing, Salt tolerance, Soybean

90
ABSTRACT
Salt stress causes foliar chlorosis and scorch, plant stunting, and eventually yield reduction in
soybean. There are different response mechanisms, namely tolerance (excluder) and intolerance
(includer), among soybean germplasm. However, the genetic and physiological basis for salt tolerance
are complex and not yet clear. Based on the results from the screening of the RA-452 x Osage mapping
population, two F4:6 lines with extreme responses, most tolerant and most sensitive, were selected for a
time-course gene expression study in which the 250 mM NaCl treatment was initially imposed at the V1
stage and continued for 24 hours (h). Total RNA was isolated from the leaves harvested at 0, 6, 12, 24 h
after the initiation of salt treatment. RNA-Seq analysis was conducted to compare the salt-tolerant and the
salt-sensitive genotypes at each time point using the RNA-Seq analysis pipeline. A total of 2374, 998,
1746, and 630 differentially expressed genes (DEGs) between salt-tolerant and salt-sensitive lines, were
identified at 0, 6, 12, and 24 h, respectively. The expression patterns of 154 common DEGs among all the
time points were investigated, of which six common DEGs were upregulated and six common DEGs were
downregulated in the salt-tolerant line. Moreover, 13 common DEGs were dramatically expressed at all
the time points. Based on the Log2 (fold change) of expression level of the salt-tolerant line compared to
the salt-sensitive line and gene annotation, 10 genes were selected for quantitative reverse transcription
polymerase chain reaction (qRT-PCR). The gene expression profiles of six genes including
Glyma.02G228100, Glyma.03G031400, Glyma.04G180300, Glyma.04G180400, Glyma.05G204600, and
Glyma.17G173200 were verified by qRT-PCR. These six genes were considered to be the key candidate
genes involving in the salt-tolerance mechanism in the salt-tolerant soybean lines. Transformation
experiments should be conducted to further test their role in salt-tolerance in the soybean genotypes.
91
INTRODUCTION
Salt stress is a severe abiotic stress that is commonly encountered by soybean plants and can
cause significant reduction in soybean yield worldwide. In response to salt stress, soybean plants activate
a series of defense mechanisms that function to increase salt tolerance (Phang, et al., 2008). Several
categories of genes determining salt-tolerance including ion transporters (Guan et al., 2014; Qi et al.,
2014), transcription factors (Hao et al., 2011; Wang et al., 2015), auxin transporter (Chai et al., 2016),
glutathione S-transferase (Ji et al., 2010), late embryogenesis abundant protein (Lan et al., 2005),
calcineurin B-like protein (Li et al., 2012), and flavone synthase (Yan et al., 2014) have been reported so
far.
Aoki et al. (2005) identified 106 salt-inducible genes from soybean (Glycine max) using cDNA-
amplified fragment length polymorphism (AFLP) method. This series of genes were designated as G. max
transcript-derived fragments (GmTDFs). The gene expression of GmTDF-5 was induced under NaCl
treatment, and it was indicated that GmTDF-5 functioned in the soybean shoot against water-potential
changes. Tachi et al. (2009) characterized a novel soybean gene, Glycine max osmotin-like protein, b
isoform (GmOLPb) that protected the plant against salt stress. Gene expression of GmOLPb was highly
induced in soybean leaves under high salt stress. GmOLPb started to express at 2 h after initiation of salt
stress, and was highly induced between 18 - 72 h. Zhou et al. (2009) identified a putative Glycine max
Na+/H+ antiporter gene homolog (GmNHX2), which enhanced salt tolerance through regulating cellular ion
homeostasis. Expression of GmNHX2 was shown in all soybean plant tissue, and its expression was
induced by NaCl treatment. Zhou and Qiu (2010) characterized a putative Glycine max CLC-type chloride
channel gene (GmCLCnt) that was involved in Cl- homeostasis. The expression of GmCLCnt was induced
by NaCl treatment in all tissues of soybean. Zhou et al. (2010) characterized a ubiquitin-conjugating
enzyme gene (GmUBC2) in soybean, where the expression of GmUBC2 was induced by salt stress, and
GmUBC2 was involved in the regulation of ion homeostasis and oxidative stress. Ali et al. (2012)
compared salt-tolerant Glycine soja with salt-sensitive Glycine max for gene expression in the presence
and absence of salt stress using Tag sequencing. A total of 490 salt-responsive genes were identified
with greater gene expression level in tolerant plants. Translation-related genes exhibited greater
expression level in tolerant plants under salinity stress. Gene ontology (GO) enrichment analysis and

92
pathway function analysis indicated that soybean responded to salt stress through abscisic acid (ABA)
biosynthesis.
However, array-based technologies are constrained by the knowledge of gene sequence,
whereas RNA sequencing provides gene expression information independent of genomic sequence
knowledge. Moreover, RNA sequencing has greater sensitivity and greater range of gene expression than
array-based technology (Mortazavi et al., 2008). A total of 8077 differentially expressed genes were
identified in the roots of soybean cv. William 82 at the V1 (i.e. one set of unfolded trifoliate leaves) stage
at at least one of the three time points (1, 6, 12 h) under 100mM NaCl using whole-genome RNA-Seq
analysis. A total of 16 homeodomain leucine zipper (HD-ZIP) homologous genes, either upregulated or
downregulated by salt stress, were identified. The coding region of a single candidate gene,
Glyma03g32900.1 (i.e. salt tolerance-associated gene on chromosome 3) were also investigated using
RNA-Seq analysis (Guan et al., 2014). Glyma03g32900.1 cDNA from salt-tolerant variety “Tiefeng 8” had
a longer open reading frame (ORF) than that from the salt-sensitive variety 85-140 (Guan et al., 2014).
Moreover, whole genome sequencing analysis of wild soybean germplasm W05 indicated that a novel
gene Glysoja01g005509, GmCHX1 (G. max cation H+ exchangers) conferred the salt tolerance in W05
(Qi et al., 2014). In our study, two sister F4:6 lines, one salt-tolerant line (Cl- excluder) and one salt-
sensitive line (Cl- includer) were used as the plant materials. The plants were subjected to 250 mM NaCl
treatment for 0, 6, 12, and 24 h at V1 stage, respectively. RNA-Seq data was generated from each time
point. Differentially expressed genes (DEGs) were obtained by comparing the expression levels of genes
between salt-tolerant and salt-sensitive lines. The objectives of this study were to identify the DEGs
between salt-tolerant and salt-sensitive lines and to annotate the functions for DEGs. DEGs were
expected to be detected between salt-tolerant and salt-sensitive lines, and salt-stress responsive genes
were expected to be discovered.
MATERIALS AND METHODS
Plant Materials
According to the results of evaluation of salt tolerance in the greenhouse in 2013 (Chapter 2), one
extreme salt-tolerant F4:6 line and one extreme salt-sensitive F4:6 line were selected from quantitative trait
loci (QTL) mapping population RA-452 x Osage. The salt-sensitive line accumulated 75,604 mg kg-1 leaf
93
Cl- concentration while the salt-tolerant line had 26,626 mg kg-1 leaf Cl- concentration after exposure to 9
days of salt treatment with 120 mM NaCl.
Salt Treatment
A total of 9 seeds were individually planted in a 8.9-cm pot (Plasticflowerpots.net, Lake Worth, FI)
filled with 420 g dry sandy loam (Kibler, Arkansas) with a paper towel layer (8 cm × 8 cm) underneath, and
100 g of soil used to cover the seeds. Soil particle size analysis based on a 2-h hydrometer method
described by Arshad et al. (1996) showed that the sandy loam consisted of 66% sand, 8% clay and 26%
silt. Pots were placed in trays (45 cm x 65 cm x 2.5 cm, U.S.Plastic Corp., Lima, OH)) for salt treatment
(Fig. 1). The temperature was set at 25 °C with a 14h photoperiod in the greenhouse of Rosen Center at
University of Arkansas, Fayetteville, AR. At the VC (i.e. unifoliate leaves unfolded) stage, each pot was
thinned to three plants. At the V1 stage (i.e. the first trifoliate leaf expanded), plants were salt stressed by
adding 3.5 L of 250 mM NaCl solution to the trays. Trifoliate leaves in three pots were collected individually
as three replications at each of the four time points (0, 6, 12, and 24h) after initiation of salt stress. All leaf
samples were immediately frozen in liquid nitrogen, and stored at -80 °C for RNA extraction.
RNA Sequencing Analysis
Total RNA was isolated using the RNeasy Plant Mini Kit (Qiagen Inc., Valencia, CA) according to
the manufacturer’s instructions, followed by RNase-free DNase treatment. The quality of total RNA was
determined by Experion Automated Electrophoresis system (Bio-Rad Laboratories, Inc., Hercules, CA).
Total RNA samples were then sent to the Genomic Core Facility at Purdue University for sequencing.
PolyA+ libraries were constructed using Illumina’s TruSeq Stranded mRNA Library Prep Kit. Paired-end
reads were generated with the Illumina HiSeq 2500 system. The adaptor sequences, and the reads with
quality score less than 30 were trimmed using FASTX-Toolkit (http://hannonlab.cshl.edu/fastx_toolkit/).
Post-trimming reads were aligned to G. max reference genome (Phytozome v11.0,
https://phytozome.jgi.doe.gov/pz/portal.html) using TopHat software (Trapnell et al., 2009). One base pair
(bp) was set as the final mismatch threshold, 25 and 100,000 bp were set as the minimum and maximum
intron length, respectively, based on the current gene annotation. Only the uniquely mapped reads were
used to generate a transcriptome assembly for each sample using Cufflinks (Trapnell et al., 2012), the
resulting assemblies were then merged using the Cuffmerge (Trapnell et al., 2012). The uniquely mapped

94
reads and the merged assembly were provided to Cuffdiff (Trapnell et al., 2012) for calculating the
expression levels and testing the statistical significance of observed changes among samples. The
results generated by Cuffdiff analysis were visualized using R package CummeRbund (Trapnell et al.,
2012). A gene was considered to be differentially expressed (DE) when the adjusted P-value was less
than 0.05.
Quantitative Reverse Transcription Polymerase Chain Reaction (qRT-PCR)
The expression profiles of the significant differentially expressed genes were further investigated
using a Super Script III platinum SYBR Green One-Step qRT-PCR kit (Invitrogen, Inc., Carlsbad, CA)
according to manufacturer protocols. To normalize the gene expression, Actin (Glyma.02G091900.1) was
selected as a reference gene. The primers for the target genes and reference gene were designed using
PrimerQuest tool (Integrated DNA Technologies). PCR were carried out in an optical 96-well plate in BIO-
RAD CFX96 Touch™ Real-Time PCR Detection System. The cycling program was set as follows: 50 °C
for 3 min, 95 °C for 5 min, 40 cycles of 95 °C for 15 s and 60 °C for 30 s, and final 1 min at 40 °C. Three
biological replicates and two technical replicates were conducted for analysis. Cycle threshold (CT)
values from each reaction were generated, and the relative changes in gene expression were calculated
using the 2-ΔΔCT method (Livak and Schmittgen, 2001), where fold change in gene expression is log 2–
ΔΔCT, in which ΔCT = CT of target gene – CT of reference gene, and ΔΔCT = ΔCT of salt-tolerant
sample – ΔCT of salt-sensitive sample.
RESULTS
Numbers of Differentially Expressed Genes (DEGs) at Different Time Points
Twenty-four samples from two soybean lines with three biological replicates for each of the four
time points 0 (control), 6, 12, and 24 h under salt stress, were analyzed by RNA-Seq. The total number of
clean reads generated in the RNA-Seq experiment was 397.5 million, of which 354.6 million (89.2%) were
uniquely mapped to the soybean reference genome (i.e. G.max_275) (Table 1). The expression profile of
genes at 0 h was compared between the salt-tolerant and salt-sensitive line, and a total of 2,374
differentially expressed genes (DEGs) were identified between the salt-tolerant and salt-sensitive line
(Table 2 and Fig. 2). Similarly, a total of 998, 1,746, and 630 DEGs were identified between the salt-
tolerant line and salt-sensitive line at 6, 12, and 24 h, respectively (Table 2 and Fig. 2). The common
95
DEGs among different time points were also investigated using R package. A total of 452 common DEGs
were identified comparing between 0 and 6 h, 448 common DEGs between 0 and 12 h, and 334 common
DEGs between 0 and 24 h (Table 3 and Fig. 2). Cumulatively, a total of 154 common DEGs were
identified across all the time points including 0, 6, 12, and 24 h (Table 3 and Fig.2).
Expression Patterns of Differentially Expressed Genes under Salt Stress
Among the 154 common DEGs across all treatments, the Log2 (fold change) of the expression
level of the salt-tolerant to salt-sensitive line was compared among different time points. The genes were
considered to be upregulated if the Log2 (fold change) at 6, 12, 24 h were greater than that at 0 h; the
genes were considered to be downregulated if the Log2 (fold change) at 6, 12, 24 h were lower than that
at 0 h (Table 4). It was concluded that Glyma.02G228100, Glyma.05G204600, Glyma.07G035800,
Glyma.08G189600, Glyma.16G174300, and Glyma.19G055000 were upregulated in the salt-tolerant line
under 250 mM NaCl treatment (Table 4 and Fig. 3), while Glyma.03G031000, Glyma.03G219100,
Glyma.03G226000, Glyma.06G013600, Glyma.13G033400, and Glyma.13G042200 were downregulated
in the salt-tolerant line under 250 mM NaCl treatment (Table 4 and Figs. 4 and 5). In addition, between
the 154 common DEGs, 13 genes were dramatically expressed in either the salt-tolerant or salt-sensitive
lines, with the Log2 (fold change) of expression level of the salt-tolerant line to salt-sensitive line either
infinite (large) or negative infinite at all the time points (Table 5).
Comparison between the Non-differentially Expressed Genes and Differentially Expressed Genes
Overtime
In addition to the investigation on expression patterns of DEGs across all the time points, the non-
differentially expressed genes between the salt-tolerant and salt-sensitive line at 0 h were also compared
with DEGs between the salt-tolerant and salt-sensitive line at 6, 12, and 24 h, respectively. The gene,
Glyma.05G206800, which showed similar expression level between the salt-tolerant and salt-sensitive
line at 0 h, was significantly differentially expressed between the salt-tolerant and salt-sensitive line at 6 h,
with Log2 (fold change) of -8.74 (Table 6A). At 12 h, a total of 15 genes on Chromosomes (Chr.) 3, 4, 6,
12, 13, 15, 16, 17, and 20 were highly induced by salt stress in the salt-sensitive line, but not in the salt-
tolerant line, whereas two genes on Chr. 5 and 8 were highly induced by salt stress in the salt-tolerant

96
line, but not in the salt-sensitive line (Table 6B and Fig. 6). At 24 h, Glyma.14G203100 which had similar
gene expression level at 0 h between the salt-tolerant and salt-sensitive line, was downregulated in the
salt-tolerant line at 24 h (Table 6C). Likewise, Glyma.15G062700 was upregulated in the salt-tolerant line
at 24 h and Glyma.19G168500 was upregulated in the salt-sensitive line at 24 h (Table 6C).
Annotation of Differentially Expressed Genes (DEGs) under Salt Stress
Gene ontology (GO) enrichment analysis was performed on differentially expressed genes to
evaluate their potential functions. Annotations of GO terms were obtained from Phytozome and GO
biological process categories were utilized. These terms were manually classified into nine broad
functional groups, “response to stimulus”, “catalytic activity”, “binding”, “signal transduction”, “antioxidiant
activity”, “enzyme regulatory activity”, “transporter activity”, “transcription factor activity”, and “growth”
(Tables 7 and 8).
Verification of RNA-seq Results by qRT-PCR
Ten differentially expressed genes including Glyma.02G228100, Glyma.03G226000,
Glyma.03G031000, Glyma.03G031400, Glyma.04G180300, Glyma.04G180400, Glyma.05g204600,
Glyma.08G189600, Glyma.13G042200, and Glyma.17G173200 were selected based on the RNA-Seq
analysis. The gene expression profiles of 10 target genes were tested by qRT-PCR using the designed
primers (Table 9). The qRT-PCR results were in agreement with the RNA-Seq analysis for 6 out of 10
target genes (Table 10 and Fig. 8). In both qRT-PCR analysis and RNA-Seq analysis, Glyma.03G031400
and Glyma.17G173200 were negligible expressed in salt-tolerant line overtime while Glyma.04G180300
and Glyma.04G180400 were highly expressed in salt-tolerant line over time (Table 5 and 10). Although
the fold-changes of Glyma.02G228100 and Glyma.05G204600 in qRT-PCR were not as same as that in
RNA-Seq analysis (Fig. 8), both qRT-PCR analysis and RNA-Seq analysis yielded identical expression
trends.
DISCUSSION
In this study, two divergent F4:6 sister lines, extremely tolerant and extremely sensitive to salt
stress, were used as the experimental materials. The sister lines used in this study were able to filter the
noise of genetic background, which likely resulted in the smaller number of DEGs found between the salt-

97
tolerant and salt-sensitive line in this study compared to a previous study (Belamkar et al., 2014). The
salt-tolerance-related genes were identified using two strategies in this analysis. One strategy was to
investigate the significant DEGs between the salt-tolerant and salt-sensitive line at all time points and to
determine the expression pattern of the genes depending on the Log2 (fold change); the other strategy
was to use the non-differentially expressed genes between the salt-tolerant and salt-sensitive lines at 0 h
as control, and to compare the significant DEGs between the salt-tolerant and salt-sensitive lines at 6, 12,
and 24 h to the control.
By Cuffdiff analysis, a total of 154 DEGs were identified between the salt-tolerant and salt-
sensitive lines at all the time points. Subsequently, the upregulated genes, downregulated genes, and
consistently extremely expressed genes were defined based on the trend of Log2 (fold change) of
expression level of the salt-tolerant to salt-sensitive line over all the time points. The upregulated gene,
Glyma.02G228100, annotated as “glutamine-dependent asparagine synthase 1”, was highly induced by
salt stress in the salt-tolerant line in this study. Similarly, Glutamine-dependent asparagine synthase 1
was also dramatically induced in wheat (Triticum aestivum) under salt stress (Wang et al., 2005).
Glyma.05G204600, annotated as “osmotin 34”, was highly expressed in the salt-tolerant line after 24 h of
250 mM NaCl treatment (Table 4), which was in agreement with the gene expression results of the
Glycine max osmotin-like protein, b isoform (GmOLPb) that was shown to be highly induced in the leaves
of the soybean under high-salt stress between 18 - 72 h (Tachi et al., 2009). The gene
Glyma.08G189600, annotated as “lipoxygenase 1”, was also highly expressed in the salt-tolerant line
after 12 h of 250 mM NaCl treatment, which is supported by the report of soybean lipoxygenase 1
functioning as the prototype in enzyme-catalyzed hydrogen-tunneling reactions (Hu et al., 2014).
The gene on Chr. 3, Glyma.03G226000, was consistently downregulated in the salt-tolerant line
at 6, 12, and 24 h (Table 4) and was annotated as “glycosyl hydrolase superfamily protein” in this study,
which was in agreement with earlier observations that glycosyl hydrolase expression decreased in
soybean roots under flooding stress and glycoprotein synthesis was subsequently decreased (Mustafa
and Komatsu, 2014). Since glycoprotein provided the protection of root growth from osmotic stress
(Schaewen et al., 2008), we proposed that the salt-tolerant line protects the plant growth by decreasing
98
glycosyl hydrolase. The gene Glyma.13G042200, which was annotated as “2-oxoglutarate (2OG) and
Fe(II)-dependent oxygenase (OFE) superfamily protein”, was also downregulated in the salt-tolerant line
at 6, 12, 24 h. Wei et al. (2015) also reported that members of OFE family acted in stress response, and
Arabidopsis OFE mutant had strong salt tolerance.
In response to salt stress, the expression of Glyma.04G180400 in the salt-tolerant line was
increased about 13 times as much as in the salt-sensitive line at all the time points (Table 5).
Glyma.04G180400 identified in this study belonged to the BURP domain-containing protein, which was
reported to be significant induced in soybean under salt stress (Xu et al., 2010). The other gene on Chr.
4, Glyma.04G180300, belonging to “leucine-rich repeat protein kinase family protein”, was also highly
expressed in the salt-tolerant line at all the time points. A leucine-rich repeat receptor kinase was reported
to be involved in the regulation of adaptation of legume Medicago truncatula roots to salt stress (Lorenzo
et al., 2009). Glyma.17G173200, annotated as “dihydroflavonol 4-reductase”, was dramatically
downregulated in the salt-tolerant line (Table 5) in this study, which was similar to the expression pattern
of “Dihydroflavonol-4-reductase” detected between the salt-tolerant variety “Lee 68”, and the salt-
sensitive variety Jackson (Ma et al., 2013). The plant hormone abscisic acid (ABA)-dependent pathway
played a major role in plant response to salt stress, and cytochrome P450 proteins were shown to be
involved in the biosynthesis of ABA (Zhang et al., 2006). In this study, two genes on Chr. 3,
Glyma.03G031000 and Glyma.03G031400, which were annotated as “cytochrome P450”, were highly
expressed in the salt-sensitive line.
Overall, three genes induced by salt-stress were identified on Chr.3. However, the salt-tolerance
gene Glyma03g32900 reported by Guan et al. (2014) was not identified in this study. In addition,
Glyma03g32900 was located at 40,623,066 bp (Guan et al. (2014) while Glyma.03G226000,
Glyma.03G031000, and Glyma.03G031400 were located at 42,818,553, 3,483,334, and 3,522,165 bp,
respectively.
The non-significant differentially expressed genes between the salt-tolerant and salt-sensitive
lines at 0 h, were compared to the significant differentially expressed genes between the salt-tolerant and
salt-sensitive lines at other time points in order to find out the genes specifically induced at 6, 12, 24 h,

99
respectively (Table 6). More genes were identified to be salt-stress induced at 12 h compared to 6 h or 24
h. The differentially expressed genes in this analysis were mainly from the category “response to
stimulus” (Fig. 7).
In conclusion, two F4:6 sister lines, one salt-tolerant line and one salt-sensitive line, were used as
materials in the time-course (0, 6, 12, and 24 h) salt-treatment experiment. Three types of expression
patterns for salt-stress responsive genes, including “upregulated”, “down-regulated”, and “consistent”,
were identified using RNA-Seq analysis. Based on Log2 (fold change) and gene annotation, ten genes
were selected for qRT-PCR analysis. Six out of 10 genes including Glyma.02G228100,
Glyma.03G031400, Glyma.04G180300, Glyma.04G180400, Glyma.05G204600, and Glyma.17G173200
were verified by qRT-PCR. These six genes were considered to be the key genes involved in the salt-
tolerance mechanism in the salt-tolerant soybean line. In summary, this analysis of gene expression
patterns between salt tolerant and sensitive lines provides a number of candidate genes that might be
directly or indirectly involved in the tolerance trait. These genes can be confirmed by further genetic
analysis and transformation experiments to test their role in salt tolerance in the soybean genotypes.
Acknowledgements
This work was supported by Arkansas Soybean Promotion Board and United Soybean Board.

100
References
Ali, Z., D.Y. Zhang, Z.L. Xu, L. Xu, J.X. Yi, X.L. He, Y.H. Huang, X.Q. Liu, A.A. Khan, R.M. Trethowan, and H.X. Ma. 2012. Uncovering the salt response of soybean by unraveling its wild and cultivated functional genomes using tag sequencing. PLoS ONE 7: e48819.
Aoki, A., A. Kanegami, M. Mihara, T. Kojima, M. Shiraiwa, and H. Takahara. 2005. Molecular cloning and characterization of a novel soybean gene encoding a leucine-zipper-like protein induced to salt stress. Gene 356:135-145.
Arshad, M.A., B. Lowery, and B. Grossman. 1996. Physical tests for monitoring soil quality. Methods for assessing soil quality, Jan(methodsforasses):123-141.
Belamkar, V., N.T. Weeks, A.K. Bharti, A.D. Farmer, M.A. Graham, and S.B. Cannon. 2014. Comprehensive characterization and RNA-Seq profiling of the HD-Zip transcription factor family
in soybean (Glycine max) during dehydration and salt stress. BMC genomics 15:950-974.
Chai, C.L., Y.Q. Wang, B. Valliyodan, and H. Nguyen. 2016. Comprehensive analysis of the soybean (Glycine max) GmLAX auxin transporter gene family. Front Plant Sci. 7:282-294.
Guan, R., Y. Qu, Y. Guo, L. Yu, Y. Liu, J. Jiang, J. Chen, Y. Ren, G. Liu, L. Tian, and L. Jin. 2014. Salinity tolerance in soybean is modulated by natural variation in GmSALT3. Plant J. 80:937-950.
Hao, Y.J., W. Wei, Q.X. Song, H.W. Chen, Y.Q. Zhang, F. Wang, H.F. Zou, G. Lei, A.G. Tian, W.K. Zhang, B. Ma, J.S. Zhang, S.Y. Chen. 2011. Soybean NAC transcription factors promote abiotic stress tolerance and lateral root formation in transgenic plants. Plant J. 68:302-313.
Hu, S., S.C. Sharma, A.D. Scouras, A.V. Soudackov, C.A.M. Carr, S. Hammes-Schiffer, T. Alber, and J.P. Klinman. 2014. Extremely elevated room-temperature kinetic isotope effects quantify the critical
role of barrier width in enzymatic C–H activation. J. Am. Chem. Soc. 136:8157-8160.
Ji, W., Y.M. Zhu, Y. Li, L.A. Yang, X.W. Zhao, H. Cai, and X. Bai. 2010. Over-expression of a glutathione S-transferase gene, GsGST, from wild soybean (Glycine soja) enhances drought and salt tolerance in transgenic tobacco. Biotechnol. Lett. 32:1173-1179.
Lan, Y., D. Cai, and Y.Z. Zheng. 2005. Expression in Escherichia coli of three different soybean late embryogenesis abundant (LEA) genes to investigate enhanced stress tolerance. J. Integr. Plant Biol. 47:613-621.
Lorenzo, L.D., F. Merchan, P. Laporte, R. Thompson, J. Clarke, C. Sousa, and M. Crespi. 2009. A novel plant leucine-rice repeat receptor kinase regulates the response of Medicago truncatula roots to salt stress. Plant Cell 21:668-680.
Li, Z.Y., Z.S. Xu, G.Y. He, G.X. Yang, M. Chen, L.C. Li, and Y.Z. Ma. 2012. Overexpression of soybean GmCBL1 enhances abiotic stress tolerance and promotes hypocotyl elongation in Arabidopsis. Biochem. Biophys. Res. Commun. 427:731-736.
Livak, K.J. and T.D. Schmittgen. 2001. Analysis of relative gene expression data using real-time quantitative PCR and the 2− ΔΔCT method. Methods 25:402-408.
Ma, H.Y., L.R. Song, Z.G. Huang, Y. Yang, S. Wang, Z. Wang, J.H. Tong, W.H. Gu, H. Ma, and L.T. Xiao. 2014. Comparative proteomic analysis reveals molecular mechanism of seedling roots of different salt tolerant soybean genotypes in response to salinity stress. EuPA Open Proteom. 4:40-57.
Mortazavi, A., B.A. Williams, K. McCue, L. Schaeffer, and B. Wold. 2008. Mapping and quantifying mammalian transcriptomes by RNA-Seq. Nat. Methods 5:621-628.
Mustafa, G., and S. Komatsu. 2014. Quantitative proteomics reveals the effect of protein glycosylation in soybean root under flooding stress. Front. Plant Sci. 5:627-640.

101
Phang, T.H., G. Shao, and H.M. Lam. 2008. Salt tolerance in soybean. J. Integr. Plant Biol. 50:1196-1212.
Qi, X., M.W. Li, M. Xie, X. Liu, M. Ni, G. Shao, C. Song, A.K.Y. Yim, Y. Tao, F.L. Wong, and S. Isobe. 2014. Identification of a novel salt tolerance gene in wild soybean by whole-genome sequencing. Nat. Commun. 5:4340-4350.
Schaewen, A.V., J. Frank, and H. Koiwa. 2008. Role of complex N-glycans in plant stress response. Plant Signal Behave. 3:871-873.
Tachi, H., K. Fukuda-Yamada, T. Kojima, M. Shiraiwa, and H. Takahara. 2009. Molecular characterization of a novel soybean gene encoding a neutral PR-5 protein induced by high-salt stress. Plant Physiol. and Bioch. 47:73-79.
Trapnell, C., L. Pachter, and S.L. Salzberg. 2009. TopHat: discovering splice junctions with RNA-Seq. Bioinformatics 25:1105-1111.
Trapnell, C., A. Roberts, L. Goff, G. Pertea, D. Kim, D.R. Kelley, H. Pimentel, S.L. Salzberg, J.L. Rinn, and L. Pachter. 2012. Differential gene and transcript expression analysis of RNA-seq experiments with Tophat and Cufflinks. Nat. Protoc. 7:562-578.
Wang, F.F., H.W. Chen, Q.T. Li, W. Wei, W. Li, W.K. Zhang, B. Ma, Y.D. Bi, Y.C. Lai, X.L. Liu, W. Q. Man, J.S. Zhang, and S.Y. Chen. 2015. GmWRKY27 interacts with GmMYB174 to reduce expression of GmNAC29 for stress tolerance in soybean plants. Plant J. 83:224-236.
Wang, H.B., D.C. Liu, J.Z. Sun, and A. Zhang. 2005. Asparagine synthetase gene TaASN1 from wheat is up-regulated by salt stress, osmotic stress and ABA. J. Plant Physi. 162:81-89.
Wei, W., Y.Q. Zhang, J.J. Tao, H.W. Chen, Q.T. Li, W.K. Zhang, B. Ma., Q. Lin, J.S. Zhang, and S.Y. Chen. 2015. The Alfin-like homeodomain finger protein AL5 suppresses multiple negative factors to confer abiotic stress tolerance in Arabidopsis. Plant J. 81:871-883.
Xu, H.L., Y.X. Li, Y.M. Yan, K. Wang, Y. Gao, and Y. Hu. 2010. Genome-scale identification of Soybean BURP domain-containing genes and their expression under stress treatments. BMC Plant Bio. 10:197-212.
Yan, J.H., B.A. Wang, Y.N. Jiang, L.J. Cheng, and T.L. Wu. 2014. GmFNSII-controlled soybean flavone metabolism responds to abiotic stresses and regulates plant salt tolerance. Plant Cell Physiol. 55:74-86.
Zhang, J.H., W.S. Jia, J.C. Yang, and A.M. Ismail. 2006. Roles of ABA in integrating plant responses to drought and salt stresss. Field Crop Res. 97:111-119.
Zhou, G.A., R.X. Guan, Y.H. Li, R.Z. Chang, and L.J. Qiu. 2009. Molecular characterization of GmNHX2, a Na/H antiporter gene homolog from soybean, and its heterologous expression to improve salt tolerance in Arabidopsis. Science in China Press 54:3536-3545.
Zhou, G.A., and L.J. Qiu. 2010. Identification and functional analysis on abiotic stress response of soybean Cl- channel gene GmCLCnt. Agr. Sci. in China 9:199-206.
Zhou, G.A., R.Z. Chang, and L.J. Qiu. 2010. Overexpression of soybean ubiquitin-conjugating enzyme gene GmUBC2 confers enhanced drought and salt tolerance through modulating abiotic stress-responsive gene expression in Arabidopsis. Plant Mol. Biol. 72:357-367.

102
Table 1. Statistics of paired-end reads for soybean lines in the RNA-Seq experiments.
Time point (h) Lines
Replicate Clean reads† Uniquely mapped reads‡ % of uniquely mapped reads§
0 Salt-sensitive line
1 15,406,692 13,866,023 90.0
2 16,857,895 15,188,963 90.1
3 18,020,070 16,200,043 89.9
Salt-tolerant line
1 15,716,929 14,145,236 90.0
2 17,917,764 16,108,070 89.9
3 16,876,148 15,121,029 89.6
6 Salt-sensitive line
1 15,872,081 14,253,129 89.8
2 16,489,421 14,494,201 87.9
3 13,803,816 12,105,947 87.7
Salt-tolerant line 1 16,611,910 14,651,705 88.2
2 15,908,546 14,031,338 88.2
3 16,932,897 15,087,211 89.1

103
Table 1 (Cont.). Statistics of paired-end reads for soybean lines in the RNA-Seq experiments.
Time point (h) Lines
Replicate Clean reads† Uniquely mapped reads‡ % of uniquely mapped reads §
12 Salt-sensitive line
1 16,209,815 14,410,526 88.9
2 17,046,465 15,205,447 89.2
3 17,002,520 15,132,243 89.0
Salt-tolerant line
1 17,093,188 15,093,285 88.3
2 17,252,510 15,389,239 89.2
3 16,939,052 15,126,573 89.3
24 Salt-sensitive line
1 16,688,846 14,869,762 89.1
2 16,231,698 14,494,906 89.3
3 15,707,886 14,058,558 89.5
Salt-tolerant line 1 16,299,642 14,604,479 89.6
2 17,469,138 15,634,879 89.5
3 17,158,782 15,357,110 89.5
Total 397,513,711 354,629,902 89.2
Average 16,563,071 14,776,246 89.2
†Reads with a quality score less than 30 were excluded. ‡Reads uniquely mapped to G. max genome assembly (v2.0) using Tophat 2.0. §Percentage of uniquely mapped reads out of clean reads.

104
Table 2. Differentially expressed genes (DEGs) between salt-tolerant and salt-sensitive lines at each time point.
Time point (h) Up-regulated DEGs Down-regulated DEGs Total
0 1,131 1,243 2,374 6 548 450 998 12 577 1,169 1,746 24 265 365 630

105
Table 3. Common differentially expressed genes (DEGs) among time points.
Time points (h) Number of common DEGs
0, 6 452 0, 12 448 6, 24 299 6, 12 461 12, 24 318 0, 24 334 0, 6, 12 239 0, 6, 24 212 0, 12, 24 182 6, 12, 24 207 0, 6, 12, 24 154

106
Table 4. Differentially expressed (up/down-regulated) salt-stress responsive genes indicated by Log2 (fold change) (Log2 FC) in expression level of salt-tolerant to salt-sensitive lines at 0, 6, 12, 24 h, respectively.
Gene Log2 FC_0h Log2FC_6h Log2FC_12h Log2FC_24h Expression patterns
Glyma.02G228100 -2.59 -1.26 -1.21 2.15 upregulated Glyma.05G204600 1.48 1.78 1.77 3.57 upregulated Glyma.07G035800 1.86 1.87 2.31 3.02 upregulated Glyma.08G189600 2.62 3.50 5.18 2.86 upregulated Glyma.16G174300 0.64 2.07 2.04 2.54 upregulated Glyma.19G055000 1.66 3.08 2.54 3.23 upregulated Glyma.03G031000 3.94 3.48 1.57 1.99 downregulated Glyma.03G219100 -0.58 -1.03 -1.87 -1.46 downregulated Glyma.03G226000 -0.56 -2.10 -2.29 -3.29 downregulated Glyma.06G013600 2.94 2.88 1.31 1.87 downregulated Glyma.13G033400 -1.77 -2.05 -2.86 -3.10 downregulated Glyma.13G042200 -2.28 -2.01 -4.92 -5.23 downregulated

107
Table 5. Consistently expressed salt-stress responsive genes indicated by Log2 (fold change) (Log2 FC) of expression level of salt-tolerant to salt-
sensitive lines at 0, 6, 12, 24 h, respectively.
Gene Log2 FC_0h Log2 FC_6h Log2 FC_12h Log2 FC_24h
Glyma.03G031400 - Inf - Inf - Inf - Inf Glyma.04G180300 Inf Inf Inf Inf Glyma.04G180400 12.26 13.20 12.64 11.42 Glyma.08G261500 Inf Inf Inf Inf Glyma.08G273000 Inf Inf Inf Inf Glyma.13G040000 - Inf - Inf - Inf - Inf Glyma.15G140700 - Inf - Inf - Inf - Inf Glyma.16G119900 - Inf - Inf - Inf - Inf Glyma.17G173200 - Inf - Inf - Inf - Inf Glyma.18G245400 - Inf - Inf - Inf - Inf Glyma.18G299000 Inf Inf Inf Inf Glyma.19G061800 - Inf - Inf - Inf - Inf Glyma.20G076400 Inf Inf Inf Inf

108
Table 6. Non-significant differentially expressed genes between salt-tolerant and salt-sensitive lines at 0 h and corresponding significant
differential expressed genes between salt-tolerant and salt-sensitive lines at other time points.
(A)
Gene Value1_0h Value2_0h Log2_FC_0h Value1_6h Value2_6h Log2_FC_6h
Glyma.05G206800 0.88 1.08 0.30 577.82 1.35 -8.74
(B)
Gene Value1_0h† Value2_0h‡ Log2_FC_0h Value1_12h Value2_12h Log2_FC_12h
Glyma.03G005800 2.29 1.61 -0.51 40.83 3.61 -3.5 Glyma.03G113200 1.37 1.46 0.09 169.88 14.31 -3.57 Glyma.03G157700 3.93 3.52 -0.16 55.51 10.41 -2.41 Glyma.04G054400 1.11 0.94 -0.25 18.95 1.4 -3.76 Glyma.04G208300 1.47 0.99 -0.57 26.77 2.92 -3.2 Glyma.05G036800 2.21 2.5 0.18 3.58 21.42 2.58 Glyma.06G157400 1.52 1.05 -0.53 42.78 2.24 -4.26 Glyma.06G202200 2.74 2.41 -0.18 13.07 1.07 -3.61 Glyma.08G201100 2.49 2.97 0.25 7.39 32.85 2.15 Glyma.12G116800 1.04 1.04 0.01 33.73 2.25 -3.91 Glyma.13G068800 0.6 0.98 0.71 45.83 1.03 -5.47 Glyma.13G279900 2.78 2.55 -0.12 66.3 10.42 -2.67 Glyma.15G256000 6.54 7.03 0.1 45.44 4.77 -3.25 Glyma.16G103900 3.44 4.1 0.25 23.42 4.9 -2.26 Glyma.17G044300 1.62 2.01 0.31 44.07 5.43 -3.02 Glyma.17G092800 2.34 1.84 -0.35 125.79 4.06 -4.95 Glyma.20G015900 1.44 1.41 -0.03 10.01 0.93 -3.42
(C)
Gene Value1_0h Value2_0h Log2_FC_0h Value1_24h Value2_24h Log2_FC_24h
Glyma.14G203100 9.28 10.00 0.11 8.92 0.83 -3.42 Glyma.15G062700 1.69 2.83 0.75 2.15 47.95 4.48 Glyma.19G168500 0.91 0.69 -0.41 11.27 1.30 -3.12
†Fragments per kilobase of transcript per million mapped reads in salt-sensitive line. ‡Fragments per kilobase of transcript per million mapped reads in salt-tolerant line.

109
Table 7. Gene annotations of differentially expressed genes (DEGs) between salt-tolerant and salt-sensitive lines detected at all the time points.
Gene Locus Arabidopsis homologous gene
Gene symbol Gene annotation GO group
Up regulated Glyma.02G228100 Chr02:41497138-
41503001 AT3G47340.1 ASN1, AT-ASN1,
DIN6 glutamine-dependent asparagine synthase 1
Catalytic activity
Glyma.05G204600 Chr05:38801527-
38802396 AT4G11650.1 ATOSM34, OSM34 osmotin 34 Response to salt
stress Glyma.07G035800 Chr07:2902993-
2904612 AT3G13950.1 NA NA NA
Glyma.08G189600 Chr08:15235196-15239971
AT1G55020.1 ATLOX1, LOX1 lipoxygenase 1 Antioxidiant activity
Glyma.16G174300 Chr16:33491254-33496282
AT2G34930.1 NA disease resistance family protein / LRR family protein
Signal transduction
Glyma.19G055000 Chr19:9202974-9207748
AT5G36930.2 NA Disease resistance protein (TIR-NBS-LRR class) family
Signal transduction
Down regulated Glyma.03G031000 Chr03:3483333-
3486055 AT4G31500.1 ATR4, CYP83B1,
RED1, RNT1, SUR2 cytochrome P450, family 83, subfamily B, polypeptide 1
Catalytic activity
Glyma.03G219100 Chr03:42265890-42275563
AT2G47430.1 CKI1 Signal transduction histidine kinase
Signal transduction
Glyma.03G226000 Chr03:42818552-42823054
AT5G66460.1 NA Glycosyl hydrolase superfamily protein
Catalytic activity
Glyma.06G013600 Chr06:1015646-1018243
AT5G46850.2 NA NA NA
Glyma.13G033400 Chr13:10549358-10553372
AT4G18250.1 NA receptor serine/threonine kinase, putative
Signal transduction
Glyma.13G042200 Chr13:13542394-13551520
AT2G44800.1 NA 2-oxoglutarate (2OG) and Fe(II)-dependent oxygenase superfamily protein
Antioxidiant activity
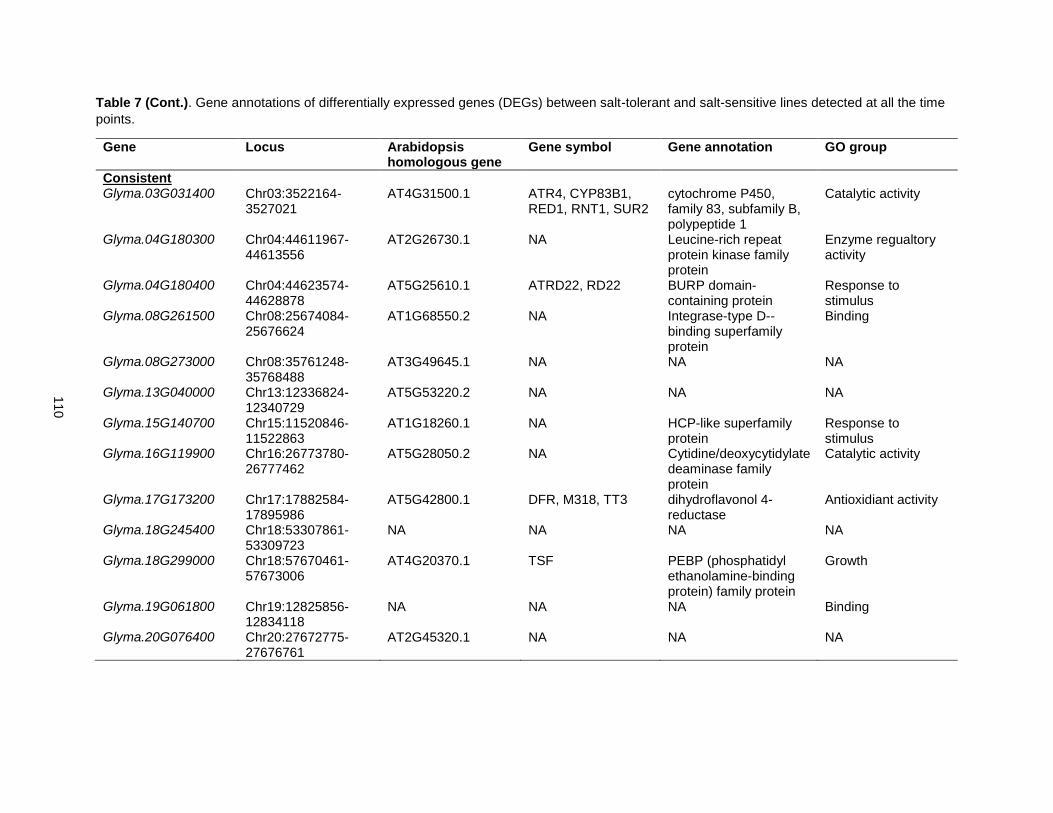
110
Table 7 (Cont.). Gene annotations of differentially expressed genes (DEGs) between salt-tolerant and salt-sensitive lines detected at all the time
points.
Gene Locus Arabidopsis homologous gene
Gene symbol Gene annotation GO group
Consistent Glyma.03G031400 Chr03:3522164-
3527021 AT4G31500.1 ATR4, CYP83B1,
RED1, RNT1, SUR2 cytochrome P450, family 83, subfamily B, polypeptide 1
Catalytic activity
Glyma.04G180300 Chr04:44611967-44613556
AT2G26730.1 NA Leucine-rich repeat protein kinase family protein
Enzyme regualtory activity
Glyma.04G180400 Chr04:44623574-44628878
AT5G25610.1 ATRD22, RD22 BURP domain-containing protein
Response to stimulus
Glyma.08G261500 Chr08:25674084-25676624
AT1G68550.2 NA Integrase-type D--binding superfamily protein
Binding
Glyma.08G273000 Chr08:35761248-35768488
AT3G49645.1 NA NA NA
Glyma.13G040000 Chr13:12336824-12340729
AT5G53220.2 NA NA NA
Glyma.15G140700 Chr15:11520846-11522863
AT1G18260.1 NA HCP-like superfamily protein
Response to stimulus
Glyma.16G119900 Chr16:26773780-26777462
AT5G28050.2 NA Cytidine/deoxycytidylate deaminase family protein
Catalytic activity
Glyma.17G173200 Chr17:17882584-17895986
AT5G42800.1 DFR, M318, TT3 dihydroflavonol 4-reductase
Antioxidiant activity
Glyma.18G245400 Chr18:53307861-53309723
NA NA NA NA
Glyma.18G299000 Chr18:57670461-57673006
AT4G20370.1 TSF PEBP (phosphatidyl ethanolamine-binding protein) family protein
Growth
Glyma.19G061800 Chr19:12825856-12834118
NA NA NA Binding
Glyma.20G076400 Chr20:27672775-27676761
AT2G45320.1 NA NA NA

111
Table 8. Gene annotations of differentially expressed genes (DEGs) between salt-tolerant and salt-sensitive lines at 6, 12, and 24 h, respectively,
compared to non-differentially expressed genes at 0 h.
Gene Locus Arabidopsis homologous gene
Gene symbol Gene annotation GO group
0h vs. 6h Glyma.05G206800 Chr05:38935441-
38939386 NA NA NA NA
0h vs. 12h Glyma.03G005800 Chr03:545101-
549977 AT1G33110.1 NA MATE efflux family protein Transporter activity
Glyma.03G113200 Chr03:32000184-32001852
AT3G51680.1 -D(P)-binding Rossmann-fold superfamily protein
Binding
Glyma.03G157700 Chr03:37314519-37317844
AT3G63380.1 NA ATPase E1-E2 type family protein / haloacid dehalogenase-like hydrolase family protein
Transporter activity
Glyma.04G054400 Chr04:4415292-4416170
AT5G12020.1 HSP17.6II 17.6 kDa class II heat shock protein
Response to stimulus
Glyma.04G208300 Chr04:48062885-48064803
AT1G01720.1 A-002, ATAF1 -C (No Apical Meristem) domain transcriptional regulator superfamily protein
Transcription factor activity
Glyma.05G036800 Chr05:3241817-3243016
AT4G20970.1 NA basic helix-loop-helix (bHLH) D--binding superfamily protein
Binding
Glyma.06G157400 Chr06:12937295-12939138
AT1G01720.1 A-002, ATAF1 -C (No Apical Meristem) domain transcriptional regulator superfamily protein
Transcription factor activity
Glyma.06G202200 Chr06:18712865-
18716868 AT1G74310.1 ATHSP101,
HOT1, HSP101 heat shock protein 101 Response to stimulus
Glyma.08G201100 Chr08:16266130-16268320
AT3G16360.2 AHP4 HPT phosphotransmitter 4 Enzyme regualtory activity
Glyma.12G116800 Chr12:11703332-11706380
AT4G28400.1 NA Protein phosphatase 2C family protein
Signal transduction
Glyma.13G068800 Chr13:16864170-16866998
AT4G31940.1 CYP82C4 cytochrome P450, family 82, subfamily C, polypeptide 4
Antioxidiant activity

112
Table 8 (Cont.). Gene annotations of differentially expressed genes (DEGs) between salt-tolerant and salt-sensitive lines at 6, 12, and 24 h,
respectively, compared to non-differentially expressed genes at 0 h.
Gene Locus Arabidopsis homologous gene
Gene symbol Gene annotation GO group
Glyma.13G279900 Chr13:38124291-38125955
AT3G15500.1 A-C055, AT-C3, -C055, -C3
-C domain containing protein 3
Binding
Glyma.15G256000 Chr15:48531278-48532198
AT2G32210.1 NA NA NA
Glyma.16G103900 Chr16:21014275-21018746
AT1G32100.1 ATPRR1, PRR1 pinoresinol reductase 1 Catalytic activity
Glyma.17G044300 Chr17:3285533-3295066
AT4G33150.2 LKR, LKR/SDH, SDH lysine-ketoglutarate reductase/saccharopine dehydrogenase bifunctional enzyme
Catalytic activity
Glyma.17G092800 Chr17:7253510-7255621
AT5G14920.1 NA Gibberellin-regulated family protein
Response to stimulus
Glyma.20G015900 Chr20:1444191-1445120
AT5G12020.1 HSP17.6II 17.6 kDa class II heat shock protein
Response to stimulus
0h vs. 24h Glyma.14G203100 Chr14:46803542-
46806680 NA NA NA NA
Glyma.15G062700 Chr15:4807822-4815112
AT2G14580.1 ATPRB1, PRB1 basic pathogenesis-related protein 1
Response to stimulus
Glyma.19G168500 Chr19:42928529-42933308
AT2G33310.2 IAA13 auxin-induced protein 13
Response to stimulus

113
Table 9. Primers used in the qRT-PCR analysis.
Gene ID Primers 5' to 3'
Glyma.02G228100 F ACCTTTGAGCAGGCAGTCAT Glyma.02G228100 R TTGGCCAAGTAGCGAGAAGT Glyma.03G226000 F GCTCGCATGTTACTTCAGCA Glyma.03G226000 R AACCAGTACGCGTTGAATCC Glyma.03G031000 F GCCACATCAGTTTGGGCTAT Glyma.03G031000 R TGGTAGGTGCAATCTCAACG Glyma.03G031400 F GCCACATCAGTTTGGGCTAT Glyma.03G031400 R TAGTGTGGCTGGTGGGTACA Glyma.04G180300 F GGCAGTGAAGAGGATCAAGG Glyma.04G180300 R GTGGCCACTTTGAGATCCAT Glyma.04G180400 F CATCTCACCCTTCCTCCAAA Glyma.04G180400 R AGGCAACGAAACTCCATAGC Glyma.05G204600 F AACGTGCCCATGGACTTTAG Glyma.05G204600 R TGAAGACAGTGCAAGGGTTG Glyma.08G189600 F ATCCTTAACCGGCCAACTCT Glyma.08G189600 R GGGCATCACTCTTCCCTGTA Glyma.13G042200 F GGAGTGGAGGTTCTTCATGC Glyma.13G042200 R GGAGCTGGTGCCATACCTTA Glyma.17G173200 F AGGTGAAGCATTTGGTGGAG Glyma.17G173200 R CACATGGAAAACACCAGTGC

114
Table 10. Log2 (fold change) (Log2 FC) of expression level of salt-tolerant to salt-sensitive lines at 0, 6, 12, and 24 h obtained from qRT-PCR analysis.
Gene Log2 FC_0h Log2 FC_6h Log2 FC_12h Log2 FC_24h
Glyma.03G031400 0.03 0.02 0.12 0.01 Glyma.04G180300 149.48 127.44 376.14 368.71 Glyma.04G180400 10.07 67.47 9.33 19.71 Glyma.17G173200 0.00 0.01 0.01 0.01

115
Figure 1. Soybean lines exposing to 250 mM NaCl solution for 0, 6, 12, and 24 h, respectively.

116
Figure 2. Venn diagram showing overlapped differential expressed genes (DEGs) among different time
points (0, 6, 12 and 24 h after the initiation of salt treatment).

117
Figure 3. Upregulated differentially expressed genes at 6, 12, and 24 h compared to 0 h, indicated by Log2 (fold change) of expression level of
salt-tolerant to salt-sensitive lines.
24 h 12 h 6 h 0 h
Log2
(fo
ld c
ha
nge)
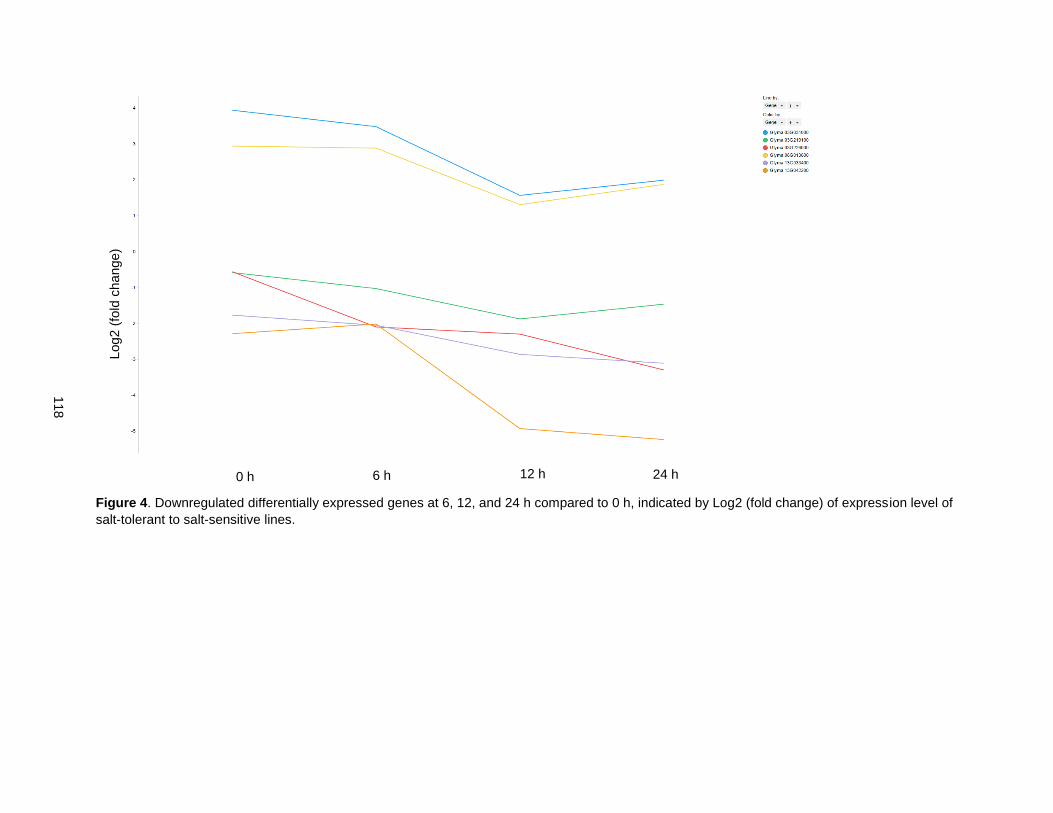
118
Figure 4. Downregulated differentially expressed genes at 6, 12, and 24 h compared to 0 h, indicated by Log2 (fold change) of expression level of
salt-tolerant to salt-sensitive lines.
Log2
(fo
ld c
ha
nge)
24 h 12 h 6 h 0 h
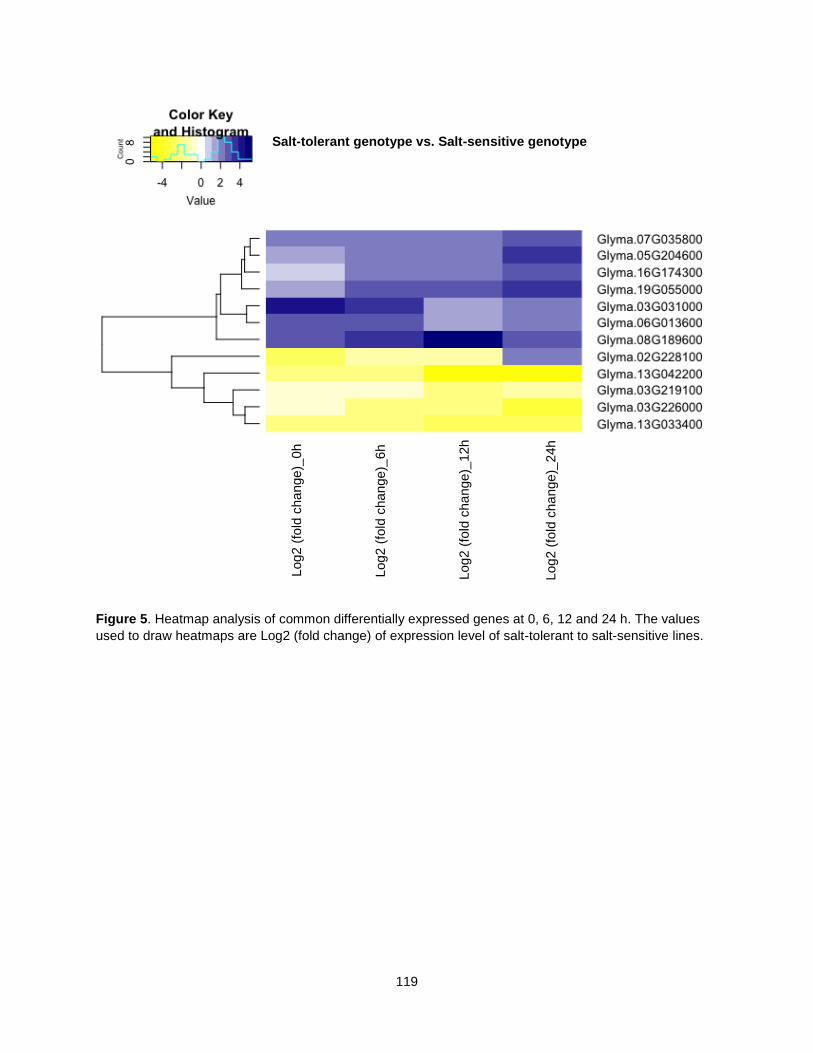
119
Figure 5. Heatmap analysis of common differentially expressed genes at 0, 6, 12 and 24 h. The values
used to draw heatmaps are Log2 (fold change) of expression level of salt-tolerant to salt-sensitive lines.
Salt-tolerant genotype vs. Salt-sensitive genotype
Log2
(fo
ld c
ha
nge)_
6h
Log2
(fo
ld c
ha
nge)_
12h
Log2
(fo
ld c
ha
nge)_
0h
Log2
(fo
ld c
ha
nge)_
24h

120
Figure 6. Heatmap analysis of differentially expressed genes at 12 h. The values used to draw heatmaps
are Log2 (fold change) of expression level of salt-tolerant to salt sensitive lines.
Salt-tolerant genotype vs. Salt-sensitive genotype
FP
KM
_0
h
FP
KM
_6
h
HH
h
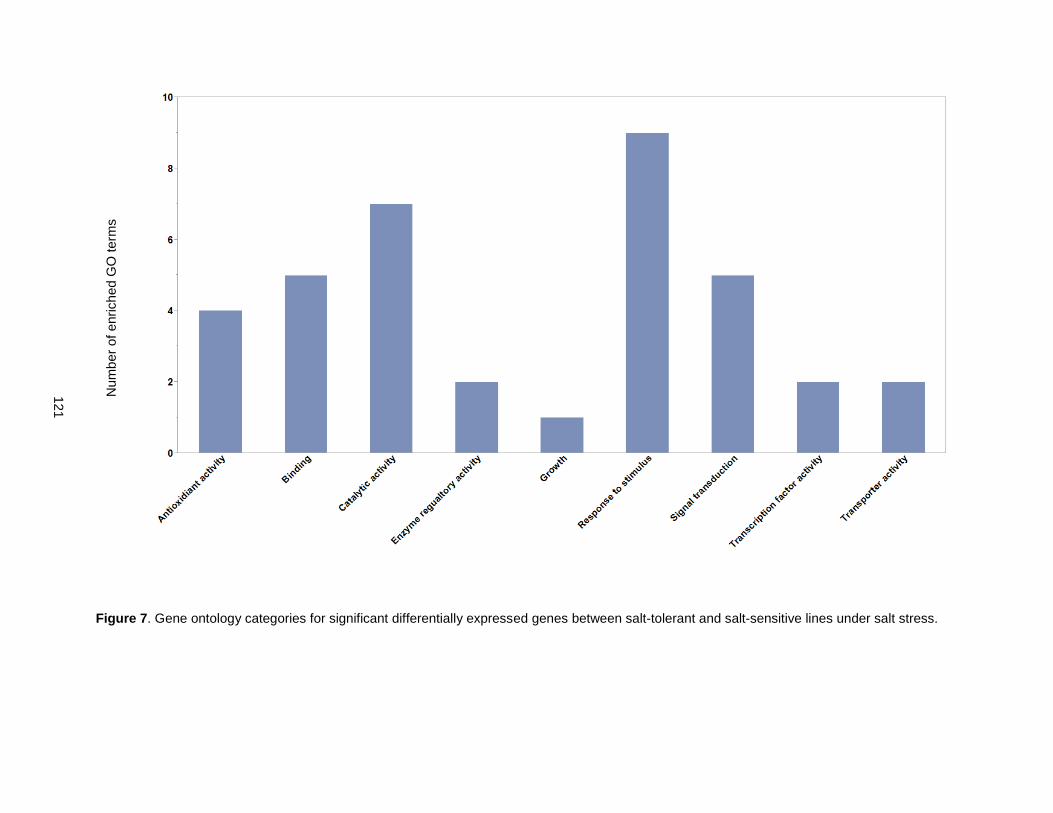
121
Figure 7. Gene ontology categories for significant differentially expressed genes between salt-tolerant and salt-sensitive lines under salt stress.
Num
ber
of
enrich
ed G
O term
s
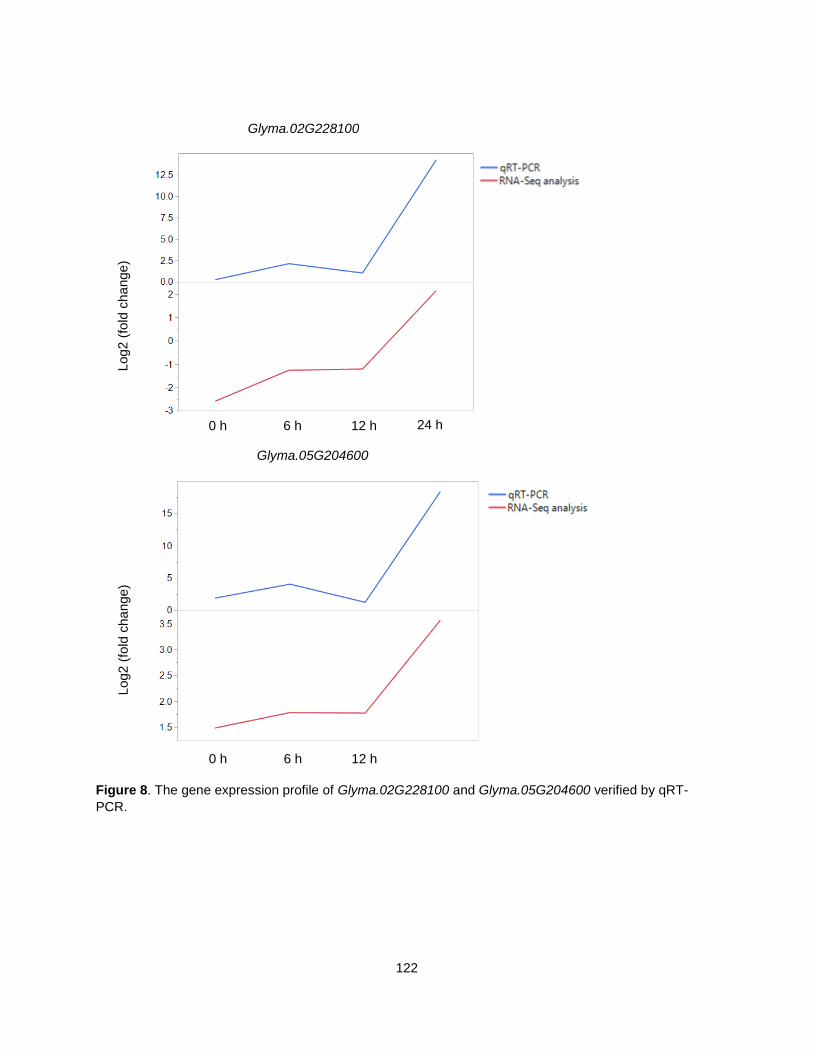
122
Figure 8. The gene expression profile of Glyma.02G228100 and Glyma.05G204600 verified by qRT-
PCR.
Glyma.02G228100
12 h 24 h 6 h 0 h
Log2
(fo
ld c
ha
nge)
24 h
Glyma.05G204600
Log2
(fo
ld c
ha
nge)
12 h 6 h 0 h
123
Overall Conclusion
In this study, salt tolerance in soybean was studied using three different methodologies including
bi-parental quantitative trait loci (QTL) mapping, genome-wide association study (GWAS), and RNA
sequencing (RNA-Seq) analysis. In addition to NaCl treatment, KCl treatment was included in the
phenotyping experiments in bi-parental QTL mapping study. Potassium chloride treatment led to greater
accumulation of chloride (Cl-) in the soybean leaves than NaCl treatment. Bi-parental QTL mapping
analysis mapped the major salt-tolerance QTL on Chr.3 between 39,491,355 and 41,605,831 bp, which
was in the same QTL region (39,551,106 - 40,761,388 bp) reported by Concibido et al. (2015). Moreover,
the salt-tolerance gene Glyma03g32900 (40,623,066 – 40,634,451) reported by Guan et al. (2014) and
Patil et al. (2016) was located within the QTL region identified by bi-parental QTL mapping in this study.
In addition, bi-parental QTL mapping identified one novel Cl- tolerance QTL on Chr. 13 in KCl treatment
and one novel Cl- tolerance QTL on Chr.15 in NaCl treatment.
The major salt-tolerance QTL on Chr. 3 identified by bi-parental QTL mapping was confirmed and
narrowed down in GWAS. Genome-wide association study also identified salt-tolerance QTL/SNPs on
Chr. 2, 7, 8, 10, 13, 14, 16, and 20. The significant SNP on Chr. 2 identified in GWAS was in proximity to
those detected by Huang (2013). The salt-tolerance QTL on Chr.7 (Chen et al., 2008) was confirmed and
narrowed down using GWAS in this study. However, the salt-tolerance QTL on Chr. 13 indicated by
GWAS was different from the QTL on Chr.13 indicated by bi-parental QTL mapping analysis; the QTL on
Chr.15 identified in the bi-parental QTL mapping was not confirmed by GWAS. The salt-tolerance QTL on
Chr. 18 (Chen et al., 2008) was also not confirmed in this study.
Two sister lines from bi-parental QTL mapping population were used for subsequent RNA-Seq
analysis. By RNA-Seq analysis, a total of 154 differentially expressed genes were identified between the
salt-tolerant and salt-sensitive lines at all the time points (0, 6, 12, and 24 h). The gene expression
profiles of six genes including Glyma.02G228100, Glyma.03G031400, Glyma.04G180300,
Glyma.04G180400, Glyma.05G204600, and Glyma.17G173200 were verified by qRT-PCR. However, the
gene Glyma.03G031400 which was located between 3,522,165 and 3,527,021 bp on Chr.3 was far away
from Glyma03g32900 which was located at between 40,623,066 and 40,634,451 bp (Guan et al. 2014).

124
Glyma.02G228100 which was located between 41,497,138 and 41,503,001 bp was around 2.8 Mb away
from the SNP marker ss715581136 (13,098,947 bp) identified by GWAS in this study.
In summary, the major QTL for salt tolerance on Chr.3 was confirmed in both bi-parental QTL
mapping analysis and GWAS. The SNP markers on Chr.3 which were significant associated with salt
tolerance in this study can be used for marker assisted selection (MAS) for breeding salt-tolerant soybean
genotypes. However, the novel QTL/SNPs identified in bi-parental QTL mapping and GWAS should be
tested across different genetic populations and different environments before being applied in MAS. The
QTLs/genes on Chr. 2 identified in either GWAS or RNA-Seq analysis were worthwhile for further
investigation. The gene function of these six novel genes should be confirmed by further transformation
experiments.

125
References
Chen, H., S. Cui, S. Fu, J. Gai, and D. Yu. 2008. Identification of quantitative trait loci associated with salt tolerance during seedling growth in soybean (Glycine max L.). Crop Pasture Sci. 59:1086-1091.
Concibido, V.C., I. Husic, N. Lafaver, B.L. Vallee, J. Narvel, J. Yates, and X.H. Ye. 2015. Molecular markers associated with chloride tolerant soybeans. U.S. Patent Application 14/424, 454, filed august 28, 2013.
Guan, R., Y. Qu, Y. Guo, L. Yu, Y. Liu, J. Jiang, J. Chen, Y. Ren, G. Liu, L. Tian, and L. Jin. 2014. Salinity tolerance in soybean is modulated by natural variation in GmSALT3. Plant J. 80:937-950.
Huang, L. 2013. Genome-wide association mapping identifies QTLs and candidate genes for salt tolerance in soybean. Thesis (M.S.), University of Arkansas.
Patil, G., T. Do, T.D. Vuong, B. Valliyodan, J.D. Lee, J. Chaudhary, J.G. Shannon, and H.T. Nguyen. 2016. Genomic-assisted haplotype analysis and the development of high-throughput SNP markers for salinity tolerance in soybean. Sci. Rep. 6: 19199-19211.