quantitative structure-activity relationship and molecular
TRANSCRIPT

Shehu, Uzairu and Sagagi. JOTCSA. 2018; 5(2): 569-584. RESEARCH ARTICLE
569
Quantitative Structure-Activity Relationship and Molecular Docking Study of Some Pyrrolones Antimalarial Agents against Plasmodium Falciparum
Zaharaddeen Shehu1*, Adamu Uzairu2 , Balarabe Sagagi3
1 Department of Science Laboratory Technology, Jigawa State Polytechnic Dutse, Jigawa State,
Nigeria 2 Department of Chemistry, Ahmadu Bello University Zaria, Kaduna State, Nigeria
3 Department of Chemistry, Kano University of Science and Technology Wudil, Kano State, Nigeria
Abstract: The growing increase in multidrug resistance malaria cases necessitates the need to
search for new cost-effective drugs. Quantitative Structure-Activity Relationship (QSAR) and
molecular docking studies were performed on a data set of forty-nine Pyrrolones antimalarial agents
against Plasmodium falciparum (P. falciparum). Forty-two molecules were used as a training set
and seven as the test set. The molecular descriptors were obtained by Density Functional Theory
(DFT) using Becke's three-parameter Lee-Yang-Parr hybrid functional (B3LYP) in combination with
the 6-31G* basis set. The QSAR model was built using Genetic Function Algorithm (GFA) method.
The model with the best statistical significance (N = 42, R2ext = 0.700, R2 = 0.933, R2a = 0.916,
Q2cv = 0.894, LOF = 0.417, Minimum experimental error for non-significant LOF (95%) = 0.250
was selected. The docking experiment was carried out using AutoDock Vina of PyRx and Discovery
Studio Visualizer. Docking analysis revealed that three of the studied compounds with binding
affinity values of -10.7 kcal/mol, -10.9 kcal/mol and -11.1 kcal/mol possess higher potency than
standard antimalarial drugs with binding affinity values of -8.8 kcal/mol, -9.5 kcal/mol and -9.0
kcal/mol. It is envisioned that the wealth of information provided by the QSAR and molecular
docking results in this study will offer important structural insights for further laboratory
experiments in the future design of novel and highly potent antimalarial from the pyrrolones.
Keywords: Antimalarial Agents, Density Functional Theory, Genetic Function Algorithm, Discovery
Studio Visualizer, Hydrophobic Interaction.
Submitted: October 26, 2017. Accepted: January 15, 2018.
Cite this: Shehu Z, Uzairu A, Sagagi B. Quantitative Structure-Activity Relationship and Molecular
Docking Study of Some Pyrrolones Antimalarial Agents against Plasmodium Falciparum. JOTCSA.
2018;5(2):569–84.
DOI: http://dx.doi.org/10.18596/jotcsa.346661.
*Corresponding author. E-mail: [email protected], [email protected] &
[email protected]. Tel.: +2348061547455.

Shehu, Uzairu and Sagagi. JOTCSA. 2018; 5(2): 569-584. RESEARCH ARTICLE
570
INTRODUCTION
Approximately half of the world's population is at risk of malaria. In 2015, there were roughly 212
million malaria cases and an estimated 429 000 malarial deaths. Increased prevention and control
measures have led to a 29% reduction in malaria mortality rates globally since 2010. Sub-Saharan
Africa continues to carry a disproportionately high share of the global malarial burden. In 2015, the
region was home to 90% of malaria cases and 92% of malaria deaths (1). Among the Plasmodium
species responsible for this disease, most commonly encountered and deadliest is Plasmodium
falciparum (P. falciparum) (2). In addition to its fatal effects, it has been reported to also have a
huge economic impact in countries where it is prevalent. Malaria disease have a huge tendency of
spreading to other regions of the world due to increasing globalization and global warming (3). The
increasing resistance of P. falciparum to clinically used chemotherapeutic agents coupled with the
unavailability of vaccines (3,4,5). Though many drugs are abounded for the treatment of this
disease, the increasing instances of resistance against antimalarial drugs in recent years are
becoming worrisome (6). This underscores the need to discover novel and highly potent drugs in
the drug development pipeline to combat the scourge of this disease. In the pursuant of this effort,
several molecular drug targets have been identified to develop new drug candidates. Very prominent
among these targets are cysteine proteases. This target protein plays an essential role in malaria
parasites; therefore, an obvious area of investigation is the inhibition of these enzymes to treat
malaria. Studies with cysteine protease inhibitors have revealed its role in hemoglobin hydrolysis.
The best characterized Plasmodium cysteine proteases are falcipains, which are papain family
enzymes. Falcipain-2 and falcipain-3 are major hemoglobinases of P. falciparum (7). In-silico
techniques such as QSAR and molecular docking have been proving valuable tools in recent years
for rapid discovery of novel drug candidates, e.g. the discovery of o-acetyl-L-serine sulfhydrylase
of Entamoeba histolytica inhibitors, acetylcholinesterase inhibitors, and antagonists
acetophenazine, fluphenazine and periciazine against human androgen receptor (8,9,10).
QSAR plays a crucial role in drug development as it analyzes the properties of the drug. It is
mathematical model that links the structural features of compounds (i.e. molecular descriptors) to
their quantity showing specific biological or chemical activity (11). It gives description of how
biological activity can vary as a function of molecular descriptors derived from the chemical structure
of a set of molecules using regression models. Hence, a model containing those calculated
descriptors can be used to predict responses of new compounds (12). The molecular descriptors for
the compounds are calculated and used to build QSAR Model (13).
Molecular docking, on the other hand, is a computational method used to determine the binding
compatibility of the active site residues to specific groups and to reveal the strength of interaction.

Shehu, Uzairu and Sagagi. JOTCSA. 2018; 5(2): 569-584. RESEARCH ARTICLE
571
The results of docking procedure are analyzed by a statistical scoring function which converts
interacting energy into numerical values known as the docking score. The 3D pose of the bound
ligand can be visualized using different visualizing tools like Pymol, Rasmol, and Discovery Studio,
which could help in the inference of the best fit of ligand. Predicting the mode of protein-ligand
interaction can assume the active site of the protein molecule and further help in protein annotation.
Moreover, molecular docking has major application in drug discovery and designing (14).
The main aim of the present study was to develop various QSAR models using Genetic Function
Algorithm (GFA) method for pyrrolones for their antimalarial activities and to relate antimalarial
activity to its physicochemical properties. Also to docked falcipain-2 protein (2GHU) with bound
ligands (pyrrolone analogues).
MATERIALS AND METHODS
Dataset of Experimental Falcipain-2 Inhibitors
A dataset of 49 pyrrolone compounds known as inhibitors of P. falciparum was obtained from
reference (3) and used in this study. The inhibitory bioactivities of the compounds expressed as half
maximal effective concentration (EC50) were converted to the logarithmic scale (pEC50 = Log EC50)
to reduce data dispersion and obtain a more linear response in the process of building the QSAR
model. EC50 is the concentration of the drug which induces a response halfway between the baseline
and maximum after a specified exposure time (15). It is a commonly used index for assessing the
drug’s potency. The IUPAC name and biological activities of antimalarial used in this study are
presented in Table 1 (See Supplementary Information).
Computational and Statistical Techniques
The molecular structure of each compound was optimized using the molecular modeling program,
Spartan’14 V1.1.0 on Speedstar computer system (4.00 GB RAM, 2.66 GHz processor) on Microsoft
windows 10 Ultimate using Density Functional Theory (DFT) level using Becke's three-parameter
Lee-Yang-Parr hybrid functional (B3LYP) in combination with the 6-31G* basis set. Our choice of
B3LYP/6-311G* basis set is anchored on the fact that it gives a far more accurate result.
Optimization of the molecules is necessary to get the lowest energy geometries (most stable
geometries). The molecular descriptors of the optimized compounds were calculated using the
Spartan’14 V.1.1.0 quantum chemistry package and paDEL descriptor toolkit. The data sets of the
molecules were split into the training set (42 molecules) for model development and test set (7
molecules) for external validation of the models using Euclidian Distance Based model and the
distance between cluster was set at 5. Subsequently, the QSAR models were built by means of
Genetic Function Approximation (GFA) techniques embedded in Material Studio, a modeling and

Shehu, Uzairu and Sagagi. JOTCSA. 2018; 5(2): 569-584. RESEARCH ARTICLE
572
simulation software using the experimentally obtained biological activities as the dependent variable
the computed molecular descriptors as independent variables. Five QSAR models were generated
but the best set was selected based on the model with the lowest Lack of Fit (LOF) score, a
parameter used for assessing the robustness of GFA derived QSAR model. As a form of quality
assurance evaluation of the built QSAR model, the external predictive ability and extrapolation of
the best model evaluated using the test set molecules with the aid of Equation 1.
𝑅2𝑝𝑟𝑒𝑑 =1–
∑(𝑃𝑟𝑒𝑑.𝑌𝑡𝑒−𝐴𝑐𝑡.𝑌𝑡𝑒)2
∑(𝐴𝑐𝑡.𝑌𝑡𝑒−𝑌𝑚)2 (Eq 1)
Where R2pred is termed the predictive R2 of a development model and is an important parameter
that is used to test the external predictive ability of a QSAR model, 𝑃𝑟𝑒𝑑. 𝑌𝑡𝑒 and 𝐴𝑐𝑡. 𝑌𝑡𝑒 indicate
predicted and observed activity values of the test set compounds respectively and 𝑌𝑚 indicates
mean activity value of the training set (17).
Applicabilty Domain of the Model
Applicability domain (AD) is the physicochemical, structural or biological space, knowledge or
information on which the training set of the model has been developed (18). The resulting model
can be reliably applicable for only those compounds which are inside this domain since it cannot be
applied to the entire universe of anti-P.falciparum compounds. The AD of the model was calculated
by the leverage approach (19).
The leverage values of all compounds were calculated and plotted against the standardized residuals
(William plot) (20). This method offers a graphical assessment of the leverage values (hii) as a
function of the standardized cross-validated residuals. It is suitable not only for detection of the
structurally-influential outliers, but also for determination of the response outliers. The leverage is
defined as a compound’s distance from the centroid of 𝑋. Mathematically, the leverage (hii) of a
given compound in the multidimensional descriptor space, can be calculated as in the following
equation:
ℎ𝑖𝑖 = 𝑥𝑖𝑇(𝑋𝑇𝑋)−1𝑥𝑖 (Eq 2)
Where 𝑥𝑖 the descriptor row matrix of the compound under consideration and 𝑋 is the
multidimensional matrix carrying the structural information (calculated molecular descriptors) for
each training set compound.
Molecular docking studies
In order to have an in-depth knowledge of the nature of the described interaction of inhibitors (3)
with the falcipain-2 receptor, molecular docking was performed using AutoDock Vina of PyRx virtual

Shehu, Uzairu and Sagagi. JOTCSA. 2018; 5(2): 569-584. RESEARCH ARTICLE
573
screening software. The energy grid calculations and visual analysis of the docking site performed
using AutoDock Vina of PyRx and Discovery Studio visualization software, respectively. The crystal
structure of falcipain-2 was obtained from protein data bank (PDB CODE: 2GHU). The removal of
native ligands present in the protein was confirmed by calculating the root mean square deviation
(RMSD) value of the original structure and the structure with ligand deletion (21,22).
All heteroatomic molecules were excluded from the three-dimensional structure of falcipain-2
receptor (Figure 1) and its structure was minimized, protonated and saved in PDBQT file format in
all polar residues. Likewise, the 3D structures of the optimized 49 different pyrrolone compounds
(Figure 2) were also converted to PDBQT format with the aid of AutoDock 4.2 software. The protein-
ligand interaction was analyzed using AutoDock Vina of PyRx Virtual Screening software. (23)
Figure 1: Structure of falcipain-2 (2GHU)
Source: (http://www.pdb.org) (24).

Shehu, Uzairu and Sagagi. JOTCSA. 2018; 5(2): 569-584. RESEARCH ARTICLE
574
Figure 2: 3D structure of the prepared ligand.
RESULTS AND DISCUSSION
The five models constructed are detailed as follows:
Model 1
𝑝𝐸𝐶50 = − 3.441 (𝑮𝑨𝑻𝑺𝟐𝒎) + 1.934 (𝒎𝒊𝒏𝒔𝒔𝒔𝑵) + 1.314 (𝑴𝑫𝑬𝑶 −
𝟐𝟐) + 3.251 (𝑹𝑫𝑭𝟗𝟓𝒖) − 5.776 (𝑹𝑫𝑭𝟏𝟑𝟎𝒖) + 3.038 (𝑹𝑫𝑭𝟑𝟎𝒗) +
2.324 (𝑹𝑫𝑭𝟏𝟓𝟓𝒗) − 1.739 (𝑹𝑫𝑭𝟏𝟓𝒔) + 7.131
Model 2
𝑝𝐸𝐶50 = − 4.943 (𝑮𝑨𝑻𝑺𝟐𝒎) − 1.663(𝑺𝒑𝑴𝒂𝒙𝟔𝑩𝒉𝒔) + 1.799 (𝒎𝒊𝒏𝒔𝒔𝒔𝑵) + 1.196(𝑴𝑫𝑬𝑶 −
𝟐𝟐) + 2.707 (𝑹𝑫𝑭𝟗𝟓𝒖) − 5.842 (𝑹𝑫𝑭𝟏𝟑𝟎𝒖) + 2.774 (𝑹𝑫𝑭𝟑𝟎𝒗) + 2.375(𝑹𝑫𝑭𝟏𝟓𝟓𝒗) + 7.982
Model 3
𝑝𝐸𝐶50 = − 4.585 (𝑮𝑨𝑻𝑺𝟐𝒎) + 1.959 (𝒎𝒂𝒙𝒔𝒔𝒔𝑵) − 1.735 (𝑻𝑰𝑪𝟎) + 1.261 (𝑴𝑫𝑬𝑶 − 𝟐𝟐) +
3.278 (𝑹𝑫𝑭𝟗𝟓𝒖) − 5.290 (𝑹𝑫𝑭𝟏𝟑𝟎𝒖) + 3.123 (𝑹𝑫𝑭𝟑𝟎𝒗) + 2.609 (𝑹𝑫𝑭𝟏𝟓𝟓𝒗) + 7.276416456
Model 4
𝑝𝐸𝐶50 = − 4.242 (𝑮𝑨𝑻𝑺𝟐𝒎) + 1.783 (𝒎𝒂𝒙𝒔𝒔𝒔𝑵) + 1.659 (𝑴𝑫𝑬𝑶 − 𝟐𝟐) + 2.908 (𝑹𝑫𝑭𝟗𝟓𝒖)
− 5.612 (𝑹𝑫𝑭𝟏𝟑𝟎𝒖) − 1.076 (𝑹𝑫𝑭𝟐𝟎𝒎) + 2.999 (𝑹𝑫𝑭𝟑𝟎𝒗) + 2.136 (𝑹𝑫𝑭𝟏𝟓𝟓𝒗) + 7.216
Model 5
𝑝𝐸𝐶50 = − 3.544 (𝑮𝑨𝑻𝑺𝟐𝒎) − 1.983( 𝑽𝑷) − 7 + 2.459 (𝒎𝒊𝒏𝒔𝒔𝒔𝑵) + 1.218 (𝑴𝑫𝑬𝑶 −
𝟐𝟐) + 3.482 (𝑹𝑫𝑭𝟗𝟓𝒖) − 6.363( 𝑹𝑫𝑭𝟏𝟑𝟎𝒖) + 3.007 (𝑹𝑫𝑭𝟑𝟎𝒗) + 2.708 (𝑹𝑫𝑭𝟏𝟓𝟓𝒗) + 7.0614

Shehu, Uzairu and Sagagi. JOTCSA. 2018; 5(2): 569-584. RESEARCH ARTICLE
575
The validation parameters for the QSAR models are presented in Table 2 and the detailed definition
of the descriptors in the model 1 are presented in Table 3. Out of the five models generated, Model
1 shows the best GFA derived QSAR models for inhibitory activity of the studied pyrrolones against
P. falciparum. Table 4 gives the comparison of observed 𝑝𝐸𝐶50 and predicted 𝑝𝐸𝐶50 of the model 1.
Table 2: Validation Metrics for Models
Parameter Model 1 Model 2 Model 3 Model 4 Model 5 Recommended
R2 0.933 0.929 0.928 0.928 0.928 ≥ 0.6
R2a 0.916 0.911 0.911 0.911 0.911 Very close to R2
QCV 2 0.844 0.887 0.891 0.887 0.882 ˂ 0.5
LOF 0.417 0.441 0.443 0.444 0.444 Very low
R2ext 0.700 - - - - ≥ 0.6
Error 0.490 0.257 0.257 0.257 0.257 Very minimal
F-value 56.993 53.676 53.427 53.323 53.312 High
Source: Ravinchandran, (2011) (25)

Shehu, Uzairu and Sagagi. JOTCSA. 2018; 5(2): 569-584. RESEARCH ARTICLE
576
Table 3: Definition of descriptors in Model 1.
S/n Descriptor Definition
1 GATS2m Geary autocorrelation - lag 2 / weighted by mass
2 MinsssN Minimum atom-type E-State: >N-
3 MDEO-22 Molecular distance edge between all secondary oxygens
4 RDF95u Radial distribution function - 095 / unweighted
5 RDF130u Radial distribution function - 130 / unweighted
6 RDF30v Radial distribution function - 030 / weighted by relative van der Waals volumes
7 RDF155v Radial distribution function - 155 / weighted by relative van der Waals volumes
8 RDF15s Radial distribution function - 015 / weighted by relative I-state
9 RDF20m Radial Distribution Function-020 / weighted by mass
10 MaxsssN Maximum atom-type E-State: >N-
11 spMax6Bhs largest eigenvalue n. 6 of Burden matrix weighted by I-state
12 TICO Total Information Content index (neighborhood symmetry of 0-order)
13 Vp Valance path order
Source: Descriptor Manual (2012) (26,27)

Shehu, Uzairu and Sagagi. JOTCSA. 2018; 5(2): 569-584. RESEARCH ARTICLE
577
Table 4: Comparison of observed pEC50 and predicted pEC50 of Model 1
Cpd Act. pEC50 Pred. pEC50 Cpd Act. pEC50 Pred. pEC50
1a 7.85 7.78 26a 6.96 7.05
2a 7.46 7.27 27a 5.85 6.34
3a 4.92 5.00 28a 8.39 8.23
4a 5.85 5.59 29b 9.39 9.13
5a 5.62 5.49 30a 6.82 6.75
6a 6.72 6.39 31a 5.92 6.51
7a 5.96 5.61 32b 7.00 8.91
8a 7.23 7.36 33a 7.74 7.81
9a 6.42 6.77 34b 6.00 7.11
10a 6.33 6.49 35a 7.92 7.43
11b 7.62 6.98 36a 9.00 8.94
12a 7.64 7.62 37a 5.82 6.21
13a 8.69 8.78 38a 8.12 7.94
14a 9.30 9.41 39a 5.59 7.71
15b 7.62 8.18 40a 7.21 7.24
16a 6.49 7.02 41a 7.33 7.21
17a 7.08 6.78 42a 7.85 7.85
18a 6.89 6.97 43a 7.68 7.64
19b 7.02 6.47 44a 6.82 7.30
20a 8.15 8.21 45a 6.64 6.16
21a 9.00 8.91 46a 6.60 6.86
22b 5.28 6.39 47a 6.64 6.75
23a 5.62 -0.03 48a 7.34 7.36
24a 5.46 5.61 49a 7.11 6.99
25a 7.79 7.51
a: training set, b: test set Cpd: compounds, Act: Actual, Pred:Predicted
Figures 3a and 3b give the plot of predicted pEC50 against actual pEC50 of the compounds for the
test set and training set, respectively. The William’s plot is depicted in Figure 4.

Shehu, Uzairu and Sagagi. JOTCSA. 2018; 5(2): 569-584. RESEARCH ARTICLE
578
Figure 3a: Plot of predicted versus the observed pEC50 values for the test set compounds.
Figure 3b: Plot of predicted versus the observed pEC50 values for the training set compounds
y = 1,1122x - 1,0496R² = 0,6901
0
2
4
6
8
10
12
14
16
0 2 4 6 8 10 12 14
Actu
al p
EC
50
Predicted pEC50
0
2
4
6
8
10
12
14
16
-2 0 2 4 6 8 10 12 14 16
Pred
icte
d p
EC
50
Actual pEC50
y = 0.9399x + 0.3983R² = 0.9304

Shehu, Uzairu and Sagagi. JOTCSA. 2018; 5(2): 569-584. RESEARCH ARTICLE
579
Figure 4. William’s plot, the plot of the standardized residuals versus the activity leverage value
of model 1.
Table 5 (supplementary files) shows the docking scores, hydrogen bonding length (in Angström)
and interacting residues involved in the docking of inhibitors (ligands) at the active site of Falcipain-
2.
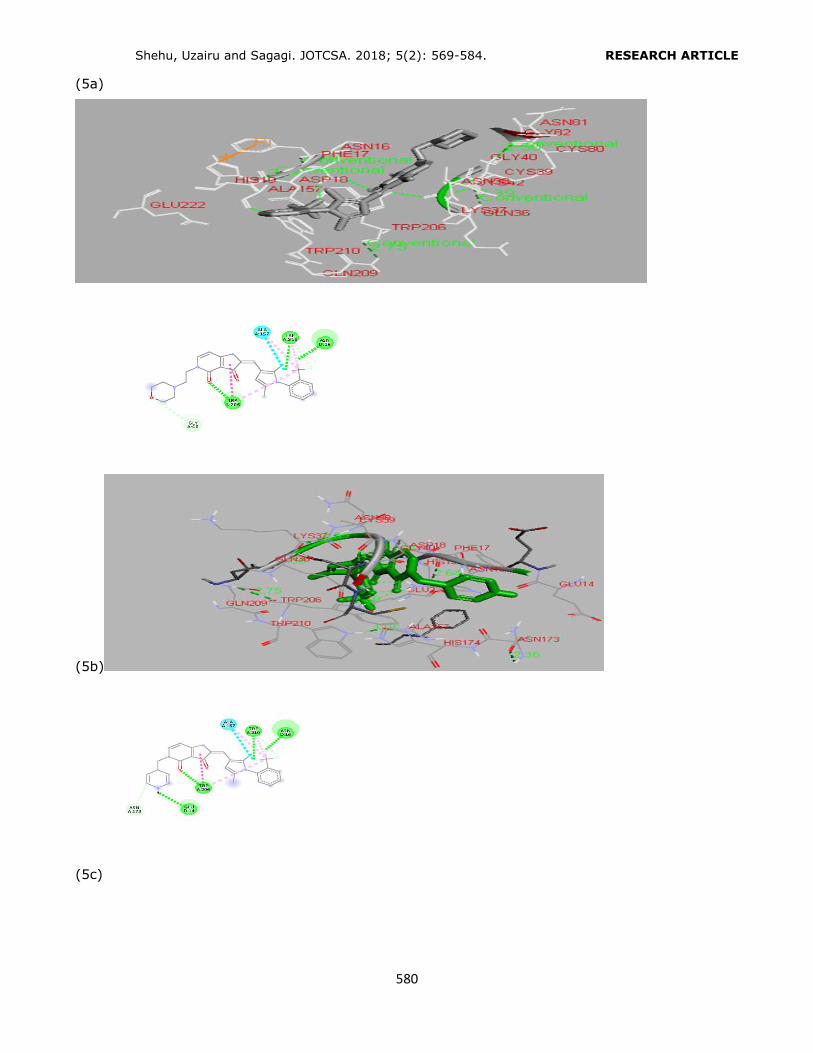
Figures 5a-c show the best three docking results obtained.
Shehu, Uzairu and Sagagi. JOTCSA. 2018; 5(2): 569-584. RESEARCH ARTICLE
580
(5a)
(5b)
(5c)

Shehu, Uzairu and Sagagi. JOTCSA. 2018; 5(2): 569-584. RESEARCH ARTICLE
581
Figure 5: Three-dimensional docked Falcipain-2-Ligands Complex: (5a) Interactions between
Falcipain-2 and Ligand 45a, (5b) interactions between Falcipain-2 and Ligand 49a and (5c)
interactions between Falcipain-2 and Ligand 48a Green dashed lines represent the H-bond
interactions, and red dashed lines represent the hydrophobic interactions.
The statistical parameters of the Genetic Function Algorithm derived QSAR model is in compliance
with the standard QSAR validation metrics shown in Table 2. The high predictability of the model is
evidenced by the low residual values observed in Table 4 which gives the comparison of observed
and predicted anti-P. falciparum activities of the Pyrrolones. Also, the high linearity of the plot of
predicted pEC50 against observed pEC50 depicted in Figures 3a and 3b for test set and training set
molecules, respectively confirms the robustness of the model.
William’s plot (Figure 4) obtained to ascertain the inclusiveness of the studied pyrrolones in model’s
applicability domain reveals that all the compounds of the training set have leverage values lower
than the warning hi value (hi = 0.64) except two compounds with leverage values higher than hi.
This implies that the models can be successfully applied to this series of pyrrolone antimalarial

Shehu, Uzairu and Sagagi. JOTCSA. 2018; 5(2): 569-584. RESEARCH ARTICLE
582
compounds. The two compounds with higher leverage than hi value are most likely to be structural
outliers.
Molecular docking studies were carried out between the targets (falcipain-2) and the inhibitors
reveal that all the compounds were found to strongly inhibit the growth of P. falciparum by
completely occupying the active sites of the target protein (falcipain-2). Most of the inhibitors were
found to be involved in both hydrophobic interactions and hydrogen bonding with the receptor
(falcipain-2).
The best three docking results are shown in Figure 5. Ligand 45a with a binding energy of -10.7
kcal/mol shows hydrophobic interactions Trp210, Trp206, Gln209, Gln36, Lys37, Asn38, Cys39,
Cys42, Cys80, Gly82, Asn81, Glu222, Ala157, Asp18, His19, Asn16 and Phe17 with the target in
addition to three hydrogen bonding (2.57 Å, 2.91 Å, and 2.21 Å) with Trp206, Trp210 and Asn16.
Ligand 49a with binding score of -10.9 kcal/mol forms four hydrogen bonding (2.26 Å, 2.92 Å, 2.22
Å and 2.69 Å) with Trp206, Trp210, Asn16 and Glu14 respectively, and hydrophobic interaction with
Trp210, Trp206, Gln209, Gln36, Lys37, Asn38, Cys39, Gly40, Asn16, Asp18, Ala157, His19, Glu222,
Phe17, Asn173, Glu14. Similarly, compound 48a with binding score of -11.1 kcal/mol forms
hydrogen bonds (2.40 Å, 2.97 Å, and 2.27 Å) with Trp206, Trp210 and Asn16 respectively, and
hydrophobic interactions with Trp210, Trp206, Gln209, Gln36, Lys37, Asn38, Cys39, Gly40, Asn16,
Asp18, Ala157, His19, Glu222, Phe17, Glu14, and Glu15.
CONCLUSIONS
The present study aimed to generate a highly predictive GFAQSAR model capable of revealing the
structural requirements for the observed antimalarial inhibitory activities of Pyrrolones against the
Plasmodium, P. falciparum. In addition to that, it also investigates the Pyrrolones with best binding
affinity to falcipain-2 of the parasite. Falcipain-2 is an essential and validated drug target involved
in performing various enzymatic functions such as hemoglobin digestion, erythrocyte invasion, and
parasite growth in the host cell. The robustness and applicability of QSAR equation have been
established by internal and external validation techniques. The best three docking score is seen in
compounds 45a, 49a and 48a, due to their low binding affinity (-10.7, -10.9 and -11.1 kcal/mol)
which is higher compared to the standard antimalarial drugs binding affinity value of (-8.8, -9.5 and
-9.0 kcal/mol) (28). These compounds may be considered for further studies in view of their high
potency and binding affinity to the target protein of P. falciparum.

Shehu, Uzairu and Sagagi. JOTCSA. 2018; 5(2): 569-584. RESEARCH ARTICLE
583
It is envisioned that the wealth of information provided by the QSAR and Molecular docking results
in this study will offer important structural insight for further laboratory experiments in the future
design of novel and highly potent antimalarial.
In view of the high potency and binding affinity of the compounds to falcipain-2, it is recommended
that these compounds be subjected to further laboratory studies. Also, our study advocates the use
of combined approaches of QSAR and molecular docking to search for novel potential inhibitors
unique to falcipain-2 of P. falciparum.
REFERENCES
1. WHO. 10 facts on malaria [Internet]. World Health Organization; 2016 [cited 2018 Jan 10]. Available from: http://www.who.int/features/factfiles/malaria/en/ 2. Newton C. Severe Falciparum Malaria in Children Current Understanding of Pathophysiology and Supportive Treatment. Pharmacology & Therapeutics. 1998 Jul;79(1):1–53.
3. Kumari M, Chandra S, Tiwari N, Subbarao N. 3D QSAR, pharmacophore and molecular docking studies of known inhibitors and designing of novel inhibitors for M18 aspartyl aminopeptidase of Plasmodium falciparum. BMC Structural Biology [Internet]. 2016 Dec [cited 2018 Jan 13];16(1). Available from: http://bmcstructbiol.biomedcentral.com/articles/10.1186/s12900-016-0063-7 4. Basco LK, Bras JL. In Vitro Activity of Artemisinin Derivatives Against African Isolates and Clones of
Plasmodium falciparum. The American Journal of Tropical Medicine and Hygiene. 1993 Sep 1;49(3):301–7.
5. Pandey KC, Dixit R. Structure-Function of Falcipains: Malarial Cysteine Proteases. Journal of Tropical Medicine. 2012;2012:1–11. 6. Bisson WH, Cheltsov AV, Bruey-Sedano N, Lin B, Chen J, Goldberger N, et al. Discovery of antiandrogen activity of nonsteroidal scaffolds of marketed drugs. Proceedings of the National Academy of Sciences. 2007
Jul 17;104(29):11927–32. 7. Mizutani MY, Itai A. Efficient Method for High-Throughput Virtual Screening Based on Flexible Docking: Discovery of Novel Acetylcholinesterase Inhibitors. Journal of Medicinal Chemistry. 2004 Sep;47(20):4818–28.
8. Nagpal I, Raj I, Subbarao N, Gourinath S. Virtual Screening, Identification and In Vitro Testing of Novel Inhibitors of O-Acetyl-L-Serine Sulfhydrylase of Entamoeba histolytica. Bogyo M, editor. PLoS ONE. 2012 Feb 15;7(2):e30305. 9. Esposito EX, Hopfinger AJ, Madura JD. Methods for Applying the Quantitative Structure-Activity
Relationship Paradigm. In: Bajorath J, editor. Chemoinformatics [Internet]. Totowa, NJ: Humana Press; 2004 [cited 2018 Jan 13]. p. 131–213. Available from: http://link.springer.com/10.1385/1-59259-802-1:131
10. Xue L, Bajorath J. Molecular Descriptors in Chemoinformatics, Computational Combinatorial Chemistry, and Virtual Screening. Combinatorial Chemistry & High Throughput Screening. 2000 Oct 1;3(5):363–72. 11. Barril X, Morley SD. Unveiling the Full Potential of Flexible Receptor Docking Using Multiple Crystallographic Structures. Journal of Medicinal Chemistry. 2005 Jun;48(13):4432–43.
12. Anonymous. EC50 [Internet]. revolvy.com; [cited 2018 Oct 1]. Available from: https://www.revolvy.com/main/index.php?s=EC50&uid=1575
Shehu, Uzairu and Sagagi. JOTCSA. 2018; 5(2): 569-584. RESEARCH ARTICLE
584
13. Anonymous. Stardrop. Optibrium;
14. Veeresamy R, Rajak H, Jain A, Sivadasan S, Varghese C, Agrawal R. Validation of QSAR Models - Strategies and Importance. Int J Drug Des Dis. 2011;2(3):511–9. 15. Eriksson L, Jaworska J, Worth A, Cronin M, McDowell R, Gramatica P. Methods for reliability and uncertainty assessment and for applicability evaluations of classification- and regression-based QSARs.
Environ Health Perspect. 2003;111(10):1361–75. 16. Gramatica P. Principles of QSAR models validation: internal and external. QSAR & Combinatorial Science. 2007 May;26(5):694–701. 17. Madeswaran A, Umamaheswari M, Asokkumar K, Sivashanmugam T, Subhadradevi V, Jagannath P. Computational drug discovery of potential phosphodiesterase inhibitors using in silico studies. Asian Pacific
Journal of Tropical Disease. 2012 Jan;2:S822–6. 18. Daisy P, Nivedha R, Bakiya RH. In silico drug designing approach for biotin protein Ligase of
Mycobacterium tuberculosis. Asian J Pharm Clin Res. 2013;6(l1):103–107. 19. Monika JK, Singh K. Virtual screening using the ligand ZINC database for novel lipoxygenase-3 inhibitors. Bioinformation. 2013;9(11):583.
20. Hogg T, Nagarajan K, Schmidt CL, Hilgenfeld R. Crystal structure of falcipain-2 from Plasmodium falciparum. 2006 Jun 6; 21. Veerasamy R, Rajak H, Jain A, Sivadasan S, Varghese CP, Agrawal RK. Validation of QSAR models-strategies and importance. International Journal of Drug Design & Discovery. 2011;3:511–519.
22. Anonymous. List of molecular descriptors calculated by Dragon [Internet]. Talete; Available from: http://www.talete.mi.it/products/dragon_molecular_descriptor_list.pdf 23. Adejoro I, Waheed S, Adeboye O. Molecular Docking Studies of Lonchocarpus cyanescens Triterpenoids as Inhibitors for Malaria. Journal of Physical Chemistry & Biophysics. 2016;6:213.