quantitative non-destructive evaluation of thermal barrier
TRANSCRIPT

Quantitative non-destructive evaluation of thermal barrier coating erosion using photoluminescent layers
Christopher C. Pilgrim, Stéphane Berthier, Jörg P. Feist
Sensor Coating Systems London, SW7 2AZ, UK
Telephone: 020 7594 3519 Telefax: 020 7594 3519
E-mail: [email protected]
Andrew L. Heyes Imperial College London London, SW7 2AZ, UK
Abstract
The ongoing drive to improve efficiency and thrust of high performance gas turbines has led to the integration of thermal barrier coatings. These coatings enable the components to operate at higher temperatures whilst maintaining economic service life. It is recognised that further increases in operating temperature are the primary route to achieving higher performance. As such the thermal barrier coatings will need to become prime reliant. Quantitative non-destructive methods are, therefore, required to evaluate the degradation of the coatings to improve lifing estimates and develop condition-based maintenance procedures.
In certain operating regimes, particularly in environments with contaminated intake air, degradation of the coating can occur by gradual thinning from the surface leading to complete failure. Current inspection routines cannot identify these gradual degradation mechanisms. The introduction of small amounts of rare-earth oxides into the standard thermal barrier coating materials makes the coating phosphorescent. The dopant ions act as atomic scale sensors which can be interrogated non-destructively through their phosphorescent properties. The dopant ions can be introduced in distinct layers through the coating thickness as a means to detect gradual thinning. The first detailed characterisation of this technique has been conducted. The phosphorescence was imaged using standard instrumentation to provide a rapid quantitative assessment of the erosion damage. After image processing the thickness profile of the coating was reconstructed and correlates to two forms of validation measurements. Testing, on a thermal gradient rig and on an aeroengine test bed, has demonstrated that the sensor function can be introduced whilst maintaining the primary function of the coating.
1 Introduction
Thermal barrier coatings (TBCs) are deposited onto hot end components of gas turbine engines, both for aerospace and power generation applications, to protect the underlying material from the high gas temperatures. The application of TBCs in modern gas turbines is crucial to achieve higher, more efficient firing temperatures. Hence, damaged
2
TBCs either lead to costly damage of high value components or to less efficient operating regimes.
In certain operating conditions the degradation of the TBC occurs by gradual thinning from the surface inwards. Ingested particles can transport through the engine, impacting on the TBC, resulting in material removal or compaction damage(1). Alternatively the particles become molten through the combustion flame and deposit on the coating surface, as in calcium-magnesium-alumino-silicate (CMAS) attack(2). The deposits filter into the porous TBC ceramic to locally reduce the strain tolerance and cause total or partial spallation of the coating(3). The same effect has been observed due to volcanic ash ingestion(4). Coating thinning can also occur when the standard yttria-stabilised zirconia (YSZ) coating material exceeds surface temperatures of 1250°C. Upon reaching this temperature the YSZ undergoes a phase transition, from tetragonal to monoclinic, causing a volumetric change and consequently near surface cracking occurs, removing material from the surface(5,6). In all of these three cases the reduction in coating thickness lowers the thermal protection offered by the TBC promoting premature failure of the entire coating system.
Current inspection routines, which typically involve visual examination through a borescope, cannot identify these gradual degradation mechanisms; only total delamination can be detected. Therefore, significant safety margins are employed in engine design, limiting the efficiency gains achievable through the use of TBCs. Quantitative non-destructive evaluation of TBCs could enable condition based maintenance, improving reliability, availability and reducing maintenance costs. Although several NDE methods have been proposed for the inspection of TBCs the significant benefits associated with conducting the inspection in-situ limits the industrial suitability of some techniques.
One method to detect gradual thinning of the TBC was proposed by Amano et al(7). The concept describes a TBC with an embedded layer which has a luminous activator that is used to indicate thickness degradation. More recently it has been shown that rare-earth oxides can be integrated into TBC ceramics to produce a sensor TBC which has the considerable benefit that it can be used as a temperature indicator(8). Recent progress into the temperature measurement capability(9,10) has reinvigorated research into the concept of using embedded luminescent layers for thickness measurements(11-13). Quantitative assessment of coating thickness degradation can be made using luminescent layers of known position and thickness. A key potential benefit is that this technique could be conducted in-situ using a modified borescope to excite and detect the luminescence.
While using luminescence properties for an erosion sensor has been considered(7,8,13), to the authors’ knowledge there are no reported quantitative studies of the erosion detection capability of this technique. The purpose of the present contribution is to compare the thermal stability of layered sensor coatings to standard TBCs and to examine the erosion detection capability of the modified coatings. This contribution presents a new remote erosion detection system built from off-the-shelf components, which, when employed in conjunction with careful coating design and bespoke image processing routines, provides quantitative erosion depth measurements with a resolution equal to the thickness of the sensor layers.
3
2 Concept theory
Luminescence is a process whereby electrons return to the ground state from an excited state by the spontaneous emission of photons(14). The excitation energy can come from several sources however the term photoluminescence refers to excitation by light.
Photoluminescence can be induced into a material through the introduction of optically active ions, which integrate into the crystal structure and are known as optically active centres. The optical features of the centre depend on the type of dopant and to a lesser extent the host lattice. Rare earth ions have been widely used as luminescent activators because their optical properties are primarily dictated by electron transitions between states in their partially filled 4f shell which is shielded by the outer 5d and 6s shells which provide bonding to the host lattice(15). The influence of the surrounding lattice on the optical transitions of the 4f electrons is therefore minimal. As such, when rare earth ions are mixed into a host lattice in low concentrations they can be considered as free ions. The gross features of the energy levels of rare earth ions remain largely the same regardless of the host. The choice of rare earth ion determines the excitation and emission wavelengths so the same host can be doped with different rare earths to produce different excitation and emission spectra. The dopant ions can be introduced into functional ceramics, which are used for their thermal protection properties, to produce luminescence without deterioration of the material properties(16). Furthermore, the luminescent activator ion can be changed through the thickness of the TBC to produce distinct layers with different emission characteristics, ie different emission colour. Material removed from the surface by erosion causes the emission spectrum from the coating to change and allows the erosion to be detected.
3 Experimental procedure
Sample sensor TBCs were manufactured to investigate the use of photoluminescent layers for erosion detection. Some of which were tested on a thermal gradient rig and others eroded. The luminescence from the eroded samples was then recorded and analysed.
3.1 Coating production and specification
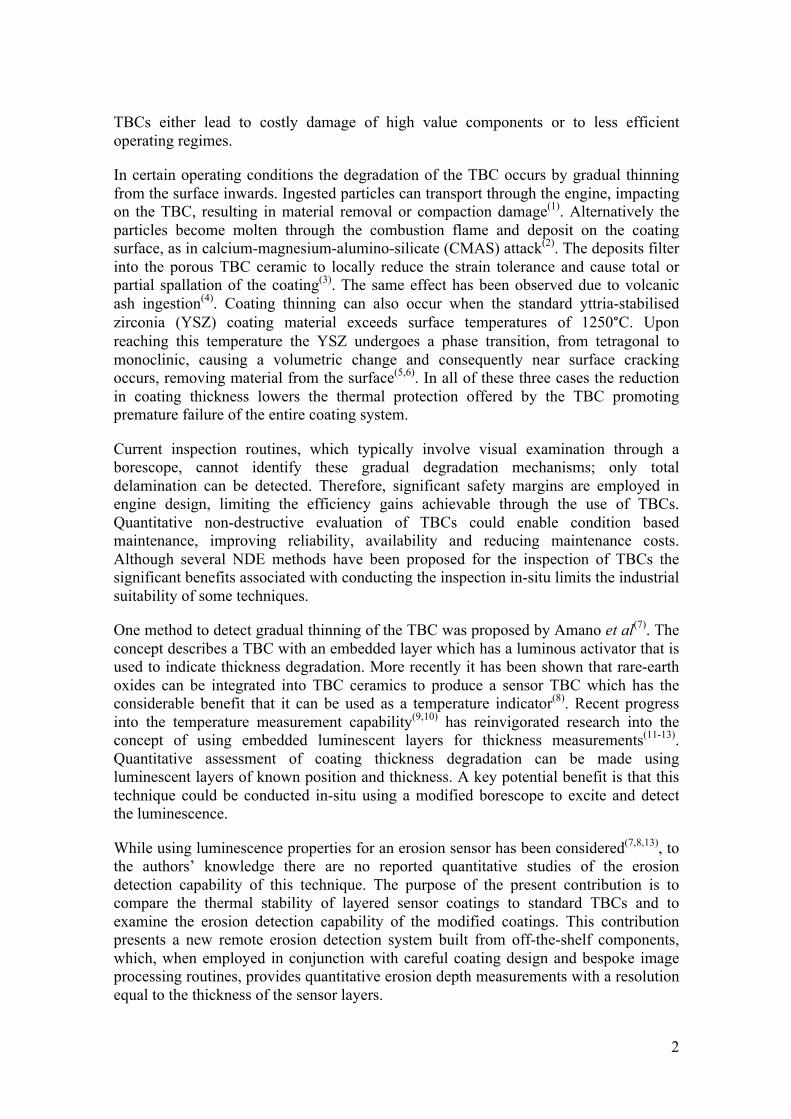
A schematic of the three coating types which were produced is shown in Figure 1. The erosion sensor coatings, denoted type A and B, contain two layers which have additions of rare earth dopants at specific depths within the coating.
Figure 1. A schematic of the coating designs
4
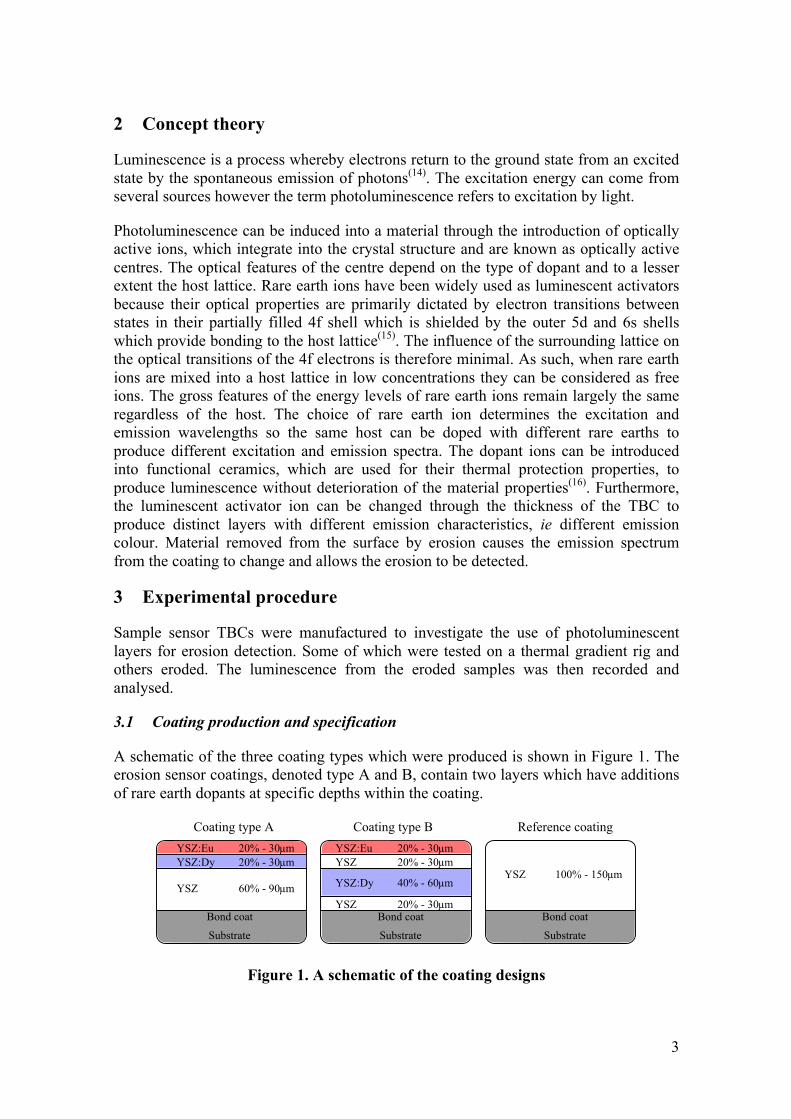
The coatings were deposited onto one side of Inconel 738 discs, 30mm in diameter and two turbine blades from a Roll-Royce VIPER test engine owned by Southside Thermal Sciences (STS). All the coatings were produced at Cranfield University. The ceramic overcoat was applied to a platinum enriched nickel aluminide bond coat using a jumping electron beam physical vapour deposition (EB-PVD) coater with three continuous feed ingots. The bulk material is 4 mol.% yttria-stabilized zirconia (YSZ). The doped layers were produced by evaporation of YSZ:Eu ((ZrO2)0.94(Y2O3)0.04(Eu2O3)0.02) and YSZ:Dy ((ZrO2)0.92(Y2O3)0.04(Dy2O3)0.04) ingots. These materials are chosen because they are known to produce sufficiently bright luminescence at distinctly different wavelengths(17). The unmodified YSZ TBC is produced to provide a reference for the testing of the modified coatings. The micrographs, shown in Figure 2, confirm that distinct doped layers were produced without disrupting the columnar structure of the coating. Energy dispersive x-ray spectroscopy (EDS) analysis indicated an average Eu3+ and Dy3+ doping level of 0.8 and 2.1 at.% respectively which is slightly below the expected values of 1.3 and 2.5 at.% according to the ingot composition.
Figure 2. The EDS maps of the multi-layered erosion coatings, the brighter the
area of the image the greater proportion of the denoted element.
3.2 Coating stability tests
For the introduction of photoluminescence layers for the purposes of erosion detection to be viable, the modified coatings must retain their primary structural function. The interfaces between the different layers may be considered as weak points and hence thermal driven stresses could lead to premature failure. Therefore, the effect of introducing doped layers into the TBC ceramic on the thermal stability of the coating was investigated using thermal gradient cycling testing. This test induces stresses due to the thermal expansion coefficient mismatch between the substrate metal and the TBC coating. These stresses are often attributed to the failure of TBCs in an operating engine.
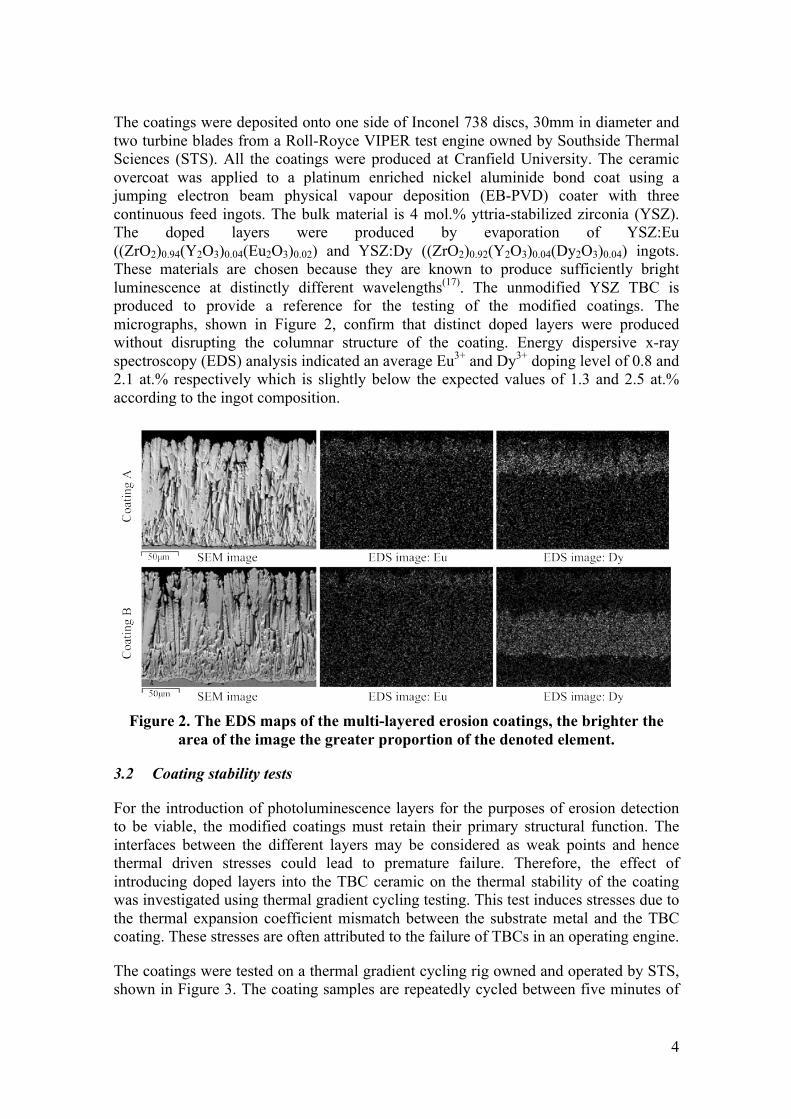
The coatings were tested on a thermal gradient cycling rig owned and operated by STS, shown in Figure 3. The coating samples are repeatedly cycled between five minutes of
5
heating and two minutes of cooling. During the heating condition the coated surface is exposed to an oxyfuel flame while the uncoated back surface is cooled using a jet of ambient temperature air. This forces a thermal gradient through the TBC system similar to that it would experience on a cooled engine component. In the cooling condition the flame is replaced by another jet of cool air. The coatings are cycled to failure, which is determined to be when 20% of the coating area has spalled from the substrate, the typical criteria for cyclic testing.
Figure 3. A photograph of the thermal gradient cycling rig while the coating
sample is in the heating condition.
During testing the temperature of the sample is continuously monitored. The surface temperature is measured using a long wavelength pyrometer, in the spectral range 9.6-11.5µm, to overcome the transparency of the YSZ material in the short infrared range. The substrate temperature is measured at the centre of the disc, 1mm beneath the TBC/bond coat interface, using a thermocouple embedded in a radial hole. The target temperature was 1225°C at the surface, 1110°C in the substrate resulting in a calculated value of 1150°C at the TBC/bond coat interface. Two samples of each coating type were tested except only one sample was tested for coating B. One of the coating A samples was tested under more severe gradient conditions where the surface and substrate temperatures were 1250°C and 1095°C respectively, resulting in the same temperature at the TBC/bond coat interface as for the other test conditions.
3.3 Erosion set-up
In order to conduct erosion measurements by phosphorescence imaging two samples of each coating were eroded on a purpose-built TBC erosion rig at Cranfield University, described in detail elsewhere(18). Alumina particles, between 90 and 125µm, were entrained into a high velocity air flow to achieve a particle velocity of approximately 100m/s and a feed rate of approximately 0.5g/min. The laden air flow impacts on the
6
coating surface with a perpendicular angle of attack. These conditions are the same as previously reported erosion work on TBCs(18,19). The exposure time was set, using initial calibration runs, to erode a crater with a depth of at least the thickness of the two outermost coating layers.
3.4 Erosion detection system
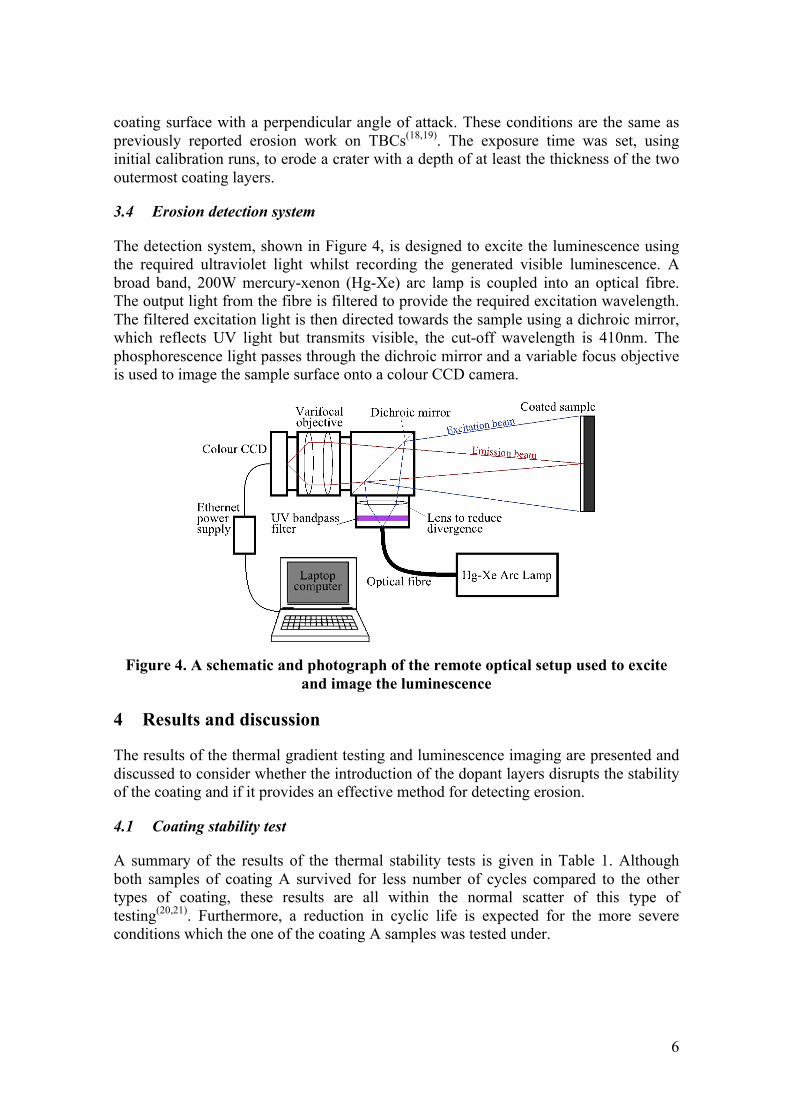
The detection system, shown in Figure 4, is designed to excite the luminescence using the required ultraviolet light whilst recording the generated visible luminescence. A broad band, 200W mercury-xenon (Hg-Xe) arc lamp is coupled into an optical fibre. The output light from the fibre is filtered to provide the required excitation wavelength. The filtered excitation light is then directed towards the sample using a dichroic mirror, which reflects UV light but transmits visible, the cut-off wavelength is 410nm. The phosphorescence light passes through the dichroic mirror and a variable focus objective is used to image the sample surface onto a colour CCD camera.
Figure 4. A schematic and photograph of the remote optical setup used to excite
and image the luminescence
4 Results and discussion
The results of the thermal gradient testing and luminescence imaging are presented and discussed to consider whether the introduction of the dopant layers disrupts the stability of the coating and if it provides an effective method for detecting erosion.
4.1 Coating stability test
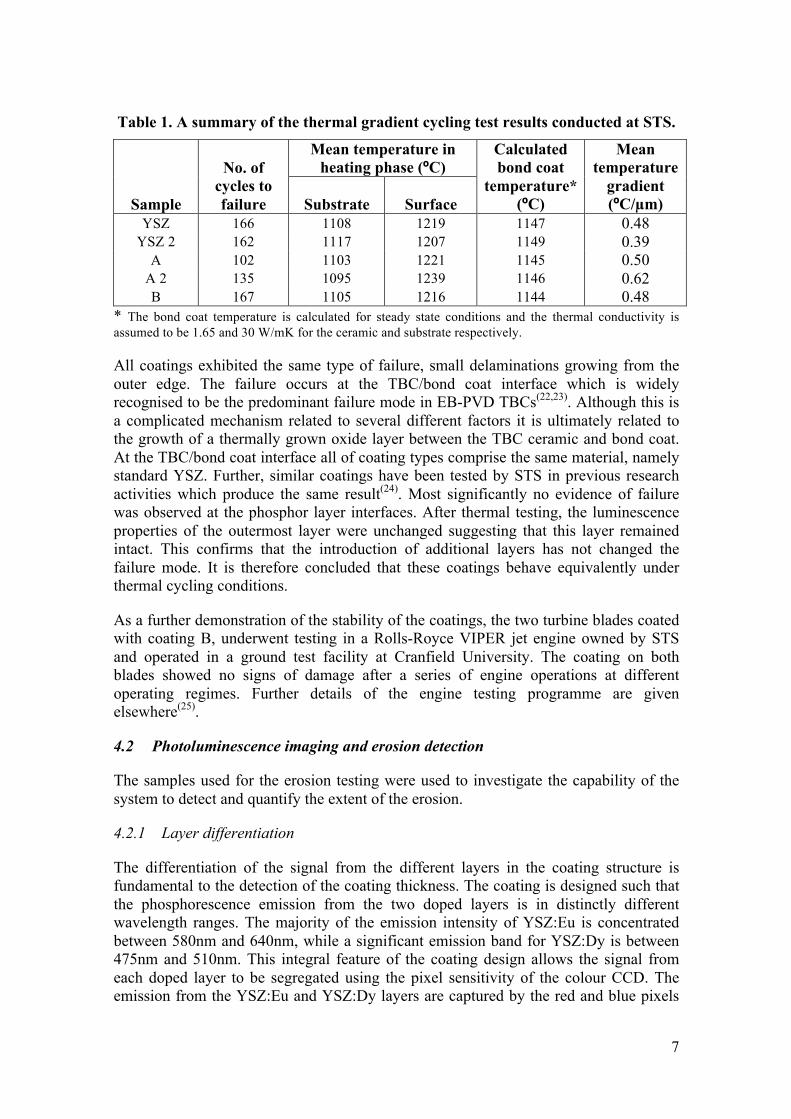
A summary of the results of the thermal stability tests is given in Table 1. Although both samples of coating A survived for less number of cycles compared to the other types of coating, these results are all within the normal scatter of this type of testing(20,21). Furthermore, a reduction in cyclic life is expected for the more severe conditions which the one of the coating A samples was tested under.
7
Table 1. A summary of the thermal gradient cycling test results conducted at STS.
Sample
No. of cycles to failure
Mean temperature in heating phase (ºC)
Calculated bond coat
temperature* (ºC)
Mean temperature
gradient (ºC/µm) Substrate Surface
YSZ 166 1108 1219 1147 0.48 YSZ 2 162 1117 1207 1149 0.39
A 102 1103 1221 1145 0.50 A 2 135 1095 1239 1146 0.62 B 167 1105 1216 1144 0.48
* The bond coat temperature is calculated for steady state conditions and the thermal conductivity is assumed to be 1.65 and 30 W/mK for the ceramic and substrate respectively.
All coatings exhibited the same type of failure, small delaminations growing from the outer edge. The failure occurs at the TBC/bond coat interface which is widely recognised to be the predominant failure mode in EB-PVD TBCs(22,23). Although this is a complicated mechanism related to several different factors it is ultimately related to the growth of a thermally grown oxide layer between the TBC ceramic and bond coat. At the TBC/bond coat interface all of coating types comprise the same material, namely standard YSZ. Further, similar coatings have been tested by STS in previous research activities which produce the same result(24). Most significantly no evidence of failure was observed at the phosphor layer interfaces. After thermal testing, the luminescence properties of the outermost layer were unchanged suggesting that this layer remained intact. This confirms that the introduction of additional layers has not changed the failure mode. It is therefore concluded that these coatings behave equivalently under thermal cycling conditions.
As a further demonstration of the stability of the coatings, the two turbine blades coated with coating B, underwent testing in a Rolls-Royce VIPER jet engine owned by STS and operated in a ground test facility at Cranfield University. The coating on both blades showed no signs of damage after a series of engine operations at different operating regimes. Further details of the engine testing programme are given elsewhere(25).
4.2 Photoluminescence imaging and erosion detection
The samples used for the erosion testing were used to investigate the capability of the system to detect and quantify the extent of the erosion.
4.2.1 Layer differentiation
The differentiation of the signal from the different layers in the coating structure is fundamental to the detection of the coating thickness. The coating is designed such that the phosphorescence emission from the two doped layers is in distinctly different wavelength ranges. The majority of the emission intensity of YSZ:Eu is concentrated between 580nm and 640nm, while a significant emission band for YSZ:Dy is between 475nm and 510nm. This integral feature of the coating design allows the signal from each doped layer to be segregated using the pixel sensitivity of the colour CCD. The emission from the YSZ:Eu and YSZ:Dy layers are captured by the red and blue pixels
8
respectively. Using this approach eliminates the requirement for filters in the emission path, reducing the complexity of the system and light intensity losses.
4.2.2 Erosion mapping
Erosion of the coating causes removal of material from the surface, hence diminishing the signal from the outermost layer until complete removal. Accordingly, the presence of the outermost layer can be determined from the observation of its characteristic emission wavelength. Since the signal from each layer can be differentiated using the red and blue pixels of the CCD, the intensities on these pixels can be used to determine the coating thickness.
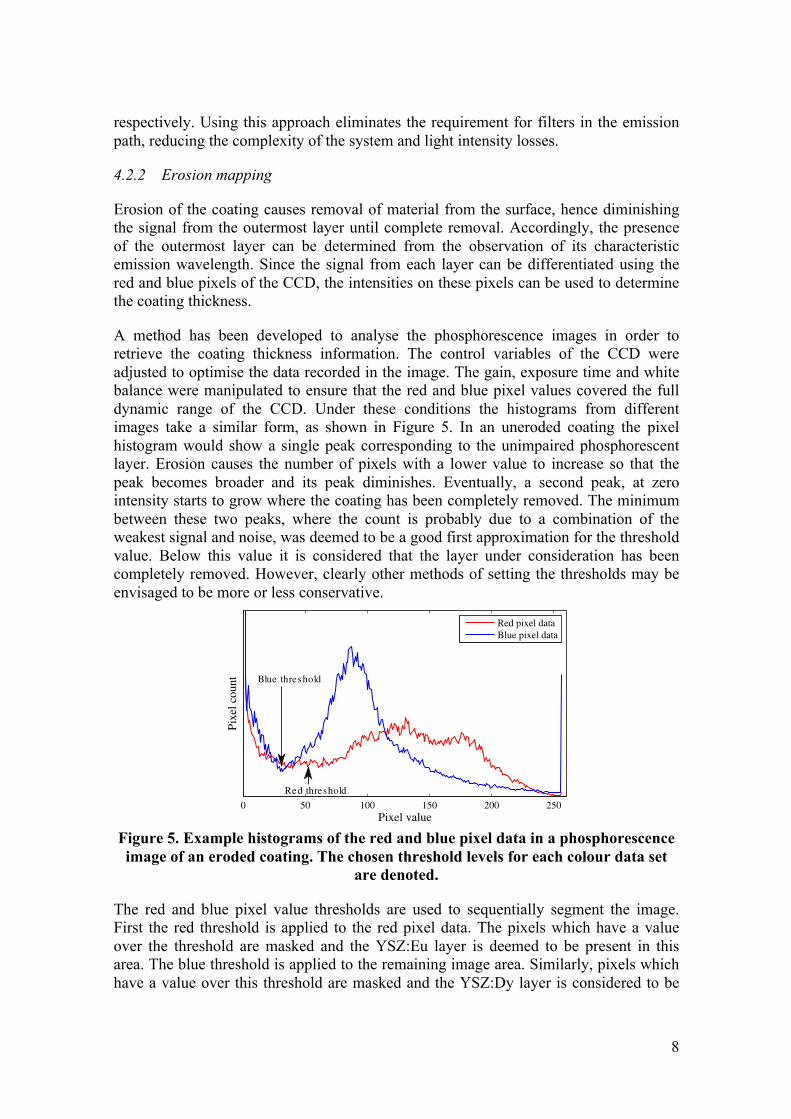
A method has been developed to analyse the phosphorescence images in order to retrieve the coating thickness information. The control variables of the CCD were adjusted to optimise the data recorded in the image. The gain, exposure time and white balance were manipulated to ensure that the red and blue pixel values covered the full dynamic range of the CCD. Under these conditions the histograms from different images take a similar form, as shown in Figure 5. In an uneroded coating the pixel histogram would show a single peak corresponding to the unimpaired phosphorescent layer. Erosion causes the number of pixels with a lower value to increase so that the peak becomes broader and its peak diminishes. Eventually, a second peak, at zero intensity starts to grow where the coating has been completely removed. The minimum between these two peaks, where the count is probably due to a combination of the weakest signal and noise, was deemed to be a good first approximation for the threshold value. Below this value it is considered that the layer under consideration has been completely removed. However, clearly other methods of setting the thresholds may be envisaged to be more or less conservative.
Figure 5. Example histograms of the red and blue pixel data in a phosphorescence image of an eroded coating. The chosen threshold levels for each colour data set
are denoted.
The red and blue pixel value thresholds are used to sequentially segment the image. First the red threshold is applied to the red pixel data. The pixels which have a value over the threshold are masked and the YSZ:Eu layer is deemed to be present in this area. The blue threshold is applied to the remaining image area. Similarly, pixels which have a value over this threshold are masked and the YSZ:Dy layer is considered to be
9
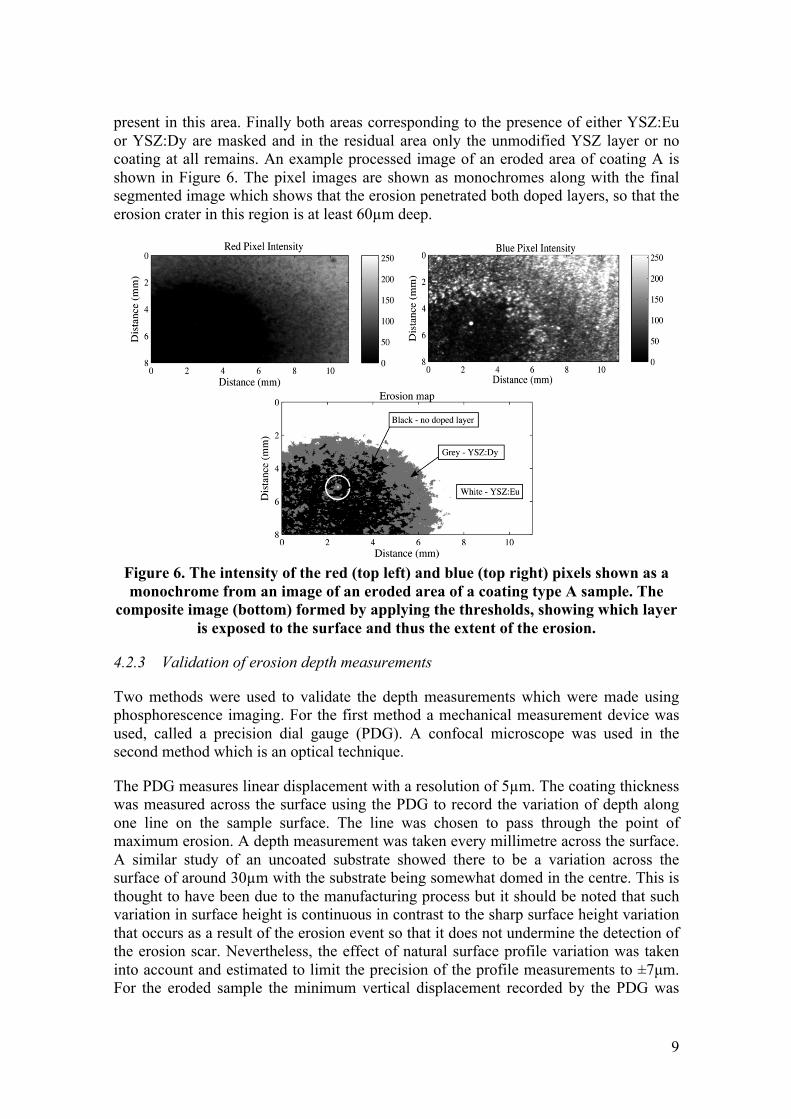
present in this area. Finally both areas corresponding to the presence of either YSZ:Eu or YSZ:Dy are masked and in the residual area only the unmodified YSZ layer or no coating at all remains. An example processed image of an eroded area of coating A is shown in Figure 6. The pixel images are shown as monochromes along with the final segmented image which shows that the erosion penetrated both doped layers, so that the erosion crater in this region is at least 60µm deep.
Figure 6. The intensity of the red (top left) and blue (top right) pixels shown as a monochrome from an image of an eroded area of a coating type A sample. The
composite image (bottom) formed by applying the thresholds, showing which layer is exposed to the surface and thus the extent of the erosion.
4.2.3 Validation of erosion depth measurements
Two methods were used to validate the depth measurements which were made using phosphorescence imaging. For the first method a mechanical measurement device was used, called a precision dial gauge (PDG). A confocal microscope was used in the second method which is an optical technique.
The PDG measures linear displacement with a resolution of 5µm. The coating thickness was measured across the surface using the PDG to record the variation of depth along one line on the sample surface. The line was chosen to pass through the point of maximum erosion. A depth measurement was taken every millimetre across the surface. A similar study of an uncoated substrate showed there to be a variation across the surface of around 30µm with the substrate being somewhat domed in the centre. This is thought to have been due to the manufacturing process but it should be noted that such variation in surface height is continuous in contrast to the sharp surface height variation that occurs as a result of the erosion event so that it does not undermine the detection of the erosion scar. Nevertheless, the effect of natural surface profile variation was taken into account and estimated to limit the precision of the profile measurements to ±7µm. For the eroded sample the minimum vertical displacement recorded by the PDG was
10
regarded as signifying the uneroded coating and consequently, relative to it, the thickness of the coating at the base of the erosion crater was determined to be 90±7µm equating to an erosion crater depth of 60±7µm.
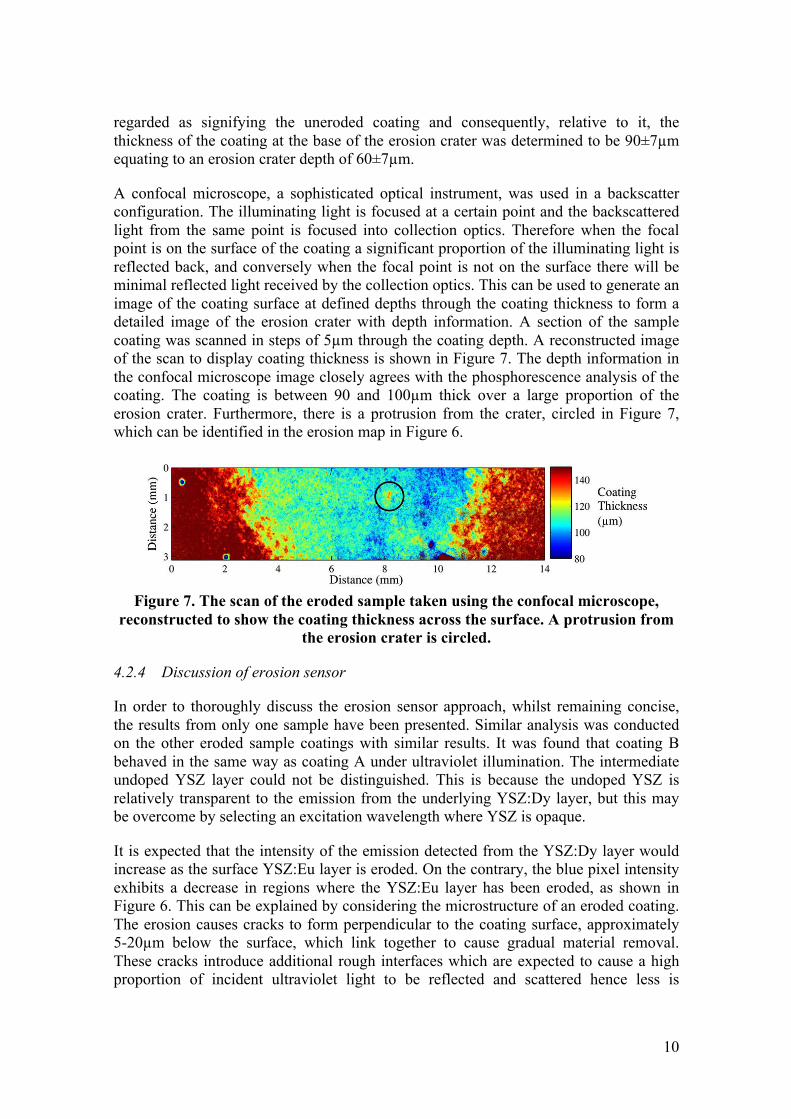
A confocal microscope, a sophisticated optical instrument, was used in a backscatter configuration. The illuminating light is focused at a certain point and the backscattered light from the same point is focused into collection optics. Therefore when the focal point is on the surface of the coating a significant proportion of the illuminating light is reflected back, and conversely when the focal point is not on the surface there will be minimal reflected light received by the collection optics. This can be used to generate an image of the coating surface at defined depths through the coating thickness to form a detailed image of the erosion crater with depth information. A section of the sample coating was scanned in steps of 5µm through the coating depth. A reconstructed image of the scan to display coating thickness is shown in Figure 7. The depth information in the confocal microscope image closely agrees with the phosphorescence analysis of the coating. The coating is between 90 and 100µm thick over a large proportion of the erosion crater. Furthermore, there is a protrusion from the crater, circled in Figure 7, which can be identified in the erosion map in Figure 6.
Figure 7. The scan of the eroded sample taken using the confocal microscope,
reconstructed to show the coating thickness across the surface. A protrusion from the erosion crater is circled.
4.2.4 Discussion of erosion sensor
In order to thoroughly discuss the erosion sensor approach, whilst remaining concise, the results from only one sample have been presented. Similar analysis was conducted on the other eroded sample coatings with similar results. It was found that coating B behaved in the same way as coating A under ultraviolet illumination. The intermediate undoped YSZ layer could not be distinguished. This is because the undoped YSZ is relatively transparent to the emission from the underlying YSZ:Dy layer, but this may be overcome by selecting an excitation wavelength where YSZ is opaque.
It is expected that the intensity of the emission detected from the YSZ:Dy layer would increase as the surface YSZ:Eu layer is eroded. On the contrary, the blue pixel intensity exhibits a decrease in regions where the YSZ:Eu layer has been eroded, as shown in Figure 6. This can be explained by considering the microstructure of an eroded coating. The erosion causes cracks to form perpendicular to the coating surface, approximately 5-20µm below the surface, which link together to cause gradual material removal. These cracks introduce additional rough interfaces which are expected to cause a high proportion of incident ultraviolet light to be reflected and scattered hence less is

11
transmitted to the subsurface YSZ:Dy layer. This phenomenon may present an opportunity for these sensor coatings to be used to detect subsurface cracking.
5 Conclusions
Erosion indicating TBCs have been successfully produced by embedding distinct layers doped with either Eu3+ or Dy3+ ions into standard YSZ material. The coatings were deposited using a jumping beam EB-PVD and exhibit a continuous columnar structure, undisrupted by the addition of the doped layers.
A quantitative assessment of the erosion detection capability of the coatings has been conducted. The phosphorescence in the coating was excited and detected using off-the-shelf optical equipment. Analysis of the images using bespoke image processing enabled the erosion to be mapped with a depth resolution equivalent to the thickness of the sensor layers. The erosion measurements made through phosphorescence imaging have been successfully validated using both mechanical and optical devices.
The sensor coatings were tested and compared to standard YSZ material for their thermal stability. The doped coatings have an equivalent behaviour under thermal gradient cycling testing to the unmodified YSZ material. Furthermore, one of the sensor coating types has been successfully applied and tested on a Rolls-Royce VIPER test bed engine.
6 Acknowledgements
This work was conducted under the leadership of STS under a Centre for Defence Enterprise contract (RT/COM/7/069). Many thanks to the Surface Science and Engineering Centre at Cranfield University, particularly Prof. John Nicholls, for creating the coatings, Richard Wellman for conducting the erosion tests and to Centre for Gas Turbine Research for conducting the engine testing. Further thanks to Ken Keating for his assistance with the confocal microscopy and the Centre for Non-Destructive Evaluation for their support.
7 References
1. Wellman, R., M. Deakin, and J. Nicholls, 'The effect of TBC morphology on the erosion rate of EB PVD TBCs', Wear, 2005. 258(1-4): p. 349-356.
2. Wellman, R., G. Whitman, and J. Nicholls, 'CMAS corrosion of EB PVD TBCs: Identifying the minimum level to initiate damage', International Journal of Refractory Metals and Hard Materials, 2010. 28(1): p. 124-132.
3. Mercer, C., et al., 'A delamination mechanism for thermal barrier coatings subject to calcium-magnesium-alumino-silicate (CMAS) infiltration', Acta materialia, 2005. 53(4): p. 1029-1039.
4. Drexler, J.M., et al., 'Jet Engine Coatings for Resisting Volcanic Ash Damage', Advanced Materials, 2011.
5. Liu, Y., et al., 'La2O3-modified YSZ coatings: High-temperature stability and improved thermal barrier properties', Surface and Coatings Technology, 2009. 203(8): p. 1014-1019.
12
6. Guo, S. and Y. Kagawa, 'Isothermal and cycle properties of EB-PVD yttria-partially-stabilized zirconia thermal barrier coatings at 1150 and 1300 C', Ceramics international, 2007. 33(3): p. 373-378.
7. Amano, K., et al., 'Thermal barrier coating', US Patent No. 4,774,150, 1988. 8. Choy, K.L., A. Heyes, and J. Feist, 'Thermal Barrier Coating with
Thermoluminescent Indicator Material Embedded Therein', WO Patent WO/2000/006,796, 2000.
9. Feist, J. and A. Heyes, 'Europium-doped yttria-stabilized zirconia for high-temperature phosphor thermometry', Proceedings of the Institution of Mechanical Engineers, Part L: Journal of Materials: Design and Applications, 2000. 214(1): p. 7-12.
10. Heyes, A., S. Seefeldt, and J. Feist, 'Two-colour phosphor thermometry for surface temperature measurement', Optics & Laser Technology, 2006. 38(4-6): p. 257-265.
11. Feist, J.P., Heyes, A. L., 'Photo-Stimulated Phosphorescence for Thermal Condition Monitoring and Nondestructive Evaluation in Thermal Barrier Coatings', Heat Transfer Engineering, 2009. 30(13): p. 1087-1095.
12. Gentleman, M. and D. Clarke, 'Concepts for luminescence sensing of thermal barrier coatings', Surface and Coatings Technology, 2004. 188: p. 93-100.
13. Eldridge, J.I., J. Singh, and D.E. Wolfe, 'Erosion Indicating Thermal Barrier Coatings Using Luminescent Sublayers', Journal of the American Ceramic Society, 2006. 89(10): p. 3252-3254.
14. Solé, J.G., et al., 'An introduction to the optical spectroscopy of inorganic solids'. 2005: Wiley Online Library.
15. Blasse, G.a.G., B.C., Luminescent Materials. 1994: Springer-Verlag Telos. 16. Chen, X., et al., 'Industrial Sensor TBCs: Studies on temperature detection and
durability', International Journal of Applied Ceramic Technology, 2005. 2(5): p. 414-421.
17. Heyes, A., 'On the design of phosphors for high-temperature thermometry', Journal of Luminescence, 2009. 129(12): p. 2004-2009.
18. Wellman, R., J. Nicholls, and K. Murphy, 'Effect of microstructure and temperature on the erosion rates and mechanisms of modified EB PVD TBCs', Wear, 2009. 267(11): p. 1927-1934.
19. Steenbakker, R., R. Wellman, and J. Nicholls, 'Erosion of gadolinia doped EB-PVD TBCs', Surface and Coatings Technology, 2006. 201(6): p. 2140-2146.
20. Stöver, D., et al., 'New material concepts for the next generation of plasma-sprayed thermal barrier coatings', Journal of thermal spray technology, 2004. 13(1): p. 76-83.
21. Vaßen, R., et al., 'Overview on advanced thermal barrier coatings', Surface and Coatings Technology, 2010. 205(4): p. 938-942.
22. Evans, A.G., et al., 'Mechanisms controlling the durability of thermal barrier coatings', Progress in Materials Science, 2001. 46(5): p. 505-553.
23. Padture, N.P., M. Gell, and E.H. Jordan, 'Thermal barrier coatings for gas-turbine engine applications', Science, 2002. 296(5566): p. 280-284.
24. Feist, J.P., 'Unpublished results'. 25. Feist, J.P., et al., 'Application of an industrial sensor coating system on a Rolls-
Royce jet engine for temperature detection', Proceedings of the 6th Conference of the Institute of Diesel and Gas Turbine Engineers IDGTE, 2011.