quantitative genetics.pdf
TRANSCRIPT

Conifer Translational Genomics Network
Coordinated Agricultural Project
www.pinegenome.org/ctgn
Genomics in Tree Breeding and
Forest Ecosystem Management
-----
Module 4 – Quantitative Genetics
Nicholas Wheeler & David Harry – Oregon State University

www.pinegenome.org/ctgn
Quantitative genetics
“Quantitative genetics is concerned with the inheritance of those
differences between individuals that are of degree rather than of
kind, quantitative rather than qualitative.” Falconer and MacKay,
1996
Addresses traits such as
– Growth, survival, reproductive ability
– Cold hardiness, drought hardiness
– Wood quality, disease resistance
– Economic traits! Adaptive traits! Applied and evolutionary
Genetic principles
– Builds upon both Mendelian and population genetics
– Not limited to traits influenced by only one or a few genes
– Analysis encompasses traits affected by many genes
www.pinegenome.org/ctgn
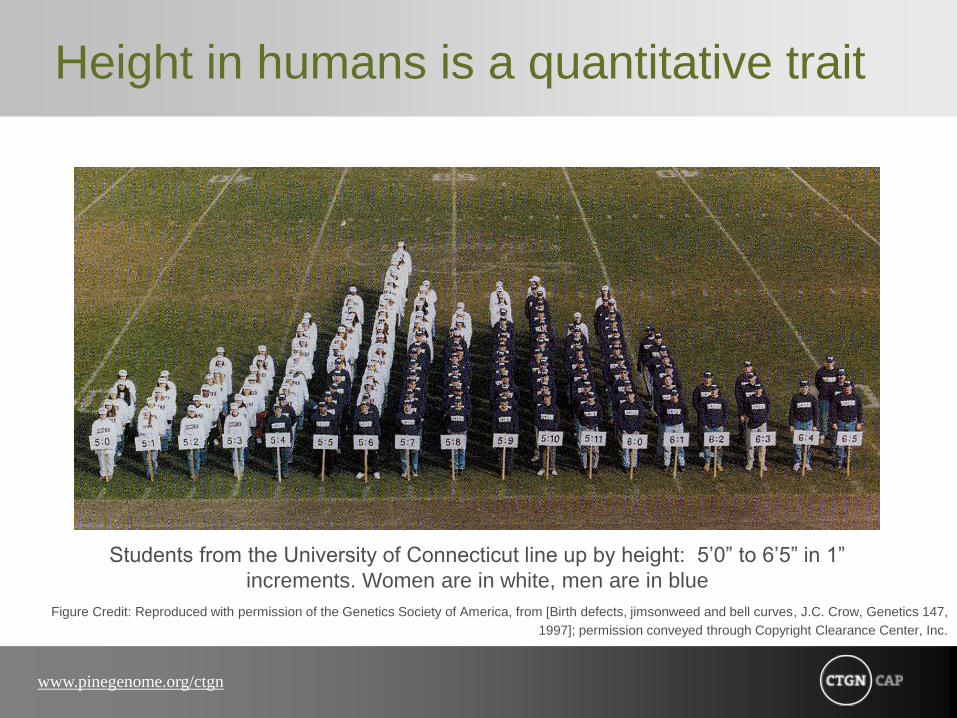
Height in humans is a quantitative trait
Students from the University of Connecticut line up by height: 5’0” to 6’5” in 1”
increments. Women are in white, men are in blue
Figure Credit: Reproduced with permission of the Genetics Society of America, from [Birth defects, jimsonweed and bell curves, J.C. Crow, Genetics 147,
1997]; permission conveyed through Copyright Clearance Center, Inc.

www.pinegenome.org/ctgn
Quantitative genetics
Describes genetic variation based on phenotypic resemblance
among relatives
Is usually the primary genetic tool for plant and animal breeding
Provides the basis for evaluating the relative genetic merit of
potential parents
Provides tools for predicting response to selection (genetic gain)
How can we explain the continuous variation of metrical traits in
terms of the discontinuous categories of Mendelian inheritance?
– Simultaneous segregation of many genes
– Non-genetic or environmental variation (truly continuous effects)

www.pinegenome.org/ctgn
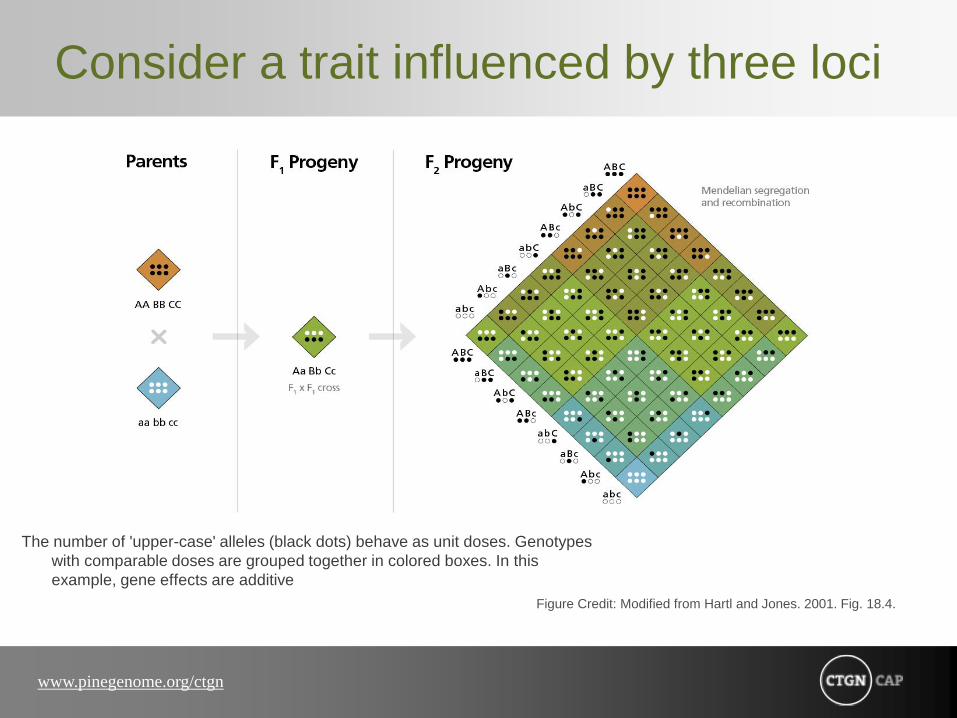
Consider a trait influenced by three loci
The number of 'upper-case' alleles (black dots) behave as unit doses. Genotypes
with comparable doses are grouped together in colored boxes. In this
example, gene effects are additive
Figure Credit: Modified from Hartl and Jones. 2001. Fig. 18.4.

www.pinegenome.org/ctgn
Phenotypes
Phenotypic categories from
the previous slide are
represented here in the
histogram
Figure Credit: Modified from Hartl and Jones. 2001. Fig. 18..5
www.pinegenome.org/ctgn
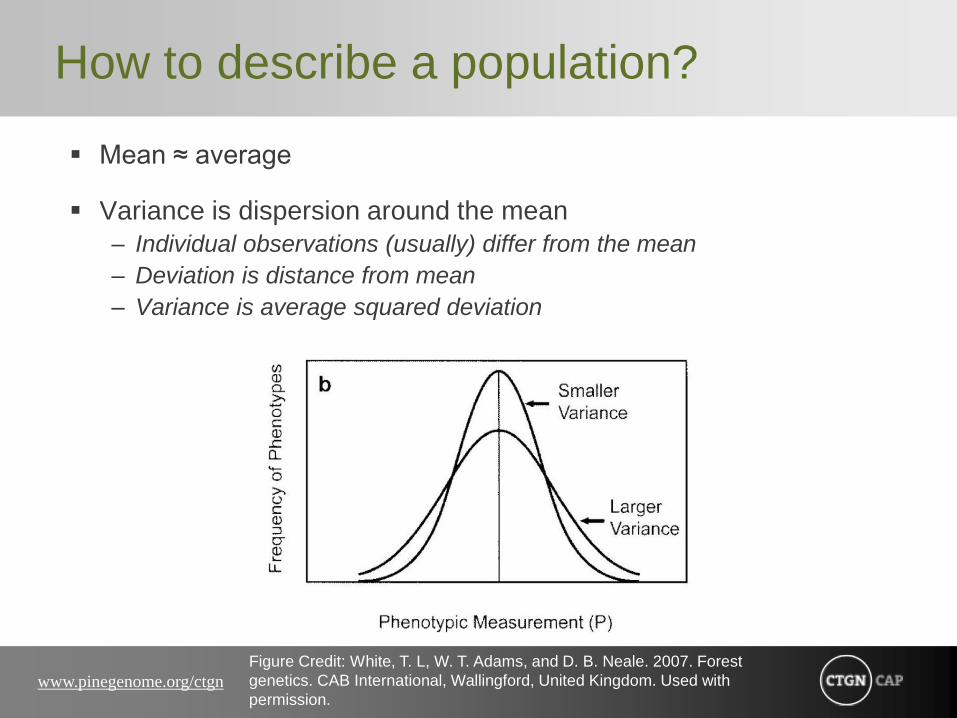
How to describe a population?
Mean ≈ average
Variance is dispersion around the mean
– Individual observations (usually) differ from the mean
– Deviation is distance from mean
– Variance is average squared deviation
Figure Credit: White, T. L, W. T. Adams, and D. B. Neale. 2007. Forest
genetics. CAB International, Wallingford, United Kingdom. Used with
permission.
www.pinegenome.org/ctgn
Population properties for metric traits
Means, variances, covariances
Measuring variation within and among families allows estimation
of genetic and environmental variance components
Phenotypic resemblance among relatives allows estimation of
trait heritability, parental breeding values, genetic correlations
among traits, and so forth

www.pinegenome.org/ctgn
Properties of genes
Gene action (dominance, additive) – Allelic interactions at a locus
Epistasis – Non-allelic interactions
Pleiotrophy – Allelic effects on multiple traits
Linkage

www.pinegenome.org/ctgn
Phenotypic expression of a metrical trait
Figure Credit: White, T. L, W. T. Adams, and D. B. Neale. 2007. Forest genetics. CAB International, Wallingford, United Kingdom.
Used with permission.

www.pinegenome.org/ctgn
Partitioning phenotypic variance
The phenotypic variance among individual trees in a reference
population for a given trait, σ2p, is derived as
Where
– µ = Pop mean = constant, with 0 variance
– A = Additive genetic variance (breeding value)
– I = Non-additive genetic variance
– E = Environmental variance
Var (P) = Var (µ) + Var (A) + Var (I) + Var (E)
Or
σ2p = σ2
A +σ2I +
σ2E

www.pinegenome.org/ctgn
Non-additive genetic variance
Dominance variance
– Genetic variance at a single locus attributable to dominance of one
allele over another
Epistatic variance
– The masking of the phenotypic effect of alleles at one gene by alleles of
another gene. A gene is said to be epistatic when its presence
suppresses or obscures the effect of a gene at another locus
σ2I = σ2
D + σ2Є

www.pinegenome.org/ctgn
Breeding value (additive genetic value)
Breeding value is a concept associated with parents in a sexually
breeding population. The sum of all average allelic effects at all loci
influencing the trait of interest
– Alleles, not genotypes, are passed on to the next generation
Historically, average allelic effects could not be measured. With the
ability to identify allelic states at the molecular level, we can now
obtain estimates of allelic effects in controlled experiments
– The relevance of this extends beyond tree improvement to management
of natural populations

www.pinegenome.org/ctgn
Heritability
A measure of the degree to which the variance in the
distribution of a phenotype is due to genetic causes
In the narrow sense, it is measured by the genetic variance due to
additive effects divided by the total phenotypic variance
In the broad sense, heritability is measured by the total genetic
variance divided by the total phenotypic variance
Heritability is mathematically defined in terms of population variance
components. It can only be estimated from experiments that have a
genetic structure: Sexually produced offspring in this case

www.pinegenome.org/ctgn
More h2
Thus, narrow sense heritability can be written as
Where
– σ2A is the additive genetic variance (variance among breeding values in
a reference population)
– σ2I is the interaction or non-additive genetic variance (which includes
both dominance variance and epistatic variance)
– σ2E is the variance associated with environment
h2 = σ2A/ (σ2
A + σ2I +
σ2E)

www.pinegenome.org/ctgn
Broad sense heritability (H2, or h2b)
Broad sense heritability is used when we deal with clones! Clones
can capture all of genetic variance due to both the additive breeding
value and the non-additive interaction effects. Thus,
Consequently, broad sense heritability is typically larger than
narrow sense heritability and progress in achieving genetic gain can
be faster when clonal selection is possible. What might be a
drawback to clonal based programs?
H2 = (σ2A + σ2
I) / (σ2
A + σ2I +
σ2E)
www.pinegenome.org/ctgn
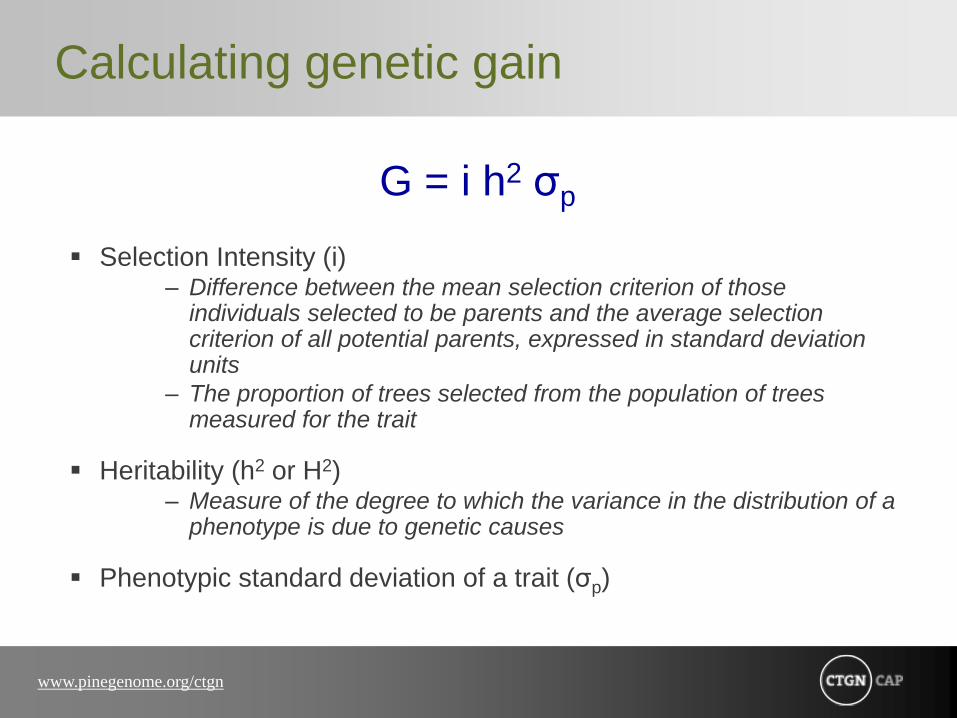
Calculating genetic gain
Selection Intensity (i) – Difference between the mean selection criterion of those
individuals selected to be parents and the average selection criterion of all potential parents, expressed in standard deviation units
– The proportion of trees selected from the population of trees measured for the trait
Heritability (h2 or H2) – Measure of the degree to which the variance in the distribution of a
phenotype is due to genetic causes
Phenotypic standard deviation of a trait (σp)
G = i h2 σp

www.pinegenome.org/ctgn
A little more on selection intensity
The factor most under
breeder’s control
i increases as the fraction of
trees selected decreases
Figure Credit: White, T. L, W. T. Adams, and D. B. Neale. 2007. Forest genetics. CAB International, Wallingford, United Kingdom. Used with permission.

www.pinegenome.org/ctgn 20
Predicting genetic gain
Get more gain by selecting a smaller proportion of the population (increased i)
Get more gain by controlling the
environmental variation and
increasing h2
Gain = h2 (selection differential)selection differential = i σP
Gain = h2 i σP
www.pinegenome.org/ctgn
Including more traits
How do the models change as we examine more traits?
Additional consideration must be paid to
– Genetic correlations

www.pinegenome.org/ctgn
Genetic correlations
Correlations in phenotype
– May be due to genetic or environmental causes
– May be positive or negative
Genetic causes may be due to
– Pleiotropy
– Linkage
– Gametic phase disequilibrium
The additive genetic correlation (correlation of breeding values) is
of greatest interest to plant breeders
– Genetic correlation usually refers to the additive genetic correlation (rG
is usually rA )

www.pinegenome.org/ctgn
Selection
Using genetic markers (marker informed breeding) to facilitate
selection of the best individuals requires a working knowledge of
other concepts
– Indirect selection and correlated response to selection
– Multi-trait selection

www.pinegenome.org/ctgn
Indirect selection
Indirect selection occurs when individuals are selected on the measurements of one trait (Y) and gain is predicted for a second, or target, trait (X). Gain from indirect selection is estimated as
Where
– iy = selection intensity of the measured trait
– rg,xy = the genetic correlation between measured and target traits
– h = square root of the heritability of traits x and y
– σpx = phenotypic standard deviation of the target trait
All terms are unitless except the last, so predicted gain is given in terms of the target trait
Gx = iy * rg,xy * hxhy * σpx

www.pinegenome.org/ctgn
Indirect selection is better when…
To compare the relative effectiveness of indirect and direct selection
we compare the ratio of gains from the two approaches
Dependent on size and sign of genetic correlation (r)
When selection intensity is greater for measured trait (i)
When heritability of measured trait is higher (hy )
Cost/Time considerations
= (iy * rg,xy * hxhy * σpx) / ( ix * h2
x * σpx )
= rg,xy (iy / ix )(hy / hx), therefore

www.pinegenome.org/ctgn
Strategies for multiple trait selection
We often wish to improve more than one trait at a time
Traits may be correlated or independent from each other
Options…
– Independent culling
– Tandem selection
– Index selection

www.pinegenome.org/ctgn
Strategies for multiple trait selection
Figure credits: Jennifer Kling, Oregon State University
Independent culling Tandem selection
0
1
2
3
4
5
6
7
8
9
10
0 1 2 3 4 5 6 7 8 9 10
Trait XTra
it Y
0
1
2
3
4
5
6
7
8
9
10
0 1 2 3 4 5 6 7 8 9 10
Trait X
Tra
it Y

www.pinegenome.org/ctgn
Selection indices
Values for multiple traits are incorporated into a single index value
for selection
Figure credit: Jennifer Kling, Oregon State University
0
1
2
3
4
5
6
7
8
9
10
0 1 2 3 4 5 6 7 8 9 10
Trait X
Tra
it Y
www.pinegenome.org/ctgn
Estimating variance components, genetic
parameters, and breeding values
Mixed models – genetic effects considered random
GLS – (Generalized Least Squares) for estimating fixed effects
(called BLUE)
REML (Restricted Maximum Likelihood) for estimating variance
components of random effects
Additive genetic relationship matrix
BLUP (Best Linear Unbiased Prediction) for estimating breeding
values. Selection Indices are a special case of BLUP

www.pinegenome.org/ctgn
Estimating a tree’s genotype
Historically through evaluation trials of phenotypic traits
As genomics tools and platforms have developed, we are more
seriously evaluating the potential of genetic markers to augment
phenotypic assessments
– QTL mapping in pedigreed populations
– Association genetics
How might marker data be incorporated in breeding?
– BLUP – selection index
– Additive genetic relationship matrix
– Program management applications
– Genomic selection
www.pinegenome.org/ctgn
References cited
Crow, J. F. 1997. Birth defects, jimsonweed and bell curves.
Genetics 147: 1-6.
Falconer, D. S., and T.F.C. Mackay. 1996. Introduction to
quantitative genetics. Longman, Essex, England.
Hartl, D. L., and E. W. Jones. 2001. Genetics: Analysis of genes
and genomes, 5th edition. Jones and Barlett, Sudbury, MA.
Pierce, B. 2010. Genetics essentials: Concepts and connections, 1st
edition. W.H. Freeman and Co, New York.
White, T. L, W. T. Adams, and D. B. Neale. 2007. Forest genetics.
CAB International, Wallingford, United Kingdom. Available online at:
http://bookshop.cabi.org/?page=2633&pid=2043&site=191 (verified
27 May 2011).

www.pinegenome.org/ctgn
Thank You. Conifer Translational Genomics Network
Coordinated Agricultural Project