quantitative data analysis - wordpress.com · 07/12/16 1 quantitative data analysis sociological...
TRANSCRIPT

07/12/16
1
QUANTITATIVE DATA ANALYSIS Sociological Research Methods
Why analyze data? • Describe population of interest
• Explain the relationship between variables
• Figure out the answer to your research question
Survey about religious beliefs • Q1: What is your gender?
• Male • Female
• Q2: What is your age? • ____ (0 – 100+)
• Q3: Indicatelevelofagreementwiththefollowingstatement.
StronglyAgree Agree Neutral Disagree Strongly
DisagreeIbelievethatheavenandhellexists

07/12/16
2
Survey about religious beliefs § How often do you attend religious services?
§ Never § About once or twice a year § Several times a year § About once a month § 2-3 times a month § Nearly every week § Every week § Several times a week § Don’t know, No answer
Getting Started § Everything must be quantified
§ Transform all responses into a numeric value
§ Respondent’s answers must be quantified § Assign a numerical value to the respondent’s answer to each
survey question § Question measured at the nominal and ordinal levels
§ Questions measured at the ratio and interval level already numeric
Survey about religious beliefs • Q1: What is your gender?
• Male (1) • Female (0)
• Q2: What is your age? • ____ (0 – 100+)
(already a numeric value)
• Q3: Indicatelevelofagreementwiththefollowingstatement.
StronglyAgree(1) Agree(2) Neutral(3) Disagree(4) Strongly
Disagree(5)Ibelievethatheavenandhellexists

07/12/16
3
Quantifying the responses • How often do you attend
religious services? • Never (0) • About once or twice a year (1) • Several times a year (2) • About once a month (3) • 2-3 times a month (4) • Nearly every week (5) • Every week (6) • Several times a week (7) • Don’t know, No Answer (8)
§ Could have chosen any numeric value to represent the respondent’s answer § Remain consistent
§ Choose the same numeric scheme for all Likert questions
Organizing the data § Use the numeric values to organize the survey data
§ Spreadsheet format § Rows: one respondent § Columns: one variable
Survey of religious beliefs Respondent Gender Age Belief Attendance
1 0 25 3 0
2 0 32 5 1
3 0 68 1 5
4 0 75 1 6
5 0 29 5 2
6 0 25 4 3
7 1 32 2 5
8 1 25 2 5
9 1 54 1 8
10 1 36 5 9

07/12/16
4
Analyzing the data • Once data is organized, analysis can begin • Univariate analysis
• Analyze one variable • Frequency • Averages • Standard deviation
• Bivariate analysis • Analyze two variables
• Cross-tabulations • Correlations • Mean comparisons
Frequencies (the number of times an attribute was observed)
Frequencies
07/12/16
5
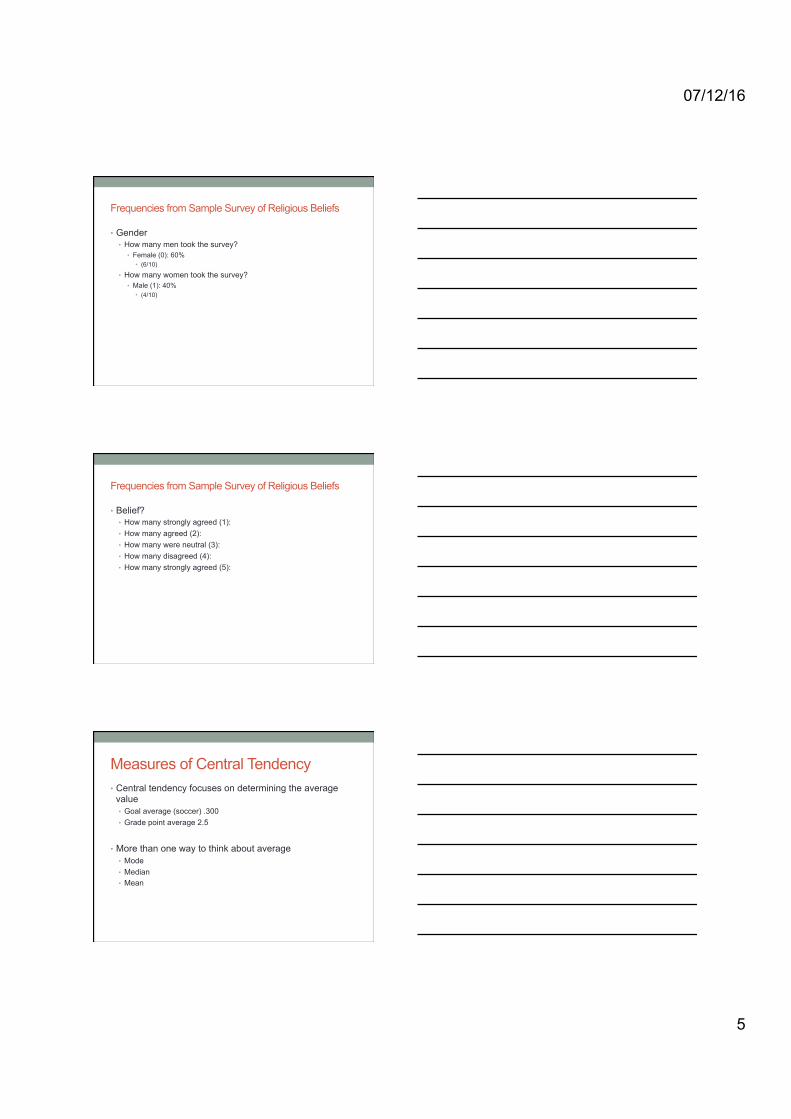
Frequencies from Sample Survey of Religious Beliefs
• Gender • How many men took the survey?
• Female (0): 60% • (6/10)
• How many women took the survey? • Male (1): 40%
• (4/10)
Frequencies from Sample Survey of Religious Beliefs
• Belief? • How many strongly agreed (1): • How many agreed (2): • How many were neutral (3): • How many disagreed (4): • How many strongly agreed (5):
Measures of Central Tendency • Central tendency focuses on determining the average
value • Goal average (soccer) .300 • Grade point average 2.5
• More than one way to think about average • Mode • Median • Mean

07/12/16
6
Measures of Central Tendency • Mode
• Response that occurs most frequently • If all responses occur with the same frequency, there is no mode
• Can have more than one mode • Some responses may tie for most frequently occurring
Mode of Age in Survey of Religious Beliefs
Respondent Age Frequency 25 3 29 1 32 2 36 1 54 1 68 1 75 1
What if… Respondent Age Frequency
25 2 29 2 32 2 36 1 54 1 68 1 75 1

07/12/16
7
What if… Respondent Age Frequency
25 1 29 1 32 1 36 1 54 1 68 1 75 1
Measures of Central Tendency § Median
§ Middle response in an ordered list
§ If number of responses is odd, median is exactly in the middle
§ If number of responses is even, median is the mean of the two in the middle
Median age in survey of religious beliefs
§ Finding the middle response § Same number of
responses above and below
§ Calculating the median?
Respondent ID Respondent Age 1 25 2 25 3 25 4 29 5 32 6 32 7 36 8 54 9 68
10 75

07/12/16
8
What if… • Finding the middle response • Same number of
responses above and below
• The median?
Respondent ID Respondent Age 1 25 2 25 3 25 4 29 5 32 6 34 7 36 8 54 9 68
10 75 11 89
Measures of Central Tendency § Mean
§ Most common measure of central tendency
§ Sum of the responses divided by the number of responses
Mean of Age in Survey of Religious Beliefs
§ Sum of the responses: § 25+25+25+29+32+32+36+54+68+75 = 401
§ Number of responses: § 10
§ Mean: 401/10 = 40.10

07/12/16
9
Which Measure of Central Tendency is Appropriate?
• Interval and ratio measures • Mean most appropriate
• Average age, weight, hours studied, hours spent watching televisions
• Sometimes median more appropriate (when you have extreme values (outliers)) • Median house price • Median wage
• Ordinal • Mode appropriate at times
• Most people strongly agree • Median appropriate at times
• How does the middle person feel
Which measure of central tendency is appropriate?
• Nominal measures; where you can’t logically order the responses (blue eyes not inherently better than green eyes) • Mode most appropriate
• Most respondents were women
Codebook Variable:Gender
Ques0on:Whatisyourgender?
AIributes NumericCode Frequency CentralTendency
Female 0.00 6 0.00(Mode)
Male 1.00 4
• Codebook: document that describes the contents, structure, and layout of a data collection. • Should contain information
intended to be complete and self-explanatory for each variable in a data file.
• Serves as a guideline for the researcher who collected the dataset, and those who use the dataset once it is collected.

07/12/16
10
Mishaps in Quantitative Analysis • Focused on perfect scenario
• Each respondent provides complete information
• What about missing data? • What if the respondents do not report all the information we ask
them for. • How does each item we discussed earlier, change if data are
missing?
Missing Data • Why would some data be missing?
• Contingency questions • If respondent answers no, data for questions 14 – 25 are missing
• This is foreseeable “missing data”
Missing Data • Why would some data be missing?
• Respondent does not provide answer • On purpose: refuse to give information • By mistake: missed a question
• Don’t want to disregard entire survey • Use what you can, treat the rest as missing

07/12/16
11
Spreadsheet with missing data Respondent Gender Age Belief Attendance
1 0 25 3 0 2 0 - 5 1 3 0 68 - 5 4 - 75 - 6 5 0 29 5 - 6 0 - 4 3 7 1 32 2 5 8 1 25 2 5 9 1 54 1 8
10 1 36 - 9
Need Numerical Code for Missing Data Variable:Gender
Ques0on:Whatisyour
gender?AIributes Numeric
CodeFrequency Central
TendencyMale 0.00 5 0.00
(Mode)Female 1.00 4
Missing 99.00 1
• 99 commonly used numeric code • Can be confusing if ‘99’ is a
possible value • Age • Income • Weight • Grade
• Choose a value • Remain consistent
Variable: Belief Question: Please indicate your level of agreement with the following statement: “I believe that heaven and hell exist”
Attributes Numeric Code Frequency
Strongly Agree 1 2
Agree 2 2
Neutral 3 1
Disagree 4 1
Strongly Disagree 5 2
Missing 99 3

07/12/16
12
Things to consider • Calculations of univariate statistics when missing data
• Don’t want to include missing data in calculations
• Mode • Don’t report missing data value as the mode
• Focus on most frequently occurring response of non-missing data
Reporting the Mode in Datasets with Missing Data
Variable: Belief Question: Please indicate your level of agreement with the following statement: “I believe that heaven and hell exist”
Attributes Numeric Code Frequency
Strongly Agree 1 2
Agree 2 2
Neutral 3 1
Disagree 4 1
Strongly Disagree 5 2
Missing 99 3
Calculating the Median in Datasets with Missing Data
• Median • Middle response
• If data are missing • No longer have 10 responses
• Middle response is no longer the average of 5th and 6th responses
• Median=(32+36)/2=34
Median (32+36)/2= 34
1 25 2 25 3 39 4 32 5 36 6 54 7 68 8 75 9 10

07/12/16
13
Calculating the Mean in Datasets with Missing Data
• Mean • Sum of responses divided by number of responses
• If data are missing • The number of responses should reflect this (we no longer have 10
responses- 2 are missing: have 8 responses)
• Mean age=(25+68+75+29+32+25+54+36)/8=344/8=43 (was 40.10 when we had 10 responses)
Collapsing Responses • Sometimes you want to combine attributes together
• Condense presentation of data • Make tables easier to understand
• Some attributes chosen relatively few times • Combine them with another attribute

07/12/16
14
Belief
TheOriginalData
Belief Frequency
Strongly Agree 2
Agree 2
Neutral 1
Disagree 1
Strongly Disagree 2
Missing 2
CollapsedData
Belief Frequency Agree, at least 4 Neutral 1 Disagree, at least 3 Missing 2
Bivariate Analysis • Analyzing two variables at once
• Trying to determine if an empirical relationship exists between the two • Independent & dependent variable
• Cross-tabulation (also known as contingency tables) • Represent relationships among variables as percentages
What conclusions could we make?

07/12/16
15
What conclusions could we make?
Steps Involved in Creating Crosstabs
• Choose two variables • Variables related to hypothesis and research question
• One independent • One dependent
• Analyze those instances when respondent provided information for both
• Collapse attribute categories • Tables best understood when variables are nominal or ordinal
Survey of religious beliefs & practices • Hypotheses
• Women are more religious than men. • As age increases, belief increases. • As age increases, attendance increases
• Can use crosstabs to investigate each

07/12/16
16
Focus on the Dimension of Belief
• Gender (IV), Belief (DV) • Both variables measured
at the nominal and ordinal level
Belief Men Women Strongly Agree 0 1 Agree 0 2 Neutral 1 0 Disagree 1 0 Strongly Disagree 2 0 Total 4 3
Using Counts to Construct Percentages Belief Men Women Strongly Agree
0 1
Agree 0 2 Neutral 1 0 Disagree 1 0 Strongly Disagree
2 0
Total 4 3
Belief Men Women Strongly Agree
0% 33.3%
Agree 0 66.7 Neutral 25 0 Disagree 25 0 Strongly Disagree
50 0
Total 100% 100%
Collapsing the Attributes Belief Men Women Agree, at least
0% 100%
Neutral 25 0% Disagree, at least
75 0%
Total 100% 100%
• What conclusions would you make?

07/12/16
17
What about interval and ratio variables? • Crosstabs easiest to understand if data presented in
nominal or ordinal level • Best to collapse interval and ratio data into nominal/ordinal
• Ex: As age increases belief increases • Age measured at ratio level
Collapsing age • How can you make an interval/ratio measure into a
nominal/ordinal measure? • Assign each response to a category
• Nominal: categories need to be exhaustive & mutually exclusive • Ordinal: categories need to be rank-order, exhaustive, & mutually
exclusive
• Creating a new variable • Collapsing an interval/ratio measure
RecallAge Belief Attendance
25 3 0
- 5 1
68 - 5
75 1 6
29 5 -
- 4 3
32 2 5
25 2 5
54 1 8
36 - 9
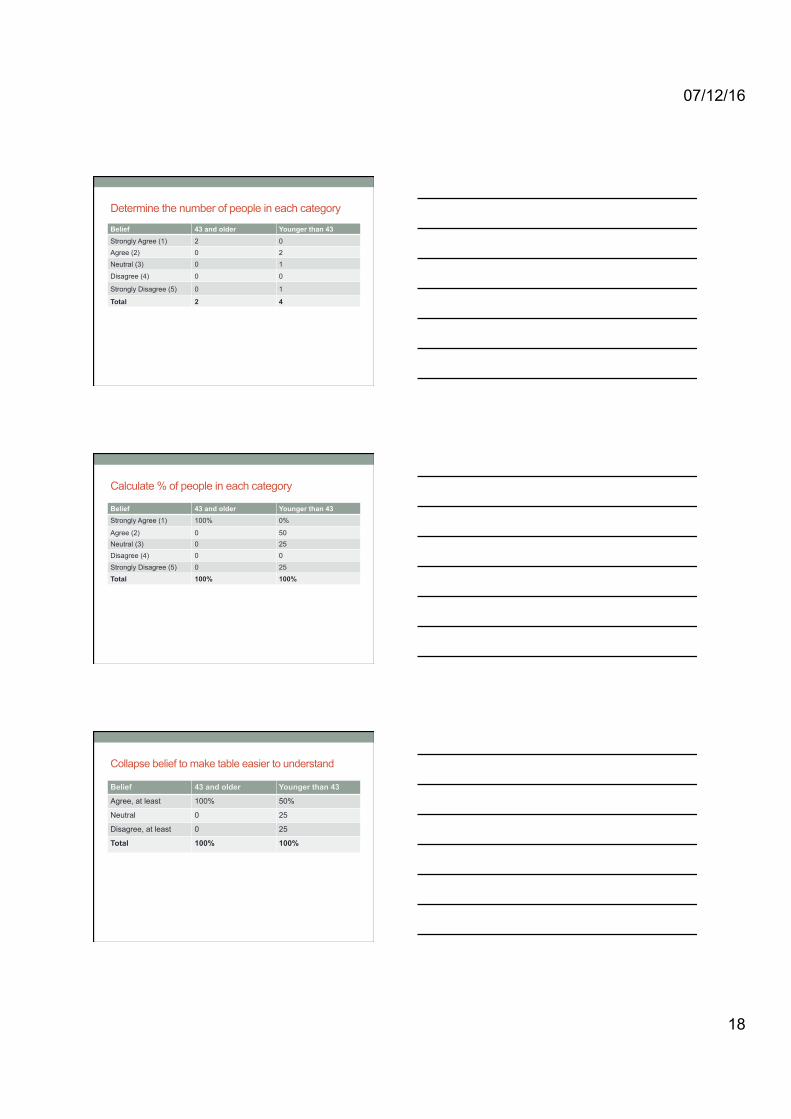
• Themeanagewas:43• Wecancategorizeeachpersonaccordingto• Youngerthan43• 43andolder
• Themedianagewas:34• Wecancategorizeeachpersonaccordingto• Youngerthan34• 34andolder
07/12/16
18
Determine the number of people in each category
Belief 43 and older Younger than 43 Strongly Agree (1) 2 0 Agree (2) 0 2
Neutral (3) 0 1
Disagree (4) 0 0
Strongly Disagree (5) 0 1
Total 2 4
Calculate % of people in each category
Belief 43 and older Younger than 43 Strongly Agree (1) 100% 0%
Agree (2) 0 50 Neutral (3) 0 25 Disagree (4) 0 0
Strongly Disagree (5) 0 25
Total 100% 100%
Collapse belief to make table easier to understand
Belief 43 and older Younger than 43
Agree, at least 100% 50%
Neutral 0 25
Disagree, at least 0 25
Total 100% 100%

07/12/16
19
As age increases attendance increases
Attendance ≥43 <43
Never (0) 0 1
Less than once a year (1) 0 0
Once or twice/year (2) 0 0
Several times/year (3) 0 0
Once a month (4) 0 0
2-3 times a month (5) 1 2
Nearly every week (6) 1 0
Every week (7) 0 0
Several times/week (8) 1 0
Don’t know (9) 0 1
Total 3 4
Attendance ≥43 <43
Never (0) 0% 25%
Less than once a year (1) 0 0
Once or twice/year (2) 0 0
Several times/year (3) 0 0
Once a month (4) 0 0
2-3 times a month (5) 33.3% 50%
Nearly every week (6) 33.3% 0
Every week (7) 0 0
Several times/week (8) 33.3% 0
Don’t know (9) 0 25
Total 100% 100%
CollapseaIendancetomaketableeasiertounderstand
Belief 43andolder Youngerthan43Onceamonthorless 0% 25%Morethanonceamonth
100% 50%
Don’tknow 0% 25%Total 100% 100%
Correlation • Another way to think about how to variables are related to
each other • How much of one variable (religious attendance) can the
other variable (age) can explain? • Correlation coefficient

07/12/16
20
Types of Correlation • Direct (positive) correlation
• One variable increases as the other one increases • One variable decreases as the other one decreases
• HINT: Both variables move in the same direction
• Indirect (negative) correlation • One variable decreases as the other one increases
• HINT: Variables move in opposite directions
• No correlation • Behavior of one variable is not affected by the behavior of the other
variable
https://www.youtube.com/watch?v=VFjaBh12C6s