quantitative applications of broadcast media weather radar data neil i. fox department of...
Post on 20-Dec-2015
217 views
TRANSCRIPT
QUANTITATIVE APPLICATIONS QUANTITATIVE APPLICATIONS OF BROADCAST MEDIA OF BROADCAST MEDIA WEATHER RADAR DATAWEATHER RADAR DATA
Neil I. FoxNeil I. FoxDepartment of Atmospheric Department of Atmospheric
ScienceScienceUniversity of Missouri-ColumbiaUniversity of Missouri-Columbia
Columbia, MOColumbia, MO
With thanks toWith thanks to
• Mike Roberts (KRCG – TV)Mike Roberts (KRCG – TV)– Also Matt Chambers and Kelly GreenAlso Matt Chambers and Kelly Green
• Stacy Allen (Premier Marketing Stacy Allen (Premier Marketing Group)Group)

ContentContent
• What’s the problem?What’s the problem?
• Why use media radars?Why use media radars?
• Why not use them?Why not use them?
• Let’s see an example!Let’s see an example!
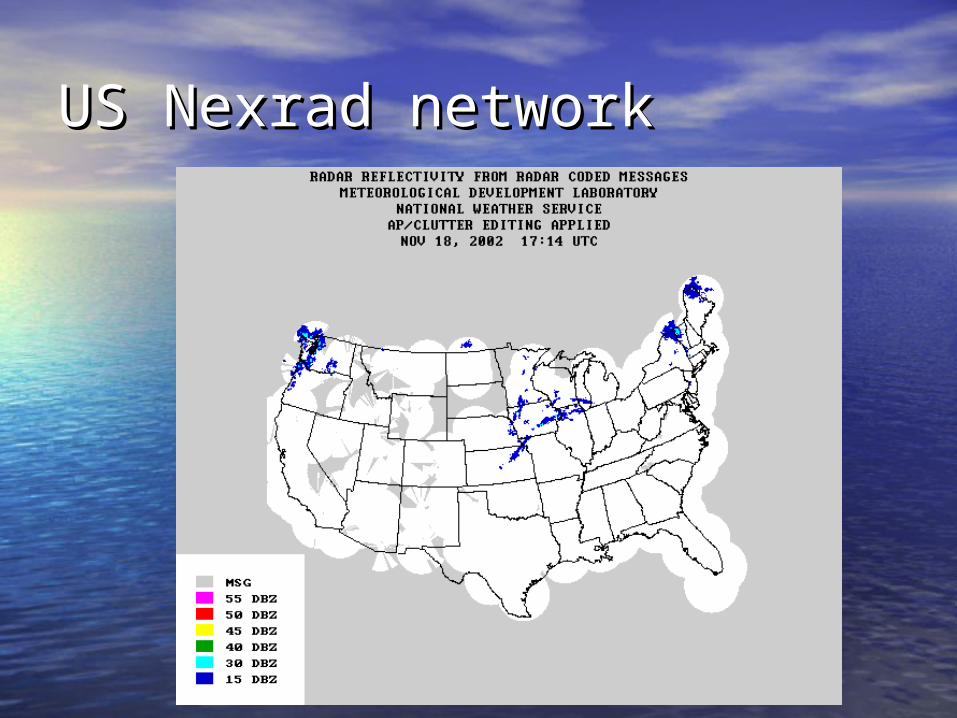
US Nexrad networkUS Nexrad network
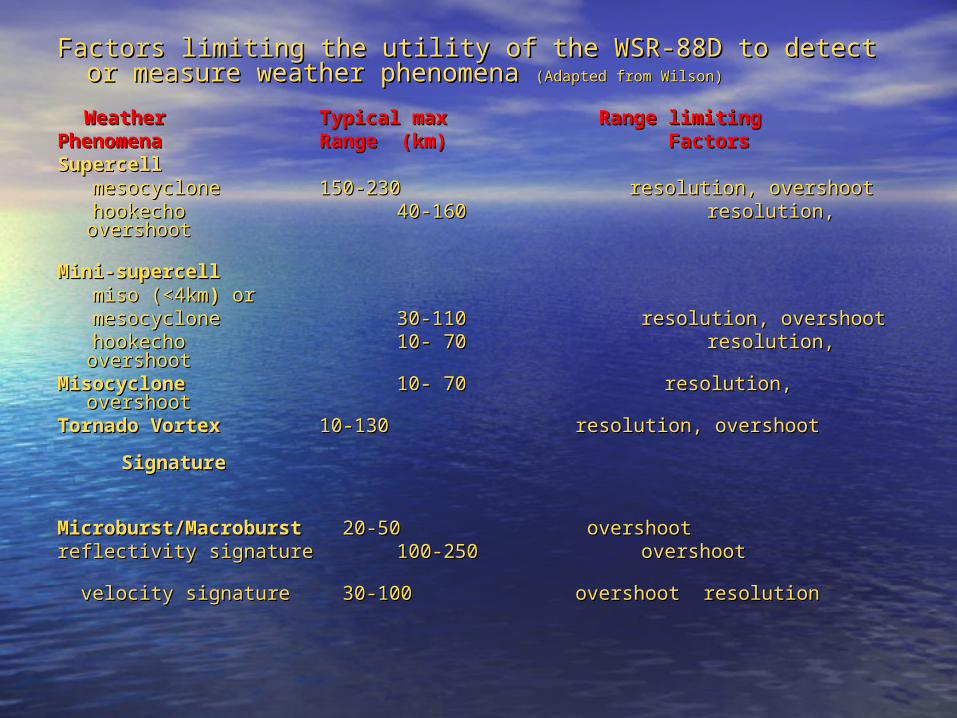
Factors limiting the utility of the WSR-88D to detect Factors limiting the utility of the WSR-88D to detect or measure weather phenomena or measure weather phenomena (Adapted from Wilson) (Adapted from Wilson)
Weather Weather Typical max Range limitingTypical max Range limitingPhenomena Phenomena Range (km) FactorsRange (km) FactorsSupercellSupercell mesocyclone mesocyclone 150-230 150-230 resolution, overshootresolution, overshoot hookecho hookecho 40-160 40-160 resolution, overshoot resolution, overshoot
Mini-supercellMini-supercell miso (<4kmmiso (<4km)) or or mesocyclone mesocyclone 30-110 resolution, overshoot30-110 resolution, overshoot hookecho hookecho 10- 70 10- 70 resolution, overshoot resolution, overshoot
Misocyclone Misocyclone 10- 70 resolution, overshoot 10- 70 resolution, overshoot Tornado VortexTornado Vortex 10-130 resolution, overshoot 10-130 resolution, overshoot
Signature Signature Microburst/MacroburstMicroburst/Macroburst 20-50 overshoot 20-50 overshoot reflectivity signature reflectivity signature 100-250 overshoot 100-250 overshoot velocity signature velocity signature 30-100 overshoot resolution 30-100 overshoot resolution
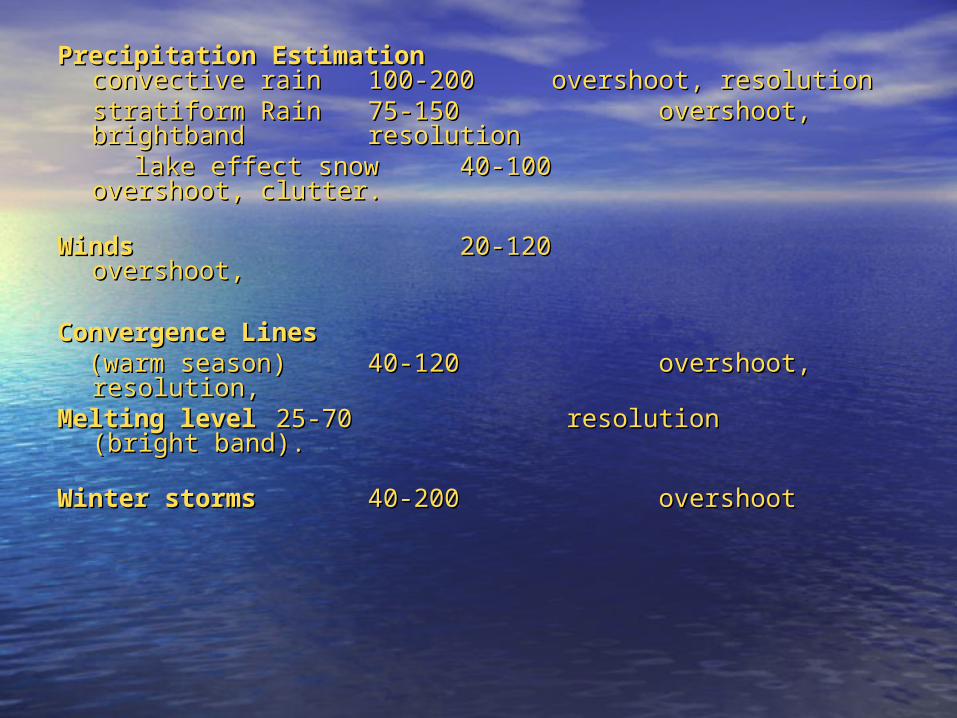
Precipitation EstimationPrecipitation Estimation convective rain convective rain 100-200 100-200 overshoot, overshoot, resolutionresolutionstratiform Rain stratiform Rain 75-150 overshoot, 75-150 overshoot, brightband brightband resolution resolution
lake effect snow lake effect snow 40-100 overshoot, 40-100 overshoot, clutter.clutter.
WindsWinds 20-120 overshoot, 20-120 overshoot,
Convergence LinesConvergence Lines (warm season) (warm season) 40-120 overshoot, 40-120 overshoot,
resolution, resolution, Melting levelMelting level 25-70 resolution 25-70 resolution
(bright (bright band). band).
Winter stormsWinter storms 40-200 overshoot 40-200 overshoot

Range related errors in Precip Range related errors in Precip estimationestimation

Relative Beam heightsRelative Beam heights
St Louis: KLSX
Fulton Pleasant Hill, KEAX
Not so simpleNot so simple
• Media radars usually don’t give a full Media radars usually don’t give a full volume scan, so we cannot say that volume scan, so we cannot say that information is ‘better’ (more useful) information is ‘better’ (more useful) even when beam is lower.even when beam is lower.
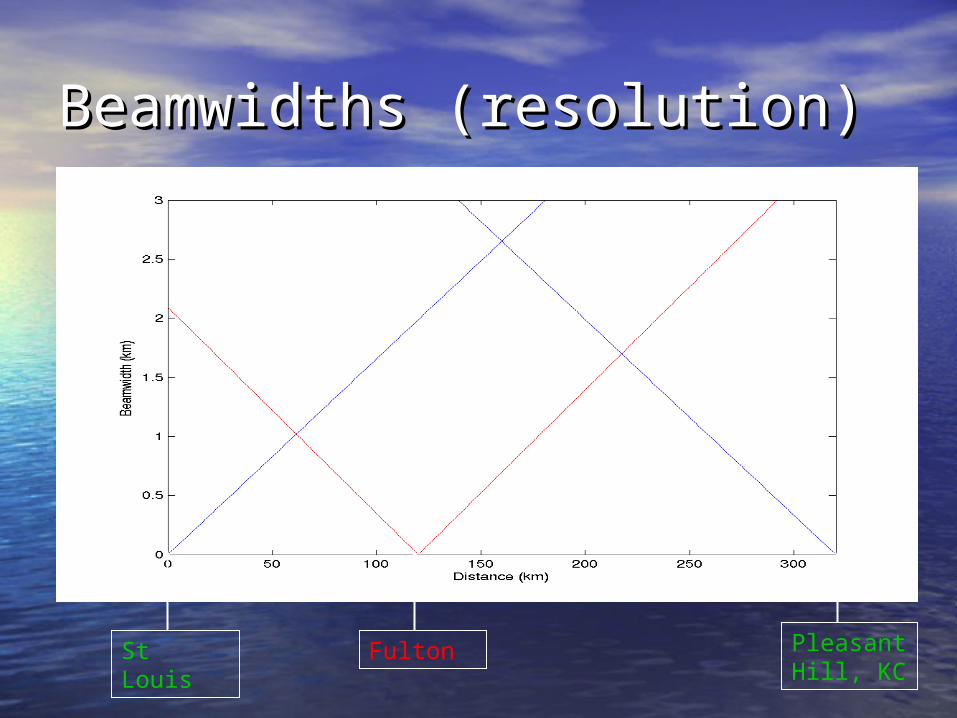
Beamwidths (resolution)Beamwidths (resolution)
St Louis Fulton Pleasant Hill, KC

Use of broadcast radarsUse of broadcast radars
• Regular low-level PPIRegular low-level PPI
• Flexibility when desiredFlexibility when desired– But must put broadcasters’ needs firstBut must put broadcasters’ needs first

Benefits to be gainedBenefits to be gained
• Low-level cold season precipLow-level cold season precip
• Low-level modification of warm Low-level modification of warm season precipitationseason precipitation
• Low-level and small-scale (high-Low-level and small-scale (high-resolution) rotationresolution) rotation
• BoundariesBoundaries
Low-level rotationLow-level rotation
• Ideally we want to observe this at Ideally we want to observe this at more than one elevation to confirm:more than one elevation to confirm:– That it’s realThat it’s real– That it has some vertical extentThat it has some vertical extent

LimitationsLimitations
• Quality ControlQuality Control
• CalibrationCalibration
• Staffing considerationsStaffing considerations
• Only PPIOnly PPI
Benefit to BroadcastersBenefit to Broadcasters
• PublicityPublicity
• Community serviceCommunity service
• Radar is not really used most of the Radar is not really used most of the timetime
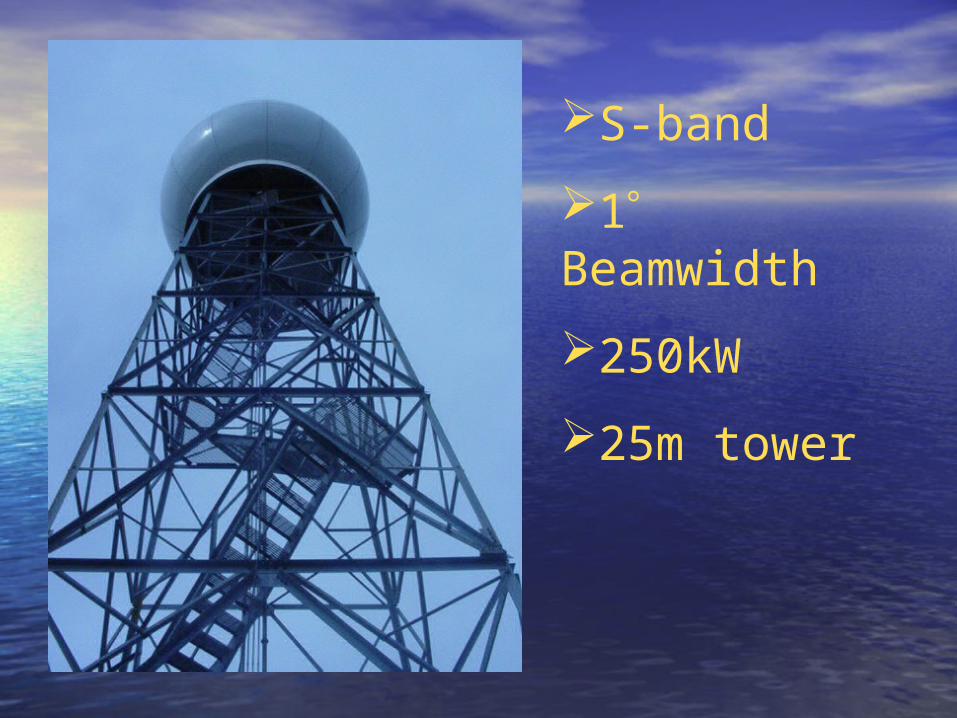
S-band
1 Beamwidth
250kW
25m tower

Example from the tornado Example from the tornado outbreak of 4 -10 May 2003outbreak of 4 -10 May 2003
• Numerous rotations spotted (and Numerous rotations spotted (and shown on TV) using the radar, but shown on TV) using the radar, but not detected by NWS radarsnot detected by NWS radars
• Some (small) hook echo features Some (small) hook echo features clearly observable were not so clear clearly observable were not so clear with NWS radar imagery with NWS radar imagery

CharitonChariton County is roughly 105 km from the radar County is roughly 105 km from the radar site in Fulton and the beam height is roughly 1550 site in Fulton and the beam height is roughly 1550 m. KEAX is 150 km: 2750 m. KLSX is 210 km away: m. KEAX is 150 km: 2750 m. KLSX is 210 km away:
4300 m.4300 m.
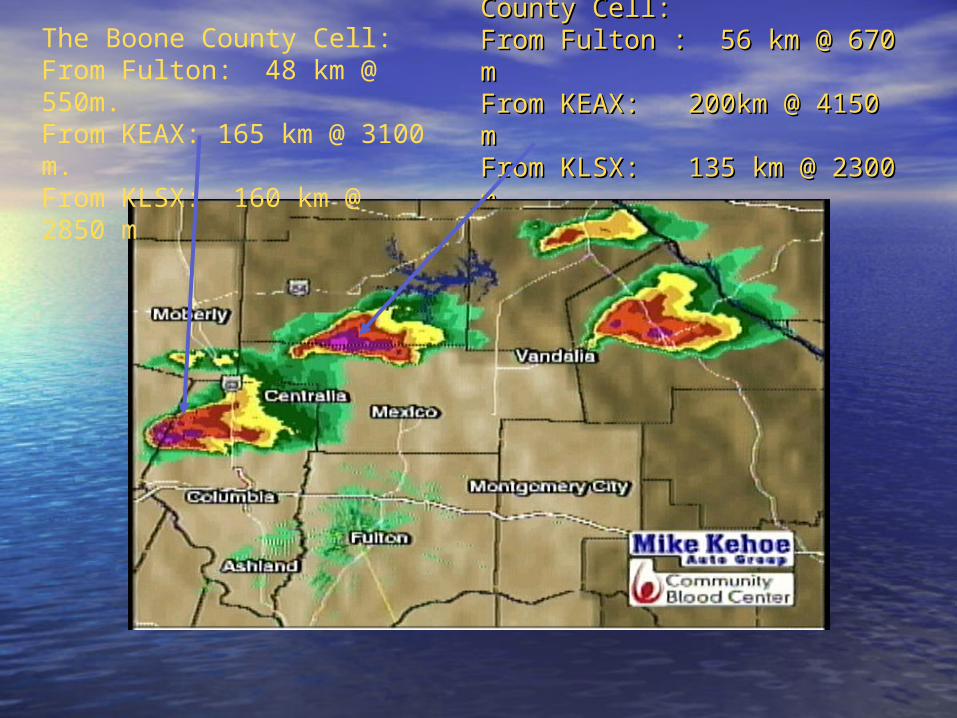
The Northern Audrain County The Northern Audrain County Cell:Cell:From Fulton : 56 km @ 670 mFrom Fulton : 56 km @ 670 mFrom KEAX: 200km @ 4150 From KEAX: 200km @ 4150 mmFrom KLSX: 135 km @ 2300 From KLSX: 135 km @ 2300 m.m.
The Boone County Cell:From Fulton: 48 km @ 550m.From KEAX: 165 km @ 3100 m.From KLSX: 160 km @ 2850 m

Not aloneNot alone
• Using the radar as a supplement to Using the radar as a supplement to NWS can provide valuable additional NWS can provide valuable additional informationinformation
• There’s a long way to go before we There’s a long way to go before we can integrate these datacan integrate these data
This winterThis winter
• Routine data collection (inc. Level II Routine data collection (inc. Level II CRAFT data)CRAFT data)
• Cold season precipitation Cold season precipitation comparisonscomparisons
• Assessment of potential benefits to Assessment of potential benefits to local interestslocal interests