quantifying wettability alteration … 52nd annual logging symposium, may 14-18, 2011 1 quantifying...
TRANSCRIPT

SPWLA 52nd Annual Logging Symposium, May 14-18, 2011
1
QUANTIFYING WETTABILITY ALTERATION DURING OIL-BASE MUD-FILTRATE INVASION AND CORRESPONDING EFFECTS ON
RESISTIVITY LOGS
Rohollah A. Pour, Carlos Torres-Verdín, and Kamy Sepehrnoori, The University of Texas at Austin
Copyright 2011, held jointly by the Society of Petrophysicists and Well Log Analysts (SPWLA) and the submitting authors.
This paper was prepared for presentation at the SPWLA 52nd Annual Logging Symposium held in The Colorado Springs, Colorado, United States, May 14-18, 2011.
ABSTRACT Resistivity logs acquired in hydrocarbon-bearing formations invaded by oil-base mud (OBM) often indicate abnormally high values of mobile water saturation. It is not possible to explain such abnormally high values of water saturation with saturation-height analysis. The common explanation invokes rock wettability alterations due to surfactants included in oil-base mud-filtrate (OBMF). A quantitative study is needed to explain whether interaction of OBMF surfactants with water-wetted grains can cause a sufficiently large increase in mobile water saturation in the near-wellbore region. We develop a new equation-of-state compositional simulator for near-wellbore applications. The simulator models the processes of mud-filtrate invasion and ensuing wettability alterations once emulsifiers included in OBMF make contact with grain surfaces. We assume a wettability alteration model in which the degree and type of alteration are governed by the pore-volume concentration of emulsifier in OBMF within the invaded formation. Sensitivity analyses on different mudcake properties quantify the effect of each mudcake property on the radial distributions of water saturation and electrical resistivity resulting from invasion. Simulation results confirm that irreducible water saturation decreases as grain surfaces make contact with OBMF emulsifiers. The reduction of irreducible water saturation causes a portion of connate water to become mobile, with the percentage of additional movable water depending on both type of mud-filtrate and degree of wettability alteration. It is found that additional movable water saturation released by wettability alteration can give rise to a radial annulus of abnormally low electrical resistivity. This behavior is consistent with observations
made of apparent resistivity logs acquired in OBMF invaded formations. Numerically simulated radial distributions of electrical resistivity also explain the separation of apparent resistivity logs often observed in hydrocarbon-saturated formations invaded with OBM. Comparison of radial profiles of electrical resistivity simulated for various rock types confirms that dynamic petrophysical properties of invaded formations can have a significant effect on the degree of wettability alteration due to OBMF. INTRODUCTION Oil-base mud (OBM) is increasingly being used to enhance the speed and efficiency of drilling, reduce borehole washouts, achieve better borehole control, and minimize the swelling of shales. Oil-based mud-filtrate is partially miscible with original (in-situ) fluid in the reservoir and often contains surfactants ─ cationic and anionic ─ to suspend fluid components in the additive mixture. Surfactants present in OBM wet the surface of rock cuttings and facilitate their removal from the wellbore. Sharma and Wunderlich (1985) studied wettability alterations due to water-base mud-filtrate invasion. From a series of experiments, they found that rock surfaces with a strongly oil-wet condition become less oil-wet after becoming in contact with water-base mud-filtrate. Later, Menezes et al (1989) investigated the mechanisms that change the wettability of sandstone after interaction with OBMF. Their experiments showed that contact angle and capillary pressure could change drastically after hydrocarbon components of OBM make contact with the rock surface. Ballard and Dawe (1988) studied the influence of surfactants in OBMF on the wettability of glass surfaces. They showed that even small concentrations of surfactants in mud filtrate could make rock surfaces to become more oil wet. They concluded that wettability alteration leads to a significant decrease in water saturation and found that irreducible water saturation tended to be lower for an oil-wet section than for a water-wet section.

SPWLA 52nd Annual Logging Symposium, May 14-18, 2011
2
Yan et al. (1993) implemented the combined Amott/USBM method to study alteration in rock surface wettability by calculating the variation of contact angle after OBMF made contact with the rock surface. They showed that some wetting agents such as EZ Mul1 and DV-332 could significantly change the rock’s wettability. More recently, Gambino et al. (2001) performed a series of experiments to study formation damage associated with invasion of mud filtrate. They investigated different mechanisms during drilling and cementing which led to formation damage. These mechanisms included wettability alteration, kaolinite migration, and precipitation of insoluble salt. There are some published studies about the effect of wettability alteration on well logs. Chen et al. (2004) and Shafer et al. (2004) found that NMR logs indicated that OBMF invasion changed the wettability of rock surfaces. They noted that cores which were at irreducible water saturation, SwirrSwirr, and were saturated with OBMF displayed much faster T1T1 and T2T2 relaxation times compared to those with bulk OBMF. It was also found that temperature had a negligible effect on relaxation times. They determined that fast relaxation times were due to changes in rock surface wettability in those cases where the rock became more oil wet. Salazar and Torres-Verdín (2009) compared radial distribution of fluid saturation associated with water-base mud (WMB) and OBM and showed that a water bank could develop in the radial profile of water saturation as a consequence of wettability alteration due to OBMF invasion. In this paper, we develop a compositional fluid flow simulator to study the effect of wettability alteration on the spatial distribution of fluid resulting from OBMF invasion. Compositional simulators are commonly developed based on an equation-of-state or the K-value approach. Methods used to formulate equation-of-state compositional simulators are divided into the following categories: (a) fully-implicit formulations, (b) IMPES-type formulations, (c) sequential-implicit compositional formulations, and (d) adaptive-implicit formulations. Simulations for near-wellbore problems are limited to a few days, whereby simulators based on IMPES-type formulations attain a satisfactory speed. Nghiem et al.’s (1981), Nghiem’s (1983), and Acs et al.’s (1985) formulations were among the first introduced to develop IMPES-type simulators. In our model, we use Acs et al.’s (1985) formulation for compositional simulators. Acs et al.’s pressure equation was derived based on the premise that the pore volume should be filled with the total volume of the fluid. Chang (1981)
1 An emulsifier and oil-wetting agent. 2 An oil-wetting agent.
and Chang et al. (1990) developed a similar algorithm to Acs et al.'s and implemented an efficient formulation for constructing the pressure matrix. Their simulator, UTCOMP, includes the case of four-phase flow. For the developments described in this paper, we assume that as many as three fluid phases may flow simultaneously (aqueous, oil, and gas) in invaded rock formations. After validation of the new developed simulator, we extend the modeling of mud-filtrate invasion using a method similar to that of Wu (2004), Lee (2008), Salazar and Torres-Verdín (2009), and Pour (2008), to describe mudcake growth in 2D and 3D models. The formulation is an extension of Pour’s (2008) method, which dynamically couples the process of mud-filtrate invasion to a compositional reservoir simulator. The new formulation includes a previously tested model for wettability alteration due to OBMF invasion. This combination enables us to simulate invasion with OBMF mixtures that contain surfactant components. PHYSICAL MODEL In the development of the current simulator, we make the following assumptions: (1) the reservoir is isothermal, (2) the reservoir is impermeable at a drainage radius, (3) there is no chemical reaction or precipitation between fluid and rock, (4) the formation is slightly compressible, (5) Darcy's law for multiphase flow is valid, and (6) there is no mass transfer from hydrocarbon components into the aqueous phase. The aqueous phase consists of only water and salt components. Moreover, the water component, with index nc + 1nc + 1 , does not affect phase behavior. In the formulation, there are hydrocarbon components with a maximum of three coexisting fluid phases. Appendix A describes the mathematical formulations behind the equation-of-state fluid flow simulator used for calculations presented this paper. MUDCAKE MODEL
Mud-filtrate invasion is a dynamic process in which mudcake thickness, mudcake permeability, and mudcake porosity vary with time of invasion. It is therefore necessary to couple a reliable model of mudcake growth with a fluid flow simulator which includes static and dynamic petrophysical properties. In doing so, we consider mudcake as a segment of the reservoir located at the borehole wall. Variation of mudcake properties leads to corresponding variations in fluid flow rate through mudcake. Mud filtrate invades the formation giving rise to spatial variations of

SPWLA 52nd Annual Logging Symposium, May 14-18, 2011
3
pressure and saturation in the near-wellbore region. Dewan and Chenevert (2001) performed laboratory experiments of WBM invasion to study both mudcake buildup and mud-filtrate invasion. They proposed that mudcake permeability and the pressure differential across the mudcake are related by the equation
kmc(t) = kmc0
P vmc(t)
;kmc(t) = kmc0
P vmc(t)
; (1)
where kmc0kmc0 is mudcake reference permeability, PmcPmc is mudcake pressure differential, and vv is a compressibility exponent which varies from 0.4 to 0.9. Moreover, Dewan and Chenevert (2001) introduced an expression for the time evolution of mudcake porosity, given by
Ámc(t) =Ámc0
P v¢±mc (t)
;Ámc(t) =Ámc0
P v¢±mc (t)
; (2)
where Ámc0Ámc0 is the mudcake reference porosity and ±± is
a multiplier for the porosity exponent which varies in the range from 0.1 to 0.2. It is assumed that solid particles in mud filtrate do not enter the formation. The time evolution of mudcake thickness is given by (Chin 1995) 2¼rmcdrmc =2¼rmcdrmc =
fs
(1 ¡ fs)[1 ¡ Ámc(t)]¢kmcPmcdt
¹f;
fs
(1 ¡ fs)[1 ¡ Ámc(t)]¢kmcPmcdt
¹f; (3)
where fsfs is mud solid fraction, rmcrmc is mudcake thickness, drmcdrmc is differential mudcake thickness, dtdt is differential time, and ¹ f¹ f is mud-filtrate viscosity. Previous methods (Wu 2004, and Salazar and Torres-Verdín 2009) used an explicit equation to approximate the flow rate of mud-filtrate invasion. We use wellbore productivity index to calculate accurately flow rate of mud-filtrate invasion. In this model, the first radial grid (for all vertical and azimuthal directions) is designated as mudcake with a negligible initial thickness (because numerical grid size cannot be zero, we assign it a value of 10¡910¡9 ft). The accumulation of solid fraction contributes to the growth of mudcake thickness with time. It is assumed that fluid flow inside mudcake can be described as single-phase flow. The flow rate of mud filtrate is a function of mudcake thickness, overbalance pressure, and wellbore productivity index. Accordingly, the volumetric flow rate can be expressed as Qj = PIj(Pwf ¡ Pj)Qj = PIj(Pwf ¡ Pj), (4)
where QjQj is volumetric flow rate in [ft3=Dft3=D], PwfPwf and PjPj are bottomhole pressure and pressure of fluid phase jj , respectively, in [psipsi], and PIjPIj is productivity index of fluid phase jj given by
PIj =kr¢Z¢μ¸rj
(lnro
rw
+ s);P Ij =
kr¢Z¢μ¸rj
(lnro
rw
+ s); (5)
where krkr is dynamic permeability of mudcake, roro is the radius of second grid block, rwrw is the time-varying wellbore radius, ss is wellbore skin factor, and ¸rj¸rj is mobility of the filtrate phase (given by 1=¹f1=¹f , where ¹ f¹ f
is filtrate viscosity). The productivity index connects the time variations of mudcake to reservoir grids. WETTABILITY ALTERATION MODEL The effect of wettability alteration on reservoir fluid flow is a research topic well studied in chemical flooding. Reservoir engineers calculate oil recovery for the processes in which surfactants lead to wettability alteration (Delshad et al. 2006, Fathi Najafabadi et al. 2009). In chemical flooding studies, wettability of the rock surface changes to a water-wet condition. In contrast, during OBMF invasion, the wettability of the rock surface changes to a more oil-wet state. Recently, Salazar and Martin (2010) studied the invasion of OBMF into a tight-gas formation in Offshore Vietnam. They found that surfactants in OBMF induced wettability alteration that decreased the near-wellbore irreducible water saturation. The effects of wettability on relative permeability have been investigated by several authors. Owens and Archer (1971) added surfactants to either oil or water in order to change wettability and calculated the relative permeability of both phases. McCaffery and Bennion (1974) calculated relative permeability data for different fluid phases with various contact angles using a synthetic polytetra-fluoroethylene sample. This paper studies the process of OBMF invasion in a comprehensive manner by including pertinent physical models to describe mudcake growth, miscibility of OBMF with in-situ oil, and wettability alteration. In the study of wettability alteration, we assume that concentration of the surfactant is greater than the critical micelle concentration. The developed method allows simulation of multi-phase fluid flow with arbitrary relative permeability and capillary pressure curves. Relative permeability in each grid block, krlkrl, is calculated via linear interpolation of relative permeability for two different conditions: initial condition and completely altered wettability. In a similar manner, capillary pressure, Pc2jPc2j, is obtained with a linear interpolation between initial and final wetting state, i.e., krl = !k
finalrl + (1¡ !)kinitial
rlkrl = !kfinalrl + (1¡ !)kinitial
rl , (6)
Pc2j = !Pfinalc2j +(1¡!)P initial
c2jPc2j = !Pfinalc2j +(1¡!)P initial
c2j , (7)
where !! is the scaling factor given by
! =Csa
Csa + Cst! =
Csa
Csa + Cst, (8)
where CsaCsa, and CstCst are, respectively, concentrations of the adsorbed and total surfactant. Equation (8) describes the wettability alteration of a rock surface after some concentration of surfactant is absorbed by the rock surface.

SPWLA 52nd Annual Logging Symposium, May 14-18, 2011
4
SOLUTION APPROACH The simulation algorithm is based on solving pressure implicitly and calculating concentrations explicitly (IMPEC). Following the calculation of the overall composition in each grid block, we use the Gibbs’s stability criterion and determine the number of fluid phases. At grids where two hydrocarbon phases co-exist, the composition of each phase is determined with flash calculations. The solution method is based on finite-difference discretization in cylindrical coordinates to solve the pressure and concentration equations (Equations A-1 and A-2).
Figure 1: Water-oil relative permeability curves assumed for water-wet and oil-wet conditions. Variables krokro and krwkrw are relative permeability of oil and water, respectively.
Figure 2: Water-oil capillary pressure, PcowPcow , curves assumed for water-wet and an oil-wet rock surfaces.
The discretization allows spatial variations of pressure, concentration, and petrophysical properties in radial, azimuthal, and vertical directions. A logarithmic distribution of radial grids increases is used to secure accurate and reliable simulations in the near-wellbore region, where most of the fluid concentration variations take place.
FLOW RATE OF MUD-FILTRATE INVASION We investigate the effect of wettability alteration during OBMF invasion on the rate of filtrate flowing into the invaded formation. A “base” case of study is introduced with a set of numerical and physical properties for mudcake, mud-filtrate, formation, fluid phases, and rock-fluid. The base case consists of a formation with porosity equal to 25% and permeability equal to 50 md. It is assumed that the formation is saturated with oil, and water is at irreducible saturation. Table 1 summarizes the remainder of formation rock petrophysical properties assumed in simulations of the base case. In the following simulations, formation oil is lumped into pseudo-component C6C17C6C17 and invading filtrate into pseudo-component MC16MC16. Table 4 lists PVT properties of pseudo-components assumed in the simulations. The relation between rock and fluid is given by two types of relative permeability and capillary pressure curves, i.e., water-wet and oil-wet. Table 3 summarizes the parameters used defining relative permeability and capillary pressure curves. Figures 1 and 2, respectively, show the base curves for relative permeability and capillary pressure in this study. We note that Swirr;water¡wet > Swirr;oil¡wetSwirr;water¡wet > Swirr;oil¡wet, Sor;water¡wet < Sor;oil¡wetSor;water¡wet < Sor;oil¡wet, and also capillary pressure for an oil-wet system is negative. It is assumed that, at the onset of invasion, there is an overbalance pressure of 300 psi between formation and wellbore. Rock pressure increases as mud filtrate invades the formation, whereby overbalance pressure decreases with time. With time of invasion the thickness of mudcake increases and mudcake permeability decreases until mudcake thickness reaches a limiting value of 1 cm. Productivity index, given by Equation (5), relates mudcake properties to formation properties; it quantifies the role played by mudcake reference permeability, filtrate viscosity, and mudcake limiting thickness which control the flow rate of invasion. Specifically, Equation (5) shows that a reduction in the productivity index and/or overbalance pressure causes a reduction in the flow rate of mud-filtrate invasion (Figures 3b, and 4b). Effect of formation permeability on the flow rate of mud-filtrate invasion - Permeability of mudcake is significantly smaller than the permeability of conventional reservoirs. For rocks with high permeability, the flow rate of invasion is linearly proportional to mudcake reference permeability. However, in the case of tight rock formations the flow rate of mud-filtrate invasion depends on formation properties such as permeability, porosity, capillary
0 0.2 0.4 0.6 0.8 10
0.2
0.4
0.6
0.8
1
Water Saturation
k r
krw, Water-Wet
kro, Water-Wet
krw, Oil-Wet
kro, Oil-Wet
0 0.2 0.4 0.6 0.8 1-20
-15
-10
-5
0
5
10
Water Saturation
Pc (
psi
)
Water-WetOil-Wet

SPWLA 52nd Annual Logging Symposium, May 14-18, 2011
5
pressure, relative permeability, as well as on mudcake and filtrate properties. Figure 3 compares mud-filtrate flow rates calculated for different mudcake reference permeabilities for the case of formation permeability equal to 300 md. For a tight-rock formation with permeability equal to 1 md, Figure 4 compares the flow rate of mud-filtrate invasion for different mudcake reference permeabilities. For permeable formations, flow rates are parallel during the time mudcake thickness increases to its limiting thickness (Figure 3b). In tight formations, mudcake permeability is not the main factor controlling the flow rate of mud-filtrate invasion (Figure 4b). Our calculations indicate that the flow rate of mud-filtrate invasion decreases with time even after mudcake has reached its limiting thickness.
Table 1: Summary of geometrical, fluid, petrophysical, and Brooks-Corey’s properties assumed in the simulations described in this paper.
Variable Units Value
Wellbore radius
ft
0.477
Formation outer-boundary ft 2000
Formation permeability md 50.00 Formation porosity fraction 0.25 Initial formation pressure psi 3500 Rock compressibility 1/psi 4.0E-7
Water compressibility 1/psi 3.6.0E-6
Oil viscosity cp 2.00
Formation water salinity ppm
NaCL 161000
Temperature °F 200 Total invasion time days 6 Archie’s tortuosity/cementation factor aa
- 1.00
Archie’s cementation exponent mm - 2.00
Archie’s saturation exponent nn
- 2.00
Effect of mudcake permeability on the flow rate of mud-filtrate invasion – In our entire invasion simulations (WBM or OBM), we observe if the formation has high permeability, mud-filtrate flow rate varies linearly with the variation of mudcake reference permeability (Figure 3b). However, for low-permeability formations (less than 1 md) petrophysical properties such as permeability, porosity, and rock-fluid properties also influence the flow rate of mud-filtrate invasion.
Effect of wettability alteration on the rate of mud-filtrate invasion – During OBMF invasion, the wettability of rock surface changes; consequently, water and oil relative permeability change as well. Our simulations show the effect of wettability alteration on the rate of mud-filtrate invasion is negligible. We found that invasion flow rates for cases in which rock surface wettability changes are the same as those with no-wettability alteration (Figures 3b and 4b). WETTABILITY ALTERATION EFFECTS ON SATURATION AND RESISTIVITY Invasion of OBMF gives rise to OBMF surfactant contact with the rock’s surface within the invasion zone. Surfactants included in OBMF change the rock surface wettability from a water-wet to a more oil-wet condition.
(a)
(b) Figure 3: Calculated time variations of (a) mudcake thickness and (b) mud-filtrate flow rate after the onset of invasion for different values of mudcake reference permeability. In the new wettability condition, oil makes contact with the grain surface (prior to that water was in contact with the grain surface). Consequently, some of the originally immobile water becomes moveable whereby irreducible
0.001 0.01 1 10 1000
0.1
0.4
0.7
1T
hic
knes
s (c
m)
Kmc0
= 0.3 md
Kmc0
= 0.03
Kmc0
= 0.003
0.0001 0.01 1 100 10
-4
10-3
10-2
10-1
100
101
Time (hours)
Flo
w r
ate
(m3 /d
ay/m
)
Kmc0
= 0.3 md
Kmc0
= 0.03
Kmc0
= 0.003

SPWLA 52nd Annual Logging Symposium, May 14-18, 2011
6
Table 2: Summary of mudcake and mud-filtrate properties assumed in the simulations of the process of mud-filtrate invasion.
Variable Units Value
Mudcake reference porosity
fraction 0.30
Mud solid fraction fraction 0.06 Mudcake maximum thickness
cm 1.00
Mudcake compressibility exponent v
fraction 0.40
Mudcake exponent multiplier delta
fraction 0.10
Oil-base mud-filtrate viscosity
cp 4.00
Mudcake reference permeability
md 0.03
Mud filtrate salinity ppm NaCl 161000
water saturation decreases with respect to the rock’s original state (Figures 1 and 2). During invasion, OBMF displaces the excess moveable water into the formation; hence water saturation decreases near the borehole wall with respect to its original value. We study a synthetic case of OBMF invasion into a formation with connate water saturation equal to irreducible water saturation. Mudcake is assumed to have a reference permeability of 0.003 md and the overbalance pressure is 300 psi. Furthermore, we assume the OBMF surfactants decrease the level of water saturation by 4 saturation units (with respect to the original water saturation). Figure 5a shows radial distributions of water saturation simulated after 2.4 hours, 1 day and 3 days of OBMF invasion. Irreducible water saturation decreases in the invaded zone with the excess water saturation (beyond new irreducible water saturation) becoming moveable, thereby creating a water bank in the shallow radial zone. In the presence OBMF salt concentration does not change radially. From the simulated radial distributions of water saturation and salt concentration, Archie’s equation (Archie 1942) yields the corresponding radial distribution of rock electrical resistivity, given by Rt = Rw ¢
aÁm Sn
w;Rt = Rw ¢
aÁm Sn
w; (9)
where RtRt is true formation resistivity, aa is tortuosity factor, mm is cementation exponent, nn is saturation exponent, and RwRw is connate water resistivity calculated with (Bigelow 1992)
Rw =³0:0123 + 3647:5
C 0:955salt
´¢ 81:77
T +6:77;Rw =
³0:0123 + 3647:5
C 0:955salt
´¢ 81:77
T +6:77; (10)
Table 3: Summary of Brooks-Corey’s properties assumed in the simulations described in this paper.
Variable Units Water-
Wet Oil-Wet
Irreducible water saturation
fraction 0.16 0.12
Irreducible oil saturation
fraction 0.11 0.15
Endpoint of water relative permeability
n/a 0.4 0.6
Endpoint of oil relative permeability
n/a 1.0 0.8
Coefficient for capillary pressure, PcoPco
psi 8 -15
Capillary pressure exponent, epep n/a 2.5 4.5
where CsaltCsalt is [NaCl] concentration in parts per million (ppm) and TT is formation temperature in ±F±F . Figure 5b shows radial distributions of calculated rock electrical resistivity at three different times after the onset of OBMF invasion. Effect of mudcake reference permeability – Figures 3b and 4b show that the rate of mud-filtrate invasion depends on mudcake permeability. We assume that the initial formation pressure is 3500 psi and that water saturation is at the irreducible conditions. Furthermore, we assume that the decrease of irreducible water saturation due to wettability alteration is the same for all three types of mudcake, equal to 4 saturation units (4 su). Figure 6a compares radial distributions of water saturation simulated for three values of mudcake reference permeabilities. The higher the mudcake permeability, the higher the flow rate of invasion and, consequently, the deeper the invasion. Using Archie’s equation, we calculate the corresponding radial distributions of rock electrical resistivity based on the simulated radial distributions of water saturation and salt concentration (Figure 6b). Subsequent to the calculation of radial distribution of electrical resistivity, we use UTAPWeLS to simulate the corresponding array-induction apparent resistivity curves (AIT3) for different depths of investigation (R10, R20, R30, R60, and R90). In doing so, we assume that the top and bottom of the simulated formations are bounded by layers of shale of electrical resistivity equal to 1 Ohm-m.
3 Mark of Schlumberger

SPWLA 52nd Annual Logging Symposium, May 14-18, 2011
7
Table 4: Summary of PVT properties and in-situ hydrocarbon and mud-filtrate components assumed in equation-of-state calculations described in this paper.
Property Units C6C17 MC16 Critical temperature
°K 540.2 803.55
Critical pressure
atm 27 12.834
Accentric factor
- 0.3 0.251
Critical volume
l/mol 0.266 0.93
Molecular weight
g/mol 100.2 284.5
Viscosity cp 1.0 10.0
(a)
(b) Figure 4: Time variations of (a) mudcake thickness and (b) flow rate of mud-filtrate invasion calculated for different values of mudcake reference permeability. Mud-filtrate viscosity is equal to 10 cp. Petrophysical properties of the formation are those of the base case. Figure 6 indicates that the radial length of invasion for OBMF with high mudcake permeability (0.3 md) is relatively large. The impact of radially deep invasion is
a wide range of separation between simulated apparent resistivity logs in Figure 7a. When mudcake permeability is low (0.003 md) the radial length of invasion is relatively small, whereby there is only appreciable separation between the shallowest-sensing apparent resistivity log (R10) and the remainder of the apparent resistivity logs (Figure 7b). Effect of different OBM emulsifiers on wettability alteration – Menezes et al. (1989) and Yan et al. (1993) tested several types of mud filtrate with different emulsifiers. They found that the corresponding variation of contact angle depended on the specific surfactant include in OBM.
(a)
(b)
Figure 5: Radial distributions of (a) water saturation and (b) rock electrical resistivity calculated at different times after the onset of invasion with OBMF containing surfactant. Initially, the formation is assumed to be water-wet with water saturation equal to irreducible saturation (16%). After wettability alteration, irreducible water saturation decreases to 12%. Mudcake reference permeability is assumed equal to 0.003 md and initial overbalance pressure is 300 psi. Table 1 lists the parameters used in Archie’s equation to calculate rock resistivities. Mud-filtrate viscosity is equal to 10 cp. Petrophysical properties of the formation are those of the base case.
0.001 0.01 1 10 1000
0.1
0.4
0.7
1
Th
ickn
ess
(cm
)
Kmc0
= 0.3 md
Kmc0
= 0.03
Kmc0
= 0.003
0.0001 0.01 1 100
10-2
10-1
100
101
Time (hours)
Flo
w r
ate
(m3 /d
ay/m
)
Kmc0
= 0.3 md
Kmc0
= 0.03
Kmc0
= 0.003
0.2 0.3 0.4 0.50.1
0.15
0.2
Wat
er S
atu
rati
on
2.4 hours1 day3 days
0.2 0.3 0.4 0.55
15
25
Radial Distance (m)
Ele
ctri
cal R
esis
tivi
ty
2.4 hours
1 day3 days
Ele
ctri
cal R
esis
tivi
ty (
.m)

SPWLA 52nd Annual Logging Symposium, May 14-18, 2011
8
(a)
(b)
Figure 6: Radial distributions of (a) water saturation and (b) rock electrical resistivity calculated after 3 days of invasion with OBMF containing surfactant for different values of reference mudcake permeability. Initially, the formation is assumed to be water-wet with water saturation equal to irreducible saturation (16%). After wettability alteration, irreducible water saturation decreases to 12%. Overbalance pressure is equal to 300 psi. Table 1 lists the parameters used in Archie’s equation to calculate resistivity values. Petrophysical properties of the formation are those of the base case. Therefore, it is pertinent to conclude that the level of variation of wettability conditions differs depending on the specific composition of OBMF. Some emulsifiers, e.g. EZ MUL and DV-33, change the rock’s surface wettability condition to a completely oil-wet condition, whereas some others, e.g. DFL, cause the rock surface to become less water-wet. For evaluation purposes, in this paper we consider four synthetic cases where initial (irreducible) water saturation decreases to different extents, namely, 2, 4, 6, and 8 su (from the original value). For each simulation, we assume a specific set of saturation-dependent relative permeability and capillary pressure curves. In the simulations, we assume that only irreducible water saturation changes while the rest of petrophysical
(a)
(b)
Figure 7: Array-induction (AIT) apparent resistivity curves simulated for the case of OBMF invasion with mudcake reference permeability values equal to (a) 0.3 and (b) 0.003 md. Figures 6a and 6b show the corresponding radial distributions of water saturation and rock electrical resistivity. properties, such as relative permeability and capillary pressure end points, remain the same. Figure 8a shows radial distribution of water saturation simulated for cases where irreducible water saturation decreases from 16 su to 14, 12, 10, and 8 su. As shown in Figure 8b, the presence of an anomalous local water bank in the simulated radial distributions of water saturation gives rise to an electrically conductive annulus in the corresponding radial distributions of electrical resistivity. WETTABILITY ALTERATION INDUCED IN OIL- AND GAS-BEARING FORMATIONS AND CORRESPONDING EFFECT ON WATER SATURATION AND RESISTIVITY In this section, we compare the effect of OBMF invasion into oil- and gas-saturated rock formations. We consider the three rock-types described in Table 5, and study invasion with one set of values/properties for mudcake, mud filtrate, and overbalance pressure. Figures 9 and 10 show the relative permeability and capillary pressure curves, respectively, assumed for the synthetic case studies. Simulations are performed under the assumption that the reduction of irreducible water saturation due to wettability alteration is proportional to the surface-to-volume ratio of the flow conduit. Therefore, the ensuing decrease of irreducible water saturation is different for each rock-type.
0
Wat
er S
atu
rati
on
0.2 0.3 0.4 0.5 0.6 0.7 0.80.1
0.15
0.2
0.25
K
mc0 = 0.3 md
Kmc0
= 0.03
Kmc0
= 0.003
0.2 0.3 0.4 0.5 0.6 0.7 0.85
15
25
Radial Distance (m)
Ele
ctri
cal R
esis
tivi
ty
2.4 hoursKmc0
= 0.3 md
Kmc0
= 0.03
Kmc0
= 0.003
Ele
ctri
cal R
esis
tivi
ty (
.m)
100
101
Dep
th (
m)
100
101
Dep
th (
m) RT10 RT20 RT30
RT60 RT90
100
101
Resistivity (.m)
Dep
th (
m)
100
101
Resistivity (.m)
Dep
th (
m)

SPWLA 52nd Annual Logging Symposium, May 14-18, 2011
9
(a)
(b)
Figure 8: Radial distributions of (a) water saturation and (b) rock electrical resistivity simulated after 3 days of OBMF invasion. Initially, the formation is assumed to be water-wet with water saturation equal to irreducible saturation (16%). After wettability alteration, depending on the strength of the surfactant agent included in OBMF, the rock surface attains different values of irreducible water saturation. Mudcake reference permeability is equal to 0.3 md, and overbalance pressure is equal to 300 psi. Petrophysical properties of the formation are those of the base case. Table 5 summarizes the properties assumed for mudcake and formation rock. In subsequent fluid flow simulations, we assume that formation gas is composed of methane (C1), in-situ oil is composed of pseudo-components IC4 and FC7, and OBMF is composed of two pseudo-components, FC10 and FC18. We use our developed simulator, UTFECS4, to perform the simulations and define components with properties as listed in Table 6. The assumed overbalance pressure for all cases is 300 psi. Table 2 describes the corresponding properties assumed for except reference permeability, which is equal to 0.3 md.
4 University of Texas Formation Evaluation Compositional Fluid Flow Simulator
OBMF invasion into an oil-saturated formation – The formation is assumed to be saturated with oil composed of pseudo-components IC4 and FC7 with molar compositions equal to 0.4 and 0.6, respectively, whereas OBMF includes the pseudo-components FC10 and FC18 with molar compositions equal to 0.2 and 0.8, respectively. Figure 11a shows radial distribution of water saturation simulated after 3 days of OBMF invasion. We note that the simulated radial lengths of invasion in tight formations are much shorter than those obtained formation which exhibit higher permeabilities. Similar to previous cases, Figure 11b shows that the presence of an anomalous water bank in the radial distribution of water saturation gives rise to an electrically conductive annulus in the radial distribution of rock resistivity. Having calculated the radial distribution of rock resistivity, the UTAPWeLS resistivity simulation module is used to simulate the corresponding array-induction apparent resistivity curves. Figure 12 shows apparent-resistivity curves for different depths of investigation (R10, R20, R30, R60, and R90). Apparent resistivity logs were calculated by assuming upper and lower bounding shale layers of electrical resistivity equal to 1 Ohm-m. The separation between apparent resistivity logs with different depths of investigation is more prominent in formations with higher permeability. Even thought there is a conductive annulus in the radial distribution of electrical resistivity, its effect is not visible on the simulated apparent resistivity logs. Oil-base mud-filtrate invasion into a gas-bearing formation – We study synthetic cases for water-wet formations which are saturated with gas (C1). For simulations of invasion, we assume that the invaded formation is at irreducible water saturation. Similar to the case of OBMF invasion of an oil-saturated rock, OBMF is composed of pseudo-components FC10 and FC18 with molar compositions equal to 0.2 and 0.8, respectively. Figures 13a and 13b compare radial distributions of water and gas saturation, respectively, simulated after 3 days of OBMF invasion into each rock type. The radial length of invasion into the permeable formation (k=300 md) is much larger than for rock formations which exhibit lower values of permeability, while the anomalous water bank due to excess movable water is less prominent. For the synthetic cases considered in this study, comparison of the corresponding radial lengths of invasion into gas- and oil-saturated formations indicates that the radial location of the anomalous is deeper for the case of gas-saturated formations than for the case of oil-saturated rocks.
0.2 0.3 0.4 0.5 0.6 0.7 0.80.05
0.1
0.15
0.2
0.25
0.3W
ater
Sat
ura
tio
n
Swir
=2 %
Swir
=4 %
Swir
=6 %
Swir
=8 %
0.2 0.3 0.4 0.5 0.6 0.7 0.8
5
15
25
35
45
55
Radial Distance (m)
Swir
=2 %
Swir
=4 %
Swir
=6 %
Swir
=8 %
Ele
ctri
cal R
esis
tivi
ty (
.m)
SPWLA 52nd Annual Logging Symposium, May 14-18, 2011
10
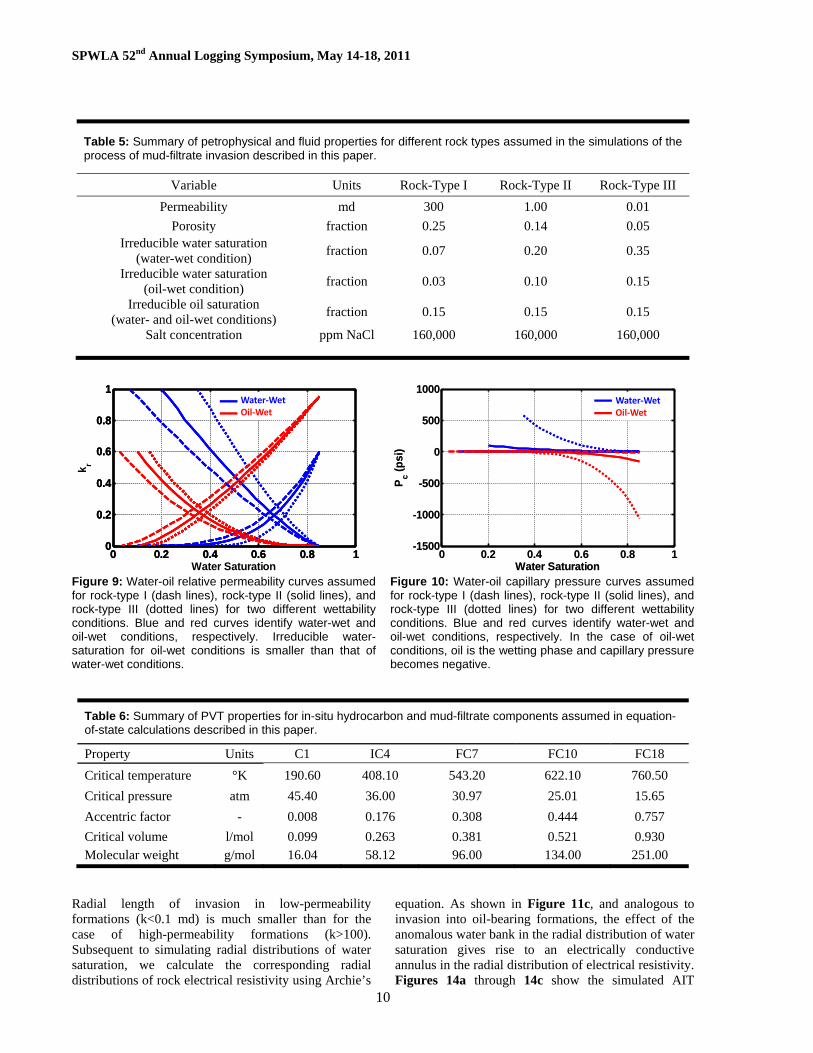
Table 5: Summary of petrophysical and fluid properties for different rock types assumed in the simulations of the process of mud-filtrate invasion described in this paper.
Variable Units Rock-Type I Rock-Type II Rock-Type III
Permeability md 300 1.00 0.01
Porosity fraction 0.25 0.14 0.05 Irreducible water saturation
(water-wet condition) fraction 0.07 0.20 0.35
Irreducible water saturation (oil-wet condition)
fraction 0.03 0.10 0.15
Irreducible oil saturation (water- and oil-wet conditions)
fraction 0.15 0.15 0.15
Salt concentration ppm NaCl 160,000 160,000 160,000
Figure 9: Water-oil relative permeability curves assumed for rock-type I (dash lines), rock-type II (solid lines), and rock-type III (dotted lines) for two different wettability conditions. Blue and red curves identify water-wet and oil-wet conditions, respectively. Irreducible water-saturation for oil-wet conditions is smaller than that of water-wet conditions.
Figure 10: Water-oil capillary pressure curves assumed for rock-type I (dash lines), rock-type II (solid lines), and rock-type III (dotted lines) for two different wettability conditions. Blue and red curves identify water-wet and oil-wet conditions, respectively. In the case of oil-wet conditions, oil is the wetting phase and capillary pressure becomes negative.
Table 6: Summary of PVT properties for in-situ hydrocarbon and mud-filtrate components assumed in equation-of-state calculations described in this paper.
Property Units C1 IC4 FC7 FC10 FC18
Critical temperature °K 190.60 408.10 543.20 622.10 760.50
Critical pressure atm 45.40 36.00 30.97 25.01 15.65
Accentric factor - 0.008 0.176 0.308 0.444 0.757
Critical volume l/mol 0.099 0.263 0.381 0.521 0.930 Molecular weight g/mol 16.04 58.12 96.00 134.00 251.00
Radial length of invasion in low-permeability formations (k<0.1 md) is much smaller than for the case of high-permeability formations (k>100). Subsequent to simulating radial distributions of water saturation, we calculate the corresponding radial distributions of rock electrical resistivity using Archie’s
equation. As shown in Figure 11c, and analogous to invasion into oil-bearing formations, the effect of the anomalous water bank in the radial distribution of water saturation gives rise to an electrically conductive annulus in the radial distribution of electrical resistivity. Figures 14a through 14c show the simulated AIT
0 0.2 0.4 0.6 0.8 10
0.2
0.4
0.6
0.8
1
Water Saturation
k r
0 0.2 0.4 0.6 0.8 10
0.2
0.4
0.6
0.8
1
0 0.2 0.4 0.6 0.8 10
0.2
0.4
0.6
0.8
1
0 0.2 0.4 0.6 0.8 10
0.2
0.4
0.6
0.8
1
Water‐WetOil‐Wet
0 0.2 0.4 0.6 0.8 1-1500
-1000
-500
0
500
1000
Water Saturation
Pc (
psi
)
0 0.2 0.4 0.6 0.8 1-1500
-1000
-500
0
500
1000
Water Saturation
Pc (
psi
)
Water‐WetOil‐Wet

SPWLA 52nd Annual Logging Symposium, May 14-18, 2011
11
(a)
(b)
Figure 11: Radial distributions of (a) water saturation and (b) rock electrical resistivity calculated after 3 days of OBMF invasion into three rock types: rock-type I (dashed lines), rock-type II (solid lines), and rock-type III (dotted lines). Initially, the formation is assumed to be water-wet and saturated with oil, with water saturation equal to irreducible saturation. After wettability alteration, depending on the surface to volume ratio of flow conduit, the rock surface attains different values of irreducible water saturation. Mudcake reference permeability is equal to 0.3 md, overbalance pressure is equal to 300 psi. Petrophysical properties of the formation are those of the base case.
apparent resistivity logs for the three rock-types defined in Table 5. We observe a prominent separation between calculated apparent resistivity logs, shallow to deep, for all rock types. CONCLUSIONS We implemented an experimentally tested method to model mudcake growth and mud-filtrate invasion during drilling. In this method, the mudcake model is coupled with a reservoir simulator which enables us to simulate the dynamic process of mud-filtrate invasion.
(a)
(b)
(c)
Figure 12: Simulated array-induction (AIT) apparent resistivity curves corresponding to invasion of OBMF containing surfactant into an oil-saturated formation with petrophysical properties of (a) rock type I, (b) rock type II, and (c) rock type III. Figure 11 shows the corresponding radial distribution of water saturation and rock electrical resistivity for each rock type. Simulations indicate that, in highly permeable formations, invasion of OBMF is primarily governed by mudcake and mud-filtrate properties such as mudcake reference permeability, mudcake thickness, and mud-filtrate viscosity. We studied rock wettability alterations due to emulsifiers and oil-wetting agents contained in OBMF. Surfactants included in OBMF can change the rock’s surface wettability from a water-wet to a neutral or oil-wet condition. This behavior causes a portion of the originally irreducible pore volume of connate water to become moveable, whereby the radial distribution of water saturation exhibits variations different from those of the rock in its original (uninvaded state). The radial displacement of movable water by OBMF can give rise to a radial zone (annulus) where water saturation is abnormally high (water bank), which in turn causes the radial rock resistivity to be abnormally low (resistivity annulus).
Wa
ter
Sat
ura
tio
n
0.5 1 1.5 2 2.5 30
0.1
0.2
0.3
0.4
0.5
0.5 1 1.5 2 2.5 30
0.1
0.2
0.3
0.4
0.5
0.5 1 1.5 2 2.5 30
0.1
0.2
0.3
0.4
0.5
0.5 1 1.5 2 2.5 30
0.1
0.2
0.3
0.4
0.5
Rock-Type IRock-Type IIRock-Type III
0.5 1 1.5 2 2.5 30
0.1
0.2
0.3
0.4
0.5
0.5 1 1.5 2 2.5 30
50
100
150
200
250
300
350
400
Radial Distance (m)
Ele
ctri
cal R
esis
tivi
ty (
.m)
0.5 1 1.5 2 2.5 30
50
100
150
200
250
300
350
400
Radial Distance (m)
Ele
ctri
cal R
esis
tivi
ty (
.m)
0.5 1 1.5 2 2.5 30
50
100
150
200
250
300
350
400
Radial Distance (m)
Ele
ctri
cal R
esis
tivi
ty (
.m)
0.5 1 1.5 2 2.5 30
50
100
150
200
250
300
350
400
Radial Distance (m)
Ele
ctri
cal R
esis
tivi
ty (
.m)
Rock-Type IRock-Type IIRock-Type III
0.5 1 1.5 2 2.5 30
50
100
150
200
250
300
350
400
Radial Distance (m)
Ele
ctri
cal R
esis
tivi
ty (
.m)
100
101
102
Dep
th (
m)
100
101
102
Dep
th (
m) RT10 RT20 RT30
RT60 RT90
100
101
102
Dep
th (
m)
100
101
102
Dep
th (
m)
100
101
102
Resistivity (.m)
Dep
th (
m)
100
101
102
Resistivity (.m)
Dep
th (
m)

SPWLA 52nd Annual Logging Symposium, May 14-18, 2011
12
(a)
(b)
(c)
Figure 13: Radial distributions of (a) water saturation, (b) gas saturation, and (c) rock electrical resistivity calculated after 3 days of OBMF invasion into three rock types: rock-type I (dashed lines), rock-type II (solid lines), and rock-type III (dotted lines). Initially, the formation is assumed water-wet and gas-saturated, with water saturation equal to irreducible saturation. After wettability alteration, depending on the strength of the surfactant agent included in OBMF, the rock surface attains different values of irreducible water saturation. Mudcake reference permeability is equal to 0.3 md, overbalance pressure is equal to 300 psi. Petrophysical properties of the formation are those of the base case.
(a)
(b)
(c)
Figure 14: Simulated array-induction (AIT) apparent resistivity curves corresponding to invasion with OBMF containing surfactant into a gas-saturated formation with petrophysical properties of (a) rock type I, (b) rock type II, and (c) rock type III. Figure 13 shows the corresponding radial distributions of water saturation and rock electrical resistivity for each rock type.
Salt concentration during invasion of OBMF does not change radially; the anomalous water bank gives rise to an electrically conductive annulus in the radial distribution of electrical resistivity. For invasion with the same volume of filtrate into the invaded formation, we showed that the radial distribution of water saturation change with flow rate of invasion. Relatively low flow rates of invasion give rise to prominent variations in the radial distribution of water saturation because wettability alteration takes place through the invasion zone and grain surfaces become oil-wet. For invasion with high flow rates, some places in the radial transition zone exhibit a mixed-wet condition. Consequently, the amplitude of the anomalous water bank is smaller, but it extends longer in the radial direction. The degree of alterations in contact angle and wettability due to invasion with OBMF depends on the strength of the emulsifier included in mud-filtrate. In turn, these properties impact the corresponding variation of irreducible water saturation.
2 4 6 8 10 12 140
0.1
0.2
0.3
0.4
0.5
Sat
ura
tio
n
2 4 6 8 10 12 140
0.1
0.2
0.3
0.4
0.5
Sat
ura
tio
n
2 4 6 8 10 12 140
0.1
0.2
0.3
0.4
0.5
Sat
ura
tio
n
Rock-Type IRock-Type IIRock-Type III
2 4 6 8 10 12 140
0.1
0.2
0.3
0.4
0.5
Sat
ura
tio
n
Wa
ter
Sat
ura
tio
n
2 4 6 8 10 12 140
0.2
0.4
0.6
0.8
1
Sat
ura
tio
n
2 4 6 8 10 12 140
0.2
0.4
0.6
0.8
1
Sat
ura
tio
n
2 4 6 8 10 12 140
0.2
0.4
0.6
0.8
1
Sat
ura
tio
n
Rock-Type IRock-Type IIRock-Type III
2 4 6 8 10 12 140
0.2
0.4
0.6
0.8
1
Sat
ura
tio
n
Gas
Sat
ura
tio
n
2 4 6 8 10 12 140
50
100
150
200
250
300
350
400
Radial Distance (m)
Ele
ctri
cal R
esis
tivi
ty (
.m)
2 4 6 8 10 12 140
50
100
150
200
250
300
350
400
Radial Distance (m)
Ele
ctri
cal R
esis
tivi
ty (
.m)
2 4 6 8 10 12 140
50
100
150
200
250
300
350
400
Radial Distance (m)
Ele
ctri
cal R
esis
tivi
ty (
.m)
Rock-Type IRock-Type IIRock-Type III
2 4 6 8 10 12 140
50
100
150
200
250
300
350
400
Radial Distance (m)
Ele
ctri
cal R
esis
tivi
ty (
.m)
100
101
102
Dep
th (
m)
100
101
102
Dep
th (
m) RT10 RT20 RT30
RT60 RT90
100
101
102
Dep
th (
m)
100
101
102
Dep
th (
m)
100
101
102
Resistivity (.m)
Dep
th (
m)
100
101
102
Resistivity (.m)
Dep
th (
m)

SPWLA 52nd Annual Logging Symposium, May 14-18, 2011
13
Simulations illustrate that amplitude of the anomalous water bank decreased with a large variation of contact angle. Apparent resistivity logs simulated for the case of OBMF invasion into an oil-saturated permeable formation (permeability higher than 100 md) exhibit prominent, progressive separation from shallow- to deep-sensing logs. In the case of low permeability formations, shallow-sensing apparent resistivity exhibit higher values of apparent resistivity than the remaining logs. Simulations of OBMF invasion into an oil-saturated formation indicated that only shallow-sensing apparent resistivity logs exhibit measurable separation with a decrease of formation permeability. Similarly, invasion of OBMF into gas-bearing formations was accompanied with an anomalous water bank in the radial distribution of water saturation. In this latter case, coexistence of three mobilities, i.e., gas, water, and oil, gave rise to two water banks. Consequently, an equal number of electrically conductive annuli arise in the radial distribution of electrical resistivity. Simulated apparent resistivity logs for this special case exhibit measurable and progressive separation from shallow- to deep-sensing measurements. NOMENCLATURE
aa Archie’s tortuosity factor, [ ] CsaCsa Concentrations of the adsorbed surfactant,
[ ] CsaltCsalt [NaCl] concentration, [ppm] CstCst Total concentrations the surfactant, [ ] Cw Water salt concentration, [ppm] dtdt Differential time, [day] drmcdrmc Differential mudcake thickness, [ft] epep Capillary pressure exponent, [ ] fsfs Solid fraction in mud, [fraction] k Formation permeability, [md] kmc0kmc0 Mudcake reference permeability, [md] krokro Non-wetting-phase relative permeability,
[fraction] krwkrw Wetting-phase relative permeability,
[fraction] k
finalrlkfinalrl End point of relative permeability for
phase ll in oil-wet condition, [ ] kinitial
rlkinitialrl End point of relative permeability for
phase ll in water-wet condition, [ ] m Archie’s cementation exponent, [ ] n Archie’s saturation exponent, [ ] PjPj Pressure of Fluid phase j, [psi] P
finalc2jPfinalc2j End point of capillary pressure for phase ll
in oil-wet condition, [psi] P initial
c2jP initialc2j End point of capillary pressure for phase ll
in water-wet condition, [psi]
PmcPmc Mudcake pressure differential, [psi] PwfPwf Bottomhole pressure, [psi] PIjPIj Productivity index of fluid phase jj ,
[ft3=day=psift3=day=psi ] QjQj Volumetric flow rate, [ft3=Dft3=D] rmcrmc Mudcake thickness, [ft] roro Radius of the second grid block, [ft] rwrw Wellbore radius, [ft] RtRt True formation resistivity, [Ð:mÐ:m] RwRw Water resistivity, [Ð:mÐ:m] ss Skin factor, [ ] SgSg Oil saturation, [fraction] SoSo Oil saturation, [fraction] SorSor Irreducible Oil saturation, [fraction] SwSw Water saturation, [fraction] SwirrSwirr Irreducible Water saturation, [fraction] TT Formation temperature, [±F±F ] ±± Mudcake porosity exponent, [ ] ¸rj¸rj Mobility of fluid phase j, [1/cp.] ¹ f¹ f Mud-filtrate viscosity, [cp] vv Mudcake compressibility exponent, [ ] Porosity, [fraction] Ámc0Ámc0 Mudcake reference porosity, [ ]
!! Scaling factor, ratio of concentration of absorbed surfactant to total surfactant concentration, [ ]
LIST OF ACRONYMS AIT Array-induction imager tool IMPEC Implicit pressure and explicit concentration IMPES Implicit pressure and explicit saturation NMR Nuclear magnetic resonance OBM Oil-base mud OBMF Oil-base mud filtrate PVT Pressure-volume-temperature R10 10-inch radial length of investigation
apparent resistivity, [Ð:mÐ:m] R20 20-inch radial length of investigation
apparent resistivity, [Ð:mÐ:m] R30 30-inch radial length of investigation
apparent resistivity, [Ð:mÐ:m] R60 60-inch radial length of investigation
apparent resistivity, [Ð:mÐ:m] R90 90-inch radial length of investigation
apparent resistivity, [Ð:mÐ:m] UTFEC University of Texas Formation Evaluation
Compositional Fluid Flow Simulator WBM Water-base mud WBMF Water-base mud filtrate

SPWLA 52nd Annual Logging Symposium, May 14-18, 2011
14
ACKNOWLEDGMENTS The authors would to thank Mojdeh Delshad, Abdoljalil Varavei, and Mehdi Haghshenas for discussions about the implementation and simulation results of wettability alteration. Funding for the work reported in this paper was provided by UT Austin’s Research Consortium on Formation Evaluation, jointly sponsored by Anadarko, Apache, Aramco, Baker Hughes, BG, BHP Billiton, BP, Chevron, ConocoPhillips, ENI, ExxonMobil, Halliburton, Hess, Maersk, Marathon, Mexican Institute for Petroleum, Nexen, Pathfinder, Petrobras, Repsol, RWE, Schlumberger, Statoil, TOTAL, and Weatherford. REFERENCES Acs, G., Doleschall, S. and Farkas, E., 1985, General
Purpose Compositional Model: Soc. Pet. Eng. J., vol. 25, no. 4, pp. 543-553.
Archie, G. E., 1942, The Electrical Resistivity Log as an Aid in Determining Some Reservoir Characteristics: Transactions of the American Institute of Mining, Metallurgical and Petroleum Engineers, vol. 146, pp. 54–62.
Ballard, T.J., Dawe, R.A., 1988, Wettability Alteration Induced by Oil-Based Drilling Fluid: SPE 17160, Presented at SPE Formation Damage Control Symposium, Bakersfield, California, February 8-9.
Bigelow, E., 1992, Introduction to Wireline Log Analysis: Western Atlas International, Inc.
Chang, Y.B., 1990, Development and Application of an Equation of State Compositional Simulator, PhD dissertation: The University of Texas at Austin, Austin, Texas, USA.
Chen, J., Hirasaki, G.J., Flaum, M., 2004, Effects of OBM Invasion on Irreducible Water Saturation: Mechanisms and Modifications of NMR Interpretation: SPE 90141, Presented at SPE Annual Technical Conference and Exhibition, Houston, Texas, September 26-29.
Chin, W. C., 1995, Formation invasion with applications to measurement-while-drilling, time-lapse analysis, and formation damage, Gulf Publishing Company, Houston, Texas.
Brooks, R. H., and Corey, A. T., 1964, Hydraulic Properties of Porous Media, Hydrology Paper 3, Colorado State University, Fort Collins, Colorado, pp 27.
Delshad, M., Najafabadi, N.F., Anderson, G.A., Pope, G.A., and Sepehrnoori, K., 2006, Modeling Wettability Alteration in Naturally Fractured Reservoirs: SPE 100081, Presented at SPE/DOE Symposium on Improved Oil Recovery, Tulsa, Oklahoma, USA, April 22-26.
Delshad, M., and Pope, G. A., 1989, Comparison of the Three-phase Oil Relative Permeability Models: J. of Transport in Porous Media, vol. 4, no. 1, pp 59-83.
Dewan, J. T., and Chenevert, M. E., 2001, A Model for Filtration of Water-Base Mud During Drilling: Determination of Mudcake parameters: Petrophysics, vol. 42, no. 3, pp. 237-250.
Fathi Najafabadi, N., Han, C., Delshad, M., and Sepehrnoori, K., 2009, Development of a Three Phase, Fully Implicit, Parallel Chemical Flood Simulator: SPE 119002, Presented at SPE Reservoir Simulation Symposium, The Woodlands, Texas, February 2-4.
Gambino, F. E., Guimerans, R., Galarraga, F.A., Pestana, D.C., Rojas, E., 2001, Experimental Study of Fluid/Rock interaction Caused by Drilling and Cementing Filtrates in Carito Field: SPE 65004, Presented at SPE International Symposium on Oilfield Chemistry, Houston, Texas, USA, February 13-16.
Lee, H. J., 2008, Simulation and Interpretation of Formation-Tester Measurements Acquired in the Presence of Mud-Filtrate Invasion and Geo-mechanical Deformation: PhD dissertation, The University of Texas at Austin, Austin, Texas, USA.
Lohrenz, J., Bray, B.G., and Clark, C. R., 1964, Calculating Viscosities of Reservoir Fluids From Their Compositions: Journal of Petroleum Technology, vol. 16, no. 10, pp. 1171–1176.
McCaffery, F.G., Bennion, D.W., 1974, The effect of rock wettability on two-phase relative permeabilities: J. Can. Pet. Tech., vol. 13, n. 4, pp. 42.
Menezes, J. L., Yan, J., Sharma, M. M., 1989, The Mechanism of Wettability Alteration Due to Surfactants in Oil-Based Muds: SPE 18460, Presented at SPE International Symposium on Oilfield Chemistry, Houston, Texas, February 8-10.
Nghiem, L. X., Fong, D.K., and Aziz, K., 1981, Compositional Modeling with an Equation of State: Soc. Pet. Eng. J., vol. 21, no. 6, pp. 687-698.
Nghiem, L. X., 1983, A New Approach to Quasi-Newton Methods with Application to Compositional Modeling: SPE 12242, Presented at the 7th SPE Symposium on Reservoir Simulation of the Society of Petroleum Engineers, San Francisco, CA, USA, November 15-18.
Owens, W. W., Archer, D.L., 1971, The Effect of Rock Wettability on Oil-Water Relative Permeability Relationships: J. Pet. Tech., vol. 23, no. 7, pp. 873–878.
Peng, D. Y., and Robinsion, D.B. 1976, A New Two-Constant Equation of State: Ind. Eng. Chem. Fundam., vol. 15, no. 1, pp. 59-64.
Pour, R. A., 2008, Equation-of-State, Compositional, One-Dimensional Radial Flow Method to Simulate

SPWLA 52nd Annual Logging Symposium, May 14-18, 2011
15
Invasion and Fluid Withdrawal in the Presence of Oil- or Water-Base Muds, Master’s Thesis, The University of Texas at Austin, Austin, Texas, USA.
Salazar, J. M., and Martin, A. J., 2010, Assessment of Rock Quality Using the Effect of Synthetic Oil-Base Mud-Filtrate Invasion on Borehole Array-Induction Resistivity Measurements: A Case Study of a Tight Gas Field in Offeshore Vietnam: Presented at SPWLA 51st Annual Logging Symposium, Perth, Australia.
Salazar, J. M., and Torres-Verdín, C., 2009, Quantitative Comparison of Processes of Oil- and Water-Base Mud-Filtrate Invasion and Corresponding Effects on Borehole Resistivity Measurements: Geophysics, v. 74, no. 1, pp. E57-E73.
Shafer, J., Chen, J., Flaum, M., Hirasaki, G., Boyd, A., Straley, C., Borbas, T., Devier, C., 2004, Core And Log NMR Measurements Indicate Reservoir Rock Is Altered By OBM Filtrate: Presented at SPWLA 45th Annual Logging Symposium, Noordwijk, The Netherlands, June 6-9.
Sharma, M.M., Wunderlich, R. W., 1985, The Alteration of Rock Properties Due to Interactions With Drilling Fluid Components: SPE 14302, Presented at SPE Annual Technical Conference and Exhibition, Las Vegas, Nevada, USA, September 22-26.
Yan, J. N., Monezes, J.L., Sharma, M. M., 1993, Wettability Alteration Caused by Oil-Based Muds and Mud Components: SPE 18162, SPE Drilling & Completion, vol. 8, no. 1, pp 35-44.
Wu, J., 2004, Numerical Simulation of Multi-Phase Mud Filtrate Invasion and Inversion of Formation Tester Data: PhD dissertation, The University of Texas at Austin, Austin, Texas, USA.
APPENDIX A: MATHEMATICAL FORMULATION OF FLUID-FLOW EQUATIONS The pressure equation is based on the assumption that the pore volume contains the total fluid volume, that is, Vt(P;
¡!Nt) = Vp(P )Vt(P;¡!Nt) = Vp(P ), (A-1)
where VtVt is the total fluid volume, which is a function of pressure (P) and total number of moles of
hydrocarbons, ¡!Nt
¡!Nt, in the pore volume, VpVp. By
differentiating both sides of the above equation with respect to time (t) we obtain ³
@Vt
@P
´Ni
( @P@t
)+³
@Vt
@P
´Ni
( @P@t
)+ Pnc+1i=1
³@Vt
@Ni
´P;Nk;(k 6=i)
( @Ni
@t) = (
dVp
dP)( @P
@t)
Pnc+1i=1
³@Vt
@Ni
´P;Nk;(k 6=i)
( @Ni
@t) = (
dVp
dP)( @P
@t).
(A-2)
Substitution of calculated differential components and re-arrangement of terms gives rise to the following equation for fluid flow:
¡V 0
p cf ¡ (@Vt
@P)Ni
¢(@P
@t) ¡
Vb
Pnc+1i=1 V ti
¡!r ¢ (
Pnp
j=1 k¸rj»jxijrP ) =
Vb
Pnc+1i=1 V ti
¡!r ¢ (
Pnp
j=1 k¸rj»jxij(rPc2j ¡ °jrD))+Pnc+1i=1 V tiqi;
¡V 0
p cf ¡ (@Vt
@P)Ni
¢(@P
@t) ¡
Vb
Pnc+1i=1 V ti
¡!r ¢ (
Pnp
j=1 k¸rj»jxijrP ) =
Vb
Pnc+1i=1 V ti
¡!r ¢ (
Pnp
j=1 k¸rj»jxij(rPc2j ¡ °jrD))+Pnc+1i=1 V tiqi;
(A-3)
where V 0pV 0p is pore volume at reference pressure, cfcf is
rock compressibility, VbVb is bulk volume, kk is permeability tensor, ¸rj¸rj is relative mobility of fluid phase jj to the reference fluid phase, »j»j is molar density of fluid phase jj , ° j° j is specific density of fluid phase jj , DD is depth measured with respect to a reference level, x ijx ij is molar fraction of component ii in fluid phase jj , Pc2jPc2j is capillary pressure of fluid phase jj , qiqi is molar rate of component ii, and V tiV ti is partial molar volume given by
V ti =³
@Vt
@P
´Ni
= @@Ni
(Pnp
j=1 njvj)V ti =³
@Vt
@P
´Ni
= @@Ni
(Pnp
j=1 njvj), (A-4)
where i = 1; : : : ; nc; nc+1i = 1; : : : ; nc; nc+1. After solving the pressure equation, total moles for each component, NiNi, is computed with the premise of material balance, namely, @Ni
@t= Vb
¡!r ¢
Pnp
j=1 »jxijk¸rj(rPj ¡
°jrD) + qi:
@Ni
@t= Vb
¡!r ¢
Pnp
j=1 »jxijk¸rj(rPj ¡
°jrD) + qi: (A-5)
We developed specific formulations for this simulator with the following auxiliary relations: (1) Hydrocarbon phase behavior is modeled using Peng-Robinson's equation-of-state (Peng and Robinsion 1976). (2) The assumption of thermodynamic equilibrium in each grid block yields equality of fugacity of each component in coexisting hydrocarbon phases, i.e.,
fij = firfij = fir, (A-6)
where fijfij is fugacity of component ii in hydrocarbon phase jj . In Equation (16) index i = 1; : : : ; nci = 1; : : : ; nc and index j = 2; : : : ;np (j 6= r)j = 2; : : : ;np (j 6= r). (3) Viscosity of the aqueous phase is calculated using McCain’s correlation; however, we assume that water viscosity does not change in the simulations. Hydrocarbon-phase viscosity is calculated using one of the following relations: (ii) Lohrenz et al.’s model (Lohrenz et. Al. 1976), (iiii) quarter-power mixing rule (Chang 1990) and (iiiiii) linear mixing rule (Pour 2008). (4) Stone's model 2 is implemented to calculate oil relative permeability for three-phase flow (Delshad and Pope 1989). Relative permeability and capillary pressure for two-phase flow conditions are calculated using Brooks-Corey’s correlation (Brooks and Corey 1964).