dynamic wettability alteration in immiscible two-phase ...€¦ · determined by the cumulative...
TRANSCRIPT

ORIGINAL RESEARCHpublished: 10 November 2015doi: 10.3389/fphy.2015.00086
Frontiers in Physics | www.frontiersin.org 1 November 2015 | Volume 3 | Article 86
Edited by:
Renaud Toussaint,
University of Strasbourg, France
Reviewed by:
Piotr Szymczak,
University of Warsaw, Poland
Peter Lehmann,
ETH Zurich, Switzerland
*Correspondence:
Vegard Flovik
Santanu Sinha
Alex Hansen
Specialty section:
This article was submitted to
Interdisciplinary Physics,
a section of the journal
Frontiers in Physics
Received: 23 July 2015
Accepted: 23 October 2015
Published: 10 November 2015
Citation:
Flovik V, Sinha S and Hansen A (2015)
Dynamic Wettability Alteration in
Immiscible Two-phase Flow in Porous
Media: Effect on Transport Properties
and Critical Slowing Down.
Front. Phys. 3:86.
doi: 10.3389/fphy.2015.00086
Dynamic Wettability Alteration inImmiscible Two-phase Flow inPorous Media: Effect on TransportProperties and Critical Slowing Down
Vegard Flovik 1*, Santanu Sinha 2* and Alex Hansen 1*
1Department of Physics, Norwegian University of Science and Technology, Trondheim, Norway, 2Department of Physics,
University of Oslo, Oslo, Norway
The change in contact angles due to the injection of low salinity water or any other
wettability altering agent in an oil-rich porous medium is modeled by a network of
disordered pores transporting two immiscible fluids. We introduce a dynamic wettability
altering mechanism, where the time dependent wetting property of each pore is
determined by the cumulative flow of water through it. Simulations are performed to
reach steady-state for different possible alterations in the wetting angle (θ ). We find that
deviation from oil-wet conditions re-mobilizes the stuck clusters and increases the oil
fractional flow. However, the rate of increase in the fractional flow depends strongly on
θ and as θ → 90◦, a critical angle, the system shows critical slowing down which is
characterized by two dynamic critical exponents.
Keywords: wettability, porous media, porous media flow, fluid transport, two-phase flow in porous media,
two-phase flow, capillary forces, critical slowing down
1. INTRODUCTION
The world’s primary energy demand is predicted to increase by one-third between 2011 and 2035,where 82% of it comes from fossil fuels [1]. In this scenario, the fact that some 20–60% of the oilremains unrecovered in a reservoir after the production is declared unprofitable, is a challenge ofincreasing importance [2]. The main reason for this loss is the formation of oil clusters trapped inwater and held in place by capillary forces, which in turn are controlled by the wetting propertiesof the reservoir fluids with respect to the matrix rock. The production from complex oil reservesthat today are considered immobile or too slow compared to the cost is therefore an importantarea of research. In this context, the role of formation wettability is a focus area within the field ofEnhanced Oil Recovery (EOR) [3].
Different reservoir rocks have widely different wetting characteristics [4]. Wettability mayvary at the pore level from strongly oil wet through intermediate wetting to strongly water wet.Carbonate reservoirs contain more than half of the world’s conventional oil reserves, but the oilrecovery factor (a number between zero and unity representing the fraction of recoverable oil [5])is very low compared to sandstone reservoirs [6]. This is due to the complex structure, formationheterogeneity and more chemically active wettability characteristics of the carbonate reservoirs,which leads to uncertainty in the fluid flow and oil recovery [7]. Sandstone is strongly water wetbefore oil migrates from a source rock into the reservoir. When oil enters a pore, it displaces thewater which leaves behind a water film sandwiched between the oil and rock surface. This happensas a result of balancing van der Waals and electric double layer forces, capillary pressure and grain

Flovik et al. Dynamic wettability alteration in two-phase flow
curvature [8]. A permanent wettability alteration is then believedto take place by adsorption of asphaltenes from the crude oil tothe rock, and leads to high but slow recovery through continuousoil films [9, 10]. As the oil saturation drops, these films canbecome discontinuous, leaving immobile oil clusters held in placeby capillary forces.
After drilling a well into a reservoir, the natural pressureinside can force only around 10% of the total available volumeof oil to reach the surface, which is called the primary recoverystage [5]. To maintain the pressure for further recovery, wateror gas is injected by another injection well which is known assecondary recovery. This allows around 30% further productionof oil depending on fluid properties and reservoir parameters.To recover the huge amount of oil left inside the reservoirafter the secondary recovery, different techniques beyond thesimple secondary injection are implemented, which constitutesthe tertiary or EOR stage. In this stage wettability is the mostimportant petrophysical property which plays a key role in thefluid transport properties of both conventional (permeabilities inmilli-Darcy to Darcy range) and unconventional (low porosityand low permeability in nano to milli-Darcy range, e.g., shale)reservoirs [11] and there is great potential to improve theoil recovery efficiency by altering the wetting properties [12].Main factors which can alter the pore wettability are: loweringthe salinity [13, 14], adding water-soluble surfactants [15, 16]or adding oil-soluble organic acids or bases [17]. Increasingthe reservoir temperature also increases water-wetness [4, 18].There are some correlations with the wetting behavior to theelectrostatic forces between the rock and oil surfaces [19], butthere is no consensus on the dominatingmicroscopic mechanismbehind the wettability alteration. It is known from laboratoryexperiments and field tests that a drift from strongly oil-wetto water-wet or intermediate-wet conditions can significantlyimprove the oil recovery efficiency [17]. The amount of changein the wetting angle is a key factor here [20, 21] which not onlydecides the increase in oil flow but also the speed of the process.An improper change in the wetting angle can also make therecovery very slow and not profitable.
Given there is a certain change in the wetting angle due to abrine, the next important factor is the flow pathways in thematrixrock which transports the oil and brine. One cannot expect anychange in the wetting angle of a pore if there is no flow of thebrine through it. The flow pathways depend on several differentfactors: the porous network itself, oil saturation, capillary numberand also on the present wettability conditions. A change in thewettability will cause a perturbation in the flow distribution ofthe system. This will in turn again affect the wettability changethrough the altered flow pathways, causing further changes inthe flow distribution. The dynamics of wettability alterations istherefore controlled by a strongly correlated process.
There are some studies of wettability alterations in two-phase flow by equilibrium-based network models [22] forcapillary dominated regimes where viscous forces are negligible.Wettability alterations by network models with film-flow hasbeen studied [23] to find residual oil saturation as functionsof contact angle. However, investigation of the time-scale ofdynamics lacks attention in such models which is extremely
important for practical reasons. In this article, we presenta detailed study of wettability alterations in two-phase flowconsidering a network model of disordered pores transportingtwo immiscible fluids where a dynamic wettability alterationmechanism, correlated with the flow-pathways, is implemented.We will focus on the transport properties due to the change in thewettability as well as on the time scale of the dynamics.
We study in the following the effect of wettability changeson immiscible two-phase flow based on a network model [24–26]. In Section 2, we present the model and how we adapt itto incorporate the dynamic wettability changes. In Section 3,we present our results. Initially, we let the two phases settleinto a steady state where the averages of the macroscopic flowparameters no longer evolve. At some point, we then introducethe wettability altering agent, so that it starts changing the wettingangle. The wetting angle alteration depends on the cumulativevolume of the wettability altering fluid that has flowed past agiven pore. This induces transient behavior in the macroscopicflow properties and we measure the time it takes to settle backinto a new steady state. We find that there is a critical pointat a wetting angle of 90◦ and we measure its dynamical criticalexponents; the exponents are different whether one approachesthe critical point from smaller or larger angles. In Section 4 wesummarize and conclude.
2. MODEL
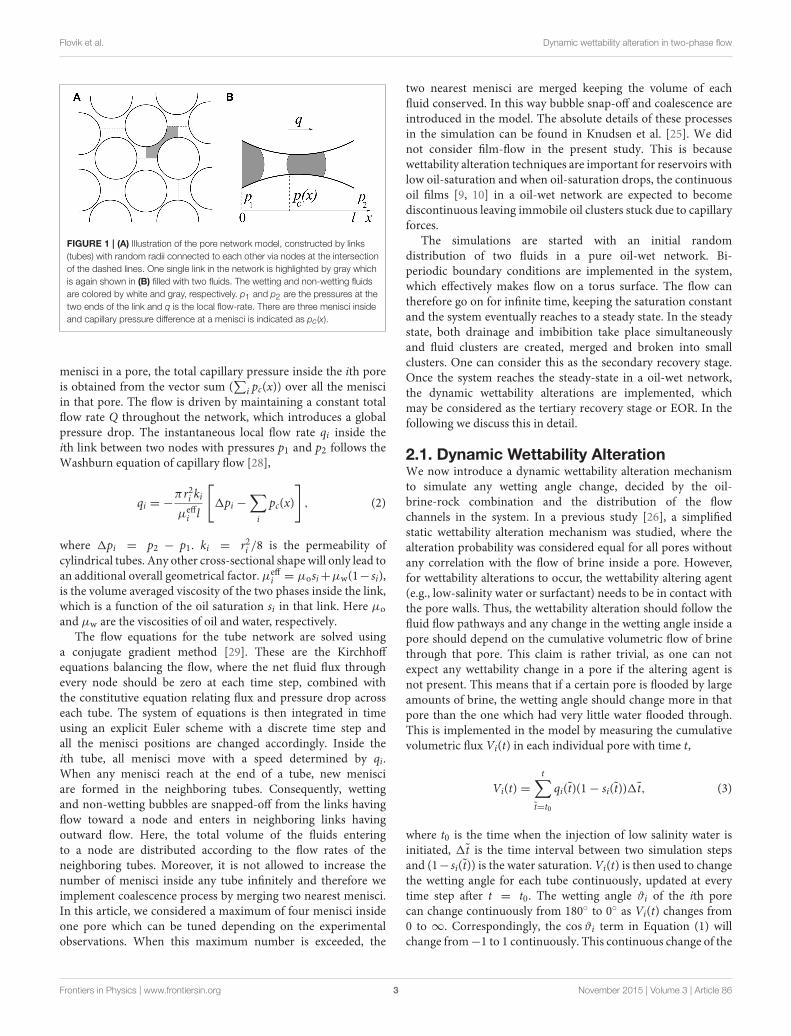
We model the porous medium by a network of tubes (or links)oriented at 45◦ relative to the overall flow direction. The linkscontain volumes contributed from both the pore and the throat,which then intersect at volume-less vertices (or nodes). Anydisorder can be introduced in the model by a proper randomnumber distribution for the radius r of each link, and we choosea uniform distribution in the range [0.1 l, 0.4 l] here, where lis the length of each tube. It is possible to consider any otherdistribution of pore sizes without any further change in themodel. The network transports two immiscible fluids (we namethem as oil and water), one of which is more wetting than theother with respect to the pore surface. The pores are assumed tobe in between particles, and the pore shape is thus approximatedto be hour-glass shaped, which introduces capillary effects in thesystem. The model is illustrated in Figure 1.
Due to the hour glass shape of the pore, the capillary pressureat amenisci separating the two fluids is not constant, and dependson the position x of the menisci inside the pore. The capillarypressure pc(x) at position x inside the ith pore is then calculatedfrom a modified form of the Young Laplace equation [24, 27],
pc(x) =2γ cosϑi
ri
[
1− cos
(
2πx
l
)]
. (1)
where γ is the interfacial tension between the fluids and ϑi is thewetting angle for that pore. As an interface moves in time, pc(x)changes. The capillary pressure is zero at the two ends (x = 0 andl) and it is maximum at the narrowest part of the pore. It makesthe model closer to the dynamics of drainage dominated flow,where the film flow can be neglected. When there are multiple
Frontiers in Physics | www.frontiersin.org 2 November 2015 | Volume 3 | Article 86
Flovik et al. Dynamic wettability alteration in two-phase flow
FIGURE 1 | (A) Illustration of the pore network model, constructed by links
(tubes) with random radii connected to each other via nodes at the intersection
of the dashed lines. One single link in the network is highlighted by gray which
is again shown in (B) filled with two fluids. The wetting and non-wetting fluids
are colored by white and gray, respectively. p1 and p2 are the pressures at the
two ends of the link and q is the local flow-rate. There are three menisci inside
and capillary pressure difference at a menisci is indicated as pc (x).
menisci in a pore, the total capillary pressure inside the ith poreis obtained from the vector sum (
∑
i pc(x)) over all the menisciin that pore. The flow is driven by maintaining a constant totalflow rate Q throughout the network, which introduces a globalpressure drop. The instantaneous local flow rate qi inside theith link between two nodes with pressures p1 and p2 follows theWashburn equation of capillary flow [28],
qi = −πr2i ki
µeffi l
[
1pi −∑
i
pc(x)
]
, (2)
where 1pi = p2 − p1. ki = r2i /8 is the permeability ofcylindrical tubes. Any other cross-sectional shape will only lead toan additional overall geometrical factor.µeff
i = µosi+µw(1− si),is the volume averaged viscosity of the two phases inside the link,which is a function of the oil saturation si in that link. Here µo
and µw are the viscosities of oil and water, respectively.The flow equations for the tube network are solved using
a conjugate gradient method [29]. These are the Kirchhoffequations balancing the flow, where the net fluid flux throughevery node should be zero at each time step, combined withthe constitutive equation relating flux and pressure drop acrosseach tube. The system of equations is then integrated in timeusing an explicit Euler scheme with a discrete time step andall the menisci positions are changed accordingly. Inside theith tube, all menisci move with a speed determined by qi.When any menisci reach at the end of a tube, new menisciare formed in the neighboring tubes. Consequently, wettingand non-wetting bubbles are snapped-off from the links havingflow toward a node and enters in neighboring links havingoutward flow. Here, the total volume of the fluids enteringto a node are distributed according to the flow rates of theneighboring tubes. Moreover, it is not allowed to increase thenumber of menisci inside any tube infinitely and therefore weimplement coalescence process by merging two nearest menisci.In this article, we considered a maximum of four menisci insideone pore which can be tuned depending on the experimentalobservations. When this maximum number is exceeded, the
two nearest menisci are merged keeping the volume of eachfluid conserved. In this way bubble snap-off and coalescence areintroduced in the model. The absolute details of these processesin the simulation can be found in Knudsen et al. [25]. We didnot consider film-flow in the present study. This is becausewettability alteration techniques are important for reservoirs withlow oil-saturation and when oil-saturation drops, the continuousoil films [9, 10] in a oil-wet network are expected to becomediscontinuous leaving immobile oil clusters stuck due to capillaryforces.
The simulations are started with an initial randomdistribution of two fluids in a pure oil-wet network. Bi-periodic boundary conditions are implemented in the system,which effectively makes flow on a torus surface. The flow cantherefore go on for infinite time, keeping the saturation constantand the system eventually reaches to a steady state. In the steadystate, both drainage and imbibition take place simultaneouslyand fluid clusters are created, merged and broken into smallclusters. One can consider this as the secondary recovery stage.Once the system reaches the steady-state in a oil-wet network,the dynamic wettability alterations are implemented, whichmay be considered as the tertiary recovery stage or EOR. In thefollowing we discuss this in detail.
2.1. Dynamic Wettability AlterationWe now introduce a dynamic wettability alteration mechanismto simulate any wetting angle change, decided by the oil-brine-rock combination and the distribution of the flowchannels in the system. In a previous study [26], a simplifiedstatic wettability alteration mechanism was studied, where thealteration probability was considered equal for all pores withoutany correlation with the flow of brine inside a pore. However,for wettability alterations to occur, the wettability altering agent(e.g., low-salinity water or surfactant) needs to be in contact withthe pore walls. Thus, the wettability alteration should follow thefluid flow pathways and any change in the wetting angle inside apore should depend on the cumulative volumetric flow of brinethrough that pore. This claim is rather trivial, as one can notexpect any wettability change in a pore if the altering agent isnot present. This means that if a certain pore is flooded by largeamounts of brine, the wetting angle should change more in thatpore than the one which had very little water flooded through.This is implemented in the model by measuring the cumulativevolumetric flux Vi(t) in each individual pore with time t,
Vi(t) =
t∑
t̃=t0
qi(t̃)(1− si(t̃))1t̃, (3)
where t0 is the time when the injection of low salinity water isinitiated, 1t̃ is the time interval between two simulation stepsand (1− si(t̃)) is the water saturation. Vi(t) is then used to changethe wetting angle for each tube continuously, updated at everytime step after t = t0. The wetting angle ϑi of the ith porecan change continuously from 180◦ to 0◦ as Vi(t) changes from0 to ∞. Correspondingly, the cosϑi term in Equation (1) willchange from−1 to 1 continuously. This continuous change of the
Frontiers in Physics | www.frontiersin.org 3 November 2015 | Volume 3 | Article 86

Flovik et al. Dynamic wettability alteration in two-phase flow
wetting angle with the variation of Vi(t) is modeled by a functionGi(t) given by,
Gi(t) =2
πtan−1
[
C
(
Vi(t)
V thi
− 1
)]
(4)
which replaces the cosϑi term in Equation (1). As, to ourknowledge, there is no consensus in the literature about the exactfunctional dependence of the wetting angle on the volumetricflow of brine at the pore level, we have chosen a function whichstarts the wetting angles from oil-wet conditions (ϑi ≈ 0◦) atVi(t) = 0 and then asymptotically approaches to water-wetconditions (ϑi ≈ 180◦) as Vi(t) → ∞. The pre-factor 2/πis a normalization constant to set the range of the function.The parameter C can be tuned to adjust the slope during thetransition from oil wet to water wet and can also change the initialwetting angle from 180◦. As our model does not include filmflow, the wetting angles are not likely to reach either 0 or 180◦
for circular cross-section of pores. We have chosen C = 20 forour simulations which sets the starting wetting angle ϑi = 165.5◦
when Vi(t) = 0. This leads to the change in the wetting angle asa function of Vi(t) as shown in Figure 2.
As a larger pore will need more brine to be flooded in orderto have a similar change in the wetting angle than a smaller pore,a threshold value V th
i is introduced, which is proportional to thevolume of that pore,
V thi = ηπr2i l. (5)
At Vi(t) = V thi , the wetting angle reaches to 90◦ in that pore
and pc(x) essentially becomes zero. Here η is a proportionality
FIGURE 2 | Variation of the wetting angle ϑi in the ith link given by Gi (t)
(Equation 4) as a function of the cumulative volume of water Vi (t)
(Equation 3) passed through that link. Vthi
is the water volume needed to
reach the wetting angle to 90◦ in that pore. When there is a cut-off (θ ) in the
maximum change in the wetting angle, ϑi is not allowed to change anymore as
soon as ϑi = θ . An example of a cut-off 60◦ is shown by dashed lines, in this
case as soon as ϑi = 60◦ or Vi (t) = vVthi, ϑi is not changed anymore. The time
(t) needed to reach the cut-off value therefore varies from pore to pore and
depends on the value of Vthi.
constant which decides how many pore volumes of water isneeded to reach Vi(t) = V th
i for the ith pore. This parametercan possibly be adjusted against future experimental results, but isconsidered as a tuning parameter in this study. The expression forthe capillary pressure at a menisci from Equation (1) then takesthe form,
pc(t) =2γGi(t)
ri
[
1− cos
(
2πx
l
)]
. (6)
The maximum amount of wetting angle that can be changeddepends on the combination of brine, oil and rock properties[20, 21]. We therefore set a cut-off θ in the wetting angle change,such that any pore that has reached to a wetting angle ϑi = θ , cannot be changed further. The model thus includes all the essentialingredients of wettability alteration study–it is a time dependentmodel where the wettability alteration is correlated with the flowpathways of the brine, and can be used to study any oil-brine-rockcombination decided by θ .
3. RESULTS
Simulations are started with a random distribution of oil andwater in an oil-wet network, where θ = 165.5◦ for all links.First, the oil-wet system is evolved to a steady state before anywettability alteration is started. This will allow us to compare thechange in the steady-state fractional flow of oil (F) with a changein the wetting angle. The oil fractional flow (F) is defined as theratio of the oil flow-rate (Qoil) to the total flow-rate (Q) given by,F = Qoil/Q. The flow rate (Q) is kept constant throughout thesimulation, which sets the capillary number Ca = µeffQ/(γA),where A is the cross-sectional area of the network. A networkof 40 × 40 links are considered, which is sufficient to be inthe asymptotic limit for the range of parameters used [25]. Anaverage over 5 different realizations of the network has beentaken for each simulation. As the simulation continues, bothdrainage and imbibition take place simultaneously due to bi-periodic boundary conditions and the system eventually evolvesto a steady state, with a distribution of water and oil clusters inthe system. In Figure 3, F is plotted against the number of porevolumes passed (N) through the network. As we run the systemwith constant flow-rate, N is directly proportional to the time t,N = tQ/v where v is the total volume of the network. The initial200 pore volumes are for an oil-wet network, where it reachesto a steady state with F ≈ 0.235. We then initiate the dynamicwettability alteration which resembles the flow of a wettabilityaltering brine and F starts to drift. Here we run simulations fordifferent values of η, defined in Equation (5), and the results areplotted in different colors. θ = 0◦ in these simulations, whichmeans any pore can change to pure water-wet depending uponthe flow of brine through it. One can see that F approaches to anew steady-state with F ≈ 0.308 due to the wettability alteration.The initialization of steady state is defined as the instant when theaverage fractional flow stops changing with time and essentiallystays within its fluctuation. The time (τ ) required to initialize thesteady state after wettability alteration is started is measured interms of the pore-volumes and plotted in the inset of Figure 3
Frontiers in Physics | www.frontiersin.org 4 November 2015 | Volume 3 | Article 86

Flovik et al. Dynamic wettability alteration in two-phase flow
FIGURE 3 | (Color online) Change in the oil fractional-flow (F) during
the simulation as a function of the number of network pore-volumes
(N) of fluids passed through any cross-section of the network. Here the
network is of size 40× 40 links with oil saturation S = 0.3 and Ca = 10−1. The
initial part of the plot (N < 200) shows the change in F in an oil-wet system
where it approaches to a steady state with F ≈ 0.235. The wettability alteration
starts at N = 200, where results for different simulations with different values of
η (the number of pore volumes of water needed to pass through one pore to
reach the wetting angle to 90◦ in that pore) are plotted in different colors. The
system evolves to a new steady-state where F fluctuates around a higher
average value. Different values of η only affects the rate of change in F but
leads to the same average F. In the inset we plot τ , the number of network
pore-volumes of fluids passed through the network to reach the steady-state
after wettability alteration is initiated, as a function of η. τ is proportional to the
total time to reach steady state which increases linearly with η as seen in the
inset. A higher value of η results in a longer time to reach the new steady-state.
as a function of η and a simple linear dependency is observed.Therefore, different values of η only make the simulation fasteror slower, but it reaches to the same steady state. In order to savecomputational time, we therefore use η = 10 in all our followingsimulations.
How the two fluids and the local flow-rates are distributedin the network in the two steady-states before and after thewettability alteration are shown in Figure 4. The network sizeis 64 × 64 links here with an oil-saturation S = 0.3 and thecapillary number Ca = 10−2. All the links are hour-glass shapedin the actual simulation with disorder in radii, but shown as aregular network for simplicity in drawing. The upper row showsthe distribution of oil bubbles drawn in black. The left column(Figure 4A) shows the steady state in a oil-wet network andthe right column (Figure 4B) shows the steady-state after thewettability alteration is initiated with maximum possible wettingangle change θ = 0◦. A closer look in these bubble distributionsshows more clustered oil bubbles in Figure 4A than in Figure 4B
where they are more fragmented. A more interesting picture canbe seen in the local flow-rate distribution in the bottom row,which shows a more dynamic scenario. The left (Figure 4C) andright (Figure 4D) figures are for the same time-steps before andafter wettability alteration as in Figures 4A,B, respectively. Herethe local flow-rates in each pore, normalized in between 0 and1, are shown in gray scale. Interestingly, in the oil-wet system(Figure 4C), the flow is dominated in a few channels (black lines)
where the flow-rates are orders of magnitude higher than therest of the system. Other than those channels, the system hasnegligible flow, indicated by white patches whichmeans the fluidsare effectively stuck in all those areas. This situation happenswhen the difference in the saturation of the two fluids is large,where the phase with higher saturation (water here) tries topercolate in paths dominated by a single phase with less numberof interfaces. This is not favorable in oil-recovery, as it leavesimmobile fluid in the reservoir. In the flow distribution after thewettability alteration (Figure 4D), the flow is more homogeneousand distributed over the whole system, indicating higher mobilityof the fluids. However, one should remember that when thewettability alteration is started in a system shown in Figure 4C,the wettability alteration starts taking place only in those poreswith active flow. But then it perturbs the flow-field and startsnew flow paths and eventually the system drifts toward a morehomogeneous flow with time, as shown in Figure 4D.
We now present the results when the wetting angle of anypore can change all the way down to zero degree (θ = 0◦).In Figure 5 the steady-state oil fractional-flow in an initial oil-wet system (F) is compared with that in the steady-state afterwettability alteration (F′). Results are plotted as a function ofS for two different capillary numbers, (Figure 5A) Ca = 10−1
and (Figure 5B) Ca = 10−2. The diagonal dashed line in theplots corresponds to F = S. If the fluids are miscible andthere is no capillary forces at the menisci then both the fluidswill flow equally and F will be exactly equal to S. But thepresence of capillary forces at the interfaces lead to the deviationof the fractional-flow curve from the diagonal line. A lowercapillary number (higher capillary forces) therefore results inmore deviation from the F = S line. For low oil saturation, theoil fractional-flow is lower than S, i.e., under the diagonal andfor high S, F is higher than S, i.e., above the diagonal. Roughly,the phase with higher volume fraction gains and it flows fasterthan the other. At some point, the curve crosses the diagonal andit is the point where no phase gains. The crossover point is notat 50% saturation which clearly shows the asymmetry betweenthe two phases [30]. As F stays below the F = S line for lowS, the flow of oil becomes lower and lower as oil saturationdrops resulting small but stuck oil clusters. Interestingly, whenwettability alterations are implemented, a significant increase inF can be observed for the full range of oil-saturation. Moreover,increase in F is higher for the lower capillary number, indicatingthat wettability alteration is very significant in the case of oilrecovery, as Ca can go as low as 10−6 in the reservoir pores.Fractional flow also obeys the symmetry relation F′(S) = 1 −
F(1− S) [26] which implies that, if the wetting angle of any poreis allowed to change all way down to zero degree (θ = 0◦), thesystem will eventually become pure water-wet with time.
As noted earlier, the maximum change in wetting angle for asystem, depends on the properties of the reservoir rock, crudeoil and brine, and also on the temperature. Existing wettabilityalteration procedures generally turns the oil-wet system intointermediate wet, rather than to pure water-wet. Some examplesof the change in the wetting angle for different rock materialsand brine can be found in Kathel and Mohanty [20] and Nasrallaet al. [21]. In our simulation this is taken care of by the parameter
Frontiers in Physics | www.frontiersin.org 5 November 2015 | Volume 3 | Article 86

Flovik et al. Dynamic wettability alteration in two-phase flow
FIGURE 4 | Distribution of fluid bubbles (top row) and local flow rates (bottom row) in steady state in a network of 64 × 64 links with oil saturation
S = 0.3 and Ca = 10−2. The left column is for the steady state in a oil-wet network and the right column is the new steady state after wettability alteration takes
place. In (A,B), the oil bubbles are drawn in black. In (C,D), the normalized local flow-rates qi/qmax are drawn in gray scale.
FIGURE 5 | Oil fractional-flow (F) in the steady state at different oil saturation (S) in the initial oil-wet system (©) and after the wettability alteration (2).
There is no cut-off in the wetting angle change in these simulations and therefore θ = 0◦ here. Individual simulations are performed for all S values at two different
capillary numbers (A) Ca = 10−1 and (B) Ca = 10−2. F is higher after wettability alteration for the whole range of S. The diagonal dashed line represents F = S curve,
miscible fluids without any capillary pressures at the menisci would follow that line.
θ , which decides the maximum change in the wetting angle ϑi
for any pore. One should remember that, we are not forciblychanging the wetting angles ϑi to θ , rather the change in ϑi
is decided independently for individual pores by the amountof brine passed through it (by Equations 3–6), and there is amaximum allowed change in any ϑi. As before, simulations arestarted with a pure oil-wet system to reach a steady state and thenwettability alteration is started and simulation continues until thesystem reaches to a steady state again. Independent simulationshave been performed for different values of θ . The proportionatechange in the oil fractional-flow due this wettability change from
the oil-wet system, 1F/F = (F′ − F)/F is measured for differentsimulations and plotted in Figure 6 against θ . There are a fewthings to notice. First, as one can immediately see, fractionalflow increases with the decrease of oil-wetness, θ → 0◦. Themaximum increase in F is higher for lower Ca, about 86% forCa = 10−2 and about 32% for Ca = 10−1. This is becausethe change in wetting angle affects the capillary pressures atthe menisci, so the change in F is larger when the capillaryforces are higher. Secondly, the major change in F happens inthe intermediate wetting regime, upto θ ≈ 60◦, and then itbecomes almost flat afterwards. Moreover, this increase in F is
Frontiers in Physics | www.frontiersin.org 6 November 2015 | Volume 3 | Article 86

Flovik et al. Dynamic wettability alteration in two-phase flow
more rapid for lower value of Ca. All these facts points towardan optimal range of wetting angle change to increase the oil flow.This is an important observation for practical reasons, as it is notnecessary to change the wetting angle further. Thirdly, there is adiscontinuity in the curve exactly at θ = 90◦, as we will discusslater.
Increase in the oil fractional-flow with the increase in thewater-wetness may seem to be obvious and reported by manyexperiments and field tests. But, the most important concernfor the oil industry is the rate of increase, or the time requiredto achieve a significant increase in the oil production. If theincrement in oil flow is very slow compared to the cost of theprocess, then the oil recovery is declared as not profitable andthe reservoir may be considered to be abandoned. As per ourknowledge, there are very few systematic studies reported in theliterature predicting the time scale to change the oil flow due tothe wettability change by two-phase flow of brine and oil in aporous media. We observe that, due to the correlations betweenthe flow paths and the wetting angle change, the time scale of theprocess varies dramatically with θ . This is illustrated in Figure 7,where F is plotted as a function of pore volumes (N) of fluidpassed through the system. The initial 400 pore volumes are foran oil-wet system and then results of few different simulationswith θ = 85, 88, 89, 90, 91, 92 and 94◦ are plotted. Interestingly,the rate at which the system reaches a new steady-state, variessignificantly depending on the value of θ . For example, afterthe wettability alteration is started, it needs to flow less than100 pore volumes to reach the new steady state for θ = 94◦
whereas more than 300 pore volumes are needed to reach asteady state for θ = 91◦. Therefore, even if the final steady-state fractional flow is higher for θ = 91◦ than for θ = 94◦,it might not be profitable to alter the wetting angles to 91◦
because of the slow increase in F. In general, the process becomesslower and slower as θ → 90◦ from both sides. Such kind ofslow increase in oil recovery as θ → 90◦ is also observed inexperiments [20, 21]. This slowing down of the process is ancombined effect of two factors. First, the fact that wettabilityonly can change in the pores where there is flow of brineand the second is the value of θ . All the pores were initiallyoil-wet (ϑi ≈ 165◦) and when it reaches the steady state,
the flow finds the high mobility pathways depending on themobility factor of the pores and the capillary pressures at themenisci. When the wettability alteration is started, the wettingangles of the existing flow pathways start decreasing. As aresult, capillary pressures at menisci in those channels firstdecreases as ϑi → 90◦ and then it increase afterwards asϑi → 0◦. This creates a perturbation in the global pressurefield and correspondingly viscous pressures start changing withtime which changes the flow field. However, capillary pressuresat the zero-flow regimes are now higher than the high-flowregimes which makes it difficult to invade the zero-flow regimescausing a slower change in the flow field as ϑi approaches 90
◦.An interesting feature is observed exactly at θ = 90◦, wherethe average fractional flow does not change at all after thewettability change. At exactly θ = 90◦, capillary pressures in allthe pores in the existing flow pathways essentially become zero,making them the lowest resistive channels with zero capillarybarriers. As a result, the fluids keep flowing in the existing
FIGURE 7 | Change in the oil fractional-flow F during the simulation for
different values of maximum allowed wetting angle θ . The wettability
alteration started at N = 400 pore-volumes. The initialization of the
steady-states for different θ values are marked by crosses on the respective
plots.
FIGURE 6 | Proportionate change in the steady-state oil fractional-flow (1F/F) due to wettability alteration as a function of maximum wetting angle θ .
For (A) the capillary number Ca = 10−1 with oil-saturation S = 0.3 and for (B) Ca = 10−2 with S = 0.4.
Frontiers in Physics | www.frontiersin.org 7 November 2015 | Volume 3 | Article 86

Flovik et al. Dynamic wettability alteration in two-phase flow
FIGURE 8 | Variation of steady-state initialization time τ (measured in pore-volumes) as a function of maximum allowed wetting angle θ in any pore.
For (A) Ca = 10−1 with oil saturation S = 0.3 and for (B) Ca = 10−2 with S = 0.4. τ diverges rapidly as θ → 90◦, which is the critical wetting angle (θc).
FIGURE 9 | Plot of logτ vs. log|θ − θc|, where θ is the final allowed wetting angle in any pore, θc = 90◦ and τ is steady-state initialization time (measured
in pore-volumes) after wettability alteration is initiated. For (A) the capillary number Ca = 10−1 with oil saturation S = 0.3 and for (B) Ca = 10−2 with S = 0.4.
From the slopes, the value of the dynamic critical exponent α is obtained as α = 1.0± 0.1 for θ < θc (circles) and α = 1.2± 0.1 for θ > θc (squares).
channels forever and the system stays in the same steady-state.The time taken to reach another new steady-state is thereforeinfinite at θ = 90◦ and it therefore is a critical point for thesystem.
We nowmeasure the steady-state initialization time τ , definedas the moment when the average of the fractional flow stopschanging with time and becomes horizontal with the x axis. Thisis shown In Figure 7, where the initialization of steady states ismarked by crosses on the respective plots. As the simulationsare performed with constant Q, τ is proportional to the fluidvolume passed through the system and therefore we measureτ in the units of N. τ for different simulations with differentvalues of the maximum wetting angle (θ) is plotted in Figure 8A
for Ca = 10−1 with S = 0.3 and in Figure 8B for Ca =
10−2 with S = 0.4. One can see that τ diverges rapidly as θ
approaches θc = 90◦ from both sides, θ > 90◦ and < 90◦. Thisdivergence of the steady-state time τ as θ → θc indicates thecritical slowing down of the dynamics, which is a characteristicsof critical phenomena. The critical slowing down is the outcomeof the divergence of correlations at the critical point and can becharacterized by a dynamic critical exponent z defined as τ ∼ ξ z ,where ξ is the correlation length [31]. As θ → θc, the correlationlength ξ diverges as |θ − θc|
−ν where ν is the correlation length
exponent. The divergence of the steady-state time τ can thereforebe expressed as τ ∼ |θ − θc|
−α , where α = zν. In Figure 9, τ isplotted vs. |θ−θc| in log-log scale which gives two different slopesfor θ > θc and θ < θc. We then find the value of the dynamicexponents α as α = 1.2 ± 0.1 for θ > θc and α = 1.0 ± 0.1 forθ < θc. However, they are the same within error bar for differentcapillary numbers and saturations (Figure 9). The value of thedynamic critical exponents depend on the underlying dynamicsand on the model [32]. In this case, wettability alteration wasstarted from an oil-wet system with ϑi = 165◦ for all the pores.So for the simulations with θ < 90◦, the wetting angles cross thecritical point (90◦) when the capillary forces change directions.This might cause the system to mobilize the clusters somewhatfaster than for θ > 90◦ when the capillary forces does not changeany direction. As a result, α becomes smaller for θ < 90◦ than forθ > 90◦.
We like to point out that a 2-dimensional (2D) porenetwork is considered in this study, but the model isequally applicable to any 3-dimensional (3D) network withoutany further change. However, as critical exponents dependon the spatial dimensionality of the system, values of theexponents measured for a 3D network are expected to bedifferent.
Frontiers in Physics | www.frontiersin.org 8 November 2015 | Volume 3 | Article 86

Flovik et al. Dynamic wettability alteration in two-phase flow
4. CONCLUSIONS
In this article we have presented a detailed computational studyof wettability alterations in two-phase flow in porous media,where the change in the wetting angle in a pore is controlledby the volumetric flow of the altering agent through it. Whenthe wetting angles are allowed to alter toward water-wetness,the stuck oil clusters start to mobilize and oil-fractional flowincreases. However, due to the correlations in the wetting anglechange with the flow pathways, the time-scale of the dynamicsstrongly depends on the maximum allowed change in the wettingangle. We find that, as the final wetting angle is chosen closer to90◦, the system shows a critical slowing down in the dynamics.This critical slowing down is characterized by two dynamiccritical exponents. The critical point we are dealing with isan equilibrium critical point as the system is in steady state.The dynamical critical exponents measure how long it takes
to go from one steady state to a new one. To our knowledge,this is the first example of there being different values for theexponents on either side of the critical point. Our findingsare in agreement with experimental observations reported inliterature, and are extremely important for application purposeslike oil recovery, where the time scale of the process is a keyissue.
ACKNOWLEDGMENTS
We thank E. Skjetne for introducing us to the subject of thisstudy. We have benefited from discussions with D. Bideaux, E.G. flekkøy, S. Kjelstrup, and K. J. Måløy. This work has beensupported by the Norwegian Research Council. We furthermorethank the Beijing Computational Sciences Research Center andits Director, H. Q. Lin for hospitality during the final stages ofthis work.
REFERENCES
1. International Energy Agency. World Energy Outlook. Paris: IEA (2014). doi:
10.1787/weo-2013-en
2. Roberts P. The End of Oil: On the Edge of a Perilous New World. New York,
NY: Houghton Mifflin (2005).
3. Abdallah W, Buckley JS, Carnegie A, Edwards J, Herold B, Fordham
E. Fundamentals of wettability. Schlumberger Oilfield Rev. (2007) 19:44.
Available online at: http://www.slb.com/resources/publications/industry_
articles/oilfield_review/2007/or2007sum04_wettability.aspx
4. Skauge A, Spildo K, Høiland L, Vik B. Theoretical and experimental
evidence of different wettability classes. J Pet Sci Eng. (2007) 57:321–33. doi:
10.1016/j.petrol.2006.11.003
5. Dake LP. Fundamentals of Reservoir Engineering. Amsterdam: Elsevier (1998).
6. Sheng JJ. Comparison of the effects of wettability alteration and IFT reduction
on oil recovery in carbonate reservoirs. Asia-Pac J Chem Eng. (2013) 8:154.
doi: 10.1002/apj.1640
7. Chilingar GV, Yen TF. Some notes on wettability and relative permeabilities
of carbonate reservoir rocks, II. Energy Sources (1983) 7:67. doi:
10.1080/00908318308908076
8. Israelachivili J. Intermolecular and Surface Forces, 3rd Edn. Amsterdam:
Academic Press (2011).
9. Kovscek AR, Wong H, Radke CJ. A pore-level scenario for the development
of mixed wettability in oil reservoirs. AlChe J. (1993) 39:1072. doi:
10.1002/aic.690390616
10. Kaminsky R, Radke CJ. Asphaltenes, water films, and wettability reversal. SPE
J. (1997) 2: 485. doi: 10.2118/39087-PA
11. Kidnay AJ, Parrish WR, McCartney DG. Fundamentals of natural gas
processing, 2nd Edn. Florida, FL: CRC Press; Taylor & Francis Group
(2011).
12. Alvarez JO, Neog A, Jais A, Schechter DS. Impact of surfactants for wettability
alteration in stimulation fluids and the potential for surfactant EOR in
unconventional liquid reservoirs. Soc. Pet. Eng. (2014). doi: 10.2118/169001-
MS
13. Tang GQ, Morrow NR. Salinity, temperature, oil composition, and oil
recovery by waterflooding. SPE Reserv Eng. (1997) 12:269. doi: 10.2118/
36680-PA
14. Tang GQ,Morrow NR. Influence of brine composition and fines migration on
crude oil/brine/rock interactions and oil recovery. J Pet Sci Eng. (1999) 24:99.
doi: 10.1016/S0920-4105(99)00034-0
15. Standnes DC, Austad T. Wettability alteration in chalk: 2.
Mechanism for wettability alteration from oil-wet to water-wet using
surfactants. J Pet Sci Eng. (2000) 28:123. doi: 10.1016/S0920-4105(00)
00084-X
16. Mohan K, Gupta R, Mohanty KK. Wettability altering secondary oil
recovery in carbonate rocks. Energy Fuels (2011) 25:3966. doi: 10.1021/
ef200449y
17. Tweheyo MT, Holt T, Torsæter O. An experimental study of the
relationship between wettability and oil production characteristics.
J Pet Sci Eng. (1999) 24:179. doi: 10.1016/S0920-4105(99)
00041-8
18. Schembre JM, Tang GQ, Kovscek AR. Wettability alteration and oil recovery
by water imbibition at elevated temperatures. J Pet Sci Eng. (2006) 52:131. doi:
10.1016/j.petrol.2006.03.017
19. Buckley JS, Takamura K, Morrow NR. Influence of electrical surface charges
on the wetting properties of crude oils. SPE Reserv Eng. (1989) 4:332. doi:
10.2118/16964-PA
20. Kathel P, Mohanty KK. EOR in tight oil reservoirs through
wettability alteration. Soc. Petro. Eng. (2013). doi: 10.2118/
166281-MS
21. Nasralla RA, Bataweel MA, Nasr-El-Din HA. Investigation of
wettability alteration and oil-recovery improvement by low-salinity
water in sandstone rock. Soc. Petro. Eng. (2013). doi: 10.2118/
146322-PA
22. Blunt MJ. Physically-based network modeling of multiphase flow in
intermediate-wet porous media. J Pet Sci Eng. (1998) 20:117. doi:
10.1016/S0920-4105(98)00010-2
23. Ryazanov AV, van Dijke MIJ, Sorbie KS. Two-phase pore-network modelling:
existence of oil layers during water invasion. Transp PorousMed. (2009) 80:79.
doi: 10.1007/s11242-009-9345-x
24. Aker E, Måløy KJ, Hansen A, Batrouni GG. A two-dimensional
network simulator for two-phase flow in porous media.
Transp Porous Med. (1998) 32:163. doi: 10.1023/A:1006510
106194
25. Knudsen HA, Aker E, Hansen A. Bulk flow regimes and fractional flow in 2D
porous media by numerical simulations. Transp Porous Med. (2002) 47:99.
doi: 10.1023/A:1015039503551
26. Sinha S, Grøva M, Ødegården TB, Skjetne E, Hansen A. Local
wettability reversal during steady-state two-phase flow in porous
media. Phys Rev E (2011) 84:037303. doi: 10.1103/PhysRevE.84.
037303
27. Dullien FAL. Porous Media: Fluid Transport and Pore Structure. San Diego,
CA: Academic Press (1992).
28. Washburn EW. The dynamics of capillary flow. Phys Rev. (1921) 17:273. doi:
10.1103/PhysRev.17.273
29. Batrouni GG, Hansen A. Fourier acceleration of iterative processes
in disordered systems. J Stat Phys. (1988) 52:747. doi: 10.1007/BF01
019728
Frontiers in Physics | www.frontiersin.org 9 November 2015 | Volume 3 | Article 86
Flovik et al. Dynamic wettability alteration in two-phase flow
30. Knudsen HA, Hansen A. Relation between pressure
and fractional flow in two-phase flow in porous media.
Phys Rev E (2002) 65:056310. doi: 10.1103/PhysRevE.65.
056310
31. Bellac ML, Mortessagne F, Batrouni GG. Equilibrium and Non-Equilibrium
Statistical Thermodynamics. Cambridge: Cambridge University Press (2004).
32. Nightingale MP, Blöte HWJ. Dynamic exponent of the two-dimensional
Ising model and Monte Carlo computation of the subdominant
eigenvalue of the stochastic matrix. Phys Rev Lett. (1996) 76:4548. doi:
10.1103/PhysRevLett.76.4548
Conflict of Interest Statement: The authors declare that the research was
conducted in the absence of any commercial or financial relationships that could
be construed as a potential conflict of interest.
Copyright © 2015 Flovik, Sinha and Hansen. This is an open-access article
distributed under the terms of the Creative Commons Attribution License (CC BY).
The use, distribution or reproduction in other forums is permitted, provided the
original author(s) or licensor are credited and that the original publication in this
journal is cited, in accordance with accepted academic practice. No use, distribution
or reproduction is permitted which does not comply with these terms.
Frontiers in Physics | www.frontiersin.org 10 November 2015 | Volume 3 | Article 86