quantifying physician activities in emergency care: an
TRANSCRIPT
Quantifying Physician Activities in Emergency Care: An Exploratory Study
1Joanna Abraham, 2Thomas G. Kannampallil
1Department of Biomedical and Health Information Sciences University of Illinois at Chicago
1919 West Taylor Street, Chicago, IL [email protected]
2Center for Cognitive Studies in Medicine and Public Health
The New York Academy of Medicine 1216 5th Avenue, New York, NY
Emergency departments (ED) are prototypical complex environments. Physician activities in these settings are characterized as episodic, dynamic and collaborative. Using an exploratory study supported by observations, physician shadowing and interviews, we characterize the physician’s activities in an ED including the nature of activities, the time allocated for these activities, how these activities are distributed across the unit and the susceptibility of these activities for interruptions. We found that approximately one-fourth (~25%) of the physician activities (e.g., direct patient care) were localized at specific locations in the unit, while the rest of the activities (e.g., communication) were distributed across the unit and were less predictable. The non-localized activities had a likelihood of interruptions. The results have important implications for mitigating the physician workload, and the design of technologies for monitoring such complex settings.
INTRODUCTION
Emergency Departments (ED) are characterized as complex environments (Kannampallil, Schauer, Cohen, & Patel, 2011; Plsek & Greenhalgh, 2001) due to the interdependent, episodic, collaborative and non-linear nature of work activities (Abraham, Kannampallil, & Reddy, 2009). Several factors have been reported to contribute to complexity in clinical environments including the distribution of information sources and fragmented nature of available information due to redundancy (Hazlehurst, McMullen, & Gorman, 2007), need for multitasking, clinician performance bottlenecks related to cognitive and time constraints (Malhotra, Jordan, Shortliffe, & Patel, 2007), ineffective interactions within and across patient care teams (Joanna Abraham & Reddy), and finally, usability issues related to the use of health information technologies (Zhang & Walji, 2011).
In addition, the modern emergency care adds several layers of complexity. First, the volume of patients and the significant variations in their clinical conditions has increased over the last several decades. Second, the number of professionals involved in the care process, and the number of independent and interdependent tasks that need to be completed to achieve high quality and safer care have increased. In a highly cited study, Donchin et al. (Donchin et al., 1995) found that an average of 178 actions was performed per patient per day in a critical care setting. Third, care activities are distributed among multiple physicians and artifacts (e.g., electronic and paper records, patient monitoring equipment) increasing the potential for a fragmented care process (Durso & Drews, 2010). For example, in a typical academic emergency room, a resident, nurse and an attending physician share the care
responsibilities of a patient. Each of these interactions is recorded on the patient’s medical record (paper or electronic), and a final disposition is made based on a collated view of all these interactions. Fourth, medicine has evolved into specialized practices requiring significant depth and breadth in clinical and technical knowledge. Taken together, these factors introduce significant variability in clinicians’ workflow and activities. A high level of sustainability and resilience in the ED work system is required to promote effective coordination of care (Fagerhaugh & Strauss, 1997).
The impact of complexity in the critical care workplace manifests in several ways: cognitive and task overload that requires the clinician to complete multiple tasks (Laxmisan et al., 2007); increased potential for errors (Patel & Cohen, 2008); interruptions during clinical activities (Brixey et al., 2008); opportunistic behaviors and decisions (Franklin et al., 2011), and workarounds and articulation work in clinical activities (J. Abraham & Reddy, 2008; Malhotra et al., 2007). Several research studies have been conducted to identify, analyze and measure the various aspects of complexity in the emergency department. For instance, Losek (1994) identified that clinician workload was a major stressor in critical care settings, based on their study in a pediatric ED – 46% of physicians rated clinical workload to be excessive. A similar study by Levin et al., (2006) used a time-motion task analysis framework to develop a methodology for measuring the changes in the workload of ED physicians. In another study, researchers (Pennathur et al., 2007) evaluated the impact of computerization on mitigating some of the workflow complexity caused by dry-erase whiteboards in the ED.
Proceedings of the Human Factors and Ergonomics Society 58th Annual Meeting - 2014 798
Cop
yrig
ht 2
014
Hum
an F
acto
rs a
nd E
rgon
omic
s S
ocie
ty. D
OI 1
0.11
77/1
5419
3121
4581
146
at Univ of Illinois at Chicago Library on December 22, 2015pro.sagepub.comDownloaded from

Among these, one of the less explored aspects of complexity in an ED environment is the evaluation of its impact on physician workflow. In other words, we know little about the distribution and magnitude of the effect complexity has on patient care and management responsibilities of physicians.
In this paper, we describe an exploratory observational study of ED physician activities characterizing the nature of physician activities, where they occur, and the susceptibility of these activities for interruptions. The results provide an initial perspective on managing the physician activities and monitoring the complex ED workflow activities. Such an understanding regarding the physician workflow including temporal, and location distribution of their activities across the unit, will be instrumental in for identifying potential vulnerabilities to care bottlenecks. It can also lead to the development of systemic design guidelines for patient safety interventions that can ameliorate the effects of complexity on ED workflow.
METHOD
Study Setting
This study was conducted in an Emergency Department (ED) of a major urban academic hospital in northeast United States. The hospital has 504 beds and has nearly 50,000 Emergency Department visits per year. The three main goals driving ED workflow include patient stabilization, rapid patient diagnosis and temporary pain management. Similar to an inpatient unit, a clinician’s work in the ED was shift-based [with 8 hour (residents) or 12 hour shifts (nurses)]. During each shift, an ED team comprises of 1 charge nurse (chief nurse), 3 attending physicians (physicians in-charge) one for each team (i.e., red, white and blue teams based on decreasing levels of patient acuity), 2 to 3 residents per team, 1 to 2 triage nurses, 13 to 17 staff nurses (4:1 patient-nurse ratio), 3 to 4 ED registration staff and 1 to 2 housekeeping staff.
Location (Abbreviation) Description
Break room (BR) ED staff room for short lunch breaks and time-offs
Communication Center (CC)
Staffed center that provides the ED team with information about potential victims arriving via EMS
Extended Medical Attending Office (EMAO)
Conference room for team discussions of patient cases (equipped with computers for EMR access)
Hallway (HW) 7 beds in the ED hallways that are used when the rooms are full
Central Nurse Station (NS)
Computer systems for assistants, nurses, residents and consults from inpatient services
Pixys (P)
Automated medication dispensing system with barcode scanning for medication management. Used mainly by patient nurses
Patient Room (PR) 27 rooms for ED admitted patients
Trauma bay (T)
Temporary venue for immediate stabilization and evaluation of high acuity patients
Waiting Room (WR) Waiting area for families of patients
Attending Workstation (WS) Computer station for ED attending physicians’ use
Table 1. ED locations, abbreviations and their descriptions.
The ED activities were spread across the unit. A brief description of the ED locations is provided in Table 1.
Data Collection and Participants
Data were collected using a multi-faceted methodological approach supported by general observations of the ED workflow, physician shadowing and semi-structured physician interviews.
General Observations: We conducted 36 hours of observation of patient care teams (over 9 physician shifts of approximately 4 hours each). We took field notes on the various aspects of the ED workflow including roles of patient care team and their respective activities, interactions with artifacts, and others team members. The observations were conducted during different times of the day over 1 month to ensure that we captured representative data.
Physician Shadowing: To develop a deeper understanding on ED physician activities, we closely shadowed six (n=6) attending physicians, each for a period of approximately 4 hours during their shifts (Total shadowing time = 24 hours). During the shadowing sessions, we focused on the specific tasks and actions of the physician as he or she went through the patient care delivery and management process. The shadowing was supported by a time-motion data collection approach. During data collection, the first author documented physician activities using a pre-created activity log template and a stopwatch. Details of physician activities were captured at approximately 30 seconds time intervals. Data collected using the template included the current physician activity, time spent on the activity, and the artifacts used for the task. All task activities that were performed by the physician during each time interval were recorded. Additionally, if the physicians were interrupted during their activity, these were recorded as interruptions to their original activity.
Physician Activity Location Time Discussion with resident about patient's leg X ray; enter orders EMAO 1 min Talks to resident about patient’s plan of care EMAO 1 min Enters medication orders for patient; Interruption (talks to resident) Computer 2 min Types in orders to cancel certain labs Computer 3 min
Table 2. A snapshot from a physician shadowing session that was transferred into MS Excel. The activity, location and time spent by
the physician on the activity are shown.
Clinician Interviews: We also conducted eight semi-structured interviews in total [attending physicians (n=4) and residents (n=4)]. The interviews questions were focused on four main themes: nature of physician activities, physician use of electronic medical record (EMR), ED clinical workflow challenges and the strategies used to overcome the challenges. The interviews were audio-recorded and each interview lasted between 25 to 45 minutes. Informal interviews with physician consults, nurses and charge nurses were also performed to obtain their perspectives on physicians’ activities in the ED.
Data Analysis
Observation, shadowing and interview data were transcribed verbatim for analysis. Our analysis was comprised of two
Proceedings of the Human Factors and Ergonomics Society 58th Annual Meeting - 2014 799
at Univ of Illinois at Chicago Library on December 22, 2015pro.sagepub.comDownloaded from

stages: Stage 1 supported by qualitative analysis and stage 2 supported by quantitative analysis.
Stage 1: The observation and interview data were coded and analyzed using the Grounded Theory approach (Corbin & Strauss, 1990), which consisted of three steps. First, a line-by-line analysis of the transcribed data was performed to derive open codes from the data. Examples of open codes included information needs, roles of team, ED workflow, sequence of steps in patient care, routine exceptions, tools and technologies used, and challenges to patient care, and workarounds. Second step involved the identification of repeated patterns of physician activities. The core categories characterizing physician workflow included patient care activities, documentation, administrative work, breaks, communication with other clinicians and teaching. The last step involved selective coding where the coding was iteratively performed around the core categories to develop a process map of the ED patient care workflow. A detailed description of the identified physician activities can be found in Table 3.
Physician Activity Description Administration (Ad)
Activities that indirectly contribute to patient care - patient flow management, searching for care providers, discussing staffing issues, resident conferences, etc.
Break (B) Breaks in physician activities related to a variety of reasons
Communication (C-P, C-R, C-N, C-F, C-Ph, C-Dict)
Interaction with consults (P), residents (R), nurses (N), family (F), phone conversations with EMS or other staff (Ph), or dictating phone summary (Dict)
Documentation (Doc) Physician documenting information about patient and care: electronic and paper.
Patient Care (PC) Patient assessment and care activities (in the patient room)
Status Updates (St-E) Checking for electronic status updates Teaching (T) Providing advice to residents Walking (W)
Physical movement (walking) to different areas of the ED
Table 3. Physician activities in the ED and a short description of each activity.
Stage 2: The time-motion data from the physician shadowing captured using the activity logs (an example shown in Table 2) were transferred into a Microsoft Excel workbook for analysis. Data was coded using the structured codes (see Table 3) generated in stage 1 by two researchers. There was less than 10% disagreement between the coders on the categorization of activities. The disagreements were resolved through discussion. Once the coding was completed, the physician shadowing data was analyzed including the patterns of distribution of physician activities (e.g., patient care, documentation) in terms of the time spent for each activity and the location of each of these activities. As previously described, we also recorded the time that the physicians were interrupted during a particular activity. For example, while entering orders, a physician was interrupted by a nurse asking him to sign some documents (i.e., a documentation task that was interrupted by an administrative task). This instance was coded in the following manner: documentation [original activity, time spent], admin [interrupted activity, time spent]. For computing the time spent on various activities, the time
spent on the documentation and administrative tasks were separately assessed. But, the administrative task was categorized with an extra label that identified it as an interrupted activity.
RESULTS
In this section, we report on our initial findings related to the complexity of the ED clinical environment and its impact on physician workflow. The results are organized in the following manner: first, we describe the distribution of ED physician activities, both in terms of the time spent on activities and the location of these activities. Second, we characterize the percentage of activity (and location) time that involved interruptions in their primary activities.
Distribution of ED Physician Activities
Figure 1 shows the percentage of total time that was spent on the various activities.
Figure 1. Percentage of time spent by ED physicians on various tasks (inset: the distribution of the communication)
Time distribution: As reported elsewhere (Creswick, Westbrook, & Braithwaite, 2009; Redfern, Brown, & Vincent, 2009), communication represented a significant proportion of ED physician workflow (37%). The communication category involved interactions with residents, nurses, discussion on the phone with consults, patient family and dictation of notes (see Figure 1 for a distribution of the communication activities).
Figure 2. Percentage of time spent by physician at various locations
in the ED.
As expected, a significant percentage of the time is spent on patient care (PC) activities (20%). Surprisingly, although an academic hospital, the percentage of time spent on teaching
Proceedings of the Human Factors and Ergonomics Society 58th Annual Meeting - 2014 800
at Univ of Illinois at Chicago Library on December 22, 2015pro.sagepub.comDownloaded from
was less than 5%. This was likely due to significantly busy nature of the clinical work activities in the ED.
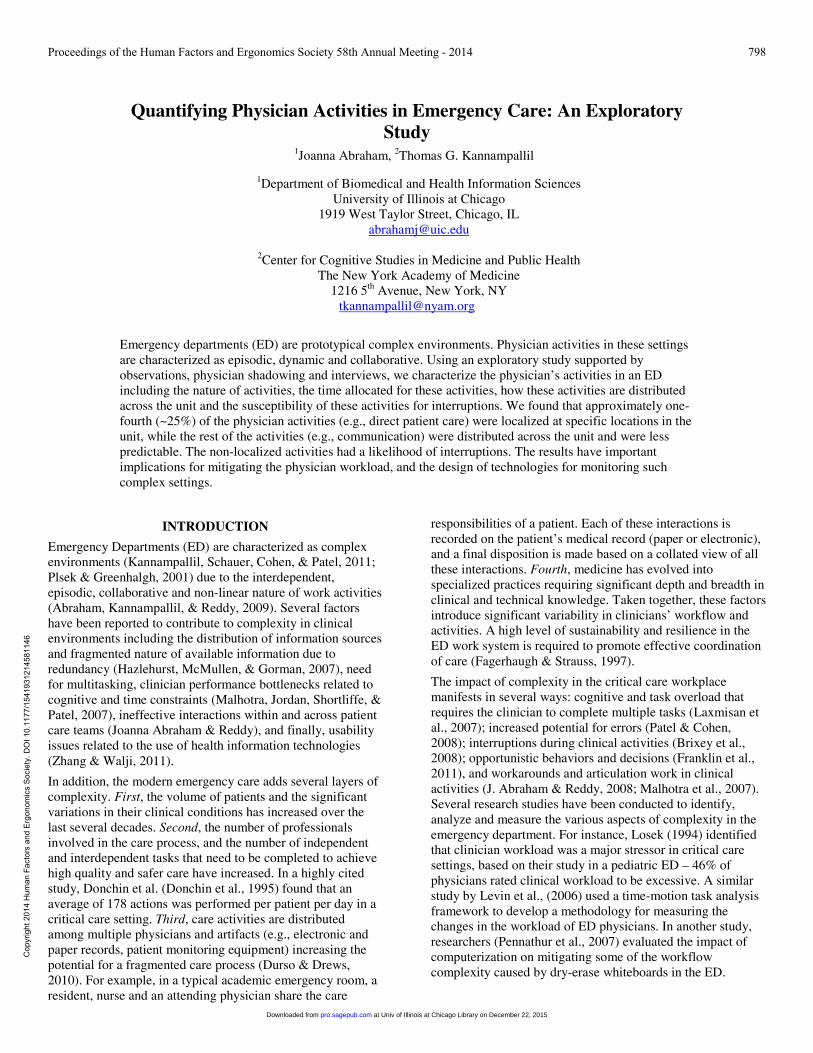
Location distribution: In terms of the location of the physician activities, physicians spent a significant amount of time at the EMAO (34%), at their workstations (30%), patient rooms (15%) and in the hallways (14%) (See Figure 2). We also identified “hot spots” of physician activity. In other words, we computed the percentage of time that was spent at these locations for each of the identified physician activities. Figure 3 shows a “heat map” of the activities and their corresponding locations. The value within each cell shows the proportion of the time spent in performing the tasks at that location. For example, at the EMAO, a significant proportion of the activities are related to communication (0.34). Similarly, patient care (PC) activities were localized in patient rooms (PR) (0.95), in trauma bed (0.96), or in hallway beds (0.27).
Figure 3. Heat map showing the distribution of physician activities
across the ED unit; with the darker shades showing a higher likelihood of the activity occurring at that location. The values can be
interpreted by reading in the following order “physician activity-location” (e.g., proportion of time spent on admin events at nurse
station (NS) is 0.67); each row totals to 1.
In general, we can draw the following insights from this analysis: the locus of key physician activities (e.g., patient care, documentation) is localized at centralized areas; in contrast, other activities (e.g., administration, communication) are distributed across the ED unit.
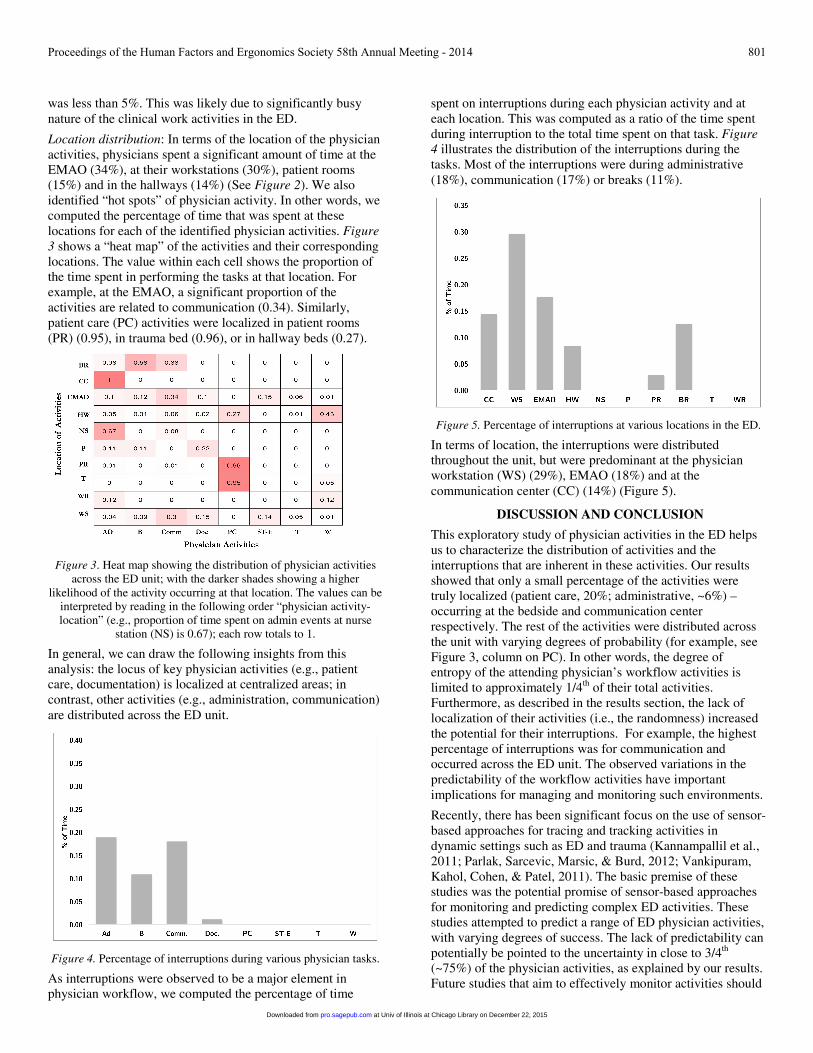
Figure 4. Percentage of interruptions during various physician tasks.
As interruptions were observed to be a major element in physician workflow, we computed the percentage of time
spent on interruptions during each physician activity and at each location. This was computed as a ratio of the time spent during interruption to the total time spent on that task. Figure 4 illustrates the distribution of the interruptions during the tasks. Most of the interruptions were during administrative (18%), communication (17%) or breaks (11%).
Figure 5. Percentage of interruptions at various locations in the ED.
In terms of location, the interruptions were distributed throughout the unit, but were predominant at the physician workstation (WS) (29%), EMAO (18%) and at the communication center (CC) (14%) (Figure 5).
DISCUSSION AND CONCLUSION
This exploratory study of physician activities in the ED helps us to characterize the distribution of activities and the interruptions that are inherent in these activities. Our results showed that only a small percentage of the activities were truly localized (patient care, 20%; administrative, ~6%) – occurring at the bedside and communication center respectively. The rest of the activities were distributed across the unit with varying degrees of probability (for example, see Figure 3, column on PC). In other words, the degree of entropy of the attending physician’s workflow activities is limited to approximately 1/4th of their total activities. Furthermore, as described in the results section, the lack of localization of their activities (i.e., the randomness) increased the potential for their interruptions. For example, the highest percentage of interruptions was for communication and occurred across the ED unit. The observed variations in the predictability of the workflow activities have important implications for managing and monitoring such environments.
Recently, there has been significant focus on the use of sensor-based approaches for tracing and tracking activities in dynamic settings such as ED and trauma (Kannampallil et al., 2011; Parlak, Sarcevic, Marsic, & Burd, 2012; Vankipuram, Kahol, Cohen, & Patel, 2011). The basic premise of these studies was the potential promise of sensor-based approaches for monitoring and predicting complex ED activities. These studies attempted to predict a range of ED physician activities, with varying degrees of success. The lack of predictability can potentially be pointed to the uncertainty in close to 3/4th (~75%) of the physician activities, as explained by our results. Future studies that aim to effectively monitor activities should
Proceedings of the Human Factors and Ergonomics Society 58th Annual Meeting - 2014 801
at Univ of Illinois at Chicago Library on December 22, 2015pro.sagepub.comDownloaded from

focus on localized activities – such as patient care, and documentation.
Limitations: There are several limitations for our study. First, the study was based on a small, but representative, observational sample (24 h of total shadowing data) and 6 attending physicians. Second, shadowing sessions were conducted by a single observer. Third, the results were based on a single ED unit. Further research is required to establish the generalizability of the results. However, given the limited research on characterizing the workflow activities and its potential for monitoring and management of ED, this exploratory study provides an initial perspective for future research studies.
REFERENCES
Abraham, J., Kannampallil, T. G., & Reddy, M. C. (2009). Peripheral activities during EMR use in emergency care: a case study. Paper presented at the AMIA Annual Symposium Proceedings San Francisco, CA.
Abraham, J., & Reddy, M. C. Challenges to inter-departmental coordination of patient transfers: A workflow perspective. International Journal of Medical Informatics, 79(2), 112-122. doi: 10.1016/j.ijmedinf.2009.11.001
Abraham, J., & Reddy, M. C. (2008). Moving patients around: a field study of coordination between clinical and non-clinical staff in hospitals. Paper presented at the Proceedings of the 2008 ACM conference on Computer supported cooperative work.
Brixey, J. J., Tang, Z., Robinson, D. J., Johnson, C. W., Johnson, T. R., Turley, J. P., . . . Zhang, J. (2008). Interruptions in a level one trauma center: a case study. International journal of medical informatics, 77(4), 235-241.
Corbin, J. M., & Strauss, A. (1990). Grounded theory research: Procedures, canons, and evaluative criteria. Qualitative sociology, 13(1), 3-21.
Creswick, N., Westbrook, J., & Braithwaite, J. (2009). Understanding communication networks in the emergency department. BMC Health Services Research, 9(1), 247.
Donchin, Y., Gopher, D., Olin, M., Badihi, Y., Biesky, M. R., Sprung, C. L., . . . Cotev, S. (1995). A look into the nature and causes of human errors in the intensive care unit. Critical Care Medicine, 23(2), 294-300.
Durso, F. T., & Drews, F. A. (2010). Health Care, Aviation, and Ecosystems A Socio-Natural Systems Perspective. Current Directions in Psychological Science, 19(2), 71-75.
Fagerhaugh, S. Y., & Strauss, A. L. (1997). Social organization of medical work: Transaction Publishers.
Franklin, A., Liu, Y., Li, Z., Nguyen, V., Johnson, T. R., Robinson, D., . . . Zhang, J. (2011). Opportunistic decision making and complexity in emergency care. Journal of Biomedical Informatics, 44(3), 469-476.
Hazlehurst, B., McMullen, C. K., & Gorman, P. N. (2007). Distributed cognition in the heart room: how situation awareness arises from coordinated communications
during cardiac surgery. Journal of Biomedical Informatics, 40(5), 539-551.
Kannampallil, T. G., Li, Z., Zhang, M., Cohen, T., Robinson, D., Franklin, A., . . . Patel, V. L. (2011). Making sense: Sensor-based investigation of clinician activities in complex critical care environments. Journal of Biomedical Informatics, 44(3), 441-454.
Kannampallil, T. G., Schauer, G. F., Cohen, T., & Patel, V. L. (2011). Considering complexity in healthcare systems. Journal of Biomedical Informatics, 44(6), 943-947.
Laxmisan, A., Hakimzada, F., Sayan, O. R., Green, R. A., Zhang, J., & Patel, V. L. (2007). The multitasking clinician: decision-making and cognitive demand during and after team handoffs in emergency care. International Journal of Medical Informatics, 76(11-12), 801-811.
Levin, S., France, D. J., Hemphill, R., Jones, I., Chen, K. Y., Rickard, D., . . . Aronsky, D. (2006). Tracking Workload in the Emergency Department. Human Factors: The Journal of the Human Factors and Ergonomics Society, 48(3), 526-539. doi: 10.1518/001872006778606903
Losek, J. (1994). Characteristics, workload, and job satisfaction of attending physicians from pediatric emergency medicine fellowship programs. Pediatric Emergency Care, 10, 256-259.
Malhotra, S., Jordan, D., Shortliffe, E., & Patel, V. L. (2007). Workflow modeling in critical care: piecing together your own puzzle. Journal of Biomedical Informatics, 40, 81-92.
Parlak, S., Sarcevic, A., Marsic, I., & Burd, R. S. (2012). Introducing RFID technology in dynamic and time-critical medical settings: Requirements and challenges. Journal of Biomedical Informatics, 45(5), 958-974.
Patel, V. L., & Cohen, T. (2008). New Perspectives on Error in Critical Care. Current Opinion in Critical Care, 14(4), 456-459.
Pennathur, P. R., Bisantz, A. M., Fairbanks, R. J., Perry, S. J., Zwemer, F., & Wears, R. L. (2007). Assessing the Impact of Computerization on Work Practice: Information Technology in Emergency Departments. Proceedings of the Human Factors and Ergonomics Society Annual Meeting, 51(4), 377-381.
Plsek, P. E., & Greenhalgh, T. (2001). Complexity science: The challenge of complexity in health care. BMJ, 323(7313), 625-628.
Redfern, E., Brown, R., & Vincent, C. A. (2009). Identifying vulnerabilities in communication in the emergency department. Emergency Medicine Journal, 26(9), 653-657.
Vankipuram, M., Kahol, K., Cohen, T., & Patel, V. L. (2011). Toward automated workflow analysis and visualization in clinical environments. J Biomed Inform, 44(3), 432-440.
Zhang, J. J., & Walji, M. F. (2011). TURF: Toward a unified framework of EHR usability. Journal of Biomedical Informatics, 44(6), 1056-1067. doi: DOI 10.1016/j.jbi.2011.08.005
Proceedings of the Human Factors and Ergonomics Society 58th Annual Meeting - 2014 802
at Univ of Illinois at Chicago Library on December 22, 2015pro.sagepub.comDownloaded from