quantification of uncertainty in machining operations for ... · quantification of uncertainty in...
TRANSCRIPT

SANDIA REPORT SAND2008-6396 Unlimited Release Printed September 2008
Quantification of Uncertainty in Machining Operations for On-Machine Acceptance Hy D. Tran, Jiann-Cherng Su, Andre A. Claudet Prepared by Sandia National Laboratories Albuquerque, New Mexico 87185 and Livermore, California 94550 Sandia is a multiprogram laboratory operated by Sandia Corporation, a Lockheed Martin Company, for the United States Department of Energy’s National Nuclear Security Administration under Contract DE-AC04-94AL85000. Approved for public release; further dissemination unlimited.

Issued by Sandia National Laboratories, operated for the United States Department of Energy by Sandia Corporation. NOTICE: This report was prepared as an account of work sponsored by an agency of the United States Government. Neither the United States Government, nor any agency thereof, nor any of their employees, nor any of their contractors, subcontractors, or their employees, make any warranty, express or implied, or assume any legal liability or responsibility for the accuracy, completeness, or usefulness of any information, apparatus, product, or process disclosed, or represent that its use would not infringe privately owned rights. Reference herein to any specific commercial product, process, or service by trade name, trademark, manufacturer, or otherwise, does not necessarily constitute or imply its endorsement, recommendation, or favoring by the United States Government, any agency thereof, or any of their contractors or subcontractors. The views and opinions expressed herein do not necessarily state or reflect those of the United States Government, any agency thereof, or any of their contractors. Printed in the United States of America. This report has been reproduced directly from the best available copy. Available to DOE and DOE contractors from U.S. Department of Energy Office of Scientific and Technical Information P.O. Box 62 Oak Ridge, TN 37831 Telephone: (865) 576-8401 Facsimile: (865) 576-5728 E-Mail: [email protected] Online ordering: http://www.osti.gov/bridge Available to the public from U.S. Department of Commerce National Technical Information Service 5285 Port Royal Rd. Springfield, VA 22161 Telephone: (800) 553-6847 Facsimile: (703) 605-6900 E-Mail: [email protected] Online order: http://www.ntis.gov/help/ordermethods.asp?loc=7-4-0#online
2

Table of Contents Table of Contents............................................................................................................................ 3 Acknowledgments........................................................................................................................... 4 Executive Summary ........................................................................................................................ 5 Introduction..................................................................................................................................... 5 Analysis........................................................................................................................................... 8
Cutting Process and Workpiece Effects...................................................................................... 9 Machine Geometry Errors......................................................................................................... 13 Machining Accuracy Ratio Estimate ........................................................................................ 15
Experimental Results .................................................................................................................... 16 Discussion..................................................................................................................................... 17 Recommendations......................................................................................................................... 18 References..................................................................................................................................... 19
3

Acknowledgments This research was funded by the Sandia National Laboratories LDRD program (Laboratory Directed Research and Development), project 127737 (May 2008-September 2008). The authors greatly appreciate very helpful technical consultation from Steve Myatt in Organization 02431, and Meghan Shilling in Organization 02541. The authors also greatly appreciate the contributions from the manufacturing, machining, and inspection groups in Organization 02431, including Tony Bryce, Monico Lucero, Daryl Reckaway, and Kurt Tomlinson.
4

Executive Summary Manufactured parts are designed with acceptance tolerances, i.e. deviations from ideal design conditions, due to unavoidable errors in the manufacturing process. It is necessary to measure and evaluate the manufactured part, compared to the nominal design, to determine whether the part meets design specifications. The scope of this research project is dimensional acceptance of machined parts; specifically, parts machined using numerically controlled (NC, or also CNC for Computer Numerically Controlled) machines. In the design/build/accept cycle, the designer will specify both a nominal value, and an acceptable tolerance. As part of the typical design/build/accept business practice, it is required to verify that the part did meet acceptable values prior to acceptance. Manufacturing cost must include not only raw materials and added labor, but also the cost of ensuring conformance to specifications. Ensuring conformance is a substantial portion of the cost of manufacturing. In this project, the costs of measurements were approximately 50% of the cost of the machined part. In production, cost of measurement would be smaller, but still a substantial proportion of manufacturing cost. The results of this research project will point to a science-based approach to reducing the cost of ensuring conformance to specifications. The approach that we take is to determine, a priori, how well a CNC machine can manufacture a particular geometry from stock. Based on the knowledge of the manufacturing process, we are then able to decide features which need further measurements from features which can be accepted “as is” from the CNC. By calibration of the machine tool, and establishing a machining accuracy ratio, we can validate the ability of CNC to fabricate to a particular level of tolerance. This will eliminate the costs of checking for conformance for relatively large tolerances.
Introduction Due to the short duration of this research project, we limit the scope to machining of metal parts on CNC milling machines, and to 2-D (X-Y) errors. For the test parts used in this research project, the cost of the measurements (that is, ensuring conformance to specifications) were nearly 50% of the cost of production. We estimate that in more typical production scenarios, cost of measurements could easily be 30%. The development of a science-based business practice that can ensure conformance to specifications, but reduce overall manufacturing costs, is clearly an important contribution. In traditional manufacturing practice, the parts are designed by an engineering design team. The design and specifications are then passed to manufacturing. The manufacturing engineering team then develops a manufacturing plan, which includes programming the CNC machines. Quality assurance develops the measurement plans which will ensure compliance. Traditional manufacturing practice is sequential in nature, with limited feedback loops. This is illustrated in Figure 1.
5

Manufacturing engineering creates manufacturing process; assigns machine tools, tooling; obtains materials; writes CNC program
Machine parts
Quality & Inspection create inspection plan & conformance documentation
Rework or scrap
Measure & assure conformance
Yes
Ship part
Conforming?
No
Design data given to manufacturing (typically CAD file)
Figure 1. Simplified illustration of sequential flow in manufacturing. Note that every step incurs a cost. The decision as to whether the part conforms or not occurs very late in the manufacturing process, after a large fraction of the total value has been added to the part. In addition to that, the measurement/conformance process is a large portion of the cost of the part: Nearly 50% of the part for our test case, and likely on the order of 30% for a “typical” production part. The breakdown in costs for this particular test case was approximately 15% for raw material; 35% for machining costs, and 50% for measurement and inspection. For a more typical production part, the machining costs would be higher, because in our case, we saved costs by reusing an existing CNC part program.
6

If we calibrate a machine tool, we may be able to establish the measurement uncertainty (and therefore, whether the part would meet acceptance criteria without further measurements) for some of the geometric features in a part. Calibration is defined as [1]:
Operation that, under specified conditions, in a first step, establishes a relation between the quantity values with measurement uncertainties provided by measurement standards and corresponding indications with measurement uncertainties, and, in a second step, uses this information to establish a relation for obtaining a measurement result from an indication.
A useful definition for the calibration of a machine tool would be: “Establishing that the machine tool performs to an accepted performance specification.” The accepted performance specification may include national or international performance evaluation criteria, such as the ASME B5.54 standard “Methods for Performance Evaluation of Computer Numerically Controlled Machining Centers.” If a CNC machine tool has been calibrated, it should be possible to establish, a priori, uncertainty limits on parts as they are generated by the machine. Features whose acceptance limits are much larger than machining uncertainty could therefore be accepted, on the basis of the CNC machine calibration. In measurement and product acceptance practice, a “TAR” (Test Accuracy Ratio) is generally used. For many parts designed at Sandia National Laboratories, the “9900000” specification (more formally, “General Requirements per 9900000”) is mandatory. This specification defines TAR [2], and its use in measurement acceptance, as follows [3]: “The test accuracy ratio shall be defined as the product characteristic tolerance divided by the collective measurement uncertainty of the equipment. When test accuracy ratios of 4:1 or greater are maintained or when the product definition specifies the measuring equipment to be used, the resulting values can be directly compared to the specified limits.” An example would be a specification of a width of 10.00 mm ±0.01 mm. If a micrometer is used to measure that width, and the micrometer accuracy (certified by calibrating the micrometer) is ±0.002 mm, the TAR is 0.01/0.002=5:1, therefore, the micrometer reading may be used to accept or reject the part based on the width dimension. Note that because the micrometer accuracy is ±0.002 mm, it is possible to measure a part and obtain 10.01 mm (this is considered an acceptable part). However, there is a chance that the part could, in fact, be 10.012 mm (measurement uncertainty with the micrometer is ±0.002 mm). The business practice of 9900000 is to accept the consumer risk, that is, the risk of accepting parts which may, in fact, be non-conforming. This business practice has been in place since World War II with acceptable results, because performance margins for designs are generally wider than manufacturing margins. We propose a Machining Accuracy Ratio (MAR), modeled along the lines of the TAR definition. By examining the results of the calibration of a CNC machine tool, we would determine what is the expected tolerance which could be met with this machine. If a desired dimension on the part has a sufficiently wider tolerance than the machine capability, that dimension could be accepted “as-is” from the machine tool, without further inspection. The ratio of the specification tolerance to the machine tolerance capability is the MAR. A large MAR (MAR>>1) indicates very high confidence that the dimension conforms “as-is” from the
7
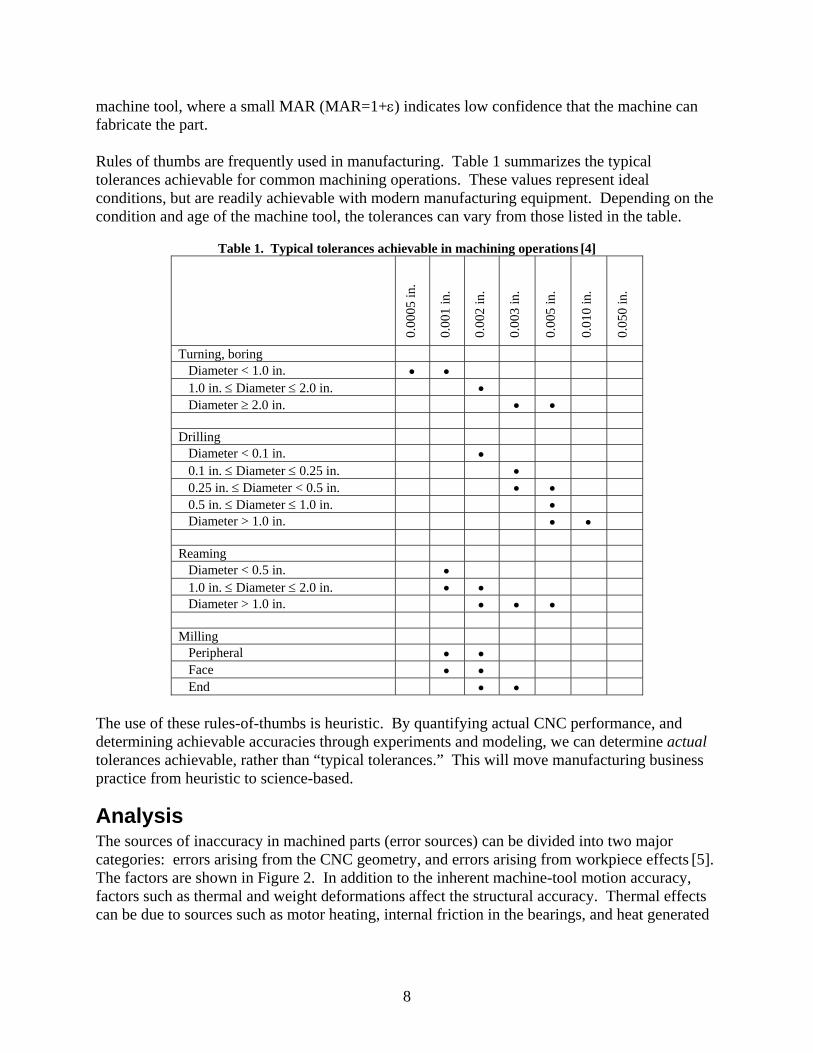
machine tool, where a small MAR (MAR=1+ε) indicates low confidence that the machine can fabricate the part. Rules of thumbs are frequently used in manufacturing. Table 1 summarizes the typical tolerances achievable for common machining operations. These values represent ideal conditions, but are readily achievable with modern manufacturing equipment. Depending on the condition and age of the machine tool, the tolerances can vary from those listed in the table.
Table 1. Typical tolerances achievable in machining operations [4]
0.00
05 in
.
0.00
1 in
.
0.00
2 in
.
0.00
3 in
.
0.00
5 in
.
0.01
0 in
.
0.05
0 in
.
Turning, boring Diameter < 1.0 in. • • 1.0 in. ≤ Diameter ≤ 2.0 in. • Diameter ≥ 2.0 in. • • Drilling Diameter < 0.1 in. • 0.1 in. ≤ Diameter ≤ 0.25 in. • 0.25 in. ≤ Diameter < 0.5 in. • • 0.5 in. ≤ Diameter ≤ 1.0 in. • Diameter > 1.0 in. • • Reaming Diameter < 0.5 in. • 1.0 in. ≤ Diameter ≤ 2.0 in. • • Diameter > 1.0 in. • • • Milling Peripheral • • Face • • End • •
The use of these rules-of-thumbs is heuristic. By quantifying actual CNC performance, and determining achievable accuracies through experiments and modeling, we can determine actual tolerances achievable, rather than “typical tolerances.” This will move manufacturing business practice from heuristic to science-based.
Analysis The sources of inaccuracy in machined parts (error sources) can be divided into two major categories: errors arising from the CNC geometry, and errors arising from workpiece effects [5]. The factors are shown in Figure 2. In addition to the inherent machine-tool motion accuracy, factors such as thermal and weight deformations affect the structural accuracy. Thermal effects can be due to sources such as motor heating, internal friction in the bearings, and heat generated
8
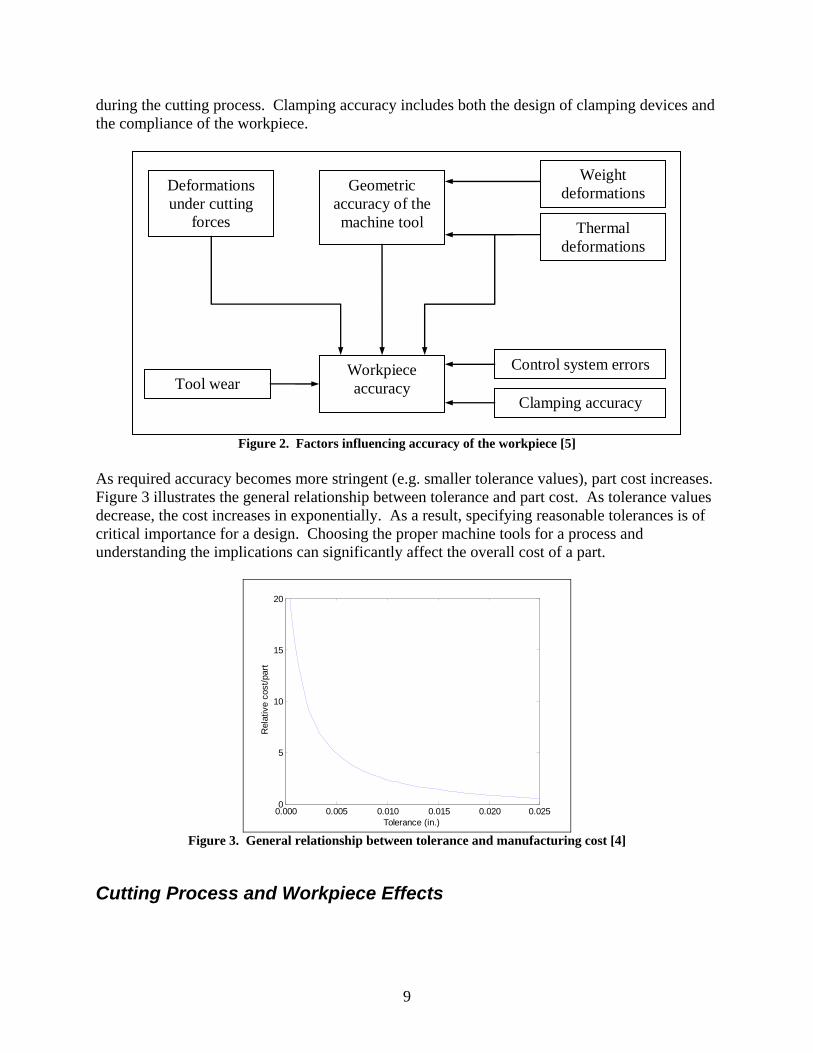
during the cutting process. Clamping accuracy includes both the design of clamping devices and the compliance of the workpiece.
Deformations under cutting
forces
Geometric accuracy of the machine tool
Weight deformations
Thermal deformations
Tool wear Workpiece accuracy
Control system errors
Clamping accuracy
Figure 2. Factors influencing accuracy of the workpiece [5]
As required accuracy becomes more stringent (e.g. smaller tolerance values), part cost increases. Figure 3 illustrates the general relationship between tolerance and part cost. As tolerance values decrease, the cost increases in exponentially. As a result, specifying reasonable tolerances is of critical importance for a design. Choosing the proper machine tools for a process and understanding the implications can significantly affect the overall cost of a part.
0.000 0.005 0.010 0.015 0.020 0.0250
5
10
15
20
Tolerance (in.)
Rel
ativ
e co
st/p
art
Figure 3. General relationship between tolerance and manufacturing cost [4]
Cutting Process and Workpiece Effects
9

The cutting process also plays a strong role in the overall workpiece accuracy. The cutting forces produce deformations of the machine-tool structure. These deformations cause errors in dimension and form of the workpiece. The extent of the deformation depends on the structural stiffness of machine-tool. Additionally, tool wear due to cutting can affect the dimensions of machine surfaces. The geometric form of the blank workpiece is typically imperfect. This is illustrated in Figure 4. If the deformation remained constant throughout the machining operation, the errors in form accuracy could be minimized. However, the variation in ideal form produces variable cutting forces due to the changing depths of cut. The contribution of the prior form error to the final form depends on the cutting conditions and tool and workpiece stiffness. The amount of error before the operation and after the operation is related to the operational setup. Specifically, it is proportional to ratio of the cutting stiffness to the machine stiffness [5]. The rate of error copying i is given by
1
i μμ
=+
(1)
where μ is the ratio of cutting stiffness to the machine stiffness. In conditions where μ << 1, few cuts are required to eliminate the initial form error. For situations where μ is larger, more cutting passes will be required. The notion of error copying is important in that it provides a basis for estimating the type of finish that can be generated based on the initial condition of the workpiece and the cutting parameters. This information can be used to set process parameters to achieve a desired finish for roughing and finishing cuts. Error copying is illustrated in Figure 4.
Desired surface
Original surface
Cut surface
amax
amin
xmax xmin
a’max
a’min
Δ
Tool
Machined part
Figure 4. Copying the workpiece form errors due to depth-of-cut [5].
10

As previously mentioned, forces produced during cutting will result in a deflection between the workpiece and the machine tool. The amount of deflection depends on the cutting conditions and the stiffness of the machine tool. Methods for predicting cutting forces for helical milling are extensively documented in the literature [6-8]. In this study, the method proposed by Li [6] is used to estimate cutting forces during machining. The forces are then used to predict the deflection between the tool and the workpiece, and thus the form error. For helical endmilling, the cutting edge contacts the workpiece at different points during the cutter rotation. In order to predict the total cutting force, the cutter is divided into axial segments. Each segment is treated as an oblique cut, with the elemental cutting force directions relative to the tool tip. The forces are then transformed into a common coordinate system. Total cutting forces in the feed, normal, and axial directions are derived from summing the elemental forces in the transformed coordinate system. The deflection between the tool and workpiece is approximated as the superposition of the static and dynamic deflection. The static deflection is approximated by Equation (2), where F is the applied load and k is the machine tool stiffness. The machine tool stiffness includes both the machining head and the cutter. Although an exact value for the stiffness was not evaluated for this project, an approximate value of the machine tool stiffness for a similar machining setup has been shown to be approximately 200,000 lb/in [5]. In this effort, the stiffness is assumed to be the same for both the X and Y axes.
maxY
Fk
δ = (2)
The dynamic deflection is computed by treating the system as a second order differential equation with a forced vibration [5], where the forcing function FY is the cutting force normal to the newly generated surface. m represents the cutter mass, c is the damping coefficient, and k is the machine tool stiffness.
( )ymy cy ky F t+ + = (3)
The deflection due to cutting forces is illustrated in Figure 5
11

X
Y
Z Fx
Fy
Fz δY
Deflection due to cutting forces
Figure 5. Tool deflection due to cutting forces
The cutting forces and resulting displacement were computed for the finishing operation. The results of a simulation are shown in Figure 6. The maximum force in the direction of the cut FX is approximately 15 lb (67 N). The maximum force normal to the newly generated surface FY is -11 lb (49 N). The negative value indicates the force is pushing the tool away from the workpiece. Both of these are reasonable values for cutting forces in a finishing operation on aluminum. The force profile is also consistent with a two-flute cutter in that there are two force amplitude changes per revolution. Note that in the displacement diagram of Figure 6, a positive displacement indicates that the flute is in air, not in the workpiece. Therefore, while the total cutter displacement amplitude is approximately 0.00011” (0.0028 mm), the actual displacement in material, which would result in machining error, is 0.00008” (0.002 mm).
0 90 180 270 360 450 540 630 720-20
-10
0
10
20
Cutter Rotation (deg)
Forc
e (lb
f)
Cutting Forces vs. Rotation Angle
Fx - FeedFy - NormalFz - Axial
0 90 180 270 360 450 540 630 720-10
-5
0
5x 10
-5
X: 17.28Y: -7.993e-005
Cutter Rotation (deg)
Dis
plac
emen
t (in
)
Cutter Displacement vs. Rotation Angle
Displacement Normal to Tool
Figure 6. Cutting Force Estimate for Finishing Cuts
12

From the figure, the maximum displacement expected due to cutter deflection is 0.00008 in. This value is on the same order of magnitude as the machine positioning error provided in Table 2. As a result, it should be considered in the overall form error estimates. The displacement oscillation would not be expected to affect the form error since the tool and workpiece are not in contact during the oscillation.
Machine Geometry Errors Machine geometry is another source of machining inaccuracy. Machine geometry effects are due to inherent geometrical imperfection in machine motions. A CNC machine tool is typically a Cartesian machine, which moves a cutting tool with respect to a workpiece. In Cartesian machines, each axis of motion is a linear motion. There are six associated error terms (traditionally referred to as roll, pitch, yaw for rotational error motions, and straightness errors for translational error motions). The error motions are illustrated in Figure 7.
Figure 7. Error motions associated with one linear axis of motion [9]. There are 5 error motions illustrated here; the 6th error motion is the scale factor error motion, or, for motion along the x-axis, deviation with respect to x. Figure 8 illustrates a schematic of a 3-axis Cartesian milling machine. Each axis of motion has 6 error motions, and there are an additional three error terms due to non-squareness between the individual axes. Therefore, a 3-axis machine has 21 possible rigid-body motion deviations from perfect Cartesian geometry. Machine tool manufacturers specify maximum deviations and resolution of their tools, but do not specify accuracy performance. It is up to the customer purchasing the tool to specify acceptance criteria. A number of measurement systems are available commercially for evaluating the performance of CNC machines, using the ASME B5.54 standard.
13
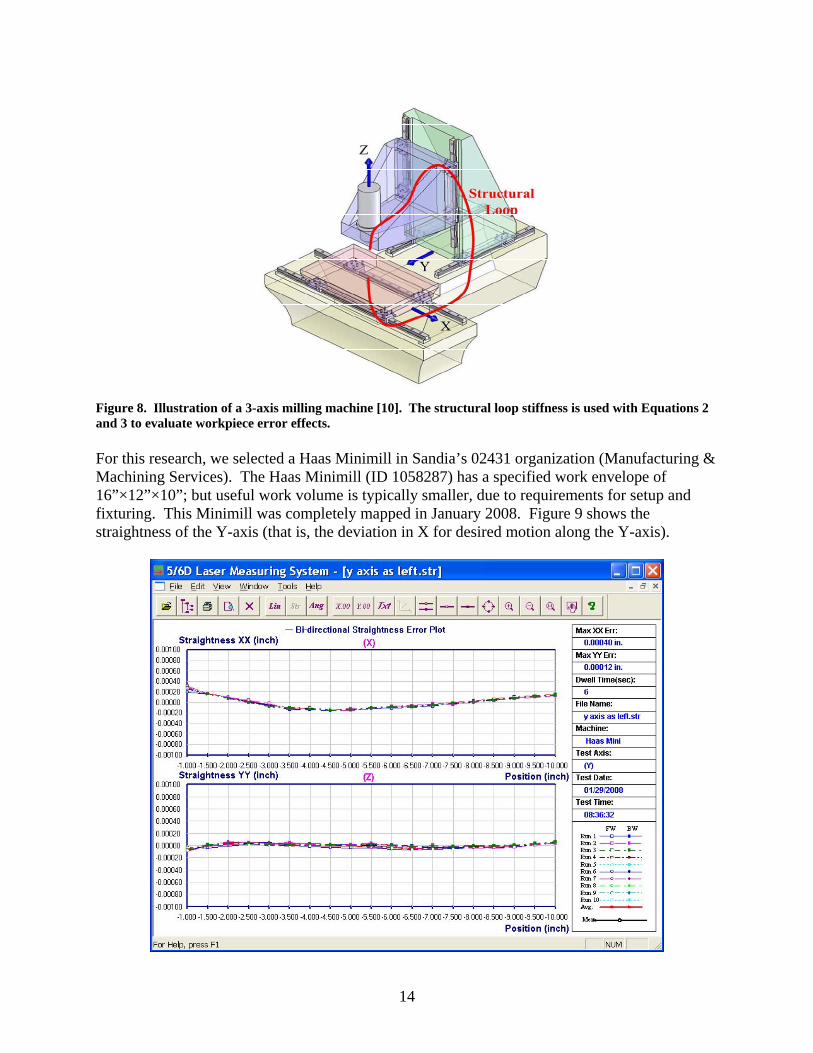
Figure 8. Illustration of a 3-axis milling machine [10]. The structural loop stiffness is used with Equations 2 and 3 to evaluate workpiece error effects. For this research, we selected a Haas Minimill in Sandia’s 02431 organization (Manufacturing & Machining Services). The Haas Minimill (ID 1058287) has a specified work envelope of 16”×12”×10”; but useful work volume is typically smaller, due to requirements for setup and fixturing. This Minimill was completely mapped in January 2008. Figure 9 shows the straightness of the Y-axis (that is, the deviation in X for desired motion along the Y-axis).
14

Figure 9. Plot of deviations in X and in Z for motion along the Y axis (straightness and flatness as shown in Figure 7). A summary of the translational errors (linear or scale factor errors, and straightness errors) is shown in Table 2.
Table 2. Summary of translational errors for Haas Minimill
Axis Linear Error (in)
Straighness X (in)
Straightness Y (in)
Straightness Z (in)
X 0.00023 - 0.00011 0.00018 Y 0.00027 0.00040 - 0.00012 Z 0.00023 0.00033 0.00016 -
The angular error motions in the X-Y plane are yaw errors for X and Y motions. These are 5 arc-seconds and 0.2 arc-seconds respectively. (Z-angular errors are insignificant because we limited the scope to X-Y errors only, and are operating at nearly the same Z-level). The magnitude of translational error due to angular error motion can be calculated by multiplying the sine of the angle error by the distance travelled. The yaw motion along the X-axis can lead to Y error motions of 0.00035” (0.009 mm) and the yaw motion along the Y-axis can lead to X error motions of 0.00001” (0.0002 mm).
Machining Accuracy Ratio Estimate Using guidance from the ISO Guide to the Expression of Uncertainty in Measurement (GUM)
[11], we assume that machining inaccuracy has the following components: • Workpiece and cutter effects • Machine geometry effects • Thermal (environment) effects
We assume that these components are statistically uncorrelated, and can therefore be summed in quadrature. The contribution from workpiece and cutter effects is 0.00008” (0.002 mm). The contribution from geometry depends on direction. A complete analysis of expected errors is not practical within the scope of this project, but if we just look at form errors (that is, deviation from a straight line or deviation from other geometric primitives), we can treat linear, and yaw motions as uncorrelated. From Table 2 and the yaw motions, we estimate geometry error in the X-Y plane to be:
2 2 2 2 20.00055" (0.00023) (0.00027) (0.00040) (0.00011) (0.00035) (0.00001)= + + + + + 2 (4)
Finally, we assume that the workpiece temperature is 22°C. Assuming a coefficient of thermal expansion of 22×10-6 K-1 for aluminum, 12×10-6 K-1 for steel, and a part size of 8.0” (200 mm), we expect a geometry error of:
0.00016" ( )Al SteelL T α α= × Δ × − (5)
15

We therefore expect form error for aluminum parts machined in this Haas Minimill to be on the order of:
2 20.00058"(0.015 mm) (0.00008) (0.00055) (0.00016)= + + 2 (6)
Positional accuracy as a function of workspace location was not modeled.
Experimental Results A “circle-diamond-square” evaluation design from NAS-979 was used as the test part[12]. A solid model of this is shown in Figure 10. This particular design primarily exercises 2-D performance; however, there are other designs and methods in NAS-979 and ASME B5.54 which can be used to evaluate 3-D performance.
Figure 10. Solid model of the "Circle Diamond Square" machining test. The large circular feature is nominally 8.000" in diameter. New tooling (in order to avoid possible errors due to tool wear, which were not modeled) was used to machine the parts . Twenty test artifacts were made for statistical significance. After manufacture, the parts were measured using a Zeiss Coordinate Measuring Machine Prismo 7, (Calibration S715884; expanded measurement uncertainty in 1-D of ±(2.2 +L/300) μm and in 3-D of ±(2.7+L/250) μm, where L is the dimension being measured in mm). This measurement equipment provides sufficiently small measurement uncertainties for the purpose of this research. A summary of the form error averaged over the 20 artifacts for one vertical line, one horizontal line, and one angled line are shown in Table 3.
16
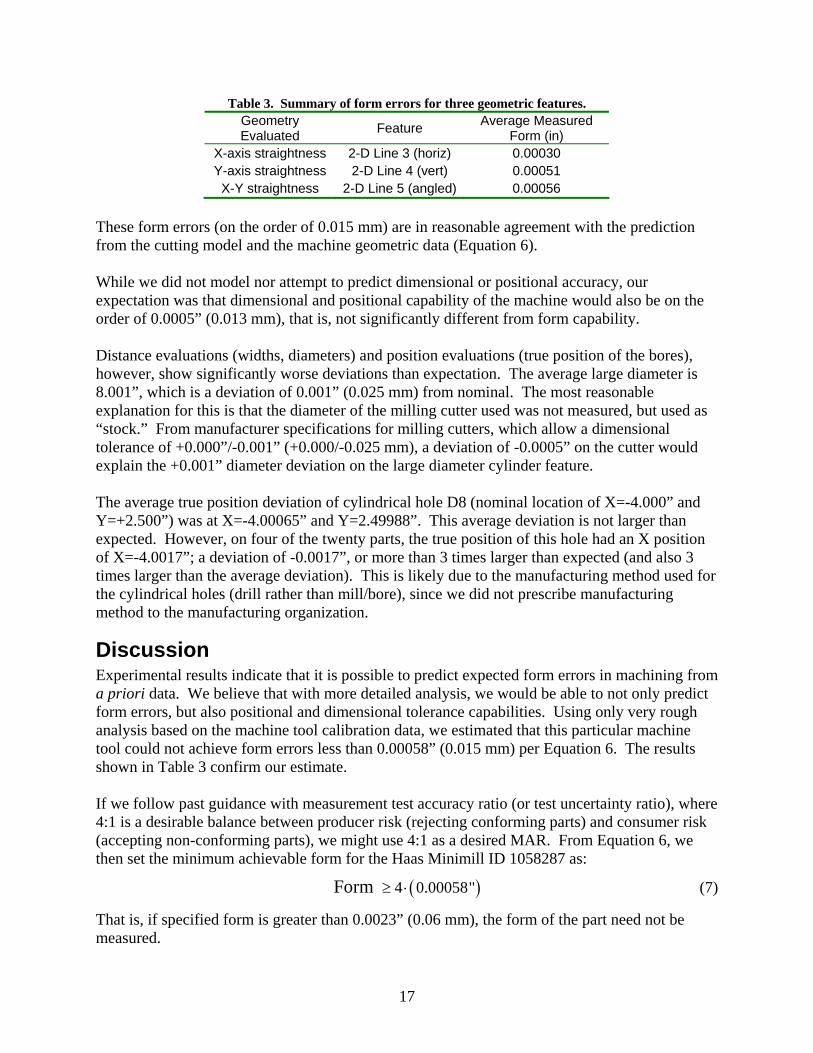
Table 3. Summary of form errors for three geometric features. Geometry Evaluated Feature Average Measured
Form (in) X-axis straightness 2-D Line 3 (horiz) 0.00030 Y-axis straightness 2-D Line 4 (vert) 0.00051
X-Y straightness 2-D Line 5 (angled) 0.00056 These form errors (on the order of 0.015 mm) are in reasonable agreement with the prediction from the cutting model and the machine geometric data (Equation 6). While we did not model nor attempt to predict dimensional or positional accuracy, our expectation was that dimensional and positional capability of the machine would also be on the order of 0.0005” (0.013 mm), that is, not significantly different from form capability. Distance evaluations (widths, diameters) and position evaluations (true position of the bores), however, show significantly worse deviations than expectation. The average large diameter is 8.001”, which is a deviation of 0.001” (0.025 mm) from nominal. The most reasonable explanation for this is that the diameter of the milling cutter used was not measured, but used as “stock.” From manufacturer specifications for milling cutters, which allow a dimensional tolerance of +0.000”/-0.001” (+0.000/-0.025 mm), a deviation of -0.0005” on the cutter would explain the +0.001” diameter deviation on the large diameter cylinder feature. The average true position deviation of cylindrical hole D8 (nominal location of X=-4.000” and Y=+2.500”) was at X=-4.00065” and Y=2.49988”. This average deviation is not larger than expected. However, on four of the twenty parts, the true position of this hole had an X position of X=-4.0017”; a deviation of -0.0017”, or more than 3 times larger than expected (and also 3 times larger than the average deviation). This is likely due to the manufacturing method used for the cylindrical holes (drill rather than mill/bore), since we did not prescribe manufacturing method to the manufacturing organization.
Discussion Experimental results indicate that it is possible to predict expected form errors in machining from a priori data. We believe that with more detailed analysis, we would be able to not only predict form errors, but also positional and dimensional tolerance capabilities. Using only very rough analysis based on the machine tool calibration data, we estimated that this particular machine tool could not achieve form errors less than 0.00058” (0.015 mm) per Equation 6. The results shown in Table 3 confirm our estimate. If we follow past guidance with measurement test accuracy ratio (or test uncertainty ratio), where 4:1 is a desirable balance between producer risk (rejecting conforming parts) and consumer risk (accepting non-conforming parts), we might use 4:1 as a desired MAR. From Equation 6, we then set the minimum achievable form for the Haas Minimill ID 1058287 as:
( )4 0.00058"Form ≥ ⋅ (7)
That is, if specified form is greater than 0.0023” (0.06 mm), the form of the part need not be measured.
17

Similar analysis could be performed for positional accuracy (we did not do that in this particular research program, as this is an exploratory study). Based on the calibration data for the Haas Minimill ID 1058287, we can map the expected deviations of the tool from the workpiece based on machine geometry, based on Cartesian locations within the workspace. Using the illustration of Figure 8 as representative of a 3-axis milling machine similar to the Haas Minimill ID 1058287, we overlay expected deviations from nominal positions within the machine workspace, as shown in Figure 11. The diagram on the right of Figure 11 illustrates the compound positioning error in the X-Y plane over the X-Y range of motion, if we model the error as additive worst-case error, as opposed to the GUM approach of summing in quadrature. The error map is overlaid on an illustrative machine on the left side of the figure.
0
24
68
1012
14
0
2
4
6
8
100
0.5
1
1.5
2
2.5
x 10-3
X (in)
Composite Error
Y (in)
Erro
r (in
)
Figure 11. Mapping positional errors within the workspace of a machine. From Figure 11, we would expect that parts fabricated in the region 0<x<6 and 0<y<8 would have smaller errors due to machine geometry than parts fabricated in the region 8<x<14 and 6<y<10.
Recommendations Ensuring conformance is a substantial fraction of manufacturing costs. A science-based approach to modeling and estimating machine capability can provide a “MAR”. Mapping the MAR from machine to individual design and acceptance requirements in manufacturing could potentially greatly reduce manufacturing costs. The geometric performance of the machine tool is fully characterized by the machine tool metrology program over the entire work volume. Where possible, compensation tables are updated in the machine controller to reduce or eliminate there magnitude. However, even after compensation some known errors remain in the form of a three dimensional interpolation table. Using that knowledge combined with a CAM machining plan, the “no-load” actual position of the machine can be predicted at every step. To account for loading of the machine due to workpiece-tool interaction, some estimate must be made in the analysis of the forces generated and resultant compliances in both the machine and workpiece. This can be done using computational simulations or simpler, conservative linear rules. The environmental conditions
18

(temperature, most significantly) are accounted for with first principles analysis. These factors yield an estimation of the total uncertainty in machining and allow calculation of the MAR. It appears feasible that a science based business practice establishing a threshold MAR value for graded approaches to product acceptance can be used to reduce cost and decrease manufacturing time. Further research directions should include developing a full anisotropic model. Research should also include quantification of consumer risk versus producer risk in manufacturing, and establishing appropriate MAR’s. Finally, a science-based manufacturing business practice must account for implementation issues, including heterogeneous work environments with different data requirements and data formats. CAD systems may not communicate fully with CAM machines, nor with measurement standards. Existing geometric description and manufacturing standards, such as ISO10303 (STEP standard), should be studied, along with standards activities and standards revisions. In addition to providing science-based manufacturing guidance, other results could be a guide for designers, which provide the designer with some of the trade-offs of costs versus manufacturing tolerances (similar to Table 1). Developing and adopting science-based business practices in manufacturing will both enhance confidence in conformance of manufactured parts and reduce manufacturing costs. The study which has been performed here identifies promising directions for future research.
References 1. International vocabulary of metrology-Basic and general concepts and associated terms
(VIM). Definition 2.39, Working Group Two of the Joint Committee for Guides in Metrology, BIPM, 2008.
2. TAR and acceptance are now also formally defined in ASME B89.7.3.1-2001, Guidelines for Decision Rules: Considering Measurement Uncertainty in Determining Conformance to Specifications, 2001.
3. General Requirements 9900000, revision AP, January 2005. When the TAR is less than 4:1, this specification mandates stringent acceptance, as defined in ASME B89.7.3.1-2001.
4. Groover, M.P., Fundamentals of Modern Manufacturing: Materials, Processes, and Systems. 1999, New York: John Wiley & Sons, Inc.
5. Tlusty, J., Manufacturing Processes and Equipment. 2000, Upper Saddle River, NJ: Prentice Hall. 928.
6. Li, X.P., et al., Theoretical modelling and simulation of milling forces. Journal of Materials Processing Technology, 1999. 89-90: p. 266-272.
7. Li, X.P. and H.Z. Li, Theoretical modelling of cutting forces in helical end milling with cutter runout. International Journal of Mechanical Sciences, 2004. 46(9): p. 1399-1414.
8. Li, H.Z., W.B. Zhang, and X.P. Li, Modelling of cutting forces in helical end milling using a predictive machining theory. International Journal of Mechanical Sciences, 2001. 43(8): p. 1711-1730.
19

20
9. http://www.aerotech.com/products/PDF/EngineeringRef.pdf. 16 September 2008. 10. Slocum, A. FUNdaMENTALs of Design. 2007; MIT Pappalardo Series in Mechanical
Engineering: Available from: http://pergatory.mit.edu. 11. Guide to the Expression of Uncertainty in Measurement, ISO, 1993 12. Uniform Cutting Tests - NAS Series Metal Cutting Equipment Specifications, NAS 979.
National Aerospace Standard, 1969. 1969.

Distribution List: MS 0110 J Charles Barbour, 08400 (electronic copy) MS 0421 Michael Sjulin, 00240 (electronic copy) MS 0563 Matthew Donnely, 02431 (electronic copy) MS 0665 Larry J Azevedo, 02542 (electronic copy) MS 0665 James E Pacheco, 02541 (electronic copy) MS 0665 Meghan Shilling, 02541 (electronic copy) MS 0665 Hy D Tran, 02541 (electronic copy) MS 0812 Jiann-Cherng Su, 05702 (electronic copy) MS 0961 Mark F Smith, 02450 (electronic copy) MS 1064 Andre A Claudet, 02614 (electronic copy)
MS 0899 Technical Library, 9536 (electronic copy) MS 0123 D. Chavez, LDRD Office, 1011 (electronic copy)