quantification of degeneracy in biological systems for characterization of functional interactions...
TRANSCRIPT

Journal of Theoretical Biology 302 (2012) 29–38
Contents lists available at SciVerse ScienceDirect
Journal of Theoretical Biology
0022-51
doi:10.1
n Corr
E-m
g.dwive
melissa1 Se
journal homepage: www.elsevier.com/locate/yjtbi
Quantification of degeneracy in biological systems for characterization offunctional interactions between modules
Yao Li a, Gaurav Dwivedi b, Wen Huang c, Melissa L. Kemp b,n, Yingfei Yi a,d,1
a School of Mathematics, Georgia Institute of Technology, Atlanta, GA 30332-0160, USAb The Wallace H. Coulter Department of Biomedical Engineering, Georgia Institute of Technology and Emory University, Atlanta, GA 30332-0363, USAc University of Science and Technology of China, Hefei 230026, Chinad School of Mathematics, Jilin University, Changchun 130012, China
a r t i c l e i n f o
Article history:
Received 5 August 2011
Received in revised form
15 February 2012
Accepted 20 February 2012Available online 28 February 2012
Keywords:
Degeneracy
Complexity
Robustness
Systems biology
Biological networks
93/$ - see front matter & 2012 Elsevier Ltd. A
016/j.jtbi.2012.02.020
esponding author. Tel.: þ1 404 385 6341.
ail addresses: [email protected] (Y. Li),
[email protected] (G. Dwivedi), [email protected]
[email protected] (M.L. Kemp), yi@mat
nior author.
a b s t r a c t
There is an evolutionary advantage in having multiple components with overlapping functionality (i.e
degeneracy) in organisms. While theoretical considerations of degeneracy have been well established
in neural networks using information theory, the same concepts have not been developed for
differential systems, which form the basis of many biochemical reaction network descriptions in
systems biology. Here we establish mathematical definitions of degeneracy, complexity and robustness
that allow for the quantification of these properties in a system. By exciting a dynamical system with
noise, the mutual information associated with a selected observable output and the interacting
subspaces of input components can be used to define both complexity and degeneracy. The calculation
of degeneracy in a biological network is a useful metric for evaluating features such as the sensitivity of
a biological network to environmental evolutionary pressure. Using a two-receptor signal transduction
network, we find that redundant components will not yield high degeneracy whereas compensatory
mechanisms established by pathway crosstalk will. This form of analysis permits interrogation of large-
scale differential systems for non-identical, functionally equivalent features that have evolved to
maintain homeostasis during disruption of individual components.
& 2012 Elsevier Ltd. All rights reserved.
1. Introduction
In 1999, Hartwell et al. introduced the concept of modularbiology, where a functional module is created by interactingmolecules collectively performing a discrete function. Such mod-ules provide an advantage for both evolvability (sensitivity toenvironmental changes) and robustness (insensitivity to pertur-bations) in a system (Hartwell et al., 1999). Reconciling thedivergent requirements of evolvability and robustness requiresknowledge regarding the connections between these functionalunits and an appreciation for how each module integratesinformation arriving from multiple inputs. In complex biologicalsystems such as neural networks, there has been recent emphasison features of structural complexity such as degeneracy. As firstintroduced in Tononi et al. (1994), structural complexity can beunderstood in terms of the interplay between specialization offunctions in individual modules (functional segregation) and the
ll rights reserved.
.edu.cn (W. Huang),
h.gatech.edu (Y. Yi).
ability of the modules to interact and perform functions coher-ently (functional integration). A highly complex system maintainssegregation of function while still allowing for functional integra-tion. Degeneracy measures how well functionally independentmodules can interact to produce redundant outputs. Modules thatare structural duplicates form a completely redundant systemand always produce the same output; degenerate systems arisefrom structurally distinct modules with different outputs inter-acting to produce the same output under certain conditions.
Systemic features like degeneracy, complexity, robustness arerelated to one another. It has already been observed via numericalsimulations for neural networks that high degeneracy not onlyyields high robustness, but also it is accompanied by an increasein structural complexity (Tononi et al., 1999). Thus, it is believedthat degeneracy is a necessary feature in the evolution of complexbiological systems, partly because genetically dissimilar organ-isms will drive toward convergence of function while maintainingnon-redundant components (Edelman and Gally, 2001). It is alsobelieved that the robustness and adaptability that ensue fromdegeneracy are key features of complex biological systems atmultiple scales (Stelling et al., 2004) and organisms have evolvedto contain many non-identical structures to produce similarfunctions. In this manner, degeneracy helps to fulfill the necessary

Y. Li et al. / Journal of Theoretical Biology 302 (2012) 29–3830
properties of biologically functional modules. While the conceptof degeneracy was introduced for neural networks, there is strongevidence that many dynamical biological networks includingcellular metabolic and signaling networks exhibit the propertyof degeneracy; for example, protein kinase isoforms regulated byseparate genes phosphorylate the same substrate protein(Edelman and Gally, 2001). Furthermore, because regulatoryfeatures of protein or metabolic networks often rely on dynamicalsystems analysis, such theory must be compatible with kineticdescription of biochemical reactions rather than neural network(Tononi et al., 1999) or logic-based description (Rizk et al., 2009).Although some features like regulation and robustness of bio-chemical networks of signal transduction have been studiedquantitatively (Kitano, 2007; Rizk et al., 2009), the features ofinterest here, such as degeneracy and complexity, have not beenformalized mathematically in terms of ordinary differential equa-tion description that is so commonly used for describing proteinnetworks. By developing a method for calculating degeneracy ingeneral biological networks modeled by differential equations,network structures can be explored that fulfill the contraryrequirements of evolvability and robustness first posited byHartwell et al. Understanding these features becomes importantas increasingly complex biological systems are being designed abinitio in synthetic biology. In this article, we first mathematicallyformalize the relationships between degeneracy, complexity androbustness in dynamical systems. We next establish that highdegeneracy always yields high complexity. Finally, we illustratetwo distinct approaches for numerically calculating degeneracy indynamical systems, a predator–prey model and a kinetic signalingmodel. In many instances, the metric of degeneracy is a usefulindicator of how easily the system adapts under evolutionarypressure.
2. Mathematical approach
2.1. Random perturbations of ODE system
Our strategy is to inject a fixed amount of stochastic perturba-tion into a differential system. With such small random perturba-tions, the corresponding variable sets of modules of the networkbecome stochastic processes. If two modules have strong func-tional connectivity, then these two stochastic processes shouldhave high statistical correlation. Conversely, two functionallyindependent components must be statistically independent. Thisstatistical connectivity can be measured by the mutual informa-tion of the components. It is already known that degeneracymeasures the ability of structurally different components toperform the same function, while complexity measures thedegree of functional integration and segregation between differ-ent components. Using these ideas, we can quantify degeneracyand complexity using linear combinations of mutual information.
To avoid mathematical challenges from injecting small sto-chastic perturbations into an ODE system, we will assumethroughout this work that the differential system is dissipative.In other words, asymptotically the differential system will grav-itate to its global attractor such that the generated stochasticprocess has a stable invariant measure. This invariant measureallows us to obtain the asymptotic correlation between modules.The random perturbation and its invariant measure is describedbelow
x0 ¼ f ðxÞ, xARnð1Þ
i.e., we consider the Ito stochastic differential equation (SDE)
dX ¼ f ðxÞ dtþEsðxÞ dWt , ð2Þ
where Wt is the Wiener process, s is a non-singular, n�n matrix-valued function and E is a small parameter. The time evolution ofthe probability density function associated with the SDE (2)satisfies the so-called Fokker–Planck equation
rt ¼1
2E2Xn
i,j ¼ 1
ðAijrÞij�rðfrÞ, ð3Þ
where AðxÞ ¼ sðxÞsT ðxÞ is an n�n symmetric non-negative defi-nite matrix.
Of particular importance among the solutions of the Fokker–Planck equation are the steady states, which satisfy the stationaryFokker–Planck equation
1
2E2Xn
i,j ¼ 1
ðAijrÞij�rðfrEÞ ¼ 0,
rðxÞ40,R
RnrEðxÞ dx¼ 1:
8>><>>:
ð4Þ
A smooth solution rE of the stationary Fokker–Planck equation (4)is known to uniquely exist (Bogachev et al., 2009; Huang et al.,2011) if
�
f is differentiable and s is twice differentiable on Rn; and � there exists a Lyapunov function VðxÞ40, V-þ1 such that12E
2Pn
i,j ¼ 1 AijðxÞ@2ijVðxÞþ f ðxÞ � VðxÞo�g for some constant g40
and all 9x9 sufficiently large.
We remark that while the ODE (1) may have many complicatedinvariant measures without even having density functions, thesteady-state of the SDE (2) is nevertheless unique and smooth.We also note that when E is fixed, we denote the invariantsolution as r instead of rE.
2.2. Definitions of degeneracy, complexity and robustness
2.2.1. Degeneracy and complexity
Inspired by, but differing from Tononi et al. (1999), ourdefinition of degeneracy is divided into several steps. In the firststep, we define projected density, entropy and mutual informa-tion associated with any subspace. Then, we fix a subspace as the‘‘output’’ set and define its associated degeneracy by consideringthe complementary subspace as the ‘‘input’’ set. Lastly, we definethe degeneracy of the entire system by varying the output setsand taking the maximum among all degeneracies of these sets.Definitions of projected density, entropy and mutual informationare provided in Appendix A. In a biological network, mutualinformation between two components I1 and I2, MIðI1; I2Þ, mea-sures the functional connectivity between the components. Usingmutual information, degeneracy can be defined as follows.
Let O be a fixed subspace of Rn, viewed as an output set. Wedenote I as the complementary subspace to O, viewed as the inputset. In other words, the set O is a fixed set of ‘‘observables’’ whenthe system (2) is excited by noise. To measure the impact of noiseon all possible components of the input set, we consider anysubspace Ik of I and denote its complementary set in I by Ik
c. Theinteracting information among Ik, Ik
c and O is defined by
DðkÞ ¼MIðI; Ik;OÞ ¼MIðIk;OÞþMIðIck;OÞ�MIðI;OÞ: ð5Þ
The interacting information measures how much Ik and Ikc are
structurally different but perform the same function as signifiedby the output set O.
We note that unlike the mutual information between twosubspaces, the interacting information among three subspacescan take negative values (Sun Han, 1980).
Similar to the case of neural networks, we define the degeneracyassociated with O by averaging all the interacting information

Y. Li et al. / Journal of Theoretical Biology 302 (2012) 29–38 31
among all possible subspaces of I, i.e.
DðOÞ ¼/MIðI; Ik,OÞS¼X
Ik
1
2Cnk
maxfMIðI; Ik;OÞ,0g: ð6Þ
Similar to degeneracy, complexity CðOÞ associated with Ocould be obtained by averaging all the mutual informationbetween Ik and Ik
c, i.e.
CðOÞ ¼/MIðIk; IckÞS¼
XIk
1
2Cnk
MIðIk; IckÞ: ð7Þ
This value measures how much codependency in a networkappears among different modules rather than different elements(units that constitute a module).
Now, for a fixed diffusion matrix s and E40, we define thedegeneracy DE,s and structural complexity CE,s of the system(1) as
DE,s ¼MaxO
DðOÞ,
CE,s ¼MaxO
CðOÞ:
We call a differential system (1) degenerate (resp. complex)with respect to a diffusion matrix s if there exists E0, such thatDE,s40 (resp. CE,s40) for all 0oEoE0.
We would like to make the following remarks:
�
In many applications, one can often choose sðxÞ as the identitymatrix, so that the noise perturbation becomes purely white.But a variable diffusion matrix sðxÞ, associated with a colorednoise perturbation, should play an important role in detectingthe key output set mainly responsible for the degeneracy. � For a particular biological system, one often has a naturalchoice of ‘‘observable’’ variables to be used as the output set O.If one can select a special subspace Ik0
of the complementarysubspace I so that the interacting information MIðI; Ik0
;OÞamong the three is positive with respect to a fixed diffusionmatrix, then it follows from the definition that the wholesystem has a certain level of degeneracy. Since the interactinginformation could be negative, we take the average ofmaxfMIðI; Ik;OÞ,0g to measure the degeneracy of the system.
2.2.2. Robustness-system robustness and functional robustness
Our notion of robustness will be defined in a way that reflectsthe strength of attraction of the global attractor of system (1).Recall that the system (1) was assumed to be dissipative so that aglobal attractor already exists. We denote the global attractor byA.
To define the robustness, we require in this paper that A isa strong attractor in the following sense. The attractor A is said tobe a strong attractor with non-negative index a if there existsa compact neighborhood N with C1 smooth boundary and aLyapunov function V(x) such that
rVðxÞ � f ðxÞr�a distðx,AÞ for all xAN :
For a strong attractor A, the system robustness of A is thefollowing quantity:
R¼ inf1
a: a is an index of A
� �:
The system is said to be robust if A is a strong attractor and R
is finite.If the performance function p(x) of the system is given with the
following assumptions: (1) pðxÞ ¼ 1 8xAA; (2) 0opðxÞo1 ifx=2A, then, following Kitano (2007), one can define functionalrobustness Rf ðEÞ as
Rf ðEÞ ¼Z
rEðxÞpðxÞ dx:
Using this notation, the system has the best performance whenthe perturbation vanishes and robustness is interpreted as theability to preserve phenotype rather than maintaining a fixedsteady state. We remark that if a system is robust and someproperty of the performance function is also known, then someestimate on the functional robustness can be made.
2.3. Connection between degeneracy, complexity and robustness
Degeneracy, complexity and robustness are not isolated con-cepts. More and more examples suggest some internal connec-tions among them (see Edelman and Gally, 2001; Stelling et al.,2004). In fact, these relationships could not only be observed inbiological experiments, but also be verified by our mathematicalquantification of degeneracy, complexity and robustness. Fromthe definition, degeneracy always implies complexity. Further,with some additional conditions, a robust system must havecertain level of degeneracy (and hence, also complexity).
2.3.1. Degeneracy and complexity
It has been observed in neural networks that a degeneratesystem must have a complex structure (Tononi et al., 1999). Thesame property holds for a differential system, which is commonlyused to describe biochemical networks. A simple calculationshows that
MIðI; Ik;OÞrminfMIðI; IkÞ,MIðIck;OÞ,MIðI;OÞg: ð8Þ
If we compare Eqs. (6) and (7), by taking the average among allpossible subsets Ik, we obtain
CðOÞZDðOÞ
because MIðI; Ick;OÞrMIðI; Ic
kÞ. In other words, with respect to afixed diffusion matrix, degeneracy implies complexity.
This explains the observation in Edelman and Gally (2001) thatbiological systems selected for high degeneracy are accompaniedby high complexity.
Remark: We can prove Eq. (8) in the following way:
MIðX;Y ; ZÞ ¼HðXÞþHðYÞþHðZÞ�HðX,YÞ�HðY ,ZÞ
�HðX,ZÞþHðX,Y ,ZÞ ¼HðXÞþHðYÞ�HðX,YÞ
�ðHðX,ZÞþHðY ,ZÞ�HðZÞ�HðX,Y ,ZÞÞ
¼MIðX;YÞ�MIðX;Y9ZÞ:
Since the l mutual information is non-negative: MIðX;Y9ZÞZ0, wehave MIðX;Y; ZÞrMIðX;YÞ. (The non-negativity of conditionalmutual information is a direct corollary of Kullback’s inequality,or see Yeung, 2002.)
Similarly we can prove MIðX;Y ; ZÞrMIðX; ZÞ and MIðX;Y ; ZÞrMIðY ; ZÞ, from which (8) follows.
2.3.2. Degeneracy and robustness
We would like to examine the connections between degen-eracy and robustness for an ODE system (1). Robustness alonedoes not necessarily imply degeneracy of the system; this isbecause one can certainly have a system with zero complexity(e.g., a system with many symmetric components) which ishowever robust. By (8), such a system must be non-degenerate.Therefore, for a robust system to be degenerate, the system mustbe complex and such structural complexity often gives rise tosome kind of embedding complexity of the global attractor intothe phase space. Roughly speaking, the components of a complexsystem interact strongly with each other and as a result, theglobal attractor is twisted in the phase space such that it does notlie in any hyperplane. To characterize the twist property of theglobal attractor, it is natural to consider its projections on certainhyperplanes and measure the dimensions of the correspondingprojections. We note that the attractor as well as its projections

Y. Li et al. / Journal of Theoretical Biology 302 (2012) 29–3832
may only be fractal sets, hence they should be measured withrespect to the Minkowski dimension, also called box countingdimension (Pesin, 1997).
For a subspace V of Rn, we denote by dV the co-dimension of Ain V, i.e., the dimension of V subtracts the Minkowski dimensionof the projection of A to V.
The twisted attractor is defined as follows. The global attractorA is said to be twisted if there is a linear decomposition Rn
¼ I �J �O such that
dIþdJ þdOþdRn odI�J þdI�OþdJ�O:
We have the following theorem:The invariant probability density function rE is said to be
regular for A if there exists some function CðKÞ40 that isindependent with respect to E, such that
minðrEðxÞÞZC maxðrEðxÞÞ 8x with distðx,AÞrKE
for all 0oEoE0 and K40.
Theorem 1. If the system (1) is robust with a twisted global
attractor, and if the E-invariant density function rE is regular for A,then there exists an E040, such that DE,s40 for all 0oEoE0
For a proof of the theorem see Appendix B.
Fig. 1. Algorithms for calculating degeneracy when fixed points are unknown
(Algorithm 1) or known (Algorithm 2).
2.3.3. Degeneracy at equilibriumDegenerate behavior could occur not only at the twistedattractor, but also at certain equilibria, or what a biologist mayregard as homeostasis. Here, we introduce another theorem onthe connection between robustness and degeneracy. If an ODEsystem has a unique equilibrium point and in the neighborhoodof this equilibrium point the reactions to random perturbationshave certain level of diversity, then we claim that it is adegenerate system. More precisely, if different directions demon-strate different sensitivities under random perturbation, then it isa degenerate system. Since it is known that a large number ofchemical reaction networks have unique stable equilibriumpoints, the degeneracy near equilibrium may be more applicablefor biological reaction networks.
Assume that system (1)
x0 ¼ f ðxÞ
has a unique stable fixed point, say x0. Let B denote the Jacobianmatrix of f(x) at x0. Since we have assumed the robustnessalready, it is obvious that the eigenvalues of B only have negativereal parts. After some calculation, one can find the solution to thestationary Fokker–Planck equation (4):
r¼ 1
Ke�zT S�1z=2Eþoð9z92
Þ, ð9Þ
where z¼ x�x0. The symmetric positive definite matrix S solvesthe Lyapunov equation uniquely
SBTþBSþA¼ 0,
where A¼ sðx0ÞsT ðx0Þ.With the stationary solution r, we can find the marginals on
target subspaces. It is known that the marginal of a normaldistribution is also normal, whose covariance matrix is the corre-sponding sub-matrix of S. More precisely, if X ¼ spanfxa1
, . . . ,xakg is a
subspace, then the sub-matrix Sða1, . . . ,ak; a1, . . . ,akÞ is the covar-iance matrix of the projection of rE on subspace X. For simplicity, wedenote Sða1, . . . ,ak; a1, . . . ,akÞ as S(X).
Then, we can compute the degeneracy with split X ¼ I1�I2 � O.Since Eq. (9) approximates a multivariate normal distribution,
calculation of degeneracy yields the following theorem: if
G :¼ log9SðI1ÞJSðI2ÞJSðOÞJSðXÞ99SðI1,I2ÞJSðI1,OÞJSðI2,OÞ9
40 ð10Þ
then the system is degenerate.In fact, it can be shown that as E-0, the degeneracy of rE with
respect to decomposition I1,I2,O converges to G.Two approaches can be taken for calculating D for a coupled
differential system. One relies on Monte-Carlo simulations(Appendix C and Algorithm 1 in Fig. 1), while the other is basedon stochastic analysis by the Freıdlin and Wentzell (1998) quasi-potential method (Appendix C and Algorithm 2 in Fig. 1). Wedemonstrate the utility of each with biological examples below.
3. Illustrations
3.1. Implications of degeneracy in a signal transduction pathway
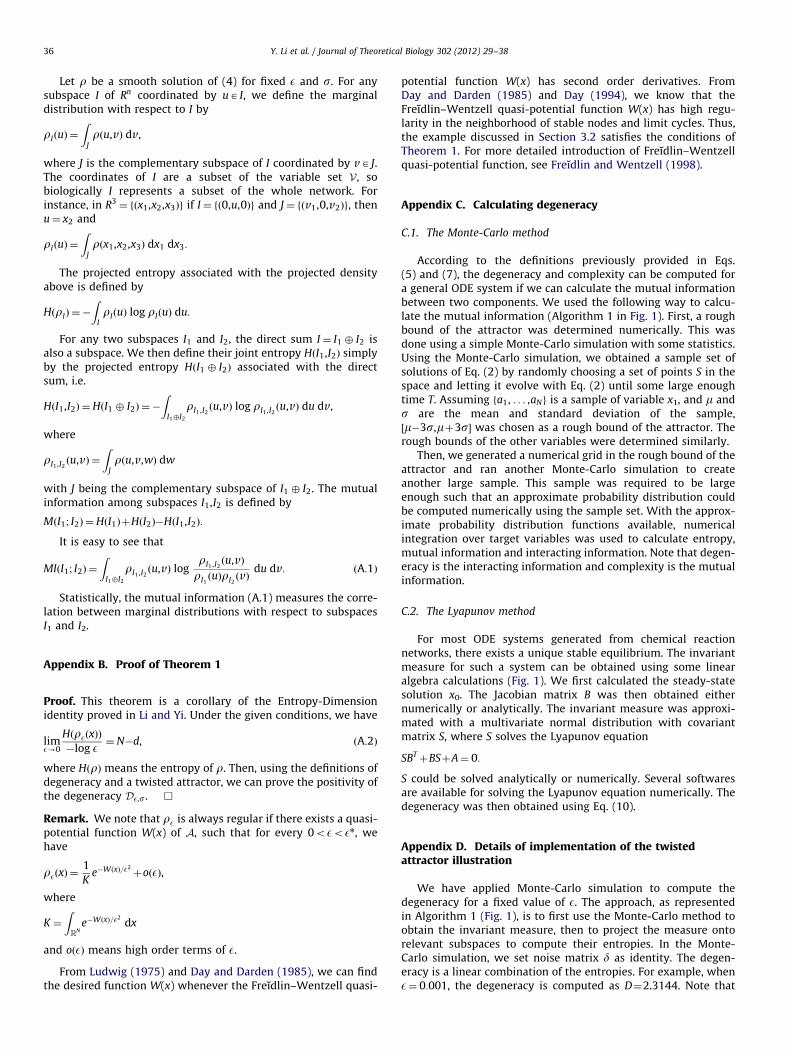
Consider a simple example consisting of three modules A, B andC shown in Fig. 2. A and B serve as inputs, while C is the output. Ifmodule A has a functional relationship with the output module C,the mutual information between the two is high. Similarly, ifmodules B and C share high mutual information, they are func-tionally related as well. However, both modules A and B beingfunctionally related to the output is not enough for degeneracy.We also require A and B to be structurally different. This can bechecked by treating A and B as a single unit, measuring its mutualinformation with the output and comparing it with the mutualinformation A and B share individually with C. The valueMIðA;CÞþMIðB;CÞ�MIðfA,Bg;CÞ, thus measures the degeneracy, orhow much more correlation the inputs A and B share with theoutput C than expected. Defining degeneracy enables us to explorethe applications of degeneracy quantitatively.
Using a simplified model of crosstalk in protein signal transduc-tion, we illustrate the calculation of degeneracy using Algorithm 2
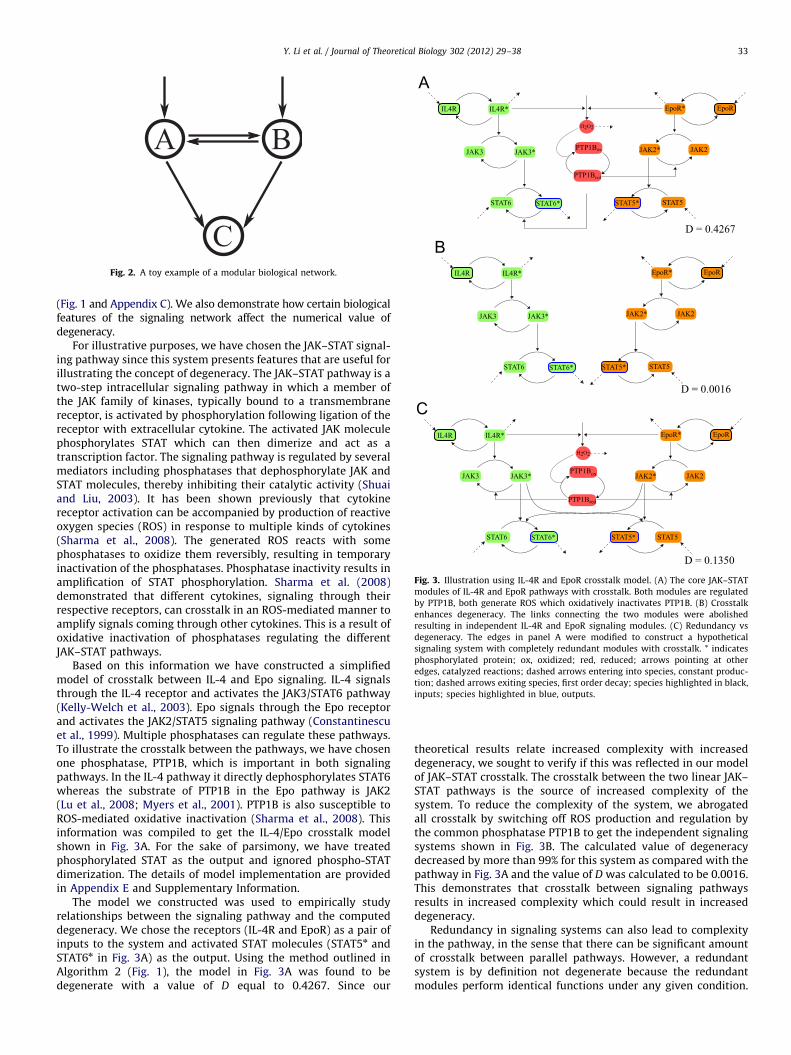
Fig. 2. A toy example of a modular biological network.
Fig. 3. Illustration using IL-4R and EpoR crosstalk model. (A) The core JAK–STAT
modules of IL-4R and EpoR pathways with crosstalk. Both modules are regulated
by PTP1B, both generate ROS which oxidatively inactivates PTP1B. (B) Crosstalk
enhances degeneracy. The links connecting the two modules were abolished
resulting in independent IL-4R and EpoR signaling modules. (C) Redundancy vs
degeneracy. The edges in panel A were modified to construct a hypothetical
signaling system with completely redundant modules with crosstalk. * indicates
phosphorylated protein; ox, oxidized; red, reduced; arrows pointing at other
edges, catalyzed reactions; dashed arrows entering into species, constant produc-
tion; dashed arrows exiting species, first order decay; species highlighted in black,
inputs; species highlighted in blue, outputs.
Y. Li et al. / Journal of Theoretical Biology 302 (2012) 29–38 33
(Fig. 1 and Appendix C). We also demonstrate how certain biologicalfeatures of the signaling network affect the numerical value ofdegeneracy.
For illustrative purposes, we have chosen the JAK–STAT signal-ing pathway since this system presents features that are useful forillustrating the concept of degeneracy. The JAK–STAT pathway is atwo-step intracellular signaling pathway in which a member ofthe JAK family of kinases, typically bound to a transmembranereceptor, is activated by phosphorylation following ligation of thereceptor with extracellular cytokine. The activated JAK moleculephosphorylates STAT which can then dimerize and act as atranscription factor. The signaling pathway is regulated by severalmediators including phosphatases that dephosphorylate JAK andSTAT molecules, thereby inhibiting their catalytic activity (Shuaiand Liu, 2003). It has been shown previously that cytokinereceptor activation can be accompanied by production of reactiveoxygen species (ROS) in response to multiple kinds of cytokines(Sharma et al., 2008). The generated ROS reacts with somephosphatases to oxidize them reversibly, resulting in temporaryinactivation of the phosphatases. Phosphatase inactivity results inamplification of STAT phosphorylation. Sharma et al. (2008)demonstrated that different cytokines, signaling through theirrespective receptors, can crosstalk in an ROS-mediated manner toamplify signals coming through other cytokines. This is a result ofoxidative inactivation of phosphatases regulating the differentJAK–STAT pathways.
Based on this information we have constructed a simplifiedmodel of crosstalk between IL-4 and Epo signaling. IL-4 signalsthrough the IL-4 receptor and activates the JAK3/STAT6 pathway(Kelly-Welch et al., 2003). Epo signals through the Epo receptorand activates the JAK2/STAT5 signaling pathway (Constantinescuet al., 1999). Multiple phosphatases can regulate these pathways.To illustrate the crosstalk between the pathways, we have chosenone phosphatase, PTP1B, which is important in both signalingpathways. In the IL-4 pathway it directly dephosphorylates STAT6whereas the substrate of PTP1B in the Epo pathway is JAK2(Lu et al., 2008; Myers et al., 2001). PTP1B is also susceptible toROS-mediated oxidative inactivation (Sharma et al., 2008). Thisinformation was compiled to get the IL-4/Epo crosstalk modelshown in Fig. 3A. For the sake of parsimony, we have treatedphosphorylated STAT as the output and ignored phospho-STATdimerization. The details of model implementation are providedin Appendix E and Supplementary Information.
The model we constructed was used to empirically studyrelationships between the signaling pathway and the computeddegeneracy. We chose the receptors (IL-4R and EpoR) as a pair ofinputs to the system and activated STAT molecules (STAT5n andSTAT6n in Fig. 3A) as the output. Using the method outlined inAlgorithm 2 (Fig. 1), the model in Fig. 3A was found to bedegenerate with a value of D equal to 0.4267. Since our
theoretical results relate increased complexity with increaseddegeneracy, we sought to verify if this was reflected in our modelof JAK–STAT crosstalk. The crosstalk between the two linear JAK–STAT pathways is the source of increased complexity of thesystem. To reduce the complexity of the system, we abrogatedall crosstalk by switching off ROS production and regulation bythe common phosphatase PTP1B to get the independent signalingsystems shown in Fig. 3B. The calculated value of degeneracydecreased by more than 99% for this system as compared with thepathway in Fig. 3A and the value of D was calculated to be 0.0016.This demonstrates that crosstalk between signaling pathwaysresults in increased complexity which could result in increaseddegeneracy.
Redundancy in signaling systems can also lead to complexityin the pathway, in the sense that there can be significant amountof crosstalk between parallel pathways. However, a redundantsystem is by definition not degenerate because the redundantmodules perform identical functions under any given condition.

Y. Li et al. / Journal of Theoretical Biology 302 (2012) 29–3834
To test how a redundant system compares with a degeneratesystem, we modified the pathway in Fig. 3A to that shown inFig. 3C by inserting some hypothetical connections. This was doneto ensure that the two modules were structurally identical andaffected the output (STAT5n and STAT6n) identically. The rateparameters were also identical for the two modules resulting in acompletely redundant system where EpoR and IL-4R affect STAT5and STAT6 identically. The redundant system was found to stillhave a positive D but the magnitude was reduced by more than68% as compared with the value calculated for the system inFig. 3A. This agrees with the understanding that redundancy doesnot lead to degeneracy and our calculation of D successfullyreflects this.
3.2. Degeneracy in a Lotka–Volterra system
We provide a three-dimensional example to demonstrate howto verify degeneracy using the Monte-Carlo method (seeAppendix C). Consider the following competitive Lotka–Volterrasystem
_x1 ¼ x1ð3�x1�x2�x3Þ,
_x2 ¼ x2ð4�x1�x2�2x3Þ,
_x3 ¼ x3ð7:221�2:61x1�1:611x2�3x3Þ:
This system represents a simple three-species competitive popu-lation model. The system has a limit cycle as described previously(Fig. 4) (Xiao and Li, 2000). Using the theory of quasi-potentialfunctions, one can rewrite the vector field as �rCðx1,x2,x3Þþ
lðx1,x2,x3Þ, where C is called a quasi-potential function and l is asmall perturbation in a definite sense with rC � l¼ 0. It is wellknown that for such a system admitting a limit cycle, C is aLyapunov function which is as regular as the vector field. It thenfollows from definition that the system is robust. Furthermore,the condition in Theorem 1 is also satisfied due to the regularityof the quasi-potential function.
Numerical simulations show that the limit cycle is not parallelto any coordinate axis. In fact, it follows that dx ¼ dy ¼ dz ¼ 0,dxyz ¼ 2, dxy ¼ dxz ¼ dyz ¼ 1. Hence, the attractor is also twisted.Now applying the theorem on twisted attractors, we concludethat the system is degenerate. Further details regarding thisillustration are provided in Appendix D.
3.3. Degeneracy enhances evolvability
It has been argued that not only is degeneracy an outcome, butalso an important driver of evolution (Edelman and Gally, 2001).We performed computational simulations of adaptive evolutionto study the interplay between degeneracy and evolvability (seeAppendix F for details). We use the term evolvability to generally
Fig. 4. Limit cycle of the Lotka–Volterra system showing a twisted attractor.
represent the ease with which a biological network can adapt toan environmental change through the process of evolution toincrease its fitness. We studied a network modeled using ODEs,consisting of a fixed number of nodes and evolving by mutatingthe strengths of connections between nodes. Using empiricalstudies with stochastic simulations, we observed that evolutionwas often, but not always, accompanied by increase in degen-eracy. However, systems with higher initial degeneracy exhibitedgreater evolvability. Since adaptive evolution is random and doesnot follow any design, it is to be expected that not all mutationsthat increase fitness will also lead to increased degeneracy. On theother hand, a system with high initial degeneracy consists ofmultiple interwoven modules performing the same function indifferent ways. As a consequence, mutations in each of thesemodules allow the system to evolve a different phenotypicresponse resulting in an enhanced ability to explore the pheno-type space. We note that our observation that evolution does notalways lead to increased degeneracy may not be true in the longerterm. Since systems with greater degeneracy have an increasedability to adapt to environmental changes, mutations leading toincreased fitness in a particular environment but reduced degen-eracy, lose out on their ability to respond to further environ-mental changes. In some sense, degeneracy can be thought of as ameasure of the evolvability of a system. This means that theability to quantify degeneracy gives us a sense of the evolvabilityof networks, at least on a relative scale, simply by analyzing itsstructure.
4. Discussion
Degeneracy can be generally understood as the ability ofstructurally distinct components of a system to behave similarlyunder certain conditions, while the behavior may be differentunder other conditions. Increasingly, large numbers of instancesof degeneracy are being found in biological systems at all scalesranging from molecular to animal population levels (Edelman andGally, 2001). Particularly, in the context of cellular signalingnetworks, there are multiple examples of degenerate behavior.Different members of the interleukin (IL) family can activate thesame transcription factor. For instance, IL-2, IL-7 and IL-21 can allactivate STAT1 (Rochman et al., 2009). Growth factors can bind tomultiple types of receptors in the EGF receptor family (Chen et al.,2009). MAPK signaling induced by growth factors and stressexhibits promiscuous interaction between MEKK and MAPKproteins where multiple types of MEKKs can activate the sameMAPK and a single MEKK can activate multiple MAPKs (Oda et al.,2005). Recently, experimental studies have indicated that asignificant role for genetic buffering by non-homologous genes(i.e., functional redundancy or degeneracy) (van Wageningenet al., 2010) exists and may confer a selective advantage overparalogs for regulation. The widespread appearance of degener-acy in biological systems across scales suggests that it is aproperty favored by adaptive evolution. Because of the nature ofevolutionary systems, desired changes are not intelligently engi-neered into them. Instead, they evolve by incorporating randomchanges some of which improve the fitness for survival. Also,since no part of an adaptive biological system is outside the scopeof evolution, multiple components of the system can evolve toachieve the same kind of adaptation. It is, therefore, reasonable toexpect an evolutionary system to increase in complexity overtime which could result in enhanced degeneracy. Thus, the theorypresented here provides a method not only for looking atstructural characteristics of biological networks, but also forexploring the links between degeneracy and evolvability inbiological systems modeled using ODEs.

Y. Li et al. / Journal of Theoretical Biology 302 (2012) 29–38 35
Complexity arising as a consequence of the evolutionaryprocess means that biological systems rarely, if at all, operate inisolation. Chen et al. (2009) showed that the behavior of asignaling pathway in isolation is different from the behavior itexhibits when put in the context of a more complex intracellularenvironment. Systems biologists are aware that cellular signalingpathways which are classically seen as isolated, and often linear,chains of biochemical modifications rarely operate in this simplefashion. The connections between signaling pathways give rise tonetworks with much greater complexity. These resulting systemscan exhibit degenerate behavior in that one signaling pathway, amodule by itself, interacts with another structurally differentmodules with both of them regulating the same output, resultingin similar or different outcomes depending on conditions. This isimportant from the point of view of applications such as drugtargeting. For instance, despite major efforts, very few drugsspecifically targeting the PI3K signaling pathway, which exhibitsstrong crosstalk with a number of other pathways, make it to theclinical trial stage (Hennessy et al., 2005). The complexity arisingfrom crosstalk is thought to be one reason for the failure ofspecific inhibitors to work successfully in cells. Determining whatpoints should be targeted in a complex signaling network is acritical question for drug design. It is therefore desirable that theextent of compensation between connected pathways be definedquantitatively. A quantitative measure of degeneracy in the net-work can be exploited to identify candidate points in the networkmost suitable for drug intervention. Quantification of degeneracycan also have applications in synthetic biology for designingsystem modules that are structurally distinct but can be madeto perform similar functions when needed.
Like degeneracy, complexity of a system can also be quantifiedusing mutual information between modules. A complex system isone with high overall mutual information between differentmodules (and not between simpler elements making the mod-ules). For example, in the context of crosstalk between the IL-4and Epo pathways, the IL-4 and Epo pathways separately can bethought of as modules while the individual molecules constitutethe basic elements of the system. This means that a complexsystem maintains a modular structure and also has co-depen-dence between the existing modules. Maintenance of functionalmodules means that the system is functionally segregated. At thesame time, co-dependence between the modules means thatthere is integration of function between the modules. A complexsystem, therefore, preserves both these properties which iscaptured by the measure of complexity we have presented.
Using a model of crosstalk in interleukin signaling, we havedemonstrated the biological significance of this numerical mea-sure of degeneracy. The IL-4R and EpoR signaling pathways, byvirtue of phosphatase and ROS mediated crosstalk, give rise to adegenerate system when the receptors are treated as input andSTAT activation as output. By computationally manipulating thesignaling pathway, we have empirically shown the relationshipsbetween degeneracy and some network features. As first demon-strated by Tononi et al. (1999) for neural networks, we found thatindependent signaling modules exhibit very low degeneracy.Reduced connectivity also means that the modules have areduced ability to influence each other via crosstalk, which ourdefinition of degeneracy is able to reflect. Simply increasing thecomplexity of the network may not be sufficient to guarantee adegenerate system. For instance, fully redundant signaling mod-ules with a high degree of crosstalk result in a structurallycomplex system. In our computational analysis, when the mod-ules were made fully redundant by making them identical in thestructure of the network and in the strengths of the internalconnections, the calculated degeneracy dropped despite anincrease in network edges. This agrees with the notion that
redundancy and degeneracy are functionally distinct, and demon-strates that our definition of degeneracy is able to distinguishbetween a truly degenerate system against one with high com-plexity but low degeneracy.
We also present a definition of robustness in the context ofdifferential equation models of biological systems. The stability ofa differential system can be measured by its robustness underrandom perturbation. A robust system strongly resists changeunder fixed random perturbation. Moreover, as suggested byKitano (2007), if we know the performance function of a system,we do not have to require that the system offer this resistanceeverywhere—the system only needs to be stable at places wherethe performance function decreases dramatically. Biologically,this means that a robust system is not necessarily one that isable to maintain a fixed steady state; instead, it is a system that isable to maintain its phenotype in the face of perturbations(Kitano, 2007). We have provided a definition of functionalrobustness that takes this into account. Further, we have shownthat robustness and degeneracy are connected—a robust systemhas positive degeneracy when it satisfies certain conditions(Theorem 1).
While these illustrations with simplistic biological modelsprovide some insight into the significance of our theoreticalframework for defining degeneracy, several aspects remain to beexplored. For instance, does the calculated degeneracy provide anestimate of the ability of crosstalking pathways to compensate foreach other under perturbation? System dynamics are of greatimportance in understanding cellular signaling networks. Ourmethod for calculating degeneracy takes into account only thefixed points of the differential system. In thinking about themeaning of calculated degeneracy in the context of cell signaling,it is important to keep system dynamics in mind. The outcome ofa signaling event is not always dictated by the steady state value,instead instantaneous rates of changes or integrated values ofsignals may be of relevance in a given system. For this reason, it isimportant to explore the relationships between system dynamicsand degeneracy. Given the ‘‘no free lunch’’ concept in controlsystems in which operating performance of one control functioncomes at the cost of fragility elsewhere (Lander, 2011; Doyle andCsete, 2007), the consequences of degenerate network propertiesover redundant components can be explored further. Theseconcepts may be exploited in the design of synthetic biologicalcircuits to ensure a desired functional outcome under a variety ofbiological contexts. Although several issues remain to beaddressed, the methods presented in this paper are significantin providing a theoretical framework to the concept of degeneracyand functional robustness for the class of systems represented bydifferential equations.
Acknowledgments
W.H. was supported by NSFC, Fok Ying Tung EducationFoundation, FANEDD (Grant 200520) and the FundamentalResearch Funds for the Central Universities. M.L.K. was supportedby a NIH New Innovator Award DP2OD006483. Y.Y. was sup-ported by NSF grants DMS0708331, DMS1109201 and a scholar-ship from Jilin University.
Appendix A. Definition of projected density, entropy andmutual information
Let V be the variable set of Eq. (1). Biologically, V means the setof elements or species of the network.
Y. Li et al. / Journal of Theoretical Biology 302 (2012) 29–3836
Let r be a smooth solution of (4) for fixed E and s. For anysubspace I of Rn coordinated by uA I, we define the marginaldistribution with respect to I by
rIðuÞ ¼
ZJrðu,vÞ dv,
where J is the complementary subspace of I coordinated by vA J.The coordinates of I are a subset of the variable set V, sobiologically I represents a subset of the whole network. Forinstance, in R3
¼ fðx1,x2,x3Þg if I¼ fð0,u,0Þg and J¼ fðv1,0,v2Þg, thenu¼ x2 and
rIðuÞ ¼
ZJrðx1,x2,x3Þ dx1 dx3:
The projected entropy associated with the projected densityabove is defined by
HðrIÞ ¼ �
ZIrIðuÞ log rIðuÞ du:
For any two subspaces I1 and I2, the direct sum I¼ I1 � I2 isalso a subspace. We then define their joint entropy HðI1,I2Þ simplyby the projected entropy HðI1 � I2Þ associated with the directsum, i.e.
HðI1,I2Þ ¼HðI1 � I2Þ ¼�
ZI1�I2
rI1 ,I2ðu,vÞ log rI1 ,I2
ðu,vÞ du dv,
where
rI1 ,I2ðu,vÞ ¼
ZJrðu,v,wÞ dw
with J being the complementary subspace of I1 � I2. The mutualinformation among subspaces I1,I2 is defined by
MðI1; I2Þ ¼HðI1ÞþHðI2Þ�HðI1,I2Þ:
It is easy to see that
MIðI1; I2Þ ¼
ZI1�I2
rI1 ,I2ðu,vÞ log
rI1 ,I2ðu,vÞ
rI1ðuÞrI2
ðvÞdu dv: ðA:1Þ
Statistically, the mutual information (A.1) measures the corre-lation between marginal distributions with respect to subspacesI1 and I2.
Appendix B. Proof of Theorem 1
Proof. This theorem is a corollary of the Entropy-Dimensionidentity proved in Li and Yi. Under the given conditions, we have
limE-0
HðrEðxÞÞ�log E ¼N�d, ðA:2Þ
where HðrÞ means the entropy of r. Then, using the definitions ofdegeneracy and a twisted attractor, we can prove the positivity ofthe degeneracy DE,s. &
Remark. We note that rE is always regular if there exists a quasi-potential function W(x) of A, such that for every 0oEoEn, wehave
rEðxÞ ¼1
Ke�WðxÞ=E2
þoðEÞ,
where
K ¼
ZRN
e�WðxÞ=E2
dx
and oðEÞ means high order terms of E.
From Ludwig (1975) and Day and Darden (1985), we can findthe desired function W(x) whenever the Freıdlin–Wentzell quasi-
potential function W(x) has second order derivatives. FromDay and Darden (1985) and Day (1994), we know that theFreıdlin–Wentzell quasi-potential function W(x) has high regu-larity in the neighborhood of stable nodes and limit cycles. Thus,the example discussed in Section 3.2 satisfies the conditions ofTheorem 1. For more detailed introduction of Freıdlin–Wentzellquasi-potential function, see Freıdlin and Wentzell (1998).
Appendix C. Calculating degeneracy
C.1. The Monte-Carlo method
According to the definitions previously provided in Eqs.(5) and (7), the degeneracy and complexity can be computed fora general ODE system if we can calculate the mutual informationbetween two components. We used the following way to calcu-late the mutual information (Algorithm 1 in Fig. 1). First, a roughbound of the attractor was determined numerically. This wasdone using a simple Monte-Carlo simulation with some statistics.Using the Monte-Carlo simulation, we obtained a sample set ofsolutions of Eq. (2) by randomly choosing a set of points S in thespace and letting it evolve with Eq. (2) until some large enoughtime T. Assuming fa1, . . . ,aNg is a sample of variable x1, and m ands are the mean and standard deviation of the sample,½m�3s,mþ3s� was chosen as a rough bound of the attractor. Therough bounds of the other variables were determined similarly.
Then, we generated a numerical grid in the rough bound of theattractor and ran another Monte-Carlo simulation to createanother large sample. This sample was required to be largeenough such that an approximate probability distribution couldbe computed numerically using the sample set. With the approx-imate probability distribution functions available, numericalintegration over target variables was used to calculate entropy,mutual information and interacting information. Note that degen-eracy is the interacting information and complexity is the mutualinformation.
C.2. The Lyapunov method
For most ODE systems generated from chemical reactionnetworks, there exists a unique stable equilibrium. The invariantmeasure for such a system can be obtained using some linearalgebra calculations (Fig. 1). We first calculated the steady-statesolution x0. The Jacobian matrix B was then obtained eithernumerically or analytically. The invariant measure was approxi-mated with a multivariate normal distribution with covariantmatrix S, where S solves the Lyapunov equation
SBTþBSþA¼ 0:
S could be solved analytically or numerically. Several softwaresare available for solving the Lyapunov equation numerically. Thedegeneracy was then obtained using Eq. (10).
Appendix D. Details of implementation of the twistedattractor illustration
We have applied Monte-Carlo simulation to compute thedegeneracy for a fixed value of E. The approach, as representedin Algorithm 1 (Fig. 1), is to first use the Monte-Carlo method toobtain the invariant measure, then to project the measure ontorelevant subspaces to compute their entropies. In the Monte-Carlo simulation, we set noise matrix d as identity. The degen-eracy is a linear combination of the entropies. For example, whenE¼ 0:001, the degeneracy is computed as D¼2.3144. Note that
Y. Li et al. / Journal of Theoretical Biology 302 (2012) 29–38 37
the calculated D is the degeneracy with respect to subspacescoordinated by x1,x2,x3, which is less than the degeneracy of thisdynamical system when we take the maximum over all possiblesubspace splits.
This number will increase when E decreases. The accuracy ofthe Monte-Carlo method is of order N�1=2, where N is the totalnumber of grid points used, the accuracy of integration iscompatible to the grid size. In our simulation, we have takenN¼4,000,000 and a grid size of 0.0005. This gives an accuracy ofaround 10�3 for our computation.
Appendix E. ODE model of IL4-R/EpoR crosstalk
The system shown in Supplementary Fig. 1 was modeled usingcoupled ordinary differential equations. All reactions were mod-eled using mass action kinetics. Furthermore, the pathway wasmodeled as an open system where new receptors and STATproteins were synthesized at a constant rate. Activated receptorswere lost due to receptor internalization and degradation (Beckeret al., 2010). Activated STAT degraded by the proteasome wasmodeled as slow first order decay (Wang et al., 2000). The detailsof receptor-mediated ROS production were collapsed into a singlereaction whereby active receptor produced ROS which couldoxidize PTP1B or get degraded by cellular ROS scavengers (notmodeled explicitly). Oxidized PTP1B could be reduced back to itsactive form.
The parameters of the model were estimated by fitting onlythe Epo signaling module (along with ROS production and PTP1Boxidation) to STAT5 phosphorylation data previously publishedfor the Epo signaling pathway (Swameye et al., 2003). The sameparameter estimates were used for the IL4 module since weexpect similar qualitative behavior in both modules. The speciesused in the model and their initial values are listed in Supple-mentary Table 1. The reaction rate parameters used and thedifferential equation system are tabulated in SupplementaryTables 2 and 3, respectively. The qualitative fits are shown inSupplementary Fig. 2.
The model without crosstalk (Fig. 3B) was obtained by settingthe rate constants k8, k11, k13 and k14 to 0 (see SupplementaryFig. 1).
The hypothetical redundant model (Fig. 3C) was obtained bymaking the following modifications to the model in Supplemen-tary Fig. 1: (i) JAK3n catalyzed phosphorylation of STAT5 wasadded (k¼0.8); (ii) JAK2n catalyzed phosphorylation of STAT6 wasadded (k¼0.8); (iii) PTP1B catalyzed dephosphorylation of STAT6was turned off; (iv) PTP1B catalyzed dephosphorylation of JAK3n
was added (k¼1.2).
Appendix F. Simulation of adaptive evolution
An n-node network with directed edges, representing ahypothetical signaling pathway, was constructed (n values3 and above were used). The nodes represent molecules and theedges represent reactions. The pathway was modeled using massaction kinetics using either linear or non-linear reaction rates.Two nodes were arbitrarily chosen as input and output nodes anddegeneracy was calculated using the Lyapunov method describedabove (Appendix C). To model evolution, an initial population ofgenetically similar individuals was created. Genetic similarityhere is represented by similar strengths of connections, orreaction rates, between the nodes. Further, the initial populationwas constructed to meet certain constraints, such as all indivi-duals could be required to have a positive degeneracy. Thisallowed comparison between different initial configurations. To
simulate adaptation to a new environment, the initial populationwas made to evolve towards a new steady state value. Evolutionfollowed cycles of mutations and selections. Mutations weremodeled by making small random changes to the reaction rates.Selection was based on the fitness of individuals in the newenvironment; fitter individuals had a higher chance of passingtheir traits to the next generation. Population averages of thesteady state value of the output node and degeneracy weremonitored over evolution.
Appendix G. Supplementary data
Supplementary data associated with this article can be foundin the online version at doi:10.1016/j.jtbi.2012.02.020.
References
Becker, V., Schilling, M., Bachmann, J., Baumann, U., Raue, A., Maiwald, T., Timmer,J., Klingmuller, U., 2010. Covering a broad dynamic range: informationprocessing at the erythropoietin receptor. Science 328 (5984), 1404.
Bogachev, V., Krylov, N., Rockner, M., 2009. Elliptic and parabolic equations formeasures. Russ. Math. Surv. 64, 973.
Chen, W.W., Schoeberl, B., Jasper, P.J., Niepel, M., Nielsen, U.B., Lauffenburger, D.A.,Sorger, P.K., 2009. Input–output behavior of ErbB signaling pathways asrevealed by a mass action model trained against dynamic data. Mol. Syst.Biol. 5 (1).
Constantinescu, S., Ghaffari, S., Lodish, H., 1999. The erythropoietin receptor:structure, activation and intracellular signal transduction. Trends Endocrinol.Metab. 10 (1), 18–23.
Day, M., 1994. Regularity of boundary quasi-potentials for planar systems. Appl.Math. Optim. 30 (1), 79–101.
Day, M., Darden, T., 1985. Some regularity results on the Ventcel–Freidlin quasi-potential function. Appl. Math. Optim. 13 (1), 259–282.
Doyle, J., Csete, M., 2007. Rules of engagement. Nature 446 (7138), 860.Edelman, G., Gally, J., 2001. Degeneracy and complexity in biological systems. Proc.
Natl. Acad. Sci. 98 (24), 13763.Freıdlin, M., Wentzell, A., 1998. Random Perturbations of Dynamical Systems, vol.
260. Springer Verlag.Hartwell, L., Hopfield, J., Leibler, S., Murray, A., et al., 1999. From molecular to
modular cell biology. Nature 402 (6761), 47.Hennessy, B., Smith, D., Ram, P., Lu, Y., Mills, G., 2005. Exploiting the PI3K/AKT
pathway for cancer drug discovery. Nat. Rev. Drug Discovery 4 (12), 988–1004.Huang, W., Liu, Z., Ji, M., Yi, Y., 2011. Stochastic stability of invariant measures:
part I. Fokker–Planck equations, preprint.Kelly-Welch, A., Hanson, E., Boothby, M., Keegan, A., 2003. Interleukin-4 and
interleukin-13 signaling connections maps. Science 300 (5625), 1527.Kitano, H., 2007. Towards a theory of biological robustness. Mol. Syst. Biol. 3 (1).Lander, A., 2011. Pattern, growth, and control. Cell 144 (6), 955–969.Li, Y., Yi, Y. Random perturbation in the vicinity of attractor, preprint.Lu, X., Malumbres, R., Shields, B., Jiang, X., Sarosiek, K., Natkunam, Y., Tiganis, T.,
Lossos, I., 2008. PTP1B is a negative regulator of interleukin 4-induced STAT6signaling. Blood 112 (10), 4098.
Ludwig, D., 1975. Persistence of dynamical systems under random perturbations.SIAM Rev., 605–640.
Myers, M., Andersen, J., Cheng, A., Tremblay, M., Horvath, C., Parisien, J., Salmeen,A., Barford, D., Tonks, N., 2001. TYK2 and JAK2 are substrates of protein-tyrosine phosphatase 1b. J. Biol. Chem. 276 (51), 47771.
Oda, K., Matsuoka, Y., Funahashi, A., Kitano, H., 2005. A comprehensive pathwaymap of epidermal growth factor receptor signaling. Mol. Syst. Biol. 1 (1).
Pesin, Y., 1997. Dimension Theory in Dynamical Systems: Contemporary Viewsand Applications. University of Chicago Press.
Rizk, A., Batt, G., Fages, F., Soliman, S., 2009. A general computational method forrobustness analysis with applications to synthetic gene networks. Bioinfor-matics 25 (12), i169.
Rochman, Y., Spolski, R., Leonard, W., 2009. New insights into the regulation of Tcells by gc family cytokines. Nat. Rev. Immunol. 9 (7), 480–490.
Sharma, P., Chakraborty, R., Wang, L., Min, B., Tremblay, M., Kawahara, T., Lambeth,J., Haque, S., 2008. Redox regulation of interleukin-4 signaling. Immunity 29(4), 551–564.
Shuai, K., Liu, B., 2003. Regulation of JAK–STAT signalling in the immune system.Nat. Rev. Immunol. 3 (11), 900–911.
Stelling, J., Sauer, U., Szallasi, Z., Doyle III, F., Doyle, J., 2004. Robustness of cellularfunctions. Cell 118 (6), 675–685.
Sun Han, T., 1980. Multiple mutual informations and multiple interactions infrequency data. Inf. Control 46 (1), 26–45.
Swameye, I., Muller, T., Timmer, J., Sandra, O., Klingmuller, U., 2003. Identificationof nucleocytoplasmic cycling as a remote sensor in cellular signaling bydatabased modeling. Proc. Natl. Acad. Sci. USA 100 (3), 1028.

Y. Li et al. / Journal of Theoretical Biology 302 (2012) 29–3838
Tononi, G., Sporns, O., Edelman, G., 1994. A measure for brain complexity: relatingfunctional segregation and integration in the nervous system. Proc. Natl. Acad.Sci. 91 (11), 5033.
Tononi, G., Sporns, O., Edelman, G., 1999. Measures of degeneracy andredundancy in biological networks. Proc. Natl. Acad. Sci. USA 96 (6),
3257.van Wageningen, S., Kemmeren, P., Lijnzaad, P., Margaritis, T., Benschop, J., de
Castro, I., van Leenen, D., Groot Koerkamp, M., Ko, C., Miles, A., et al., 2010.
Functional overlap and regulatory links shape genetic interactions betweensignaling pathways. Cell 143 (6), 991–1004.
Wang, D., Moriggl, R., Stravopodis, D., Carpino, N., Marine, J., Teglund, S., Feng, J.,Ihle, J., 2000. A small amphipathic a-helical region is required for transcrip-tional activities and proteasome-dependent turnover of the tyrosine-phos-phorylated STAT5. EMBO J. 19 (3), 392–399.
Xiao, D., Li, W., 2000. Limit cycles for the competitive three dimensional Lotka–Volterra system. J. Differential Equations 164 (1), 1–15.
Yeung, R., 2002. A First Course in Information Theory, vol. 1. Plenum Pub Corp.