quality & performance improvement for basic manager education
TRANSCRIPT

QUALITY & PERFORMANCE QUALITY & PERFORMANCE IMPROVEMENTIMPROVEMENT
For Basic Manager Education

Quality & Performance Improvement Defined
Continuous cycles of improvement Driven by our mission and vision That stimulate individuals and teams to
look at the way they deliver care and services
To identify the root causes of problems in our systems
And innovate to make improvements
THE GOAL:A “Highly Reliable” Organization
The right care for every patient, at right time, every time (Sec. Michael Leavitt, HHS, 2007)
Humans are not highly reliable Systems and processes can be It is the job of leadership to develop and
maintain systems that make it hard for staff to make an error
It is also leadership’s job to hold staff accountable for using highly reliable systems

Terminology:What’s the Big Difference?!
QC: quality control
QA: quality assurance or assessment
QI: quality improvement
PI: performance improvement

““If I had six hours to chop down a tree, I’d If I had six hours to chop down a tree, I’d
spend the first four sharpening the axe.”spend the first four sharpening the axe.” AbrahamAbraham LincolnLincoln
Quality Control (QC) is about putting routine checks in place to ensure that your service or output will be safe and effective
It is routinely documented and is a task that is generally easily shared among staff; all have a role to play in making day-to-day work safe
Examples: temp checks, routine preventive maintenance, running test controls (sharpening your axe!)

““The beginning is the most The beginning is the most important part of work.” important part of work.” PlatoPlato
Quality Assurance (QA) is meant to determine where we are in relation to where we want to be; we have to start somewhere
It compares measured performance to a predetermined benchmark or threshold
Examples: medical record documentation review; CAH PIN clinical studies (stroke, surgical care, patient safety)

““The significant problems we face cannot The significant problems we face cannot be solved at the same level of thinking we be solved at the same level of thinking we were at when we created them.”were at when we created them.” Albert EinsteinAlbert Einstein
Quality & Performance Improvement (QI/PI) are about making changes for the better
This requires setting specific goals and making changes to achieve those goals
They rely on measuring progress routinely
They need participation by everyone in the organization
Quality Improvement focus is on improving clinical quality
Performance Improvement focus is organization-wide

Approaching improvement byHardwiring Excellence
Into the way we provide service Into the way we deliver clinical
quality Into the way we develop our staff Into the way we manage our
finances Into the way we grow our businessQuint Studer, Hardwiring Excellence, © 2003

Studer defines our systems as “pillars”
Service: consistently exceeding customer expectations results in increased satisfaction
Clinical Quality: patient-centered care that is safe, effectively, timely, efficient, equitable (IOM, 2001)
People: well-trained, recognized, and rewarded staff bring commitment and dedication to the workplace
Finance: solid planning and management results in a positive margin to sustain current ops and provide future needs
Growth: a well-researched, methodical approach involving key stakeholders results in steady growth
The pillars work together, synergistically, to achieve mission

CMS: I’m from the CMS: I’m from the GovernmentGovernment& I’m here to help.& I’m here to help.
Conditions of Participation for Medicare and Medicaid require hospitals to have a hospital-wide QA/PI program that focuses on the outcomes of their organization’s services
Prospective Payment System (PPS) hospital payments are dependent on this – CAH payments may soon be, too

Quality Conditions of Participation
Conduct annual evaluation of the CAH program
Must have an effective quality program
Includes all patient care and other services affecting patient health and safety
Includes nosocomial infections and medication therapy

Quality Conditions of Participation
Program must include the quality and appropriateness of diagnosis and treatment
Considers the findings and recommendations from the Quality Improvement Organization (QIO) and takes corrective action
Takes appropriate remedial action to address deficiencies found through the program, including regulatory survey deficiencies

But we already give good care …
PROVE IT!
All right, we will!
Performance reporting – “What gets measured gets managed.”
BUT … not everything that can be measured is worth managing…
…and everything that should be managed can’t always be easily measured.

Monitoring Hospital-wide Performance
Service: customer satisfaction, complaints
Quality: patient safety, best practices, risk
People: performance evals, staff development
Finance: revenue, expenses, productivity
Growth: market share, volume, new services

National Patient Safety Goals
Medication safety (reconciliation, look alike-sound alike drugs, concentrations, labeling)
Healthcare acquired infections (pneumonia, MRSA, hand hygiene)
Falls (reduction program) Patient identification (2) Communication among caregivers (verbal order
read back, abbreviations, critical values, hand offs)
Preventable deaths are sentinel events
IHI 5 Million Lives Campaign
Protect patients from 5 million incidents of medical harm; Dec 2006 through Dec 2008– Includes the 6 aims of the 100,000 Lives
Campaign– Prevent harm from high-alert medications– Reduce surgical complications– Prevent pressure ulcers– Reduce MRSA infection– Deliver evidence-based care of CHF– Get boards on board

CMS Core Measures
Surgical Infection Prevention: appropriate antibiotic given within 1 hour of cut time & discontinued within 24 hr of close
Acute Myocardial Infarction: aspirin on arrival & discharge, beta blocker on arrival & discharge, 30 min door to drug time for thrombolytic, lipid assessment
Heart Failure: left ventricular failure (LVF) assessment, ACE inhibitor for LVSD, complete discharge instructions (meds, follow up, weight, diet, activity, symptoms)
Pneumonia: appropriate antibiotics within 4 hr of arrival but after blood cultures, blood cultures within 24 hr if obtained, O2 saturation assessment
All: smoking cessation education; pneumococcal & influenza immunization

Department Performance“With great power comes great responsibility” Ben Parker
Everyone gets to report in some way how they are– Exceeding customer expectations– Improving the quality of care and/or services– Developing your staff– Managing your finances– Growing your service
You decide how you and your staff will measure performance
You decide what processes need improvement and how to improve them
““Stop a moment, cease your Stop a moment, cease your work, look around you.” work, look around you.” Leo TolstoyLeo Tolstoy
Quality is not about data, graphs, and reports
These are tools to show whether or not you’ve hit your target or reached your destination
If you don’t know where you’re headed then you’re never lost

The PDCA Improvement Cycle

Data Collection – Essential Elements
Operational definition – describe in quantifiable terms what you will measure & how to measure it consistently (inclusion & exclusion criteria)
Know why you are collecting the data – what will you do with it once you have it?
What stratification will be important to have – what level of detail will you need to get to the meat of the issue
Will you collect all data points or just a sample - how will you sample to ensure your data is valid? That is presents a complete picture?

Data Pitfalls – Watch out!
Misunderstandings about how to collect data
Inaccurate measuring instruments Cheating/ fear Poor choice of collection period Poor sampling techniques Lost data Bias

Data Analysis – Run Charts
Depicts data over time
0102030405060708090
100
1st Qtr 2nd Qtr 3rd Qtr 4th Qtr

Data Analysis – Control Charts
Shows trends over time
Uses statistically determined upper and lower limits to define a range of acceptability
Goal is to gain consistency in operation
0
10
20
30
40
50
60
70
80
90
100
1st Qtr 2nd Qtr 3rd Qtr 4th Qtr
East lower limit upper limit mean
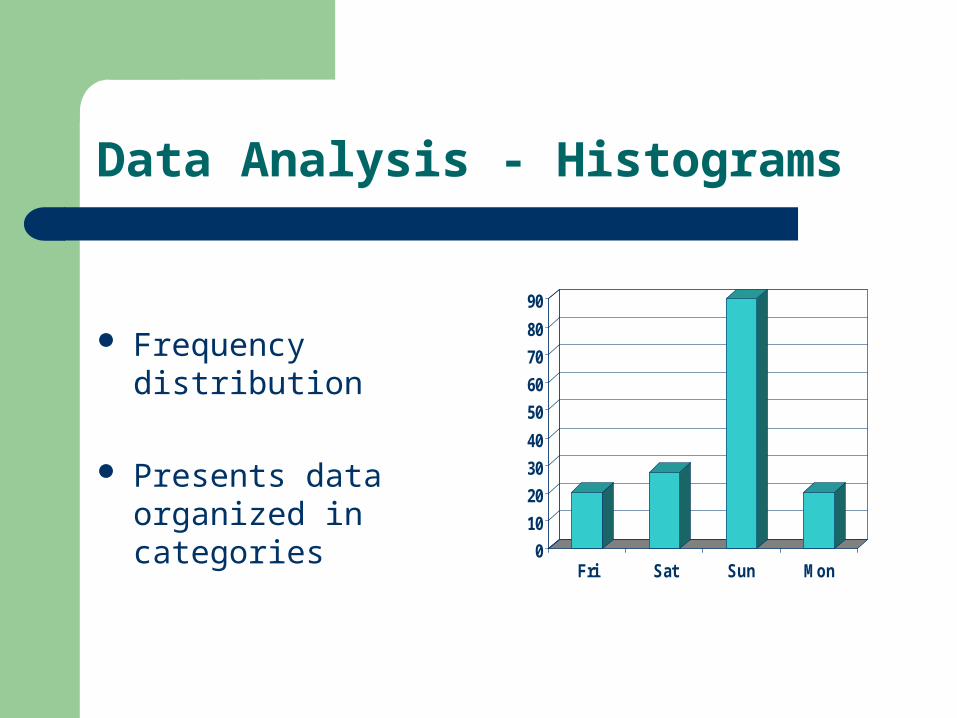
Data Analysis - Histograms
Frequency distribution
Presents data organized in categories
0
10
20
30
40
50
60
70
80
90
Fri Sat Sun Mon

Data Analysis – Pareto Charts
Tool to rank-order or prioritize problems, causes of a problem, or categories of some event or issue
0
5
10
15
20
25
30
adm trans presc disp

Data Analysis – Cause & Effect Diagram (Fishbone)
Identify multiple causes of any result, outcome, or problem
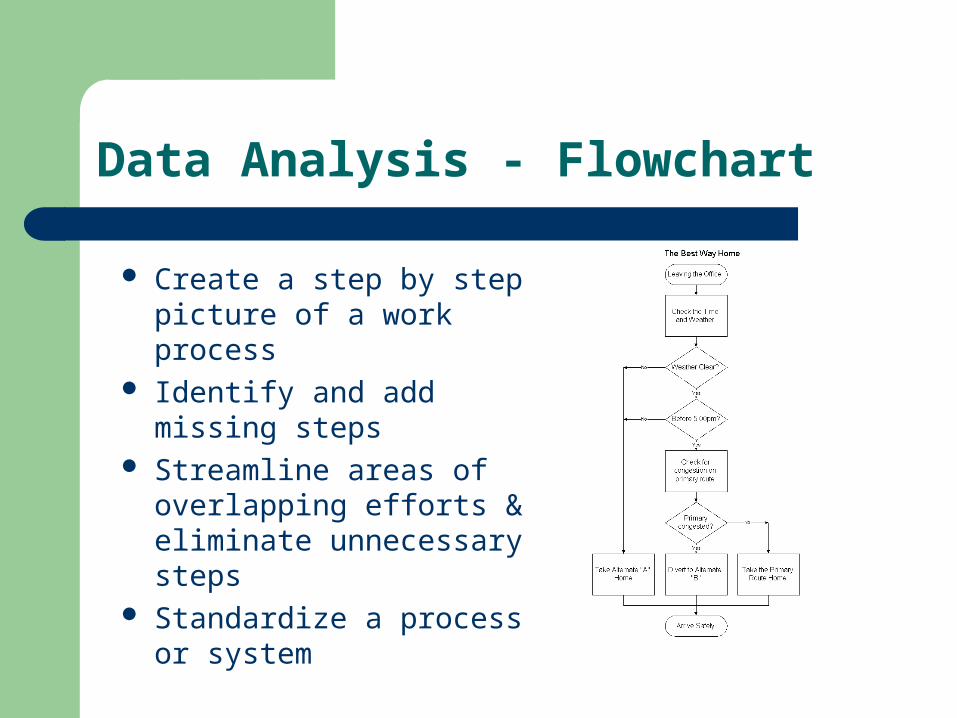
Data Analysis - Flowchart
Create a step by step picture of a work process
Identify and add missing steps
Streamline areas of overlapping efforts & eliminate unnecessary steps
Standardize a process or system

““Opportunity is missed by most people Opportunity is missed by most people because it is dressed in overalls and looks because it is dressed in overalls and looks like work.”like work.” Thomas EdisonThomas Edison
Failure Mode and Effects Analysis (FMEA) is proactive risk assessment
The object is to identify hazards and put control measures into place to prevent bad things from happening
Root Cause Analysis (RCA) is after the fact – something undesirable has already happened, but we can learn from it and prevent it from happening again

““If you put off everything till you’re If you put off everything till you’re sure of it, you’ll get nothing done.”sure of it, you’ll get nothing done.” Norman Vincent PealeNorman Vincent Peale
Tips for a Success Keep after it – it benefits the patients, the hospital, & you personally
Involve your staff; they have some great ideas and will be more likely to buy in to goals and action plans (don’t forget to assign them data collection, too)

““To improve is to change, to succeed To improve is to change, to succeed is to change often.”is to change often.” Winston ChurchillWinston Churchill
Talk to your comrades in other facilities; they can give you a different perspective
Use the program to help you make things better and recognize staff for a job well done
Generate a sense of teamwork in your department and with other departments
Celebrate your success (no matter how small); reward yourself and your staff

““Our life is frittered away by detail. Our life is frittered away by detail. Simplify, simplify.”Simplify, simplify.” Henry David ThoreauHenry David Thoreau
Don’t bite off more than you can chew; make your projects worthwhile but not overwhelming
Use the Quality Coord/Director as a resource for ideas, data collection and display, etc.
Don’t reinvent the wheel; research best practices; you don’t have to make stuff up
Align projects with department priorities; we’ve got plenty to keep us busy, we don’t need more busywork

““Excellence is a habit, not an Excellence is a habit, not an event.” event.” AristotleAristotle
Align your QI/PI improvements with the hospital strategic plan and vision
Keep it in front of you; put it on your calendar, your task list, your office door, your monthly staff meeting agenda, your refrigerator, your mirror
Be prepared when you are due to report
Attitude is everything; this doesn’t have to be a meaningless paper-pushing process; YOU have the power to make it meaningful to you and your staff

““Celebrate, celebrate!!Celebrate, celebrate!! Dance to the music!” Dance to the music!” Three Dog NightThree Dog Night
Find joy in your work; if you don’t, what’s the
point?