quality assurance project plan - ibwc.gov · quality assurance project plan rio grande basin...
TRANSCRIPT


USIBWC FY16-17 QAPP Page 1 Last revised on August 18, 2015 USIBWC CRP QAPP FY1617
Quality Assurance Project Plan Rio Grande Basin Monitoring
Program
4171 N. Mesa St., Ste. C-100
El Paso, TX 79902
Clean Rivers Program
Water Quality Planning Division
Texas Commission on Environmental Quality
P.O. Box 13087, MC 234
Austin, Texas 78711-3087
Effective Period: FY 2016 to FY 2017
Questions concerning this QAPP should be directed to: Leslie Grijalva USIBWC El Paso Headquarters Program Manager 4171 N. Mesa St., Ste. C-100 El Paso, TX 79902 (915) 832-4770 [email protected]


USIBWC FY16-17 QAPP Page 8 Last revised on August 18, 2015 USIBWC CRP QAPP FY1617
A2 Table of Contents
Quality Assurance Project Plan ................................................................................................................. 1
Rio Grande Basin Monitoring Program ..................................................................................................... 1
A1 Approval Page 1 of 6 ..................................................................................................................... 2
A2 Table of Contents .......................................................................................................................... 8
List of Acronyms ..................................................................................................................................... 10
A3 Distribution List ........................................................................................................................... 11
A4 PROJECT/TASK ORGANIZATION .................................................................................................. 15
Figure 1, A4.1. Organization Chart - Lines of Communication ....................................................... 22
A5 Problem Definition/Background ................................................................................................. 23 Figure 2, A5.1. Map of Rio Grande Basin ........................................................................................ 25
Table 1, A5.1 Designated Uses and Criteria for segments in the Rio Grande Basin ...................... 26
A6 Project/Task Description ............................................................................................................ 27
A7 Quality Objectives and Criteria ................................................................................................... 28
A8 Special Training/Certification ..................................................................................................... 30
A9 Documents and Records ............................................................................................................. 31
Table A9.1 Project Documents and Records .................................................................................. 32
B1 Sampling Process Design ................................................................................................................ 33 B2 Sampling Methods .......................................................................................................................... 33
Table 3: B2.1 Sample Storage, Preservation and Handling Requirements, A&B Environmental Services, Inc. ................................................................................................................................... 34
Table 4: B2.2 Sample Storage, Preservation and Handling Requirements, City of Laredo Health Department Laboratory .................................................................................................................. 36
Table 5: B2.3 Sample Storage, Preservation and Handling Requirements, EPWU International Water Quality Laboratory ............................................................................................................... 36 Table 6: B2.4 Sample Storage, Preservation and Handling Requirements, Brownsville PUB Laboratory………………………………………………………………………………………………………………………..37
B3 Sample Handling and Custody ........................................................................................................ 39
B4 Analytical Methods ......................................................................................................................... 41
B5 Quality Control ................................................................................................................................ 42
B6 Instrument/Equipment Testing, Inspection, and Maintenance ..................................................... 48
B7 Instrument Calibration and Frequency ........................................................................................... 48 Table 7: B7.1. Post Calibration Check Error Limits ......................................................................... 48
B8 Inspection/Acceptance of Supplies and Consumables ................................................................... 49
B9 Acquired Data ................................................................................................................................. 49
B10 Data Management ...................................................................................................................... 49
Table 8, B10.1. Submitting and Collecting Entity Codes ................................................................. 51 Table 9, B10.2. Personal Computer and Software Configuration .................................................. 52
Table 10, B10.3. GIS Workstation Hardware and Software Configuration .................................... 53
C1 Assessments and Response Actions ............................................................................................... 55
Table C1.1 Assessments and Response Requirements .................................................................. 55
Figure C1.1 Corrective Action Process for Deficiencies .................................................................. 57
C2 Reports to Management................................................................................................................. 58

USIBWC FY16-17 QAPP Page 9 Last revised on August 18, 2015 USIBWC CRP QAPP FY1617
Table C2.1 QA Management Reports ............................................................................................. 59
D1 Data Review, Verification, and Validation .................................................................................. 60
D2 Verification and Validation Methods .......................................................................................... 60
Table D2.1: Data Review Tasks ....................................................................................................... 62
D3 Reconciliation with User Requirements ..................................................................................... 63
Appendix A: Measurement Performance Specifications (Table A7.1) ................................................... 64
Appendix B: Task 3 Work Plan & Sampling Process Design and Monitoring Schedule (Plan) ............... 81
Table 14, Appendix B.1. Analyte Groups and Monitoring Entities ................................................. 85
Table 15, B.2. CRP Partners and their Affiliated Lab ...................................................................... 86
Table 16, B.3. CRP Partners and their Field Sheets ........................................................................ 87 Monitoring Sites for FY2016 ........................................................................................................... 89
Appendix C: Station Location Maps ...................................................................................................... 102
Appendix D: Field Data Sheets .............................................................................................................. 108
Appendix E: Chain of Custody Forms .................................................................................................... 114
Appendix F: Data Review Checklist and Summary Shells ..................................................................... 126
ATTACHMENT 1 Letter to Document Adherence to the QAPP ............................................................ 127

USIBWC FY16-17 QAPP Page 10 Last revised on August 18, 2015 USIBWC CRP QAPP FY1617
List of Acronyms
AWRL Ambient Water Reporting Limit BBNP Big Bend National Park BBRSP Big Bend Ranch State Park BMP Best Management Practices BPUB Brownsville Public Utilities Board CAP Corrective Action Plan COC Chain of Custody CRP Clean Rivers Program DMRG Data Management Reference Guide, November 2013, or most recent version DM&A Data Management and Analysis EPCC El Paso Community College EPWU El Paso Water Utilities EPA United States Environmental Protection Agency FY Fiscal Year GIS Geographical Information System GPS Global Positioning System LAN Local Area Network LCS Laboratory Control Sample LCSD Laboratory Control Sample Duplicate LIMS Laboratory Information Management System LOD Limit of Detection LOQ Limit of Quantitation NELAP National Environmental Lab Accreditation Program OPP Operating Policies and Procedures PM Project Manager QA Quality Assurance QAM Quality Assurance Manual QM Quality Manual QAO Quality Assurance Officer QAPP Quality Assurance Project Plan QAS Quality Assurance Specialist QC Quality Control QMP Quality Management Plan RGBMP Rio Grande Basin Monitoring Program RGISC Rio Grande International Study Center SLOC Station Location SOP Standard Operating Procedure SWQM Surface Water Quality Monitoring SWQMIS Surface Water Quality Monitoring Information System TAMIU Texas A&M International University TMDL Total Maximum Daily Load TPWD Texas Parks and Wildlife Department TCEQ Texas Commission on Environmental Quality TNI The NELAC Institute TSWQS Texas Surface Water Quality Standards VOA Volatile Organic Analytes USIBWC U.S. International Boundary and Water Commission UTB University of Texas at Brownsville UTEP University of Texas at El Paso

USIBWC FY16-17 QAPP Page 11 Last revised on August 18, 2015 USIBWC CRP QAPP FY1617
A3 Distribution List
Texas Commission on Environmental Quality P.O. Box 13087 Austin, Texas 78711-3087 Sarah Eagle, Project Manager Clean Rivers Program MC-234 (512) 239-6329 Daniel R. Burke Lead CRP Quality Assurance Specialist MC-165 (512) 239-0011 Cathy Anderson Team Leader, Data Management and Analysis MC-234 (512) 239-1805 United States Section, International Boundary and Water Commission (USIBWC) 4171 N. Mesa St., Ste. C-100 El Paso, Texas 79902 Leslie Grijalva, USIBWC El Paso Headquarters Program Manager (915) 832-4770
Andres Garcia, USIBWC El Paso Headquarters Quality Assurance Officer (915) 832-4779
USIBWC Field Office- American Dam/Carlos Marin Field Office 2616 W. Paisano Drive El Paso, TX 79922-1629 Attention: Area Project Manager (915) 351-1030 USIBWC Field Office- Amistad Dam Field Office 670 Texas Spur 349 Del Rio, TX 78840-0425 Attention: Area Project Manager (830) 775-2437

USIBWC FY16-17 QAPP Page 12 Last revised on August 18, 2015 USIBWC CRP QAPP FY1617
USIBWC Field Office- Falcon Dam Field Office PO Box 1 FM 2098, Reservoir Road Falcon Heights, TX 78545-0001 Attention: Area Project Manager (956) 848-5211 USIBWC Field Office- Mercedes Field Office 325 Golf Course Road Mercedes, TX 78570-9677 Attention: Area Project Manager (956) 565-3150 USIBWC Field Office- Presidio Field Office PO Box 848 110 South Dod Avenue Presidio, TX 79485-0848 Attention: Area Project Manager (432) 229-3751 A&B Environmental Services, Inc. 10100 East Freeway, Ste. 100 Houston, Texas 77029 Yuhui Zhang, Laboratory Manager Rita Wells, Quality Assurance Officer (713) 453-6060 (713) 453-6060 Brownsville Public Utilities Board- Analytical Laboratory 1425 Robinhood Drive, P.O. Box 3270 Brownsville, TX 78523-3270 LeeRoy Atkinson, Laboratory Manager Michael McCall, Quality Assurance Specialist (956) 983-6357 (956) 983-6253 El Paso Water Utilities Public Service Board 4100 Delta Drive, P.O. Box 511 El Paso, TX 79961 Paul Rivas, Laboratory Manager Richard Wilcox, Quality Assurance Chemist (915) 594- 5722 (915) 594- 5444

USIBWC FY16-17 QAPP Page 13 Last revised on August 18, 2015 USIBWC CRP QAPP FY1617
City of Laredo Health Department Laboratory 2600 Cedar- P.O. Box 2337 Laredo, TX 78044-2337 Rebecca Castro, Technical Director and Quality Assurance Manager (956) 795- 4908 ext. 4693 City of Laredo Health Department 2600 Cedar, P.O. Box 2337 Laredo, TX 78044-2337 Samuel Gonzalez Daniel Maldonado, Sanitation Inspector (956) 740-3964 (956) 795- 4904 ext. 4626 Lupe Luna, Sanitation Inspector (956) 795- 4904 ext. 4624 City of Laredo Environmental Services Department 619 Reynolds St. Laredo, TX 78040 Riazul Mia, Director Lucky Roncinske, Environmental Technician II (956) 794-1650 956-794-1650 Rio Grande International Study Center (RGISC) 1105 Beverly Laredo, TX 78045 Dr. Tom Vaughan, Professor (956) 326-2592 Texas Parks and Wildlife Department State Parks Region 1 Director P.O. Box 1079 Fort Davis, Texas 79734 Mark Lockwood (432) 426-3533 ext. 239 Barton Warnock Education Center HC 70 Box 375 Terlingua, Texas 79852 David Long (432) 424-3327

USIBWC FY16-17 QAPP Page 14 Last revised on August 18, 2015 USIBWC CRP QAPP FY1617
Big Bend National Park Science & Resource Management 266 Tecolote Drive Big Bend National Park, TX 79834 Jeff Bennett, Physical Scientist (432) 477-1141 or (432) 837-9964 University of Texas at Brownsville Chemistry & Environmental Sciences Department 80 Fort Brown Brownsville, TX 78520 Dr. Elizabeth Heise, Professor (956) 882-6769 El Paso Community College P.O. Box 20500 El Paso, TX 79998 Dr. Maria E. Alvarez, Professor of Biology, Biology District-Wide Coordinator, and MBRS-RISE and MSEIP Program Director (915) 831-5074 Department of Biological Sciences University of Texas at El Paso 500 W University Ave. El Paso, Texas 79968-0519 Dr. Elizabeth Walsh, Professor (915) 747-5421 The USIBWC will provide copies of this project plan and any amendments or appendices of this plan to each person on this list and to each sub-tier project participant, e.g., subcontractors, sub participant, or other units of government. The USIBWC will document distribution of the plan and any amendments and appendices, maintain this documentation as part of the project’s quality assurance records, and will ensure the documentation is available for review.

USIBWC FY16-17 QAPP Page 15 Last revised on August 18, 2015 USIBWC CRP QAPP FY1617
A4 PROJECT/TASK ORGANIZATION
Description of Responsibilities
TCEQ
Sarah Eagle CRP Work Leader Responsible for Texas Commission on Environmental Quality (TCEQ) activities supporting the development and implementation of the Texas Clean Rivers Program (CRP). Responsible for verifying that the TCEQ Quality Management Plan (QMP) is followed by CRP staff. Supervises TCEQ CRP staff. Reviews and responds to any deficiencies, corrective actions, or findings related to the area of responsibility. Oversees the development of Quality Assurance (QA) guidance for the CRP. Reviews and approves all QA audits, corrective actions, reviews, reports, work plans, contracts, QAPPs, and TCEQ Quality Management Plan. Enforces corrective action, as required, where QA protocols are not met. Ensures CRP personnel are fully trained. Daniel R. Burke CRP Lead Quality Assurance Specialist Participates in the development, approval, implementation, and maintenance of written QA standards (e.g., Program Guidance, SOPs, QAPPs, QMP). Assists program and project manager in developing and implementing quality system. Serves on planning team for CRP special projects. Coordinates the review and approval of CRP QAPPs. Prepares and distributes annual audit plans. Conducts monitoring systems audits of Planning Agencies. Concurs with and monitors implementation of corrective actions. Conveys QA problems to appropriate management. Recommends that work be stopped in order to safeguard programmatic objectives, worker safety, public health, or environmental protection. Ensures maintenance of QAPPs and audit records for the CRP. Sarah Eagle CRP Project Manager Responsible for the development, implementation, and maintenance of CRP contracts. Tracks, reviews, and approves deliverables. Participates in the development, approval, implementation, and maintenance of written QA standards (e.g., Program Guidance, SOPs, QAPPs, QMP). Assists CRP Lead QA Specialist in conducting Basin Planning Agency audits. Verifies QAPPs are being followed by contractors and that projects are producing data of known quality. Coordinates project planning with the Basin Planning Agency Project Manager. Reviews and approves data and reports produced by contractors. Notifies QA Specialists of circumstances which may adversely affect the quality of data derived from the collection and analysis of samples. Develops, enforces, and monitors corrective action measures to ensure contractors meet deadlines and scheduled commitments. Cathy Anderson Team Leader, Data Management and Analysis (DM&A) Team Participates in the development, approval, implementation, and maintenance of written QA standards (e.g., Program Guidance, SOPs, QAPPs, QMP). Ensures DM&A staff perform data management related tasks, including coordination and tracking of CRP data sets from initial submittal through CRP Project Manager review and approval; ensuring that data are reported following

USIBWC FY16-17 QAPP Page 16 Last revised on August 18, 2015 USIBWC CRP QAPP FY1617
instructions in the Surface Water Quality Monitoring Data Management Reference Guide (DMRG), November 2013, or most current version (DMRG); running automated data validation checks in Surface Water Quality Monitoring Information System (SWQMIS) and coordinating data verification and error correction with CRP Project Managers; generating SWQMIS summary reports to assist CRP Project Managers' data review; identifying data anomalies and inconsistencies; providing training and guidance to CRP and Planning Agencies on technical data issues to ensure that data are submitted according to documented procedures; reviewing QAPPs for valid stream monitoring stations, validity of parameter codes, submitting entity code(s), collecting entity code(s), and monitoring type code(s); developing and maintaining data management-related standard operating procedures (SOPs) for CRP data management; and coordinating and processing data correction requests. Peter Bohls CRP Data Manager, DM&A Team Responsible for coordination and tracking of CRP data sets from initial submittal through CRP Project Manager review and approval. Ensures that data are reported following instructions in the DMRG. Runs automated data validation checks in SWQMIS and coordinates data verification and error correction with CRP Project Managers. Generates SWQMIS summary reports to assist CRP Project Managers’ data review. Identifies data anomalies and inconsistencies. Provides training and guidance to CRP and Planning Agencies on technical data issues to ensure that data are submitted according to documented procedures. Reviews QAPPs for valid stream monitoring stations. Checks validity of parameter codes, submitting entity code(s), collecting entity code(s), and monitoring type code(s). Develops and maintains data management-related SOPs for CRP data management. Coordinates and processes data correction requests. Participates in the development, implementation, and maintenance of written QA standards (e.g., Program Guidance, SOPs, QAPPs, QMP). Allison Fischer CRP Project Quality Assurance Specialist Serves as liaison between CRP management and TCEQ QA management. Participates in the development, approval, implementation, and maintenance of written QA standards (e.g., Program Guidance, SOPs, QAPPs, QMP). Serves on planning team for CRP special projects and reviews QAPPs in coordination with other CRP staff. Coordinates documentation and implementation of corrective action for the CRP.
United States Section, International Boundary and Water Commission (USIBWC)
Gilbert Anaya USIBWC Environmental Management Division Chief Responsible for oversight of the USIBWC El Paso Headquarters Program and Clean Rivers Program at the USIBWC. Performs evaluations of USIBWC El Paso Headquarters personnel. Cost Center Manager for the USIBWC El Paso Headquarters budget. Luis Hernandez USIBWC Operations and Maintenance Division Chief Responsible for oversight of the USIBWC field offices that are considered Clean Rivers Program partners.

USIBWC FY16-17 QAPP Page 17 Last revised on August 18, 2015 USIBWC CRP QAPP FY1617
Leslie Grijalva USIBWC El Paso Headquarters Program Manager Responsible for implementing and monitoring CRP requirements in contracts, QAPPs, and QAPP amendments and appendices. Coordinates basin planning activities and work of basin partners. Ensures monitoring systems audits are conducted to ensure QAPPs are followed by USIBWC participants and that projects are producing data of known quality. Ensures that sub participants are qualified to perform contracted work. Ensures CRP project managers and/or QA Specialists are notified of deficiencies and corrective actions, and that issues are resolved. Responsible for validating that data collected are acceptable for reporting to the TCEQ. Responsible for validating that data collected are acceptable for reporting to the TCEQ. Responsible for ensuring that field data are properly reviewed and verified. Responsible for the transfer of basin quality-assured water quality data to the TCEQ in a format compatible with SWQMIS. Maintain quality-assured data on USIBWC internal sites. Andres Garcia USIBWC El Paso Headquarters Quality Assurance Officer Responsible for coordinating the implementation of the QA program. Responsible for writing and maintaining the QAPP and monitoring its implementation. Responsible for maintaining records of QAPP distribution, including appendices and amendments. Responsible for maintaining written records of sub-tier commitment to requirements specified in this QAPP. Responsible for identifying, receiving, and maintaining project QA records. Responsible for coordinating with the TCEQ QAS to resolve QA-related issues. Notifies the USIBWC El Paso Headquarters Program Manager of particular circumstances which may adversely affect the quality of data. Coordinates and monitors deficiencies and corrective action. Coordinates and maintains records of data verification and validation. Coordinates the research and review of technical QA material and data related to water quality monitoring system design and analytical techniques. Conducts monitoring systems audits on project participants to determine compliance with project and program specifications, issues written reports, and follows through on findings. Ensures that field staff is properly trained and that training records are maintained. Responsible for ensuring that field data are properly reviewed and verified. Responsible for the transfer of basin quality-assured water quality data to the TCEQ in a format compatible with SWQMIS. Maintain quality-assured data on USIBWC internet sites. Leslie Grijalva and Andres Garcia USIBWC Data Managers Responsible for ensuring that field data are properly reviewed and verified. Responsible for the transfer of basin quality-assured water quality data to the TCEQ in a format compatible with SWQMIS. Maintains quality-assured data on USIBWC internet sites. Yuhui Zhang A&B Environmental Services, Inc., Laboratory Manager Responsible for project coordination at A&B, providing support to IBWC at each program stage: QAPP development, sampling, sample receipt and login, analyses, and data reporting. Responsible for quality assurance of reported analyses performed by A&B and may perform validation and verification of data before the report is sent to USIBWC. Notifies the USIBWC El Paso Headquarters

USIBWC FY16-17 QAPP Page 18 Last revised on August 18, 2015 USIBWC CRP QAPP FY1617
Program Manager of particular circumstance which may adversely affect the quality of data. Responsible for coordinating with A&B and USIBWC El Paso Headquarters Program Manager to resolve QA-related issues. Implements of ensures implementation of corrective action needed to resolve nonconformance noted during assessments. Rita Wells A&B Environmental Services, Inc., Quality Assurance Officer Responsible for the overall quality control and quality assurance of analyses performed by A&B. Monitors implementation of the QAM/QAPP within the laboratory to ensure complete compliance with QA data quality objectives, as defined by the contract and in the QAPP. Conducts in-house audits to ensure compliance with written SOPs and to identify potential problems. Responsible for supervising and verifying all aspects of the QA/QC in the laboratory. RIO GRANDE BASIN CRP PARTNERS The Program Manager, QAO, and Data Manager for all of the below listed partners are the same as listed above for USIBWC, unless otherwise noted. US International Boundary and Water Commission, Field Offices Manages data collection activities and generates the work orders for water quality monitoring at five field offices along the Texas portion of the Rio Grande. The project managers’ direct activities on the local level as follows: American Dam, Amistad Dam, Falcon Dam, Mercedes, and Presidio. Samples collected by the Amistad Dam, Falcon Dam, Mercedes and Presidio field offices are shipped to A&B Lab Services, Inc. for analysis. American Dam submits their samples to the El Paso Water Utilities laboratory for analysis. Lee Roy Atkinson, Laboratory Manager Brownsville Public Utilities Board (BPUB) Laboratory Responsible for water quality monitoring, analysis, and data review of Station 20449 in Brownsville, TX. Samples collected and logged into database and are analyzed by the BPUB accredited laboratory as part of their regular permit monitoring. Responsible for overseeing the analysis of E. coli and Enterococcus from the UTB samples from Stations 16288 and 13176 of the Rio Grande Basin monitoring program. Michael McCall, Quality Assurance Specialist Brownsville Public Utilities Board (BPUB) Laboratory Responsible for the review of laboratory data and laboratory techniques performed at the BPUB laboratory. Responsible for the overall quality control and quality assurance of analyses performed by the BPUB laboratory. Monitors implementation of the QM/QAPP within the laboratory to ensure complete compliance with QA data quality objectives, as defined by the QAPP. Conducts internal annual audits to ensure compliance with written SOPs, identify potential problems and initiate Corrective Action Reports and files. Responsible for supervising and verifying all aspects of the QA/QC in the laboratory.

USIBWC FY16-17 QAPP Page 19 Last revised on August 18, 2015 USIBWC CRP QAPP FY1617
Paul R. Rivas, Laboratory Services Manager El Paso Water Utilities Responsible for water quality laboratory analysis and data review in the El Paso area. Samples collected by USIBWC American Dam Field Office are analyzed by the El Paso Water Utilities laboratory, which is an accredited laboratory. Responsible for sending data monthly to the USIBWC. Richard Wilcox, Quality Assurance Chemist El Paso Water Utilities Responsible for the review of laboratory data and laboratory techniques performed at the EPWU laboratory. Responsible for the overall quality control and quality assurance of analyses performed by the EPWU laboratory. Monitors implementation of the QM/QAPP within the laboratory to ensure complete compliance with QA data quality objectives, as defined by the QAPP. Conducts internal annual audits to ensure compliance with written SOPs, identify potential problems and initiate Corrective Action Reports and files. Responsible for supervising and verifying all aspects of the QA/QC in the laboratory. Rebecca Castro, Technical Director/ Quality Assurance Officer City of Laredo Health Department Laboratory Responsible for the review of laboratory data and laboratory techniques performed at the City of Laredo Health Department laboratory. Responsible for the overall quality control and quality assurance of analyses performed by the City of Laredo Health Department laboratory. Monitors implementation of the QM/QAPP within the laboratory to ensure complete compliance with QA data quality objectives, as defined by the QAPP. Conducts internal annual audits to ensure compliance with written SOPs, identify potential problems and initiate Corrective Action Reports and files. Responsible for supervising and verifying all aspects of the QA/QC in the laboratory. Samuel Gonzalez, Chief of Environmental Health Services City of Laredo Health Department Responsible for supervising water quality monitoring staff at the City of Laredo Health Department. And Daniel Maldonado and Lupe Luna, Sanitation Inspectors City of Laredo Health Department Responsible for water quality monitoring and review of field data for samples collected in the Laredo area of the Rio Grande. Samples collected are submitted to the City of Laredo Health Department Laboratory for analysis. Director City of Laredo Environmental Services Department Responsible for supervising water quality monitoring staff at the City of Laredo Environmental Services Department. And

USIBWC FY16-17 QAPP Page 20 Last revised on August 18, 2015 USIBWC CRP QAPP FY1617
Lucky Roncinske City of Laredo Environmental Services Department Responsible for water quality monitoring and data review for samples collected on Manadas Creek in the Laredo area. Samples collected are submitted to A&B Environmental Services, Inc. for analysis. Dr. Tom Vaughan Rio Grande International Study Center (RGISC) Responsible for water quality monitoring and data review in the Laredo area of the Rio Grande. Samples collected are submitted A&B Environmental Services, Inc. for analysis. Mark Lockwood Texas Parks and Wildlife Department, Natural Resources Program Responsible for water quality monitoring and sample collection of station in Big Bend Ranch State Park. Water samples collected are submitted to A&B Environmental Services, Inc. for analysis. David Long Texas Parks and Wildlife Department, Barton Warnock Education Center Responsible for water quality monitoring and sample collection stations in Big Bend Ranch State Park. Water samples collected are submitted to A&B Environmental Services, Inc. for analysis. Mr. Jeff Bennett Big Bend National Park Responsible for water quality monitoring and data review in the Big Bend National Park and Rio Grande Wild and Scenic River. Samples collected are submitted to A&B Environmental Services, Inc. for analysis. Dr. Elizabeth Heise University of Texas at Brownsville Responsible for water quality monitoring and data review in the Brownsville area of the Rio Grande. Samples collected are submitted to A&B Environmental Services, Inc. for analysis. Dr. Maria E. Alvarez, Professor of Biology, Biology District-Wide Coordinator, and MBRS-RISE and MSEIP Program Director El Paso Community College Responsible for water quality monitoring and sample collection of several stations in the El Paso area. Water samples collected are submitted to A&B Environmental Services, Inc. for analysis. Dr. Elizabeth Walsh University of Texas at El Paso Responsible for water quality monitoring and data review in the El Paso area of the Rio Grande. Samples collected are submitted to A&B Environmental Services, Inc. for analysis. Terms of Agreement The USIBWC Clean Rivers Program Sampling Partners agree to the long-term collection of water quality samples and environmental data at designated monitoring stations on a prescribed schedule. The types of samples and data collected by each partner may vary in time, commitment, and

USIBWC FY16-17 QAPP Page 21 Last revised on August 18, 2015 USIBWC CRP QAPP FY1617
geography. A Sampling Partner’s signature on the Section A1 Approval Page of the Rio Grande Basin Monitoring Program Quality Assurance Project Plan or on a Letter of Adherence (see Attachment 1) indicates acknowledgment that the Sampling Partner does not expect to be paid for his/her work, compensation for expenses associated with said in-kind work, and will abide by the Texas Commission on Environmental Quality procedures. In Addition, USIBWC non-federal entity Sampling Partners release, waive, discharge and covenant not to sue the USIBWC, including its officers and employees, with respect to any and all liability, claims or causes of action whatsoever related to any damages or injury that they may sustain, whether caused by the negligence of the USIBWC or otherwise, while performing tasks under this QAPP. USIBWC Sampling Partners are aware and fully responsible for guarding against any risks involved with such activity, and choose to participate voluntarily and at their own risk. They voluntarily assume full responsibility for any property damage or personal injury that they may sustain while participating in, or related to the above activity.

USIBWC FY16-17 QAPP Page 22 Last revised on August 24, 2015 USIBWC CRP QAPP FY1617
PROJECT ORGANIZATION CHART
Figure 1: A4.1. Organization Chart - Lines of Communication
Sarah Eagle TCEQ CRP
Work Leader
Leslie Grijalva, USIBWC El Paso
Headquarters Program Manager
Sarah Eagle TCEQ CRP
Project Manager
Elizabeth Walsh
UTEP Bio. Sciences Dept.
Jeff Bennett Big Bend
National Park
Director, Lucky Roncinske
City of Laredo Env. Serv. Dept.
Elizabeth Heise UTB
Environmental Science Dept.
Yuhui Zhang, A&B Laboratory Manager
Rita Wells, A&B QAO
Tom Vaughan RGISC/ TAMIU
Daniel R. Burke TCEQ Lead QA
Specialist ------------------ Allison Fischer TCEQ Project QA Specialist
USIBWC Field Office Area Managers and Hydrotechs
Lee Roy Atkinson, Michael McCall
Brownsville PUB
Rebecca Castro
City of Laredo Laboratory
Paul R. Rivas Lab Services
Manager El Paso Water
Utilities
Maria Alvarez El Paso
Community College
Mark Lockwood,
David Long, TX Parks &
Wildlife Dept.
Samuel Gonzalez, Danny Maldonado, Lupe Luna, City of
Laredo Health Dept.
Peter Bohls TCEQ CRP Data
Manager
Lines of Management Lines of Communication
Cathy Anderson TCEQ DM&A Team Leader
Gilbert Anaya, Division Chief, USIBWC Environmental
Management Division
Andres Garcia USIBWC El Paso
Headquarters QAO
City of Laredo Health Dept. uses the City of Laredo Health Dept. lab, BPUB analyzes their own data and the enterrococcus samples for the Brownville area, and American Dam uses the El Paso Water Utilities lab. All other partners use A&B.
Luis Hernandez Division Chief,
USIBWC Operations and Maintenance Div.

USIBWC FY16-17 QAPP Page 23 Last revised on August 18, 2015 USIBWC CRP QAPP FY1617
A5 Problem Definition/Background
In 1991, the Texas Legislature passed the Texas Clean River Act (Senate Bill 818) in response to growing concerns that water resource issues were not being pursued in an integrated, systematic manner. The act requires that ongoing water quality assessments be conducted for each river basin in Texas, an approach that integrates water quality issues within the watershed. The CRP legislation mandates that each river authority (or local governing entity) shall submit quality-assured data collected in the river basin to the commission. Quality-assured data in the context of the legislation means data that comply with TCEQ rules for surface water quality monitoring (SWQM) programs, including rules governing the methods under which water samples are collected and analyzed and data from those samples are assessed and maintained. This QAPP addresses the program developed between the USIBWC and the TCEQ to carry out the activities mandated by the legislation. The QAPP was developed and will be implemented in accordance with provisions of the TCEQ Quality Management Plan, January 2013 or most recent version (QMP). The purpose of this QAPP is to clearly delineate USIBWC QA policy, management structure, and procedures which will be used to implement the QA requirements necessary to verify and validate the surface water quality data collected. The QAPP is reviewed by the TCEQ to help ensure that data generated for the purposes described above are scientifically valid and legally defensible. This process will ensure that data collected under this QAPP and submitted to SWQMIS have been collected and managed in a way that guarantees its reliability and therefore can be used in water quality assessments, total maximum daily load (TMDL) development, establishing water quality standards, making permit decisions and used by other programs deemed appropriate by the TCEQ. Project results will be used to support the achievement of CRP objectives, as contained in the Clean Rivers Program Guidance and Reference Guide FY 2016 -2017. The international reach of the Rio Grande (hereinafter Rio Grande Basin) encompasses an immense area from the arid Chihuahuan Desert region around El Paso, Texas, downstream to the subtropical coastal region near Brownsville, Texas. Therefore, for the purpose of coordination and planning, the Rio Grande has been divided into four sub-basins; the Upper Rio Grande Basin extending from the New Mexico/Texas State line downstream to the International Amistad Dam (including the Devils Rivers); the Pecos River sub-basin that extends from the Red Bluff Reservoir at the New Mexico/Texas State line to the confluence with the Rio Grande; the Middle Rio Grande Basin that extends downstream of International Amistad Dam to International Falcon Dam; and the Lower Rio Grande Basin extending from downstream of International Falcon Dam to the Rio Grande Tidal area. The Rio Grande Basin, its tributaries, and associated bays are further partitioned into 14 stream segments: six segments in the Upper Rio Grande Basin, three segments in the Pecos River sub-basin, three segments in the Middle Rio Grande Basin, and two segments in the Lower Rio Grande Basin. Figure 2 shows a map of the CRP portion of the Rio Grande Basin and identifies the Upper, Middle, and Lower Rio Grande and the Pecos River. The Upper Basin includes the main stem of the Rio Grande from the Texas-New Mexico state line in El Paso County downstream to the International Amistad Reservoir in Val Verde County to include the Devils River. The Upper Basin encompasses 8 west Texas counties.

USIBWC FY16-17 QAPP Page 24 Last revised on August 18, 2015 USIBWC CRP QAPP FY1617
Texas Surface Water Quality Standards (TSWQS) identify and designate uses for six segments in the Upper Basin. The designated uses for each of these segments include Contact Recreation, High Aquatic Life, and Public Water Supply (Table 1 A5.1). However, the Rio Grande below International Dam (Segment 2308) is designated as Non-contact Recreation and Limited Aquatic Life. The Pecos River begins in the Sangre de Cristo Mountains of North-Central New Mexico, travels through Eastern New Mexico, crosses into Texas at the Red Bluff Reservoir, winds through west Texas, and then empties into the Rio Grande in Val Verde County above the International Amistad Dam. Segment 2312- Red Bluff Reservoir, is designated for Contact Recreation and High Aquatic Use. Segment 2311- Upper Pecos River and Segment 2310- Lower Pecos River are designated for Contact Recreation and High Aquatic Use with Segment 2310 also being designated as a Public Water Supply. The Middle Rio Grande Basin includes the main stem of the Rio Grande from International Amistad Dam in Val Verde County (Segment 2304), International Falcon Dam (Segment 2303), and San Felipe Creek (Segment 2313). This portion of the basin includes parts of Val Verde, Edwards, Kinney, Maverick, Dimmit, Webb, Zapata, Jim Hogg, and Starr Counties in Texas. The designated uses for each of these segments are Contact Recreation, High Aquatic Life, and Public Water Supply. The study area in the Lower Rio Grande Basin includes the main stem of the Rio Grande from International Falcon Dam in Starr County to the Gulf of Mexico in Cameron County (Segments 2301 and 2302). This portion of the basin includes parts of Starr, Hidalgo, and Cameron Counties in Texas. Designated uses for Segment 2302, Rio Grande below International Falcon Reservoir, include Contact Recreation, High Aquatic Life, and Public Water Supply, while Segment 2301 is a tidal flat designated as Exceptional Aquatic Life and Contact Recreation.

USIBWC FY16-17 QAPP Page 25 Last revised on August 18, 2015 USIBWC CRP QAPP FY1617
Figure 2: A5.1. Map of Rio Grande Basin (Detailed station location information can be found on the maps in Appendix B and at http://cms.lcra.org)

USIBWC FY16-17 QAPP Page 26 Last revised on August 18, 2015 USIBWC CRP QAPP FY1617
From TCEQ’s Texas Surface Water Quality Standards, Title 30 Chapter 307 of the Texas Administrative Code effective March 6, 2014. Note: Currently awaiting EPA approval as March 6, 2014.
Table 1: A5.1 Designated Uses and Criteria for segments in the Rio Grande Basin

USIBWC FY16-17 QAPP Page 27 Last revised on August 18, 2015 USIBWC CRP QAPP FY1617
A6 Project/Task Description
See Appendix B for the project-related work plan tasks and schedule of deliverables for a description of work defined in this QAPP. Attach work plan tasks pertaining to this QAPP. See Appendix B for sampling design and monitoring pertaining to this QAPP. The program (USIBWC El Paso Headquarters) routinely collects surface water quality data from 67 routine (RT) sites and one biased to flow (BF) site throughout the region. Sampling includes collection of physicochemical, biological and hydrological data at varying frequencies. The program was established to collect, store and make available water quality data, which the participating agencies require to carry out their assigned functions. The USIBWC El Paso Headquarters collects this data and uses it for assessments of water quality under the Clean Rivers Program. The data is also widely used by state water quality managers, cities, counties, consultants, students and the general public. The USIBWC El Paso Headquarters and its partners collect routine samples from 67 designated stream, reservoir and bay stations to monitor for the attainment of uses and numerical criteria. Smaller non-classified water bodies are also monitored in response to perceived risk for pollution and/or to define water quality. A map showing the locations of all fixed monitoring locations are included in Appendix C. Under this QAPP, there are 67 monitoring sites collected by the USIBWC El Paso Headquarters and partners. TCEQ collected monitoring and monitoring sites are covered by a separate QAPP. (For a complete monitoring schedule of the Rio Grande Basin, see http://cms.lcra.org.) Basin-wide monitoring program contains sites collected by USIBWC El Paso Headquarters staff, partners as listed in A4, and TCEQ field office staff throughout the basin. Monitoring sites are evaluated for location, frequency of collection, and parameters annually at coordinated monitoring meetings located at four locations in the basin. For FY2016-2017, conventionals and bacteriological samples are routinely collected, and organics in sediment analyses have been dropped at most sites due to non- detects. Organics in sediment will only be analyzed at sites where organics have been detected in the previous two years. Metals and certain organics in water and sediment will still be collected at sites where they have historically shown levels of concern and where stakeholder interest requests continued collection. (For a more detailed description of the monitoring plan and how it is designed, please see Appendix B.) The USIBWC El Paso Headquarters requires a large number of in-kind partners to collect samples throughout the Rio Grande Basin. The partners consist of universities, municipalities, non-profit organizations, and other agencies, and they assist the USIBWC El Paso Headquarters by collecting field data and water samples at the designated sites in their areas and shipping the samples to their designated laboratory. All USIBWC El Paso Headquarters partners are required to be trained by the USIBWC El Paso Headquarters, and they must agree to follow the QAPP by signing this document or an adherence letter. The USIBWC El Paso Headquarters provides them the supplies needed to sample. Various partners, including the City of Laredo Health Department, BPUB, the USIBWC American Dam field office, and UTEP, collect only specified field and/or laboratory parameters due to issues such as remoteness of the site, shipping problems, accreditation, or to a standing Memorandum of Agreement/Understanding between the entity and the USIBWC. The El Paso Water

USIBWC FY16-17 QAPP Page 28 Last revised on August 18, 2015 USIBWC CRP QAPP FY1617
Utilities (EPWU), for example, has a long-standing agreement with the USIBWC that has the USIBWC American Dam personnel collect the water samples, and they analyze the data free of cost and voluntarily provide the data to the USIBWC. Only accredited data is reported to TCEQ, so the USIBWC El Paso Headquarters reports five parameters from the EPWU to TCEQ. BPUB voluntarily provides the data their staff must collect for the City, and so only their accredited parameters are reported and they do not collect field parameters. The City of Laredo Health Department has their sanitation inspectors collect the bacteria samples while doing their normal duties, but due to so many sites in the Laredo area and lack of time, they collect a condensed number of field parameters, use a much simpler YSI meter, and collect only bacteria. The City of Laredo Health Department lab analyzes the bacteria samples, and requests only bacteria testing supplies from the USIBWC El Paso Headquarters. For any partner reporting five parameters or less, the USIBWC El Paso Headquarters considers this as limited conventionals analysis.
Amendments to the QAPP
Revisions to the QAPP may be necessary to address incorrectly documented information or to reflect changes in project organization, tasks, schedules, objectives, and methods. Requests for amendments will be directed from the USIBWC Project Manager to the CRP Project Manager electronically. The USIBWC will submit a completed QAPP Amendment document, including a justification of the amendment, a table of changes, and all pages, sections or attachments affected by the amendment. Amendments are effective immediately upon approval by the USIBWC Program Manager, the USIBWC QAO, the CRP Project Manager, the CRP Lead QA Specialist, the CRP Project QA Specialist, and additional parties affected by the amendment. Amendments are not retroactive. No work shall be implemented without an approved QAPP or amendment prior to the start of work. Any activities under this contract that commence prior to the approval of the governing QA document constitute a deficiency and are subject to corrective action as described in section C1 of this QAPP. Any deviation or deficiency from this QAPP which occurs after the execution of this QAPP should be addressed through a Corrective Action Plan (CAP). An Amendment may be a component of a CAP to prevent future recurrence of a deviation. Amendments will be incorporated into the QAPP by way of attachment and distributed to personnel on the distribution list by the USIBWC Program Manager.
Special Project Appendices
Projects requiring QAPP appendices will be planned in consultation with the USIBWC and the TCEQ Project Manager and TCEQ technical staff. Appendices will be written in an abbreviated format and will reference the Basin QAPP where appropriate. Appendices will be approved by the USIBWC Program Manager, the USIBWC QAO, the Laboratory (as applicable), and the CRP Project Manager, the CRP Project QA Specialist, the CRP Lead QA Specialist and other TCEQ personnel, as appropriate. Copies of approved QAPP appendices will be distributed by the USIBWC to project participants before data collection activities commence.
A7 Quality Objectives and Criteria
The purpose of routine water quality monitoring is to collect surface water quality data that can be used to characterize water quality conditions, identify significant long-term water quality trends, support water quality standards development, support the permitting process, and conduct water quality assessments in accordance with TCEQ’s Guidance for Assessing and Reporting Surface Water

USIBWC FY16-17 QAPP Page 29 Last revised on August 18, 2015 USIBWC CRP QAPP FY1617
Quality in Texas, August 2012 or most recent version (https://www.tceq.texas.gov/assets/public/waterquality/swqm/assess/12twqi/2012_guidance.pdf). These water quality data, and data collected by other organizations (e.g., USGS, TCEQ, etc.), will be subsequently reconciled for use and assessed by the TCEQ. The measurement performance specifications to support the project purpose for a minimum data set are specified in Appendix A: Table A7.1 and in the text following. Ambient Water Reporting Limits (AWRLs) The AWRL establishes the reporting specification at or below which data for a parameter must be reported to be compared with freshwater screening criteria. The AWRLs specified in Appendix A Table A7.1 are the program-defined reporting specifications for each analyte and yield data acceptable for the TCEQ’s water quality assessment. A full listing of AWRLs can be found at http://www.tceq.state.tx.us/assets/public/waterquality/crp/QA/awrlmaster.pdf. The limit of quantitation (LOQ) is the minimum level, concentration, or quantity of a target variable (e.g., target analyte) that can be reported with a specified degree of confidence. Analytical results shall be reported down to the laboratory’s LOQ (i.e., the laboratory’s LOQ for a given parameter is its reporting limit). The following requirements must be met in order to report results to the CRP:
The laboratory’s LOQ for each analyte must be at or below the AWRL as a matter of routine practice
The laboratory must demonstrate its ability to quantitate at its LOQ for each analyte by running a continuing verification of the LOQ once a quarter.
Control limits for LOQ check samples are found in the associated methods.
Laboratory Measurement Quality Control Requirements and Acceptability Criteria are provided in Section B5 Precision Precision is the degree to which a set of observations or measurements of the same property, obtained under similar conditions, conform to themselves. It is a measure of agreement among replicate measurements of the same property, under prescribed similar conditions, and is an indication of random error. Laboratory precision is assessed by comparing replicate analyses of laboratory control samples (LCS) in the sample matrix (e.g. deionized water, sand, commercially available tissue) or sample/duplicate pairs in the case of bacterial analysis. Precision results are compared against measurement performance specifications and used during evaluation of analytical performance. Program-defined measurement performance specifications for precision are defined in Appendix A. Bias Bias is a statistical measurement of correctness and includes multiple components of systematic

USIBWC FY16-17 QAPP Page 30 Last revised on August 18, 2015 USIBWC CRP QAPP FY1617
error. A measurement is considered unbiased when the value reported does not differ from the true value. Bias is determined through the analysis of LCS and LOQ Check Samples prepared with verified and known amounts of all target analytes in the sample matrix (e.g. deionized water, sand, commercially available tissue) and by calculating percent recovery. Results are compared against measurement performance specifications and used during evaluation of analytical performance. Program-defined measurement performance specifications for bias are specified in Appendix A. Representativeness Site selection, the appropriate sampling regime, the sampling of all pertinent media according to TCEQ SOPs, and use of only approved analytical methods will assure that the measurement data represents the conditions at the site. Routine data collected under CRP for water quality assessment are considered to be spatially and temporally representative of routine water quality conditions. Water Quality data are collected on a routine frequency and are separated by approximately even time intervals. At a minimum, samples are collected over at least two seasons (to include inter-seasonal variation) and over two years (to include inter-year variation) and include some data collected during an index period (March 15- October 15). Although data may be collected during varying regimes of weather and flow, the data sets will not be biased toward unusual conditions of flow, runoff, or season. The goal for meeting total representation of the water body will be tempered by the potential funding for complete representativeness. Comparability Confidence in the comparability of routine data sets for this project and for water quality assessments is based on the commitment of project staff to use only approved sampling and analysis methods and QA/QC protocols in accordance with quality system requirements and as described in this QAPP and in TCEQ SOPs. Comparability is also guaranteed by reporting data in standard units, by using accepted rules for rounding figures, and by reporting data in a standard format as specified in the Data Management Plan Section B10. Completeness The completeness of the data is basically a relationship of how much of the data are available for use compared to the total potential data. Ideally, 100% of the data should be available. However, the possibility of unavailable data due to accidents, insufficient sample volume, broken or lost samples, etc. is to be expected. Therefore, it will be a general goal of the project(s) that 90% data completion is achieved.
A8 Special Training/Certification
Before new field personnel independently conduct field work, the USIBWC El Paso Headquarters Program Manager or USIBWC El Paso Headquarters QAO trains him/her in proper instrument calibration, field sampling techniques, and field analysis procedures. The QA officer (or Program Manager if QAO is not available) will document the successful field demonstration. The QA Officer (or Program Manager if QAO is not available) will retain documentation of training and the successful field demonstration in the employee’s personnel file (or other designated location, and will be available during monitoring systems audits. Field personnel may request refresher training sessions, or additional training if new personnel is acquired, and the USIBWC El Paso Headquarters will

USIBWC FY16-17 QAPP Page 31 Last revised on August 18, 2015 USIBWC CRP QAPP FY1617
accommodate their request. The requirements for Global Positioning System (GPS) certification are located in Section B10, Data Management. Contractors and subcontractors must ensure that laboratories analyzing samples under this QAPP meet the requirements contained in section The NELAC Institute (TNI) Volume 1 Module 2, Section 4.5.5 (concerning Subcontracting of Environmental Tests).
A9 Documents and Records
The documents and records that describe, specify, report, or certify activities are listed. The list below is limited to documents and records that may be requested for review during a monitoring systems audit. Add other types of project documents and records as appropriate.
USIBWC FY16-17 QAPP Page 32 Last revised on August 18, 2015 USIBWC CRP QAPP FY1617
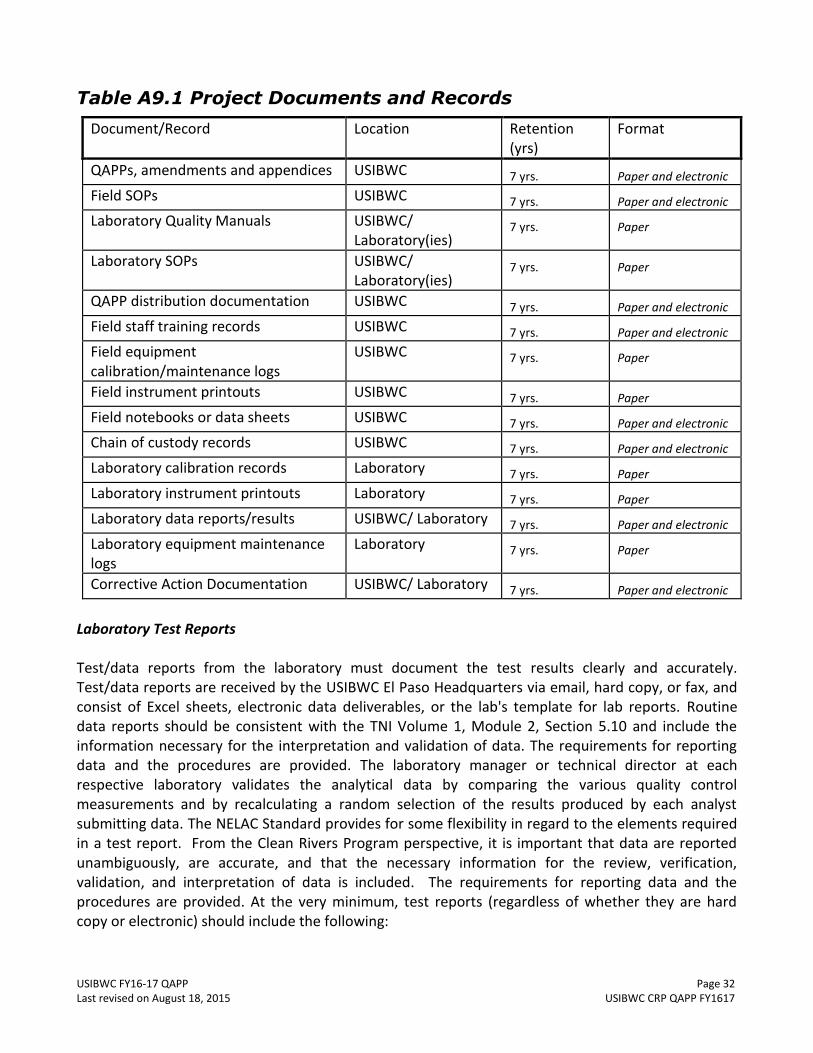
Table A9.1 Project Documents and Records
Document/Record Location Retention (yrs)
Format
QAPPs, amendments and appendices USIBWC 7 yrs.
Paper and electronic
Field SOPs USIBWC 7 yrs.
Paper and electronic
Laboratory Quality Manuals USIBWC/ Laboratory(ies)
7 yrs.
Paper
Laboratory SOPs USIBWC/ Laboratory(ies)
7 yrs.
Paper
QAPP distribution documentation USIBWC 7 yrs.
Paper and electronic
Field staff training records USIBWC 7 yrs.
Paper and electronic
Field equipment calibration/maintenance logs
USIBWC 7 yrs.
Paper
Field instrument printouts USIBWC 7 yrs.
Paper
Field notebooks or data sheets USIBWC 7 yrs.
Paper and electronic
Chain of custody records USIBWC 7 yrs.
Paper and electronic
Laboratory calibration records Laboratory 7 yrs.
Paper
Laboratory instrument printouts Laboratory 7 yrs.
Paper
Laboratory data reports/results USIBWC/ Laboratory 7 yrs.
Paper and electronic
Laboratory equipment maintenance logs
Laboratory 7 yrs.
Paper
Corrective Action Documentation USIBWC/ Laboratory 7 yrs.
Paper and electronic
Laboratory Test Reports Test/data reports from the laboratory must document the test results clearly and accurately. Test/data reports are received by the USIBWC El Paso Headquarters via email, hard copy, or fax, and consist of Excel sheets, electronic data deliverables, or the lab's template for lab reports. Routine data reports should be consistent with the TNI Volume 1, Module 2, Section 5.10 and include the information necessary for the interpretation and validation of data. The requirements for reporting data and the procedures are provided. The laboratory manager or technical director at each respective laboratory validates the analytical data by comparing the various quality control measurements and by recalculating a random selection of the results produced by each analyst submitting data. The NELAC Standard provides for some flexibility in regard to the elements required in a test report. From the Clean Rivers Program perspective, it is important that data are reported unambiguously, are accurate, and that the necessary information for the review, verification, validation, and interpretation of data is included. The requirements for reporting data and the procedures are provided. At the very minimum, test reports (regardless of whether they are hard copy or electronic) should include the following:

USIBWC FY16-17 QAPP Page 33 Last revised on August 18, 2015 USIBWC CRP QAPP FY1617
Parameter Code Parameter Name
Sample results Sample Depth
Units of measurement Sample matrix Dry weight or wet weight (as applicable) Station information
Collecting Entity Date and time of collection Dilution Factor
Date Analyzed Holding time for SM9223-B LOQ and LOD (formerly referred to as the reporting limit and the method detection limit, respectively), and qualification of results outside the working range (if applicable) Certification of NELAP compliance
Lab Method Prep Date/Time Electronic Data Data will be submitted electronically to the TCEQ in the Event/Result file format described in the most current version of the DMRG, which can be found at (http://www.tceq.state.tx.us/compliance/monitoring/water/quality/data/wdma/dmrg_index.html). A completed Data Review Checklist and Data Summary (see Appendix F) will be submitted with each data submittal.
B1 Sampling Process Design See Appendix B for sampling process design information and monitoring tables associated with data collected under this QAPP.
B2 Sampling Methods
Field Sampling Procedures
Field sampling will be conducted in accordance with the latest versions of the TCEQ Surface Water Quality Monitoring Procedures Volume 1: Physical and Chemical Monitoring Methods for Water, Sediment, and Tissue, 2012.(RG-415) and Volume 2: Methods for Collecting and Analyzing Biological Assemblage and Habitat Data, 2014 (RG-416), collectively referred to as “SWQM Procedures”. Updates to SWQM Procedures are posted to the Surface Water Quality Monitoring Procedures website (https://www.tceq.texas.gov/waterquality/monitoring/swqm_guides.html ), and shall be incorporated into the USIBWC’s procedures, QAPP, SOPs, etc., within 60 days of any final published update. Additional aspects outlined in Section B below reflect specific requirements for sampling under CRP and/or provide additional clarification.

USIBWC FY16-17 QAPP Page 34 Last revised on August 18, 2015 USIBWC CRP QAPP FY1617
Table 3: B2.1 Sample Storage, Preservation and Handling Requirements, A&B Environmental Services, Inc.
Routine Conventionals-in-Water Samples (8 containers: 3 unpreserved, 1 preserved with HNO3, 2 preserved with H2S04, 2
preserved with Na2S2O3,)
Parameters Containers Sample Volume (ml)
Preservation Maximum Holding Time
CONTAINER 1 HDPE 500 Cool to <6 C but not
frozen
TSS(00530)/VSS (00535) 200 Cool to <6 C but not frozen
7 days
Chloride (Cl) (00940) 50 Cool to <6 C but not frozen
28 days
Sulfate (SO4) (00945) 50 Cool to <6 C but not frozen
28 days
Fluoride (00951) 50 Cool to <6 C but not frozen
28 days
TDS(70300) 50 Cool to <6 C but not frozen
7 days
Bromide (71870) 50 Cool to <6 C but not frozen
28 days
Alkalinity (00410) 50 Cool to <6 C but not frozen
14 days
CONTAINER 2
HDPE 250 1-2 ml conc.HNO3 to pH <2 and cool to <6 C
but not frozen
Calcium (00916) 50 1-2 ml conc.HNO3 to pH <2 and cool to <6 C
but not frozen
6 months
Magnesium (00927) 50 1-2 ml conc.HNO3 to pH <2 and cool to <6 C but not frozen
6 months
Sodium (00929) 50 1-2 ml conc.HNO3 to pH <2 and cool to <6 C
but not frozen
6 months
Potassium (00937) 50 1-2 ml conc.HNO3 to pH <2 and cool to <6 C but not frozen
6 months
Hardness (00900) 50 1-2 ml conc.HNO3 to pH <2 and cool to <6 C
but not frozen
6 months
CONTAINER 3
HDPE 250 1-2 ml conc.H2SO4 to pH <2 and Cool <6 C but
not frozen
Ammonia (NH3) (00610) 50 1-2 ml conc.H2SO4 to pH <2 and Cool <6 C but
not frozen
28 days
Total Phosphorus (TPO4) (00665)
50 1-2 ml conc.H2SO4 to pH <2 and Cool <6 C but not frozen
28 days
Nitrate + Nitrite (00630) (NO3 + NO2)
50 1-2 ml conc.H2SO4 to pH <2 and Cool <6 C but
28 days

USIBWC FY16-17 QAPP Page 35 Last revised on August 18, 2015 USIBWC CRP QAPP FY1617
not frozen
CONTAINER 4
Chlorophyll a (32211)
glass amber 500 Cool to <6 C but not frozen, dark
Filter within 48 hours. Filters may be stored frozen up to 24 days
Pheophytin-a (32218)
glass amber 500 Cool to <6 C but not frozen, dark
Filter within 48 hours Filters may be stored frozen up to 28 days
CONTAINER 5 and 6
E. coli bacteria (31699) Sterilized plastic container
100 Cool <6 C but not frozen Sodium thiosulfate
8 hours *extended 30
hours
E. coli bacteria (31699) Sterilized plastic container
290 Cool <6 C but not frozen Sodium thiosulfate
8 hours *extended 30hours
CONTAINER 7
BOD (00310) HDPE 1000 Cool <6 C but not frozen 48 hours
CONTAINER 8
Total Organic Carbon (TOC) (00680)
H2SO4, cleaned plastic bottle
120 1.0 ml conc H2SO4 to pH <2 and Cool <6 C but
not frozen
28 days
Metals -In-Water
Parameters
Containers
Sample
Volume (ml)
Preservation
Maximum Holding
Time
CONTAINER 1
TOTAL
HNO3 cleaned plastic bottle
500 Pre-acidified container with 5 ml ultra-pure HNO3 to pH<2
180 days
CONTAINER 2 and 3
Total Mercury 2- 40-mL VOA vials 80 pre-cleaned, HCl-preserved
28 days
Metals in Sediment CONTAINER 1
1 pint glass jar with Teflon- lined lid
1000 grams
Metals
500 grams Cool <6 C but not frozen 180 days
CONTAINER 1
Total Mercury 500 grams Dark and Cool <6 C but not frozen
28 days
Organics in Water CONTAINER 1, 2, 3
BTEX 3- 40 ml VOA 120 Pre-acidified with 0.5 ml 14 days

USIBWC FY16-17 QAPP Page 36 Last revised on August 18, 2015 USIBWC CRP QAPP FY1617
HCl
CONTAINER 4 and 5
SVOCs glass bottle with teflon lined lid
2x1000 Pre-rinsed, Cool <6 C but not frozen
7 days
Organics in Sediment CONTAINER 1
1 pint glass jar with Teflon- lined lid
1000 grams Cool <6 C but not frozen
Pesticides 500 Cool <6 C but not frozen 14 days
SVOC’s 500 Cool <6 C but not frozen 14 days
*E.coli samples should always be processed as soon as possible and within 8 hours. When transport conditions necessitate delays in delivery, the holding time may be extended and samples must be processed as soon as possible and within 30 hours.
Collecting entity that uses this lab: USIBWC Amistad Dam FO, Falcon Dam FO, Presidio FO, Mercedes FO, BBNP, TPWD, City of Laredo Env. Services, UTB, Midland College, RGISC, UE, EP, USIBWC El Paso Headquarters
Table 4: B2.2 Sample Storage, Preservation and Handling Requirements,
City of Laredo Health Department Laboratory
E.Coli and Fecal Coliform Analysis- City of Laredo Health Department Laboratory (2 containers Preserved with Sodium Thiosulfate)
Parameters Containers Sample Volume (ml)
Preservation Maximum Holding Time
CONTAINER 1 E. coli, Colilert, IDEXX Method (31699)
Polystyrene 290 Cool <6 C but not frozen Sodium Thiosulfate
8 hrs
CONTAINER 2
Fecal Coliform (31616) Polystyrene 120 Cool <6 C but not frozen Sodium Thiosulfate
8 hrs
Collecting entity that uses this lab: City of Laredo Health Department
Table 5: B2.3 Sample Storage, Preservation and Handling Requirements, EPWU International Water Quality Laboratory
Routine Conventionals-in-Water Samples
Parameters Containers Sample Volume (ml)
Preservation Maximum Holding Time
CONTAINER 1
Turbidity (82079) HDPE 100 Cool <6 C but not frozen 48 hours
CONTAINER 2
BOD (00310) HDPE 1000 Cool <6 C but not frozen 48 hours
CONTAINER 3
E. coli bacteria (31699) Polystyrene 100 Cool <6 C but not frozen Sodium thiosulfate
8 hours
CONTAINER 4

USIBWC FY16-17 QAPP Page 37 Last revised on August 18, 2015 USIBWC CRP QAPP FY1617
Chlorophyll a (32211)
Sterilized plastic container
1X500 Cool to <6 C but not frozen, dark
Filter within 48 hours. Filters may be stored frozen up to 24 days
CONTAINER 5
Ammonia HDPE 500 H2SO4 to pH <2 28 Days
Collecting entity that uses this lab: USIBWC American Dam Field Office
Table 6: B2.4 Sample Storage, Preservation and Handling Requirements,
Brownsville PUB Laboratory Routine Conventionals-in-Water Samples
Parameters Containers Sample Volume (ml)
Preservation Maximum Holding Time
CONTAINER 1
TSS (00530) HDPE 2000 Cool <6 C but not frozen 7 days
TDS (70300) HDPE 250 Cool <6 C but not frozen 7 days
CONTAINER 2
Ammonia (NH3) (00610) HDPE 500 1-2 ml conc.H2SO4 to pH <2 and Cool <6 C but
not frozen
28 days
CONTAINER 3
BOD (00310) HDPE 2000 Cool <6 C but not frozen 48 hours
CONTAINER 4
E. coli bacteria (31699) Sterilized plastic container
290 Cool <6 C but not frozen Sodium thiosulfate
8 hours
CONTAINER 5
Enterococcus (31701) Sterilized plastic container
290 Cool <6 C but not frozen Sodium thiosulfate
8 hours
Collecting entity that uses this lab: BPUB, UTB for the bacteria samples only.

USIBWC FY16-17 QAPP Page 38 Last revised on August 18, 2015 USIBWC CRP QAPP FY1617
Sample Containers
Certificates from sample container manufacturers are maintained in a notebook by the USIBWC or by the laboratory. A&B laboratories uses 1L, 500 mL and 250 mL HDPE containers, 1L glass amber bottles, 100 mL and 290 mL sterilized plastic containers with 1% sodium thiosulfate tablets added, and 120 mL cleaned plastic bottles. For metals-in water, A&B uses 500 mL pre-acidified plastic bottles and 40 mL VOA vials. For metals in sediment, a 1 pint glass jar with a Teflon-lined lid is used. For organics in water, pre-acidified VOA vials and pre-rinsed glass bottles with Teflon-lined lids are used. For organics in sediment, 1 pint glass jars with Teflon-lined lids are used. The City of Laredo Health Department laboratory uses sterile, 120 mL polystyrene IDEXX bottles with 1% sodium thiosulfate tablets for their bacteria samples. The EPWU laboratory uses 1L and 100 mL HDPE containers for BOD and Turbidity, and sterilized, 250 mL plastic containers with 1% sodium thiosulfate for the bacteria samples. The BPUB laboratory uses 1L HDPE containers for TSS and BOD, 250 mL HDPE containers for TDS, 500 mL HDPE containers preserved with H2SO4 for Ammonia, and 120 mL IDEXX bottles with 1% sodium thiosulfate bottles for the bacteria analysis. The analyzing laboratory adds the appropriate preservative to the proper sample containers and provides them to the partners. A&B Environmental Services, Inc. provides sample containers for all CRP partners, with the exception of the City of Laredo Health Department Lab, EPWU, and the BPUB, which supply their own sample containers for their sampling.
Processes to Prevent Contamination
Procedures outlined in SWQM Procedures outline the necessary steps to prevent contamination of samples. These include: direct collection into sample containers, when possible; use of certified containers for organics; and clean sampling techniques for metals. Field QC samples (identified in Section B5) are collected to verify that contamination has not occurred.
Documentation of Field Sampling Activities
Field sampling activities are documented on field data sheets (or actual name of the documents used to record field data) as presented in Appendix D. Flow worksheets, aquatic life use monitoring checklists, habitat assessment forms, field biological assessment forms, and records of bacteriological analyses (if applicable) are part of the field data record. The following will be recorded for all visits: Station ID Sampling Date Location Sampling Depth Sampling Time Sample Collector’s name and signature

USIBWC FY16-17 QAPP Page 39 Last revised on August 18, 2015 USIBWC CRP QAPP FY1617
Values for all field parameters Notes containing detailed observational data not captured by field parameters, including; Water appearance Weather Biological activity Recreational activity Unusual odors Pertinent observations related to water quality or stream uses Watershed or instream activities Specific sample information Missing parameters
Recording Data
For the purposes of this section and subsequent sections, all field and laboratory personnel follow the basic rules for recording information as documented below:
Write legibly, in indelible ink
Changes are made by crossing out original entries with a single line strike-out, entering the changes, and initialing and dating the corrections.
Close-out incomplete pages with an initialed and dated diagonal line.
Sampling Method Requirements or Sampling Process Design Deficiencies, and Corrective Action
Examples of sampling method requirements or sample design deficiencies include but are not limited to such things as inadequate sample volume due to spillage or container leaks, failure to preserve samples appropriately, contamination of a sample bottle during collection, storage temperature and holding time exceedance, sampling at the wrong site, etc. Any deviations from the QAPP, SWQM Procedures, or appropriate sampling procedures may invalidate data, and require documented corrective action. Corrective action may include for samples to be discarded and re-collected. It is the responsibility of the USIBWC El Paso Headquarters Program Manager, in consultation with the USIBWC El Paso Headquarters QAO, to ensure that the actions and resolutions to the problems are documented and that records are maintained in accordance with this QAPP. In addition, these actions and resolutions will be conveyed to the CRP Project Manager both verbally and in writing in the project progress reports and by completion of a CAP. The definition of and process for handling deficiencies and corrective action are defined in Section C1.
B3 Sample Handling and Custody
Sample Tracking
Proper sample handling and custody procedures ensure the custody and integrity of samples beginning at the time of sampling and continuing through transport, sample receipt, preparation, and

USIBWC FY16-17 QAPP Page 40 Last revised on August 18, 2015 USIBWC CRP QAPP FY1617
analysis. A sample is in custody if it is in actual physical possession or in a secured area that is restricted to authorized personnel. The Chain of Custody (COC) form is a record that documents the possession of the samples from the time of collection to receipt in the laboratory. The following information concerning the sample is recorded on the COC form (See Appendix E). The following list of items matches the COC form in Appendix E. All COC forms to be used in this project are included in Appendix E for the TCEQ’s review. Date and time of collection Site identification Sample matrix Number of containers Preservative used Was the sample filtered Analyses required Name of collector Custody transfer signatures and dates and time of transfer Bill of lading, if applicable
Sample Labeling
Samples from the field are labeled on the container, or on a label; with an indelible marker. Label information includes: Site identification Date and time of collection Preservative added, if applicable Indication of field-filtration for metals, as applicable Sample type (i.e., analyses) to be performed
Sample Handling
Handling procedures for water and sediment samples are discussed in detail in the TCEQ SWQM Procedures. Proper sample handling is a joint effort of the sampling crew, the sample transporter, and laboratory staff. Sample integrity must be protected by preventing sample contamination after the sample is placed in a container. USIBWC field offices (all except American Dam), Rio Grande International Study Center, University of Texas at Brownsville, Midland College, Big Bend National Park, City of Laredo Environmental, El Paso Community College, Texas Parks and Wildlife Department, and the University of Texas at El Paso samples will collect and ship to A&B Environmental Services, Inc. BPUB analyzes their own samples. The City of Laredo health Department takes their samples to the City of Laredo Health department lab. American Dam takes their samples to the EPWU lab. Please refer to the Chain of Custody section below for more details. The details below are followed by all partners in delivery of water samples to any of the partner labs. Field Data Reporting Forms (See Appendix D) are required for reporting field data. The first form, “Field Data Reporting Form”, is used when collecting grab samples. This form includes DO,

USIBWC FY16-17 QAPP Page 41 Last revised on August 18, 2015 USIBWC CRP QAPP FY1617
temperature, pH, Specific conductance, Secchi disk, flow, flow severity, flow measurement method, stream width, stream depth, and days since significant precipitation (and turbidity for RGISC). A second form, “Field Data Reporting Form Sediment Samples,” is used for composite sampling of sediment samples. For all water or sediment samples collected, the COC Form(s) are submitted to the laboratory with the sample(s). A third field form, "Drought Field Data Reporting Form," is used during a prolonged drought periods where the water bodies are extremely low, pooled, or dry. Chain of Custody forms are submitted with all water and/or sediment chemistry samples, as well as with all bacteria samples. If both water and sediment samples are collected, separate COC for the water samples and sediment samples will be submitted. Routine water chemistry and metals in water analyses are requested on the same form. The receiving laboratory sample custodian will examine all arriving samples for proper documentation and preservation. Internal sample handling, custody, and storage procedures for laboratories are described in the laboratory quality assurance manual. It is assumed that samples in tape-sealed ice chests are secure whether being transported by staff vehicle, by common carrier, or by commercial package delivery. Samples will be put in the ice chest with enough ice to fill to the top, and enough ice in the chest to keep the samples cold until they reach the laboratory. This is especially important in the warm months of the year. COC will be placed in an envelope and taped to the top of the ice chest, or they may be sealed in a plastic bag and taped to the inside of the ice chest lid. Ice chests will then be sealed with tape before shipping.
Sample Tracking Procedure Deficiencies and Corrective Action
All deficiencies associated with COC procedures, as described in this QAPP, are immediately reported to the USIBWC Project Manager. These include such items as delays in transfer resulting in holding time violations; violations of sample preservation requirements; incomplete documentation, including signatures; possible tampering of samples; broken or spilled samples, etc. The USIBWC Project Manager in consultation with the USIBWC QAO will determine if the procedural violation may have compromised the validity of the resulting data. Any failures that have reasonable potential to compromise data validity will invalidate data and the sampling event should be repeated. The resolution of the situation will be reported to the TCEQ CRP Project Manager in the project progress report. CAPs will be prepared by the Lead Organization QAO and submitted to TCEQ CRP Project Manager along with project progress report. The definition of and process for handling deficiencies and corrective action are defined in Section C1.
B4 Analytical Methods
The analytical methods, associated matrices, and performing laboratories are listed in Appendix A. The authority for analysis methodologies under CRP is derived from the 30 Tex. Admin. Code ch. 307, in that data generally are generated for comparison to those standards and/or criteria. The Standards state “Procedures for laboratory analysis must be in accordance with the most recently published edition of the book entitled Standard Methods for the Examination of Water and Wastewater, the

USIBWC FY16-17 QAPP Page 42 Last revised on August 18, 2015 USIBWC CRP QAPP FY1617
TCEQ Surface Water Quality Monitoring Procedures as amended, 40 CFR 136, or other reliable procedures acceptable to the TCEQ, and in accordance with chapter 25 of this title.” Laboratories collecting data under this QAPP are compliant with the TNI Standards. Copies of laboratory QMs and SOPs are available for review by the TCEQ.
Standards Traceability
All standards used in the field and laboratory are traceable to certified reference materials. Standards preparation is fully documented and maintained in a standards log book. Each documentation includes information concerning the standard identification, starting materials, including concentration, amount used and lot number; date prepared, expiration date and preparer’s initials/signature. The reagent bottle is labeled in a way that will trace the reagent back to preparation.
Analytical Method Deficiencies and Corrective Actions
Deficiencies in field and laboratory measurement systems involve, but are not limited to such things as instrument malfunctions, failures in calibration, blank contamination, quality control samples outside QAPP defined limits, etc. In many cases, the field technician or lab analyst will be able to correct the problem. If the problem is resolvable by the field technician or lab analyst, then they will document the problem on the field data sheet or laboratory record and complete the analysis. If the problem is not resolvable, then it is conveyed to the USIBWC Laboratory Supervisor, who will make the determination and notify the USIBWC QAO. If the analytical system failure may compromise the sample results, the resulting data will not be reported to the TCEQ. The nature and disposition of the problem is reported on the data report which is sent to the USIBWC Manager. The Lead Organization Project Manager will include this information in the CAP and submit with the Progress Report which is sent to the TCEQ CRP Project Manager. The definition of and process for handling deficiencies and corrective action are defined in Section C1. The TCEQ has determined that analyses associated with the qualifier codes (e.g., “holding time exceedance”, “sample received unpreserved”, “estimated value”) may have unacceptable measurement uncertainty associated with them. This will immediately disqualify analyses from submittal to SWQMIS. Therefore, data with these types of problems should not be reported to the TCEQ. Additionally, any data collected or analyzed by means other than those stated in the QAPP, or data suspect for any reason should not be submitted for loading and storage in SWQMIS. However, when data is lost, its absence will be described in the data summary report submitted with the corresponding data set, and a corrective action plan (as described in section C1) may be necessary.
B5 Quality Control
Sampling Quality Control Requirements and Acceptability Criteria
The minimum field QC requirements, and program-specific laboratory QC requirements, are outlined in SWQM Procedures. Specific requirements are outlined below. Field QC sample results are submitted with the laboratory data report (see Section A9.).

USIBWC FY16-17 QAPP Page 43 Last revised on August 18, 2015 USIBWC CRP QAPP FY1617
Field blank Field blanks are required for total metals-in-water samples when collected without sample equipment (i.e., as grab samples). For other types of samples, they are optional. A field blank is prepared in the field by filling a clean container with pure deionized water and appropriate preservative, if any, for the specific sampling activity being undertaken. Field blanks are used to assess contamination from field sources, such as airborne materials, containers, or preservatives. The frequency requirement for field blanks for total metals-in-water samples is specified in the SWQM Procedures. The analysis of field blanks should yield values lower than the LOQ. When target analyte concentrations are high, blank values should be lower than 5% of the lowest value of the batch. The USIBWC El Paso Headquarters will run one field blank per batch of samples, per partner (i.e. every partner collecting total metals- in water will run collect one blank per sampling event. A sampling event is classified as any number of sites visited in one day by a partner, where one QC will be done). Field blanks are associated with batches of field samples. In the event of a field blank failure for one or more target analytes, all applicable data associated with the field batch may need to be qualified as not meeting project QC requirements, and these qualified data will not be reported to the TCEQ. These data include all samples collected on that day during that sample run and should not be confused with the laboratory analytical batch. Trip blank Trip blanks are required for volatile organic analyses (VOA) only. VOA trip blanks are samples prepared in the laboratory with laboratory pure water and preserved as required. A trip blank is submitted with each ice chest of VOA samples submitted to the laboratory. They are transported to the sampling site, handled like an environmental sample, and returned to the laboratory for analysis. Trip blanks are not opened in the field. Their purpose is to check contamination of the sample through leaching of the septum. The analysis of trip blank should yield values less than the LOQ. When target analyte concentrations are very high, blank values should be less than 5% of the lowest value of the batch, or corrective action will be implemented.
Laboratory Measurement Quality Control Requirements and Acceptability Criteria
Batch A batch is defined as environmental samples that are prepared and/or analyzed together with the same process and personnel, using the same lot(s) of reagents. A preparation batch is composed of one to 20 environmental samples of the same NELAP-defined matrix, meeting the above mentioned criteria and with a maximum time between the start of processing of the first and last sample in the batch to be 25 hours. An analytical batch is composed of prepared environmental samples (extract, digestates, or concentrates) which are analyzed together as a group. An analytical batch can include prepared samples originating from various environmental matrices and can exceed 20 samples. Method Specific QC requirements QC samples, other than those specified later this section, are run (e.g., sample duplicates, surrogates,

USIBWC FY16-17 QAPP Page 44 Last revised on August 18, 2015 USIBWC CRP QAPP FY1617
internal standards, continuing calibration samples, interference check samples, positive control, negative control, and media blank) as specified in the methods and in SWQM Procedures. The requirements for these samples, their acceptance criteria or instructions for establishing criteria, and corrective actions are method-specific. Detailed laboratory QC requirements and corrective action procedures are contained within the individual laboratory quality manuals (QMs). The minimum requirements that all participants abide by are stated below. Comparison Counting For routine bacteriological samples, repeat counts on one or more positive samples are required, at least monthly. If possible, compare counts with an analyst who also performs the analysis. Replicate counts by the same analyst should agree within 5 percent, and those between analysts should agree within 10 percent. Record the results. Limit of Quantitation (LOQ) The laboratory will analyze a calibration standard (if applicable) at the LOQ published in Appendix A, Table A7, on each day calibrations are performed. In addition, a continuing verification of the LOQ will be analyzed once a quarter. Calibrations including the standard at the LOQ listed in Appendix A 7.1 will meet the calibration requirements of the analytical method or corrective action will be implemented. LOQ Sediment and Tissue Samples – When considering LOQs for solid samples and how they apply to results, two aspects of the analysis are considered: (1) the LOQ of the sample, based on the real-world in which moisture content and interferences affect the result and (2) the LOQ in the QAPP which is a value less than or equal to the AWRL based on an idealized sample with zero % moisture. The LOQ for a solid sample is based on the lowest non-zero calibration standard (as are those for water samples), the moisture content of the solid sample, and any sample concentration or dilution factors resulting from sample preparation or clean-up. To establish solid-phase LOQs to be listed in Appendix A Table A7.1 of the QAPP, the laboratory will adjust the concentration of the lowest non-zero calibration standard for the amount of sample extracted, the final extract volume, and moisture content (assumed to be zero % moisture). Each calculated LOQ will be less than or equal to the AWRL on the dry-weight basis to satisfy the AWRL requirement for sediment and tissue analyses. When data are reviewed for consistency with the QAPP, they are evaluated based on this requirement. Results may not appear to meet the AWRL requirement due to high moisture content, high concentrations of non-target analytes necessitating sample dilution, etc. These sample results will be submitted to the TCEQ with an explanation on the data summary as to why results do not appear to meet the AWRL requirement. LOQ Check Sample An LOQ check sample consists of a sample matrix (e.g., deionized water, sand, commercially available tissue) free from the analytes of interest spiked with verified known amounts of analytes or a material containing known and verified amounts of analytes. It is used to establish intra-laboratory

USIBWC FY16-17 QAPP Page 45 Last revised on August 18, 2015 USIBWC CRP QAPP FY1617
bias to assess the performance of the measurement system at the lower limits of analysis. The LOQ check sample is spiked into the sample matrix at a level less than or near the LOQ published in Appendix A, Table A7, for each analyte for each analytical batch of CRP samples run. If it is determined that samples have exceeded the high range of the calibration curve, samples should be diluted or run on another curve. For samples run on batches with calibration curves that do not include the LOQ published in Appendix A, Table A7, a check sample will be run at the low end of the calibration curve. The LOQ check sample is carried through the complete preparation and analytical process. LOQ Check Samples are run at a rate of one per analytical batch. The percent recovery of the LOQ check sample is calculated using the following equation in which %R is percent recovery, SR is the sample result, and SA is the reference concentration for the check sample:
%𝑅 = 𝑆𝑅
𝑆𝐴⁄ × 100
Measurement performance specifications are used to determine the acceptability of LOQ Check Sample analyses as specified in Appendix A Table A7.1. Laboratory Control Sample (LCS) An LCS consists of a sample matrix (e.g., deionized water, sand, commercially available tissue) free from the analytes of interest spiked with verified known amounts of analytes or a material containing known and verified amounts of analytes. It is used to establish intra-laboratory bias to assess the performance of the measurement system. The LCS is spiked into the sample matrix at a level less than or near the midpoint of the calibration for each analyte. In cases of test methods with very long lists of analytes, LCSs are prepared with all the target analytes and not just a representative number, except in cases of organic analytes with multipeak responses. The LCS is carried through the complete preparation and analytical process. LCSs are run at a rate of one per preparation batch. Results of LCSs are calculated by percent recovery (%R), which is defined as 100 times the measured concentration, divided by the true concentration of the spiked sample. The following formula is used to calculate percent recovery, where %R is percent recovery; SR is the measured result; and SA is the true result:
%𝑅 = 𝑆𝑅
𝑆𝐴⁄ × 100
Measurement performance specifications are used to determine the acceptability of LCS analyses as specified in Appendix A Table A7.1.
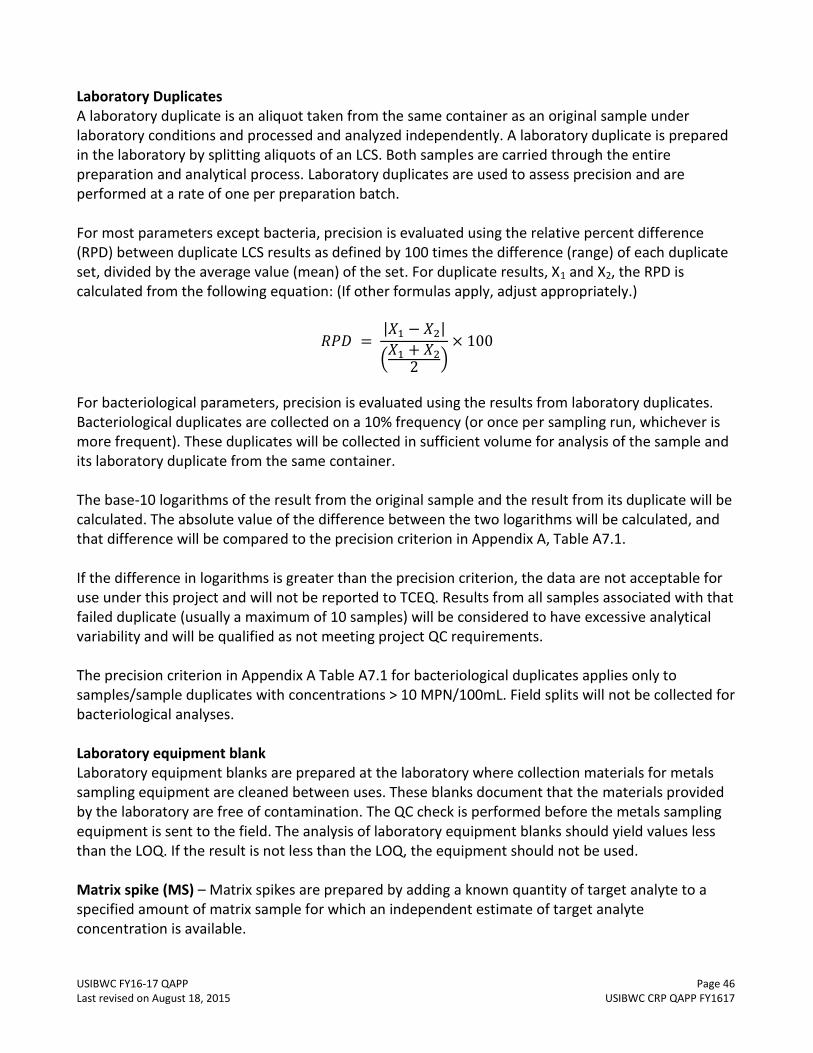
USIBWC FY16-17 QAPP Page 46 Last revised on August 18, 2015 USIBWC CRP QAPP FY1617
Laboratory Duplicates A laboratory duplicate is an aliquot taken from the same container as an original sample under laboratory conditions and processed and analyzed independently. A laboratory duplicate is prepared in the laboratory by splitting aliquots of an LCS. Both samples are carried through the entire preparation and analytical process. Laboratory duplicates are used to assess precision and are performed at a rate of one per preparation batch. For most parameters except bacteria, precision is evaluated using the relative percent difference (RPD) between duplicate LCS results as defined by 100 times the difference (range) of each duplicate set, divided by the average value (mean) of the set. For duplicate results, X1 and X2, the RPD is calculated from the following equation: (If other formulas apply, adjust appropriately.)
𝑅𝑃𝐷 = |𝑋1 − 𝑋2|
(𝑋1 + 𝑋2
2)
× 100
For bacteriological parameters, precision is evaluated using the results from laboratory duplicates. Bacteriological duplicates are collected on a 10% frequency (or once per sampling run, whichever is more frequent). These duplicates will be collected in sufficient volume for analysis of the sample and its laboratory duplicate from the same container. The base-10 logarithms of the result from the original sample and the result from its duplicate will be calculated. The absolute value of the difference between the two logarithms will be calculated, and that difference will be compared to the precision criterion in Appendix A, Table A7.1. If the difference in logarithms is greater than the precision criterion, the data are not acceptable for use under this project and will not be reported to TCEQ. Results from all samples associated with that failed duplicate (usually a maximum of 10 samples) will be considered to have excessive analytical variability and will be qualified as not meeting project QC requirements. The precision criterion in Appendix A Table A7.1 for bacteriological duplicates applies only to samples/sample duplicates with concentrations > 10 MPN/100mL. Field splits will not be collected for bacteriological analyses. Laboratory equipment blank Laboratory equipment blanks are prepared at the laboratory where collection materials for metals sampling equipment are cleaned between uses. These blanks document that the materials provided by the laboratory are free of contamination. The QC check is performed before the metals sampling equipment is sent to the field. The analysis of laboratory equipment blanks should yield values less than the LOQ. If the result is not less than the LOQ, the equipment should not be used. Matrix spike (MS) – Matrix spikes are prepared by adding a known quantity of target analyte to a specified amount of matrix sample for which an independent estimate of target analyte concentration is available.

USIBWC FY16-17 QAPP Page 47 Last revised on August 18, 2015 USIBWC CRP QAPP FY1617
Matrix spikes indicate the effect of the sample on the precision and accuracy of the results generated using the selected method. The frequency of matrix spikes is specified by the analytical method, or a minimum of one per preparation batch, whichever is greater. To the extent possible, matrix spikes prepared and analyzed over the course of the project should be performed on samples from different sites. The components to be spiked shall be as specified by the mandated analytical method. The results from matrix spikes are primarily designed to assess the validity of analytical results in a given matrix, and are expressed as percent recovery (%R). The percent recovery of the matrix spike is calculated using the following equation, where %R is percent recovery, SSR is the concentration measured in the matrix spike, SR is the concentration in the parent sample, and SA is the concentration of analyte that was added:
%𝑅 = 𝑆𝑆𝑅 − 𝑆𝑅
𝑆𝐴× 100
Matrix spike recoveries are compared to the acceptance criteria published in the mandated test method. If the matrix spike results are outside established criteria, the data for the analyte that failed in the parent sample is not acceptable for use under this project and will not be reported to TCEQ. The result from the parent sample associated with that failed matrix spike will be considered to have excessive analytical variability and will be qualified by the laboratory as not meeting project QC requirements. Depending on the similarities in composition of the samples in the batch, the USIBWC El Paso Headquarters may consider excluding all of the results in the batch related to the analyte that failed recovery. Method blank A method blank is a sample of matrix similar to the batch of associated samples (when available) that is free from the analytes of interest and is processed simultaneously with and under the same conditions as the samples through all steps of the analytical procedures, and in which no target analytes or interferences are present at concentrations that impact the analytical results for sample analyses. The method blanks are performed at a rate of once per preparation batch. The method blank is used to document contamination from the analytical process. The analysis of method blanks should yield values less than the LOQ. For very high-level analyses, the blank value should be less than 5% of the lowest value of the batch, or corrective action will be implemented. Samples associated with a contaminated blank shall be evaluated as to the best corrective action for the samples (e.g. reprocessing, data qualifying codes). In all cases the corrective action must be documented. The method blank shall be analyzed at a minimum of one per preparation batch. In those instances for which no separate preparation method is used (e.g., VOA) the batch shall be defined as environmental samples that are analyzed together with the same method and personnel, using the same lots of reagents, not to exceed the analysis of 20 environmental samples.
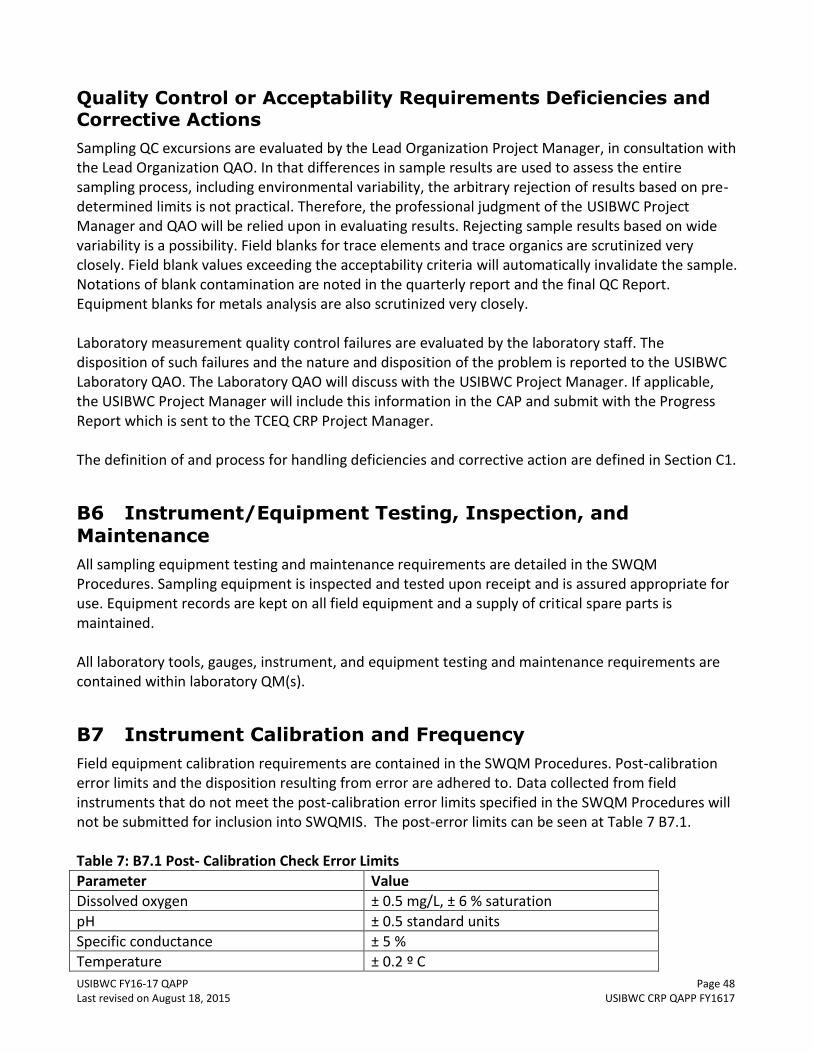
USIBWC FY16-17 QAPP Page 48 Last revised on August 18, 2015 USIBWC CRP QAPP FY1617
Quality Control or Acceptability Requirements Deficiencies and Corrective Actions
Sampling QC excursions are evaluated by the Lead Organization Project Manager, in consultation with the Lead Organization QAO. In that differences in sample results are used to assess the entire sampling process, including environmental variability, the arbitrary rejection of results based on pre-determined limits is not practical. Therefore, the professional judgment of the USIBWC Project Manager and QAO will be relied upon in evaluating results. Rejecting sample results based on wide variability is a possibility. Field blanks for trace elements and trace organics are scrutinized very closely. Field blank values exceeding the acceptability criteria will automatically invalidate the sample. Notations of blank contamination are noted in the quarterly report and the final QC Report. Equipment blanks for metals analysis are also scrutinized very closely. Laboratory measurement quality control failures are evaluated by the laboratory staff. The disposition of such failures and the nature and disposition of the problem is reported to the USIBWC Laboratory QAO. The Laboratory QAO will discuss with the USIBWC Project Manager. If applicable, the USIBWC Project Manager will include this information in the CAP and submit with the Progress Report which is sent to the TCEQ CRP Project Manager. The definition of and process for handling deficiencies and corrective action are defined in Section C1.
B6 Instrument/Equipment Testing, Inspection, and Maintenance
All sampling equipment testing and maintenance requirements are detailed in the SWQM Procedures. Sampling equipment is inspected and tested upon receipt and is assured appropriate for use. Equipment records are kept on all field equipment and a supply of critical spare parts is maintained. All laboratory tools, gauges, instrument, and equipment testing and maintenance requirements are contained within laboratory QM(s).
B7 Instrument Calibration and Frequency
Field equipment calibration requirements are contained in the SWQM Procedures. Post-calibration error limits and the disposition resulting from error are adhered to. Data collected from field instruments that do not meet the post-calibration error limits specified in the SWQM Procedures will not be submitted for inclusion into SWQMIS. The post-error limits can be seen at Table 7 B7.1. Table 7: B7.1 Post- Calibration Check Error Limits
Parameter Value
Dissolved oxygen ± 0.5 mg/L, ± 6 % saturation
pH ± 0.5 standard units
Specific conductance ± 5 %
Temperature ± 0.2 º C

USIBWC FY16-17 QAPP Page 49 Last revised on August 18, 2015 USIBWC CRP QAPP FY1617
Detailed laboratory calibrations are contained within the QM(s).
B8 Inspection/Acceptance of Supplies and Consumables
No special requirements for acceptance are specified for field sampling supplies and consumables. Reference to the laboratory QM may be appropriate for laboratory-related supplies and consumables.
B9 Acquired Data
Non-directly measured data, secondary data, or acquired data involves the use of data collected under another project, and collected with a different intended use than this project. The acquired data still meets the quality requirements of this project, and is defined below. The following data source(s) will be used for this project: USGS and USIBWC gage station data will be used throughout this project to aid in determining gage height and flow. Rigorous QA checks are completed on gage data by the USGS and USIBWC and the data are approved by the USGS and USIBWC and permanently stored at the USGS and USIBWC. This data will be submitted to the TCEQ under parameter code 00061 Flow, Instantaneous or parameter code 74069 Flow Estimate depending on the proximity of the monitoring station to the USGS gage station. Reservoir stage data are collected every day from the Unites States Geological Survey (USGS), International Boundary and Water Commission (IBWC), and the Unites States Army Corps of Engineers (USACE) websites. These data are preliminary and subject to revision. The Texas Water Development Board (TWDB) derives reservoir storage (in acre-feet) from these stage data (elevation in feet above mean sea level), by using the latest rating curve datasets available. These data are published at the TWDB website at http://waterdatafortexas.org/reservoirs/statewide. The web application uses real time gaged observations 7 AM reading each day (or closest reading available) from 119 major reservoirs to approximate daily storage for each reservoir, as well as daily total storage for water planning regions, river basins and the state of Texas. These instantaneous data are updated to mean daily data for all previous days. These data will be submitted to the TCEQ under parameter code 00052 Reservoir Stage and parameter code 00053 Reservoir Percent Full.
B10 Data Management
Data Management Process
Data will be managed in accordance with the DMRG and applicable USIBWC information resource management policies.

USIBWC FY16-17 QAPP Page 50 Last revised on August 18, 2015 USIBWC CRP QAPP FY1617
Quantitative measurements are taken in the field by personnel using multi-parameter instruments. Qualitative measurements, which include observational data (i.e. weather conditions), are also taken in the field. Samples for laboratory analysis are also collected. The field investigator has prime responsibility to assure that all pertinent information is recorded, is recorded correctly, and is recorded in the proper units. Rio Grande Basin Monitoring Program Partners (all collecting entities, and USIBWC personnel) will check all COC forms prior to shipping the sample to the laboratory to verify that all the pertinent required information has been included. All laboratories will ensure that the COC forms are properly filled out, and that all samples received are acceptable. All hand-entered data must be recorded legibly and with special care to maintain the decimal in its proper location. Field measurements and sample collection are performed according to procedures recorded in Section B3. Field data and laboratory results will be reported on the required data forms and submitted to the USIBWC El Paso Headquarters by the RGBMP partners or labs. This requires that all collecting entities submit their field forms to the USIBWC El Paso Headquarters staff, and all laboratories submit their laboratory data to the USIBWC El Paso Headquarters staff. The data from the forms is reviewed and checked for outliers by the USIBWC El Paso Headquarters Program Manager and QAO. This includes verifying the data against historical data for the site, as well as using the minimum and maximum limits for parameters set up in the Access software database that the USIBWC El Paso Headquarters uses. Maximum, minimum and outlier data designations are based off of historical data for that station. The data is entered into the database by the USIBWC El Paso Headquarters Program Manager and QAO using Access software. The Access software database, which was designed specifically for the USIBWC El Paso Headquarters, is then used to query the data for outliers and incorrect data format. The database will contain only data outlined in Table A7 collected or acquired by USIBWC and partners participating under this QAPP. Data is verified using the TCEQ SWQMIS data loader. Water quality monitoring data files are then submitted to the TCEQ CRP Project Manager. Both the TCEQ Project Manager and TCEQ Data Manager perform quality control checks on the data. The TCEQ Project Manager then approves the data and the TCEQ Data Manager loads the data into the SWQMIS database. RGBMP water quality monitoring data that has been added to the USIBWC El Paso Headquarters database undergoes the following quality control checks: 1. Each set of data forms received by USIBWC El Paso Headquarters will be reviewed for the
following: a. valid and complete station number, date, and time; b. comparison of station number to station description to ensure they both represent the
same sampling point; and c. that each value is represented by a valid parameter code.
2. The Data Review Checklist will be utilized to ensure that potential areas for error are addressed and reviewed prior to submission of data.
Even when accepted protocols are followed in collecting and analyzing environmental samples, a potential for loss of data quality arises in the manipulation and reporting of the data. Procedures that may lower the chance for number-handling errors are discussed in a subsequent section. Data

USIBWC FY16-17 QAPP Page 51 Last revised on August 18, 2015 USIBWC CRP QAPP FY1617
exchange and management among USIBWC and RGBMP partners follow the lines of communication established in the organizational chart in Figure 1. Data Dictionary Terminology and field descriptions are included in the DMRG, or most recent version. A table outlining the entities that will be used when submitting data under this QAPP is included below for the purpose of verifying which entity codes are included in this QAPP. Table 8: B10.1 Submitting and Collecting Entity Codes
Name of Monitoring Entity Tag Prefix Submitting Entity
Collecting Entity
USIBWC American Dam Field Office BD IB IB
USIBWC Amistad Dam Field Office BA IB IB
USIBWC Falcon Dam Field Office BF IB IB
USIBWC Presidio Office BP IB IB
USIBWC Mercedes Field Office BM IB IB
USIBWC El Paso Headquarters BH IB IB
Univ. of TX at Brownsville B IB UB
Rio Grande International Study Center B IB RN
Big Bend National Park B IB BB
City of Laredo Health Serv. B IB LA
City of Laredo Env. Services B IB LE
Univ. of TX at El Paso B IB UE
Brownsville PUB B IB BO
El Paso Community College B IB EP
TX Parks and Wildlife Dept. B IB PW
Midland College B IB MC
Data Errors and Loss
When the USIBWC El Paso Headquarters receives laboratory data, the data is checked by the USIBWC El Paso Headquarters Program Manager to ensure all contract requirements were met by the laboratory for the analysis. Upon receipt of field and laboratory data, the USIBWC El Paso Headquarters QAO ensures that no outliers or errors in the data are present. If any are observed, the USIBWC El Paso Headquarters QAO either corrects the error if possible or verifies the error with the source. The data is then given to the USIBWC El Paso Headquarters Program Manager or QAO, whoever will be entering that dataset, who also checks the data for any errors. If any errors are
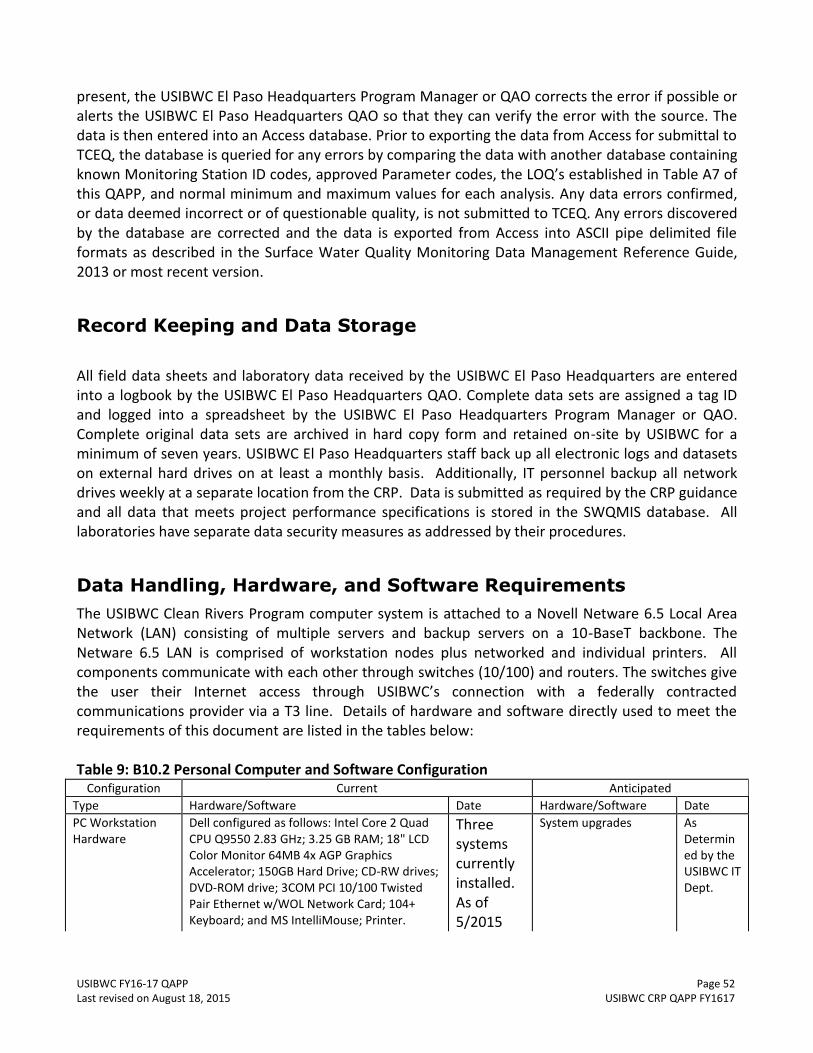
USIBWC FY16-17 QAPP Page 52 Last revised on August 18, 2015 USIBWC CRP QAPP FY1617
present, the USIBWC El Paso Headquarters Program Manager or QAO corrects the error if possible or alerts the USIBWC El Paso Headquarters QAO so that they can verify the error with the source. The data is then entered into an Access database. Prior to exporting the data from Access for submittal to TCEQ, the database is queried for any errors by comparing the data with another database containing known Monitoring Station ID codes, approved Parameter codes, the LOQ’s established in Table A7 of this QAPP, and normal minimum and maximum values for each analysis. Any data errors confirmed, or data deemed incorrect or of questionable quality, is not submitted to TCEQ. Any errors discovered by the database are corrected and the data is exported from Access into ASCII pipe delimited file formats as described in the Surface Water Quality Monitoring Data Management Reference Guide, 2013 or most recent version.
Record Keeping and Data Storage
All field data sheets and laboratory data received by the USIBWC El Paso Headquarters are entered into a logbook by the USIBWC El Paso Headquarters QAO. Complete data sets are assigned a tag ID and logged into a spreadsheet by the USIBWC El Paso Headquarters Program Manager or QAO. Complete original data sets are archived in hard copy form and retained on-site by USIBWC for a minimum of seven years. USIBWC El Paso Headquarters staff back up all electronic logs and datasets on external hard drives on at least a monthly basis. Additionally, IT personnel backup all network drives weekly at a separate location from the CRP. Data is submitted as required by the CRP guidance and all data that meets project performance specifications is stored in the SWQMIS database. All laboratories have separate data security measures as addressed by their procedures.
Data Handling, Hardware, and Software Requirements
The USIBWC Clean Rivers Program computer system is attached to a Novell Netware 6.5 Local Area Network (LAN) consisting of multiple servers and backup servers on a 10-BaseT backbone. The Netware 6.5 LAN is comprised of workstation nodes plus networked and individual printers. All components communicate with each other through switches (10/100) and routers. The switches give the user their Internet access through USIBWC’s connection with a federally contracted communications provider via a T3 line. Details of hardware and software directly used to meet the requirements of this document are listed in the tables below: Table 9: B10.2 Personal Computer and Software Configuration
Configuration Current Anticipated
Type Hardware/Software Date Hardware/Software Date
PC Workstation Hardware
Dell configured as follows: Intel Core 2 Quad CPU Q9550 2.83 GHz; 3.25 GB RAM; 18" LCD Color Monitor 64MB 4x AGP Graphics Accelerator; 150GB Hard Drive; CD-RW drives; DVD-ROM drive; 3COM PCI 10/100 Twisted Pair Ethernet w/WOL Network Card; 104+ Keyboard; and MS IntelliMouse; Printer.
Three systems currently installed. As of 5/2015
System upgrades As Determined by the USIBWC IT Dept.

USIBWC FY16-17 QAPP Page 53 Last revised on August 18, 2015 USIBWC CRP QAPP FY1617
PC Software MS Windows XP 2002 Professional; Novell Netware 8 Groupwise; MS Office 2007 and 2010
As of 9/23/2013
Software upgrades As Determined by the USIBWC IT Dept.
Portable PC Hardware
Portable PC: Dell Precision M2400; Intel Core 2Duo CPU P8600 2.4 GHz, 3.48 GB RAM; 300 GB Hard Drive, CD and DVD-RW drive; Lithium Ion battery with battery gauge and AC pack; Full size 88 key keyboard; and EZ Pad Plus Pointing device
As of 5/2015
Hardware upgrades As Determined by the USIBWC IT Dept.
llPortable PC Software
Adobe Creative Suite 4 Master MS Office 2007 and 2010
As of 5/2015
Software upgrades As Determined by the USIBWC IT Dept.
Data Backup System
Each workstation contains a 16x rewritable drive.
As of 5/2015
As Determined by the USIBWC IT Dept.
Table 10: B10.3 GIS Workstation Hardware and Software Configuration
Configuration Current Anticipated
Type Hardware/Software Date Hardware/Software Date
PC Workstation Hardware
Dell configured as follows: Intel Core 2 Quad CPU Q9550 2.83 GHz; 3.25 GB RAM; 18" LCD Color Monitor 64MB 4x AGP Graphics Accelerator; 150GB Hard Drive; CD-RW drives; DVD-ROM drive; 3COM PCI 10/100 Twisted Pair Ethernet w/WOL Network Card; 104+ Keyboard; and MS IntelliMouse; Printer.
Three systems currently installed. As of 5/2015
System upgrades As Determined by the USIBWC IT Dept.
PC Software MS Windows XP 2002 Professional; Novell Netware 8 Groupwise; MS Office 2007 and 2010
As of 5/2015
Software upgrades As Determined by the USIBWC IT Dept.
Portable PC Hardware
Portable PC: Dell Precision M2400; Intel Core 2Duo CPU P8600 2.4 GHz, 3.48 GB RAM; 300 GB Hard Drive, CD and DVD-RW drive; Lithium Ion battery with battery gauge and AC pack; Full size 88 key keyboard; and EZ Pad Plus Pointing device
As of 5/2015
Hardware upgrades As Determined by the USIBWC IT Dept.
llPortable PC Software
Adobe Creative Suite 4 Master MS Office 2007 and 2010
As of 5/2015
Software upgrades As Determined by the USIBWC IT Dept.
Data Backup System
Each workstation contains a 16x rewritable drive.
As of 5/2015
As Determined by the USIBWC IT Dept.

USIBWC FY16-17 QAPP Page 54 Last revised on August 18, 2015 USIBWC CRP QAPP FY1617
Information Resource Management Requirements
Data will be managed in accordance with the DMRG, and applicable USIBWC information resource management policies. GPS equipment may be used as a component of the information required by the Station Location (SLOC) request process for creating the certified positional data that will ultimately be entered into SWQMIS database. Positional data obtained by CRP grantees using a GPS will follow the TCEQ’s OPP 8.11 and 8.12 policy regarding the collection and management of positional data. All positional data entered into SWQMIS will be collected by a GPS certified individual with an agency approved GPS device to ensure that the agency receives reliable and accurate positional data. Certification can be obtained in any of three ways: completing a TCEQ training class, completing a suitable training class offered by an outside vendor, or by providing documentation of sufficient GPS expertise and experience. Contractors must agree to adhere to relevant TCEQ policies when entering GPS-collected data. In lieu of entering certified GPS coordinates, positional data may be acquired with a GPS and verified with photo interpolation using a certified source, such as Google Earth or Google Maps. The verified coordinates and map interface can then be used to develop a new SLOC.

USIBWC FY16-17 QAPP Page 55 Last revised on August 18, 2015 USIBWC CRP QAPP FY1617
C1 Assessments and Response Actions
The following table presents the types of assessments and response actions for data collection activities applicable to the QAPP.
Table C1.1 Assessments and Response Requirements
Assessment Activity
Approximate Schedule
Responsible Party
Scope Response Requirements
Status Monitoring Oversight, etc.
Continuous USIBWC Monitoring of the project status and records to ensure requirements are being fulfilled
Report to TCEQ in Quarterly Report
Monitoring Systems Audit of Basin Planning Agency
Dates to be determined by TCEQ CRP
TCEQ Field sampling, handling and measurement; facility review; and data management as they relate to CRP
30 days to respond in writing to the TCEQ to address corrective actions
Monitoring Systems Audit of Program Subparticipants
Dates to be determined by the USIBWC (at least 4 in-person audits per year)
USIBWC
Field sampling, handling and measurement; facility review; and data management as they relate to CRP
30 days to respond in writing to the USIBWC. PA will report problems to TCEQ in Progress Report.
Laboratory Inspection
Dates to be determined by TCEQ
TCEQ Laboratory Inspector
Analytical and quality control procedures employed at the laboratory and the contract laboratory
30 days to respond in writing to the TCEQ to address corrective actions
Desk Audit/Data Traceability Review
Dates to be determined by the USIBWC (every biennium an on-site visit is not conducted)
USIBWC
Review of all calibration documentation, field sheet and chain of custody records. Data will be checked by selecting a date range and checking the data against USIBWC El Paso Headquarters records.
30 days to respond in writing to the USIBWC. PA will report problems to TCEQ in Progress Report.
*The USIBWC CRP and the TCEQ Project Manager discussed adjusting the audits for the next contract years due to budgetary constraints. The new contract allows for the QAPP to specify that the USIBWC CRP will conduct a minimum of 4 in-person, on-site monitoring systems audits of partners every year, excluding the laboratories. Every biennium an on-site monitoring systems audit is not conducted, a desk audit or data traceability review may be conducted, for a total of 7 desk audits. Readiness reviews will be conducted with all new partners, and all partners with new personnel.

USIBWC FY16-17 QAPP Page 56 Last revised on August 18, 2015 USIBWC CRP QAPP FY1617
Corrective Action Process for Deficiencies
Deficiencies are any deviation from the QAPP, SWQM Procedures, SOPs, or the DMRG. Deficiencies may invalidate resulting data and require corrective action. Repeated deficiencies should initiate a CAP. Corrective action for deficiencies may include for samples to be discarded and re-collected. Deficiencies are documented in logbooks, field data sheets, etc. by field or laboratory staff, are communicated to Lead Organization Project Manager (or other appropriate staff), and should be subject to periodic review so their responses can be uniform, and their frequency tracked. It is the responsibility of the Lead Organization Project Manager, in consultation with the Lead Organization QAO, to ensure that the actions and resolutions to the problems are documented and that records are maintained in accordance with this QAPP. In addition, these actions and resolutions will be conveyed to the CRP Project Manager both verbally and in writing in the project progress reports and by completion of a CAP. The USIBWC El Paso Headquarters staff has developed an Excel spreadsheet to track any problems encountered by/with partners during the sampling process. This makes the process of tracking deficiencies with such a large number of partners much easier. When the USIBWC El Paso Headquarters Program Manager or QAO encounter an issue with a sampling event, such as late coolers, failure to meet temperature, calibration problems, etc., the event is logged into the spreadsheet. The information logged includes the partner, the stations affected, the sampling date, and what the problem was. The USIBWC El Paso Headquarters QAO attempts to work with the partner to correct the deficiency every time an entry is made into the spreadsheet. Once a partner accumulates three entries on the spreadsheet for the same deficiency, the USIBWC El Paso Headquarters QAO issues a CAP and the partner is required to correct the deficiency and respond. This process allows the USIBWC El Paso Headquarters staff to quickly correct things such as YSI probe malfunctions, but also allows the staff to see bigger problems that may require more training or other means of intervention.
Corrective Action
CAPs should:
Identify the problem, nonconformity, or undesirable situation
Identify immediate remedial actions if possible
Identify the underlying cause(s) of the problem
Identify whether the problem is likely to recur, or occur in other areas
Evaluate the need for corrective action
Use problem-solving techniques to verify causes, determine solution, and develop an action plan
Identify personnel responsible for action
Establish timelines and provide a schedule
Document the corrective action To facilitate the process a flow chart has been developed (see figure C1.1: Corrective Action Process for Deficiencies).

USIBWC FY16-17 QAPP Page 57 Last revised on August 18, 2015 USIBWC CRP QAPP FY1617
Figure C1.1 Corrective Action Process for Deficiencies

USIBWC FY16-17 QAPP Page 58 Last revised on August 18, 2015 USIBWC CRP QAPP FY1617
Status of CAPs will be included with quarterly progress reports. In addition, significant conditions which, if uncorrected, could have a serious effect on safety or on the validity or integrity of data will be reported to the TCEQ immediately. The USIBWC QAO is responsible for implementing corrective actions and tracking deficiencies and corrective actions in a pre-CAP log. Records of audit findings and corrective actions are maintained by the USIBWC Project Manager. Audit reports and corrective action documentation will be submitted to the TCEQ with the Progress Report. If audit findings and corrective actions cannot be resolved, then the authority and responsibility for terminating work are specified in the TCEQ QMP and in agreements in contracts between participating organizations.
C2 Reports to Management
Reports to USIBWC Project Management
A number of Basin Planning Agencies have processes in place to report project status, results of oversight activities, deficiencies, corrective action reports, and significant QA issues to management. They may or may not be written reports. Please list and describe as appropriate. Also include the schedule for submission.
Reports to TCEQ Project Management
All reports detailed in this section are contract deliverables and are transferred to the TCEQ in accordance with contract requirements. Progress Report Summarizes the USIBWC’s activities for each task; reports monitoring status, problems, delays, deficiencies, status of open CAPs, and documentation for completed CAPs; and outlines the status of each task’s deliverables. Monitoring Systems Audit Report and Response Following any audit performed by the USIBWC, a report of findings, recommendations and response is sent to the TCEQ in the quarterly progress report. Data Summary Contains basic identifying information about the data set and comments regarding inconsistencies and errors identified during data verification and validation steps or problems with data collection efforts (e.g. Deficiencies).
Reports by TCEQ Project Management
Contractor Evaluation The USIBWC participates in a Contractor Evaluation by the TCEQ annually for compliance with administrative and programmatic standards. Results of the evaluation are submitted to the TCEQ Financial Administration Division, Procurement and Contracts Section.

USIBWC FY16-17 QAPP Page 59 Last revised on August 18, 2015 USIBWC CRP QAPP FY1617
Table C2.1 QA Management Reports
Type of Report Frequency (daily, weekly, monthly, quarterly, etc.)
Projected Delivery Date(s)
Person(s) Responsible for Report Preparation
Report Recipients
Monitoring Report
Quarterly March 30, June 30, September 30, December 30
USIBWC El Paso Headquarters Program Manager or QAO
TCEQ Project Manager
Corrective Action Plan
Quarterly until completed
30 days from the day USIBWC became aware of the deviation
USIBWC El Paso Headquarters QAO
USIBWC El Paso Headquarters Program Manager, TCEQ Project Manager
Non-compliance Reports
As needed With lab results to document lab issues or late cooler arrivals
Lab QAO USIBWC El Paso Headquarters Program Manager
Data Review Summary
As needed With Data Submittals
USIBWC El Paso Headquarters Program Manager or QAO
TCEQ Project Manager

USIBWC FY16-17 QAPP Page 60 Last revised on August 18, 2015 USIBWC CRP QAPP FY1617
D1 Data Review, Verification, and Validation
All field and laboratory data will be reviewed and verified for integrity and continuity, reasonableness, and conformance to project requirements, and then validated against the project objectives and measurement performance specifications which are listed in Section A7. Only those data which are supported by appropriate quality control data and meet the measurement performance specifications defined for this project will be considered acceptable, and will be reported to the TCEQ for entry into SWQMIS.
D2 Verification and Validation Methods
All field and laboratory data will be reviewed, verified and validated to ensure they conform to project specifications and meet the conditions of end use as described in Section A7 of this document. Data review, verification, and validation will be performed using self-assessments and peer and management review as appropriate to the project task. The data review tasks to be performed by field and laboratory staff is listed in the first two columns of Table D2.1, respectively. Potential errors are identified by examination of documentation and by manual, examination of corollary or unreasonable data, or computer-assisted. If a question arises or an error is identified, the manager of the task responsible for generating the data is contacted to resolve the issue. Issues which can be corrected are corrected and documented. If an issue cannot be corrected, the task manager consults with the higher level project management to establish the appropriate course of action, or the data associated with the issue are rejected and not reported to the TCEQ for storage in SWQMIS. Field and laboratory reviews, verifications, and validations are documented. After the field and laboratory data are reviewed, another level of review is performed once the data are combined into a data set. This review step as specified in Table D2.1 is performed by the USIBWC Data Manager and QAO. Data review, verification, and validation tasks to be performed on the data set include, but are not limited to, the confirmation of laboratory and field data review, evaluation of field QC results, additional evaluation of anomalies and outliers, analysis of sampling and analytical gaps, and confirmation that all parameters and sampling sites are included in the QAPP. The Data Review Checklist (See Appendix F) covers three main types of review: data format and structure, data quality review, and documentation review. The Data Review Checklist is transferred with the water quality data submitted to the TCEQ to ensure that the review process is being performed. Another element of the data validation process is consideration of any findings identified during the monitoring systems audit conducted by the TCEQ CRP Lead Quality Assurance Specialist. Any issues requiring corrective action must be addressed, and the potential impact of these issues on previously collected data will be assessed. After the data are reviewed and documented, the USIBWC Project Manager validates that the data meet the data quality objectives of the project and are suitable for reporting to TCEQ.

USIBWC FY16-17 QAPP Page 61 Last revised on August 18, 2015 USIBWC CRP QAPP FY1617
If any requirements or specifications of the CRP are not met, based on any part of the data review, the responsible party should document the nonconforming activities and submit the information to the USIBWC Data Manager with the data in the Data Summary (See Appendix F). All failed QC checks, missing samples, missing analytes, missing parameters, and suspect results should be discussed in the Data Summary.

USIBWC FY16-17 QAPP Page 62 Last revised on August 18, 2015 USIBWC CRP QAPP FY1617
Table D2.1: Data Review Tasks
Data to be Verified Field Task
Laboratory Task
USIBWC Task
Sample documentation complete; samples labeled, sites identified
Field Personnel
Lab QAO
Field QC samples collected for all analytes as prescribed in the TCEQ SWQM Procedures Manual
Field Personnel
Standards and reagents traceable Field Personnel
Chain of custody complete/acceptable Field Personnel
USIBWC QAO
NELAP Accreditation is current Lab QAO USIBWC QAO
Sample preservation and handling acceptable Lab QAO
Holding times not exceeded Lab QAO USIBWC QAO
Collection, preparation, and analysis consistent with SOPs and QAPP
Field Personnel
USIBWC QAO
Field documentation (e.g., biological, stream habitat) complete
Field Personnel
Instrument calibration data complete Field Personnel
USIBWC QAO
QC samples analyzed at required frequency Field Personnel
Lab PM USIBWC PM
QC results meet performance and program specifications
Lab QAO USIBWC QAO
Analytical sensitivity (LOQ/AWRL) consistent with QAPP
Lab QAO USIBWC QAO
Results, calculations, transcriptions checked Field Personnel
Lab QAO USIBWC QAO
Laboratory bench-level review performed Lab QAO
All laboratory samples analyzed for all scheduled parameters
Lab Manager*
USIBWC PM
Corollary data agree Field Personnel
USIBWC PM and QAO
Nonconforming activities documented Field Personnel
Lab QAO USIBWC QAO
Outliers confirmed and documented; reasonableness check performed
USIBWC PM and QAO
Dates formatted correctly USIBWC PM and QAO
Depth reported correctly and in correct units USIBWC PM and QAO
TAG IDs correct USIBWC PM

USIBWC FY16-17 QAPP Page 63 Last revised on August 18, 2015 USIBWC CRP QAPP FY1617
and QAO
TCEQ Station ID number assigned USIBWC PM and QAO
Valid parameter codes USIBWC PM and QAO
Codes for submitting entity(ies), collecting entity(ies), and monitoring type(s) used correctly
USIBWC PM and QAO
Time based on 24-hour clock USIBWC PM and QAO
Check for transcription errors Field Personnel
Lab QAO USIBWC QAO
Sampling and analytical data gaps checked (e.g., all sites for which data are reported are on the coordinated monitoring schedule)
USIBWC PM
Field instrument pre- and post-calibration results within limits
USIBWC QAO
10% of data manually reviewed USIBWC PM and QAO
*The term "Lab Manager" includes the Technical Director at the City of Laredo Health Dept. laboratory.
D3 Reconciliation with User Requirements
Data produced in this project, and data collected by other organizations (e.g., USGS, TCEQ, etc.), will be analyzed and reconciled with project data quality requirements. Data meeting project requirements will be used by the TCEQ for the Texas Water Quality Integrated Report in accordance with TCEQ’s Guidance for Assessing and Reporting Surface Water Quality in Texas, August 2010 or most recent version, and for TMDL development, water quality standards development, and permit decisions, as appropriate. Data which do not meet requirements will not be submitted to SWQMIS nor will be considered appropriate for any of the uses noted above.

USIBWC FY16-17 QAPP Page 64 Last revised on August 18, 2015 USIBWC CRP QAPP FY1617
Appendix A: Measurement Performance Specifications (Table
A7.1)
Measurement performance specifications define the data quality needed to satisfy project objectives. To this end, measurement performance specifications are qualitative and quantitative statements that:
clarify the intended use of the data
define the type of data needed to support the end use
identify the conditions under which the data should be collected Appendix A of the QAPP addresses measurement performance specifications, including:
analytical methodologies
AWRLs
limits of quantitation
bias limits for LCSs
precision limits for LCSDs
completeness goals
qualitative statements regarding representativeness and comparability The items identified above need to be considered for each type of monitoring activity. The CRP emphasizes that data should be collected to address multiple objectives, if possible, thereby maximizing the expenditure of resources. Caution should be applied when attempting to collect data for multiple purposes because measurement performance specifications may vary according to the purpose. For example, limits of quantitation may differ for data used to assess standards attainment and for trend analysis. When planning projects, first priority should be given to the main use of the project data and the data quality needed to support that use, then secondary goals should be considered. Table A7.1 should be modified to reflect actual parameters, methods, etc. employed by the USIBWC and its participants. Alternative methods than those listed in the following table may be used. Procedures for laboratory analysis must be in accordance with the most recently published edition of Standard Methods for the Examination of Water and Wastewater, 40 CFR 136, or otherwise approved independently. Only data collected that have a valid TCEQ parameter code assigned in Table A7.1 are stored in SWQMIS. Any parameters listed in Table A7.1 that do not have a valid TCEQ parameter code assigned will not be stored in SWQMIS.

Parameter Units
Matrix
Method
Param
eter
Code
TCEQ
AWRL
LOQ
LOQ Check
Sample
%Rec
Precision
(RPD of
LCS/LCSD
)
Bias %Rec.
of LCS
Lab
TEMPERATURE, WATER (DEGREES
CENTIGRADE)DEG C water
SM 2550 B and
TCEQ SOP V100010 Field NA NA NA NA Field
TEMPERATURE, AIR (DEGREES CENTIGRADE)DEG C air TCEQ SOP V1 00020 Field NA NA NA NA Field
RESERVOIR ACCESS NOT POSSIBLE LEVEL TOO
LOW ENTER 1 IF REPORTINGNS other
TCEQ Drought
Guidance00051 Field NA NA NA NA Field
RESERVOIR STAGE (FT ABOVE MEAN SEA
LEVEL) **FT ABOVE MSL water TWDB 00052 Field NA NA NA NA Field
RESERVOIR PERCENT FULL**
% RESERVOIR
CAPACITYwater TWDB 00053 Field NA NA NA NA Field
TRANSPARENCY, SECCHI DISC (METERS) meters water TCEQ SOP V1 00078 Field NA NA NA NA Field
SPECIFIC CONDUCTANCE,FIELD (US/CM @
25C)us/cm water
EPA 120.1 and
TCEQ SOP, V100094 Field NA NA NA NA Field
OXYGEN, DISSOLVED (MG/L) mg/L water
SM 4500‐O G
and TCEQ SOP
V1
00300 Field NA NA NA NA Field
PH (STANDARD UNITS) s.u waterEPA 150.1 and
TCEQ SOP V100400 Field NA NA NA NA Field
DAYS SINCE PRECIPITATION EVENT (DAYS) days other TCEQ SOP V1 72053 Field NA NA NA NA Field
DEPTH OF BOTTOM OF WATER BODY AT
SAMPLE SITEmeters water TCEQ SOP V2 82903 Field NA NA NA NA Field
MAXIMUM POOL WIDTH AT TIME OF STUDY
(METERS)***meters other TCEQ SOP V2 89864 Field NA NA NA NA Field
MAXIMUM POOL DEPTH AT TIME OF
STUDY(METERS)***meters other TCEQ SOP V2 89865 Field NA NA NA NA Field
POOL LENGTH, METERS*** meters other TCEQ SOP V2 89869 Field NA NA NA NA Field
% POOL COVERAGE IN 500 METER REACH*** % other TCEQ SOP V2 89870 Field NA NA NA NA Field
WIND INTENSITY
(1=CALM,2=SLIGHT,3=MOD.,4=STRONG)NU other NA 89965 Field NA NA NA NA Field
PRESENT WEATHER
(1=CLEAR,2=PTCLDY,3=CLDY,4=RAIN,5=OTHE
R)
NU other NA 89966 Field NA NA NA NA Field
WATER
SURFACE(1=CALM,2=RIPPLE,3=WAVE,4=WHI
TECAP)
NU water NA 89968 Field NA NA NA NA Field
PRIMARY CONTACT, OBSERVED ACTIVITY (#
OF PEOPLE OBSERVED)
# of people
observedother NA 89978 Field NA NA NA NA Field
EVIDENCE OF PRIMARY CONTACT
RECREATION (1 = OBSERVED, 0 = NOT
OBSERVED)
NU other NA 89979 Field NA NA NA NA Field
Field ParametersTABLE A7.1 Measurement Performance Specifications for A&B Environmental Services Inc.
Rio Grande USIBWC El Paso HQ partners that use this field table include USIBWC field offices, BBNP, TPWD, Midland College, RGISC, USIBWC El Paso HQ, EPCC/USIBWC El Paso HQ,
UTEP, UTB, City of Laredo Env. Services Dept.
* Reporting to be consistent with SWQM guidance and based on measurement capability.
**As published by the Texas Water Development Board on their website http://wiid.twdb.state.tx.us/ims/resinfo/BushButton/lakestatus.asp?selcat=3&slbasin=2
*** To be routinely reported when collecting data from perennial pools.
References:
United States Environmental Protection Agency (USEPA) Methods for Chemical Analysis of Water and Wastes, Manual #EPA‐600/4‐79‐020
American Public Health Association (APHA), American Water Works Association (AWWA), and Water Environment Federation (WEF), Standard
Methods for the Examination of Water and Wastewater, 20th Edition, 1998. (Note: The 21st edition may be cited if it becomes available.)
TCEQ SOP, V1 ‐ TCEQ Surface Water Quality Monitoring Procedures, Volume 1: Physical and Chemical Monitoring Methods, 2012 (RG‐415).
TCEQ SOP, V2 ‐ TCEQ Surface Water Quality Monitoring Procedures, Volume 2: Methods for Collecting and Analyzing Biological Assemblage and Habitat Data, 2014 (RG‐416)

Parameter
Units
Matrix
Method
Param
eter Code
Lab
FLOW STREAM, INSTANTANEOUS
(CUBIC FEET PER SEC)cfs water TCEQ SOP V1 00061 Field
FLOW SEVERITY:1=No
Flow,2=Low,3=Normal,4=Flood,5=High,6
=Dry
NU water TCEQ SOP V1 01351 Field
STREAM FLOW ESTIMATE (CFS) cfs Water TCEQ SOP V1 74069 FieldFLOW MTH 1=GAGE 2=ELEC 3=MECH
4=WEIR/FLU 5=DOPPLERNU other TCEQ SOP V1 89835 Field
TABLE A7.2 Measurement Performance Specifications for A&B Environmental Services Inc.
Flow Parameters
Rio Grande USIBWC El Paso HQ partners that use this field table include USIBWC field offices, BBNP, TPWD, Midland
College, RGISC, USIBWC El Paso HQ, EPCC/USIBWC El Paso HQ, UTEP, UTB, City of Laredo Env. Services Dept.
References:
United States Environmental Protection Agency (USEPA) Methods for Chemical Analysis of Water and Wastes, Manual
#EPA‐600/4‐79‐020
American Public Health Association (APHA), American Water Works Association (AWWA), and Water Environment
Federation (WEF), Standard
Methods for the Examination of Water and Wastewater, 20th Edition, 1998. (Note: The 21st edition may be cited if it
becomes available.)
TCEQ SOP, V1 ‐ TCEQ Surface Water Quality Monitoring Procedures, Volume 1: Physical and Chemical Monitoring
Methods, 2012 (RG‐415).
TCEQ SOP, V2 ‐ TCEQ Surface Water Quality Monitoring Procedures, Volume 2: Methods for Collecting and Analyzing
Biological Assemblage and Habitat Data, 2014 (RG‐416)

Parameter Units
Matrix
Method
Param
eter Code
TCEQ
AWRL
LOQ
LOQ Verification Sam
ple
%Rec (M
ethod defined)
Precision (RPD of
LCS/LCSD
)
Bias %Rec. of LCS
Lab
BIOCHEMICAL OXYGEN DEMAND
(MG/L, 5 DAY ‐ 20DEG Cmg/L water EPA 405.1, 00310 2 2 NA NA NA A&B
CHEMICAL OXYGEN DEMAND, .025N
K2CR2O7 (MG/L)mg/L water
EPA 410.4, SM
5220D00335 10 10 70‐130 20 80‐120 A&B
ALKALINITY, TOTAL (MG/L AS CACO3) mg/L waterEPA 310.1, SM
2320B00410 20 20 NA 20 NA A&B
RESIDUE, TOTAL NONFILTRABLE
(MG/L)mg/L water
SM 2540B, SM
2540D00530 5 2.5 NA NA NA A&B
RESIDUE, VOLATILE NONFILTRABLE
(MG/L)mg/L water EPA 160.4 00535 5 2.5 NA NA NA A&B
NITROGEN, AMMONIA, TOTAL (MG/L
AS N) ***mg/L water
EPA 350.3, SM
4500‐NH3 D00610 0.1 0.1 70‐130 20 80‐120 A&B
NITRITE PLUS NITRATE, TOTAL ONE
LAB DETERMINED VALUE (MG/L AS
N) ***
mg/L water
EPA 300.0,
EPA 353.2,
EPA 353.3,
EPA 9056, SM
4500‐NO3 E
00630 0.05 0.05 70‐130 20 80‐120 A&B
PHOSPHORUS, TOTAL, WET METHOD
(MG/L AS P) ***mg/L water
EPA 200.7,
EPA 365.2, SM
4500‐P E
00665 0.06 0.05 70‐130 20 80‐120 A&B
CARBON, TOTAL ORGANIC, NPOC
(TOC), MG/Lmg/L water
EPA 415.1,
EPA 9060, SM
5310 B
00680 2 1 70‐130 10 80‐120 A&B
HARDNESS, TOTAL (MG/L AS
CACO3)*mg/L water
EPA 130.2, SM
2340 B or C00900 5 1 70‐130 20 80‐120 A&B
CHLORIDE (MG/L AS CL) mg/L water
EPA 300.0 Rev.
2.1 (1993),
EPA 9056
00940 5 0.1 70‐130 20 80‐120 A&B
SULFATE (MG/L AS SO4) mg/L water
EPA 300.0 Rev.
2.1 (1993),
EPA 9056
00945 5 0.1 70‐130 20 80‐120 A&B
CHLOROPHYLL‐A UG/L
SPECTROPHOTOMETRIC ACID. METH ug/L water SM 10200 H 32211 3 6 60‐140 20 80‐120 A&B
PHEOPHYTIN‐A UG/L
SPECTROPHOTOMETRIC ACID. METH. μg/L water SM 10200 H 32218 3 3 60‐140 NA NA A&B
RESIDUE,TOTAL FILTRABLE (DRIED AT
180C) (MG/L) ***mg/L water SM 2540C 70300 10 10 NA 20 80‐120 A&B
Conventional Parameters in WaterTABLE A7.3 Measurement Performance Specifications for A&B Environmental Services Inc.

Parameter Units
Matrix
Method
Param
eter Code
TCEQ
AWRL
LOQ
LOQ Verification Sam
ple
%Rec (M
ethod defined)
Precision (RPD of
LCS/LCSD
)
Bias %Rec. of LCS
Lab
Conventional Parameters in WaterTABLE A7.3 Measurement Performance Specifications for A&B Environmental Services Inc.
BROMIDE, TOTAL (MG/L as BR) mg/L waterEPA 300.0,
EPA 905671870 NA 0.1 70‐130 20 80‐120 A&B
TURBIDITY,LAB NEPHELOMETRIC
TURBIDITY UNITS, NTUNTU water
EPA 180.1, SM
2130B82079 0.5 0.1 70‐130 NA NA A&B
Rio Grande USIBWC El Paso HQ partners that use this field table include USIBWC field offices, BBNP, TPWD, Midland College, RGISC, USIBWC El Paso HQ,
EPCC/USIBWC El Paso HQ, UTEP, UTB, City of Laredo Env. Services Dept.
Calcium, Sodium, and Potassium are listed here because they are part of the contract laboratory conventionals analysis for the USIBWC El Paso HQ monitoring
program.
*Hardness is not used for regulatory purposes but is used to assess metals in water at inland sites (estuarine sites do not require hardness analysis).
*** Site 13103, sampled by the USIBWC Falcon Dam field office, only tests these parameters when there is flow. No other parameters are tested.
References:
United States Environmental Protection Agency (USEPA) Methods for Chemical Analysis of Water and Wastes, Manual #EPA‐600/4‐79‐020
American Public Health Association (APHA), American Water Works Association (AWWA), and Water Environment Federation (WEF), Standard Methods for the
Examination of Water and Wastewater, 20th Edition, 1998. (Note: The 21st edition may be cited if it becomes available.)
TCEQ SOP, V1 ‐ TCEQ Surface Water Quality Monitoring Procedures, Volume 1: Physical and Chemical Monitoring Methods, 2012 (RG‐415).
TCEQ SOP, V2 ‐ TCEQ Surface Water Quality Monitoring Procedures, Volume 2: Methods for Collecting and Analyzing Biological Assemblage and Habitat Data, 2014
(RG‐416)

Parameter Units
Matrix
Method
Param
eter
Code
TCEQ
AWRL
LOQ
Log Difference
of Duplicates
Bias %Rec. of
LCS
Lab
E. COLI, COLILERT, IDEXX METHOD,
MPN/100ML
MPN/100
mLwater
SM 9223‐
B**31699 1 NA 0.50* NA A&B
E.COLI, COLILERT, IDEXX, HOLDING TIME hours water NA 31704 NA NA NA NA A&B
TABLE A7.4 Measurement Performance Specifications for A&B Environmental Services Inc.Bacteriological Parameters in Water
Rio Grande USIBWC El Paso HQ partners that use this field table include USIBWC field offices, BBNP, TPWD, Midland College, RGISC, USIBWC El Paso HQ,
EPCC/USIBWC El Paso HQ, UTEP, UTB, City of Laredo Env. Services Dept.
* This value is not expressed as a relative percent difference. It represents the maximum allowable difference between the logarithm of the result of a
sample and the logarithm of the duplicate result. See Section B5.
** E.coli samples analyzed by SM 9223‐B should always be processed as soon as possible and within 8 hours. When transport conditions necessitate delays
in delivery longer than 6 hours, the holding time may be extended and samples must be processed as soon as possible and within 30 hours.
References:
United States Environmental Protection Agency (USEPA) Methods for Chemical Analysis of Water and Wastes, Manual #EPA‐600/4‐79‐020
American Public Health Association (APHA), American Water Works Association (AWWA), and Water Environment Federation (WEF), Standard Methods for
the Examination of Water and Wastewater, 20th Edition, 1998. (Note: The 21st edition may be cited if it becomes available.)
TCEQ SOP, V1 ‐ TCEQ Surface Water Quality Monitoring Procedures, Volume 1: Physical and Chemical Monitoring Methods, 2012 (RG‐415).
TCEQ SOP, V2 ‐ TCEQ Surface Water Quality Monitoring Procedures, Volume 2: Methods for Collecting and Analyzing Biological Assemblage and Habitat
Data, 2014 (RG‐416)

Parameter
Units
Matrix
Method
Param
eter
Code
TCEQ
AWRL
LOQ
LOQ
Verification
Sample %Rec
(Method
defined)
Precision (RPD
of LCS/LCSD
)
Bias %Rec. of
LCS
Lab
HARDNESS, TOTAL (MG/L AS CACO3)* mg/L water
EPA 130.2,
SM 2340 B or
C
00900 5 0.066 70‐130 20 80‐120 A&B
CALCIUM, TOTAL (MG/L AS CA) mg/L waterEPA 200.7,
EPA 601000916 0.5 0.02 70‐130 20 80‐120 A&B
MAGNESIUM, TOTAL (MG/L AS MG) mg/L waterEPA 200.7,
EPA 601000927 0.5 0.02 70‐130 20 80‐120 A&B
SODIUM, TOTAL (MG/L AS NA) mg/L waterEPA 200.7,
EPA 601000929 NA 0.1 70‐130 20 80‐120 A&B
POTASSIUM, TOTAL (MG/L AS K) mg/L waterEPA 200.7,
EPA 601000937 NA 1 70‐130 20 80‐120 A&B
FLUORIDE, TOTAL (MG/L AS F) mg/L water
EPA 300.0,
EPA 340.2,
EPA 9056,
SM 4500‐FC
00951 0.5 0.1 70‐130 20 80‐120 A&B
BARIUM, TOTAL (UG/L AS BA) μg/L water
EPA 200.7,
EPA 200.8,
EPA 6010,
EPA 6020
01007 NA 10/1** 70‐130 20 80‐120 A&B
BERYLLIUM, TOTAL (UG/L AS BE) μg/L water
EPA 200.7,
EPA 200.8,
EPA 6010,
EPA 6020
01012 NA 10/1** 70‐130 20 80‐120 A&B
CHROMIUM, TOTAL (UG/L AS CR) μg/L water
EPA 200.7,
EPA 200.8,
EPA 6010,
EPA 6020
01034 NA 10/1** 70‐130 20 80‐120 A&B
COBALT, TOTAL (UG/L AS CO) μg/L water
EPA 200.7,
EPA 200.8,
EPA 6010,
EPA 6020
01037 NA 10/1** 70‐130 20 80‐120 A&B
COPPER, TOTAL (UG/L AS CU) μg/L water
EPA 200.7,
EPA 200.8,
EPA 6010,
EPA 6020
01042 NA 10/1** 70‐130 20 80‐120 A&B
IRON, TOTAL (UG/L AS FE) μg/L water
EPA 200.7,
EPA 200.8,
EPA 6010,
EPA 6020
01045 300 10/1** 70‐130 20 80‐120 A&B
MANGANESE, TOTAL (UG/L AS MN) μg/L water
EPA 200.7,
EPA 200.8,
EPA 6010,
EPA 6020
01055 50 10/1** 70‐130 20 80‐120 A&B
THALLIUM, TOTAL (UG/L AT TL) μg/L water EPA 200.8 01059 NA 1 70‐130 20 80‐120 A&B
MOLYBDENUM, TOTAL (UG/L AS MO) μg/L water
EPA 200.7,
EPA 200.8,
EPA 6010,
EPA 6020
01062 NA 10/1** 70‐130 20 80‐120 A&B
NICKEL, TOTAL (UG/L AS NI) μg/L water
EPA 200.7,
EPA 200.8,
EPA 6010,
EPA 6020
01067 NA 10/1** 70‐130 20 80‐120 A&B
Metals in WaterTABLE A7.5 Measurement Performance Specifications for A&B Environmental Services Inc.

Parameter
Units
Matrix
Method
Param
eter
Code
TCEQ
AWRL
LOQ
LOQ
Verification
Sample %Rec
(Method
defined)
Precision (RPD
of LCS/LCSD
)
Bias %Rec. of
LCS
Lab
Metals in WaterTABLE A7.5 Measurement Performance Specifications for A&B Environmental Services Inc.
SILVER, TOTAL (UG/L AS AG) μg/L water
EPA 200.7,
EPA 200.8,
EPA 6010
01077 NA 10/1** 70‐130 20 80‐120 A&B
ZINC, TOTAL (UG/L AS ZN) μg/L water
EPA 200.7,
EPA 200.8,
EPA 6010,
EPA 6020
01092 NA 10/1** 70‐130 20 80‐120 A&B
ANTIMONY, TOTAL (UG/L AS SB) μg/L water
EPA 200.7,
EPA 200.8,
EPA 6010,
EPA 6020
01097 NA 10/1** 70‐130 20 80‐120 A&B
TIN, TOTAL, UG/L AS SN μg/L water EPA 200.7 01102 NA 0.1 70‐130 20 80‐120 A&B
ALUMINUM, TOTAL (UG/L AS AL) ug/L water
EPA 200.7,
EPA 200.8,
EPA 6010,
EPA 6020
01105 NA 10/1** 70‐130 20 80‐120 A&B
ARSENIC, TOTAL (UG/L AS AS) ug/L water
EPA 200.7,
EPA 200.8,
EPA 6010,
EPA 6020
01002 NA 10/1** 70‐130 20 80‐120 A&B
CADMIUM, TOTAL (UG/L AS Cd) ug/L water
EPA 200.7,
EPA 200.8,
EPA 6010,
EPA 6020
01027 NA 10/1** 70‐130 20 80‐120 A&B
LEAD, TOTAL (UG/L AS Pb) ug/L water
EPA 200.7,
EPA 200.8,
EPA 6010,
EPA 6020
01051 NA 10/1** 70‐130 20 80‐120 A&B
MERCURY TOTAL, WATER, METHOD 1631
ug/Lug/L water EPA 1631E 71960 0.0006 0.0005 70‐130 20 80‐120
Sub to
Summit
SELENIUM, TOTAL (UG/L AS SE) ug/L water
EPA 200.7,
EPA 200.8
Rev 5.4
(1998), EPA
6010, EPA
6020
01147 2 10/1** 70‐130 20 80‐120 A&B
Rio Grande USIBWC El Paso HQ partners that use this field table include USIBWC field offices, BBNP, TPWD, Midland College, RGISC, USIBWC El Paso HQ, EPCC/USIBWC El Paso HQ, UTEP, UTB, City
of Laredo Env. Services Dept. Mercury analysis is subcontracteed by A&B to Summit Laboratories, whose adherence letter is on file.
*Hardness is not used for regulatory purposes but is used to assess metals in water at inland sites (estuarine sites do not require hardness analysis).
**The calibration curve and LOQ are different depending on the technology used. The ICP‐OES method (200.7 or 6010) has an LOQ of 10 ppb. The ICP‐MS method (200.8 or 6020) has an LOQ of
1 ppb. It is expressed in the table as 10/1 for 200.7/200.8.
References:
United States Environmental Protection Agency (USEPA) Methods for Chemical Analysis of Water and Wastes, Manual #EPA‐600/4‐79‐020
American Public Health Association (APHA), American Water Works Association (AWWA), and Water Environment Federation (WEF), Standard Methods for the Examination of Water and
Wastewater, 20th Edition, 1998. (Note: The 21st edition may be cited if it becomes available.)
TCEQ SOP, V1 ‐ TCEQ Surface Water Quality Monitoring Procedures, Volume 1: Physical and Chemical Monitoring Methods, 2012 (RG‐415).
TCEQ SOP, V2 ‐ TCEQ Surface Water Quality Monitoring Procedures, Volume 2: Methods for Collecting and Analyzing Biological Assemblage and Habitat Data, 2014 (RG‐416)

Parameter Units
Matrix
Method
Param
eter
Code
TCEQ
AWRL
LOQ
LOQ
Verification
Sample %Rec
(Method
defined)
Precision (RPD
of LCS/LCSD
)
Bias %Rec. of
LCS
Lab
ARSENIC, BOTTOM DEPOSITS (MG/KG AS AS
DRY WT)mg/kg sediment
EPA 6010,
EPA 602001003 16.5 0.5 60‐140 30 60‐140 A&B
BARIUM, BOTTOM DEPOSITS (MG/KG AS BA
DRY WT)mg/kg sediment
EPA 6010,
EPA 602001008 NA 0.5 60‐140 30 60‐140 A&B
CADMIUM,TOTAL, BOTTOM DEPOSITS
(MG/KG,DRY WT)mg/kg sediment
EPA 6010,
EPA 602001028 2.49 0.5 60‐140 30 60‐140 A&B
CHROMIUM,TOTAL, BOTTOM DEPOSITS
(MG/KG,DRY WTmg/kg sediment
EPA 6010,
EPA 602001029 55.5 0.5 60‐140 30 60‐140 A&B
COPPER, BOTTOM DEPOSITS (MG/KG AS CU
DRY WT)mg/kg sediment
EPA 6010,
EPA 602001043 74.5 0.5 60‐140 30 60‐140 A&B
LEAD, BOTTOM DEPOSITS (MG/KG AS PB DRY
WT)mg/kg sediment
EPA 6010,
EPA 602001052 64 0.5 60‐140 30 60‐140 A&B
MANGANESE, BOTTOM DEPOSITS (MG/KG AS
MN DRY WGmg/kg sediment
EPA 6010,
EPA 602001053 550 0.5 60‐140 30 60‐140 A&B
NICKEL, TOTAL, BOTTOM DEPOSITS
(MG/KG,DRY WT)mg/kg sediment
EPA 6010,
EPA 602001068 24.3 0.5 60‐140 30 60‐140 A&B
SILVER, BOTTOM DEPOSITS (MG/KG AS AG
DRY WT)mg/kg sediment
EPA 6010,
EPA 602001078 1.1 0.5 60‐140 30 60‐140 A&B
ZINC, BOTTOM DEPOSITS (MG/KG AS ZN DRY
WT)mg/kg sediment
EPA 6010,
EPA 6020 01093 205 0.5 60‐140 30 60‐140 A&B
ANTIMONY, BOTTOM DEPOSITS (MG/KG AS SB
DRY WTmg/kg sediment
EPA 6010,
EPA
6020A
01098 12.5 1.25 60‐140 30 60‐140 A&B
ALUMINUM, BOTTOM DEPOSITS (MG/KG AS
AL DRY WTmg/kg sediment
EPA 6010,
EPA 602001108 NA 0.5 60‐140 30 60‐140 A&B
SELENIUM, BOTTOM DEPOSITS (MG/KG AS SE
DRY WT)mg/kg sediment
EPA 6010,
EPA 602001148 NA 0.5 60‐140 30 60‐140 A&B
MERCURY,TOT. IN BOT. DEPOS. (MG/KG) AS
HG DRY WGmg/kg sediment EPA 7470 71921 0.355 0.01 60‐140 30 60‐140 A&B
SEDIMENT PRTCL.SIZE CLASS >2.0MM GRAVEL
%DRY WT*
% DRY
WTsediment
ASTM D
422,
ASTM 442‐
63
80256 NA NA NA%gravel ‐
20NA A&B
Metals in SedimentTABLE A7.6 Measurement Performance Specifications for A&B Environmental Services Inc.

Parameter Units
Matrix
Method
Param
eter
Code
TCEQ
AWRL
LOQ
LOQ
Verification
Sample %Rec
(Method
defined)
Precision (RPD
of LCS/LCSD
)
Bias %Rec. of
LCS
Lab
Metals in SedimentTABLE A7.6 Measurement Performance Specifications for A&B Environmental Services Inc.
SOLIDS IN SEDIMENT, PERCENT BY WEIGHT
(DRY)
% DRY
WTsediment
ASTM D
422,
ASTM 442‐
63
81373 NA NA NA 20 NA A&B
PARTICLE SIZE, 0.05‐0.002mm SILT,
DRYWT,SEDIMENT*
% sediment
ASTM D
422,
ASTM 442‐
63
49906 NA NA NA %silt ‐ 20 NA A&B
SEDIMENT PRTL.SIZE CLASS.0039‐.0625 SILT
%DRY W*
% DRY
WTsediment
ASTM D
422,
ASTM 442‐
63
82008 NA NA NA %silt ‐ 20 NA A&B
PARTICLE SIZE,CLAY0.002‐0.0002mm
DRYWT,SEDIMENT%*
% sediment
ASTM D
422,
ASTM 442‐
63
49900 NA NA NA %clay – 20 NA A&B
SEDIMENT PRCTL.SIZE CLASS <.0039 CLAY
%DRY WT*
% sediment
ASTM D
422,
ASTM 442‐
63
82009 NA NA NA %clay – 20 NA A&B
SEDIMENT PRCTL.SIZE CLASS,SAND .0625‐
2MM %DRYWT*
% sediment
ASTM D
422,
ASTM 442‐
63
89991 NA NA NA%sand ‐
20NA A&B
Rio Grande CRP partners that use this field table include USIBWC Amistad Dam field office and City of Laredo Env. Services Dept.
*Sediment conventionals are not used for regulatory purposes but are extremely important in determining the availability of sediment toxics. Sediment grain size and TOC are recommended when
analyzing metals and/or organics in sediment.
References:
United States Environmental Protection Agency (USEPA) Methods for Chemical Analysis of Water and Wastes, Manual #EPA‐600/4‐79‐020
American Public Health Association (APHA), American Water Works Association (AWWA), and Water Environment Federation (WEF), Standard Methods for the Examination of Water and Wastewater,
20th Edition, 1998. (Note: The 21st edition may be cited if it becomes available.)
TCEQ SOP, V1 ‐ TCEQ Surface Water Quality Monitoring Procedures, Volume 1: Physical and Chemical Monitoring Methods, 2012 (RG‐415).
TCEQ SOP, V2 ‐ TCEQ Surface Water Quality Monitoring Procedures, Volume 2: Methods for Collecting and Analyzing Biological Assemblage and Habitat Data, 2014 (RG‐416)

Parameter Units
Matrix
Method
Param
eter
Code
TCEQ
AWRL
LOQ
Log Difference
of Duplicates
Bias %Rec. of
LCS
Lab
E. COLI, COLILERT, IDEXX METHOD,
MPN/100ML
MPN/100
mLwater
SM 9223‐
B**31699 1 1 0.50* NA BPUB
ENTEROCOCCI, ENTEROLERT, IDEXX,
(MPN/100 ML)
MPN/100
mLwater
IDEXX
Enterolert31701 10*** 10 0.50* NA BPUB
TABLE A7.7 Measurement Performance Specifications for BPUBBacteriological Parameters in Water
The BPUB analyzes their own data, and also analyzes the Enterococcus samples submitted to them by UTB * This
value is not expressed as a relative percent difference. It represents the maximum allowable difference between the logarithm of the result of a sample
and the logarithm of the duplicate result. See Section B5.
** E.coli samples analyzed by SM 9223‐B should always be processed as soon as possible and within 8 hours. When transport conditions necessitate delays
in delivery longer than 6 hours, the holding time may be extended and samples must be processed as soon as possible and within 30 hours.
***Enterococcus Samples should be diluted 1:10 for all waters.
References:
United States Environmental Protection Agency (USEPA) Methods for Chemical Analysis of Water and Wastes, Manual #EPA‐600/4‐79‐020
American Public Health Association (APHA), American Water Works Association (AWWA), and Water Environment Federation (WEF), Standard Methods for
the Examination of Water and Wastewater, 20th Edition, 1998. (Note: The 21st edition may be cited if it becomes available.)
TCEQ SOP, V1 ‐ TCEQ Surface Water Quality Monitoring Procedures, Volume 1: Physical and Chemical Monitoring Methods for Water, 2012 (RG‐415).
TCEQ SOP, V2 ‐ TCEQ Surface Water Quality Monitoring Procedures, Volume 2: Methods for Collecting and Analyzing Biological Assemblage and Habitat
Data, 2014 (RG‐416)

Parameter Units
Matrix
Method
Parameter
Code
TCEQ
AWRL
LOQ
LOQ
Verification
Sample %Rec
(Method
defined
)
Precision (RPD
of LCS/LCSD
)
Bias %Rec. of
LCS
Lab
BIOCHEMICAL OXYGEN DEMAND (MG/L, 5
DAY ‐ 20DEG Cmg/L water SM 5210B 00310 2 1 70‐130 NA NA BPUB
RESIDUE, TOTAL NONFILTRABLE (MG/L) mg/L waterEPA 160.2,
SM 2540D00530 5 2 70‐130 NA NA BPUB
NITROGEN, AMMONIA, TOTAL (MG/L AS N) mg/L water
EPA 350.1
Rev. 2.0
(1993), EPA
350.3, SM
4500 NH3 D
00610 0.1 0.1 70‐130 20 80‐120 BPUB
RESIDUE,TOTAL FILTRABLE (DRIED AT 180C)
(MG/L)mg/L water SM 2540C 70300 10 10 70‐130 20 80‐120 BPUB
TURBIDITY,LAB NEPHELOMETRIC TURBIDITY
UNITS, NTUNTU water EPA 180.1 82079 0.5 0.05 70‐130 NA NA BPUB
The BPUB analyzes their own data, and also analyzes the Enterococcus samples submitted to them by UTB.
The BPUB does not collect field parameters.
References:
Quality Control Lab documents from Brownsville PUB and NELAP certification.
United States Environmental Protection Agency (USEPA) Methods for Chemical Analysis of Water and Wastes, Manual #EPA‐600/4‐79‐020
American Public Health Association (APHA), American Water Works Association (AWWA), and Water Environment Federation (WEF), Standard Methods for the Examination of Water and
Wastewater, 20th Edition, 1998. (Note: The 21st edition may be cited if it becomes available.)
TCEQ SOP, V1 ‐ TCEQ Surface Water Quality Monitoring Procedures, Volume 1: Physical and Chemical Monitoring Methods, 2012 (RG‐415).
TCEQ SOP, V2 ‐ TCEQ Surface Water Quality Monitoring Procedures, Volume 2: Methods for Collecting and Analyzing Biological Assemblage and Habitat Data, 2014 (RG‐416)
Conventional Parameters in WaterTABLE A7.8 Measurement Performance Specifications for BPUB

Parameter Units
Matrix
Method
Param
eter
Code
TCEQ
AWRL
LOQ
LOQ Check
Sample %Rec
Precision (RPD
of LCS/LCSD
)
Bias %Rec. of
LCS
Lab
TEMPERATURE, WATER (DEGREES
CENTIGRADE)DEG C water
SM 2550 B and
TCEQ SOP V100010 Field NA NA NA NA Field
SPECIFIC CONDUCTANCE,FIELD (US/CM @
25C)us/cm water
EPA 120.1 and
TCEQ SOP, V100094 Field NA NA NA NA Field
TEMPERATURE, AIR (DEGREES CENTIGRADE) DEG C airSM 2520 and
TCEQ SOP V100020 Field NA NA NA NA Field
DAYS SINCE PRECIPITATION EVENT (DAYS) days other TCEQ SOP V1 72053 Field NA NA NA NA Field
AVERAGE STREAM WIDTH (METERS) meters water TCEQ SOP V1 89861 Field NA NA NA NA Field
WIND INTENSITY
(1=CALM,2=SLIGHT,3=MOD.,4=STRONG)NU other NA 89965 Field NA NA NA NA Field
WIND DIRECTION (1= North, 2= South, 3=
East, 4=West, 5= NE, 6= SE, 7= NW, 8= SW)NU other NA 89010 Field NA NA NA NA Field
PRESENT WEATHER
(1=CLEAR,2=PTCLDY,3=CLDY,4=RAIN,5=OTHE
R)
NU other NA 89966 Field NA NA NA NA Field
PRIMARY CONTACT, OBSERVED ACTIVITY (#
OF PEOPLE OBSERVED)
# of people
observedother NA 89978 Field NA NA NA NA Field
EVIDENCE OF PRIMARY CONTACT
RECREATION (1 = OBSERVED, 0 = NOT
OBSERVED)
NU other NA 89979 Field NA NA NA NA Field
Field ParametersTABLE A7.9 Measurement Performance Specifications for City of Laredo Health Department Lab
The City of Laredo Health Department field sampling crew uses this table.
* Reporting to be consistent with SWQM guidance and based on measurement capability.
References:
Quality Control Lab documents from City of Laredo Health Department Laboratory and NELAP certification. United States Environmental Protection Agency (USEPA) Methods for
Chemical Analysis of Water and Wastes, Manual #EPA‐600/4‐79‐020
American Public Health Association (APHA), American Water Works Association (AWWA), and Water Environment Federation (WEF), Standard
Methods for the Examination of Water and Wastewater, 20th Edition, 1998. (Note: The 21st edition may be cited if it becomes available.)
TCEQ SOP, V1 ‐ TCEQ Surface Water Quality Monitoring Procedures, Volume 1: Physical and Chemical Monitoring Methods, 2012 (RG‐415).
TCEQ SOP, V2 ‐ TCEQ Surface Water Quality Monitoring Procedures, Volume 2: Methods for Collecting and Analyzing Biological Assemblage and Habitat Data, 2014 (RG‐416)

Parameter Units
Matrix
Method
Param
eter
Code
TCEQ
AWRL
LOQ
Log Difference
of Duplicates
Bias %Rec. of
LCS
Lab
FECAL COLIFORM,MEMBR FILTER,M‐FC
BROTH, #/100ML#/100ML water SM 9222 D 31616 1 1 0.50* NA Laredo
E. COLI, COLILERT, IDEXX METHOD,
MPN/100ML
MPN/100
mLwater
SM 9223‐
B**, IDEXX
Colilert
31699 1 1 0.50* NA Laredo
TABLE A7.10 Measurement Performance Specifications for City of Laredo Health Department LabBacteriological Parameters in Water
The City of Laredo Health Department Lab analyzes the bacteria samples collected by the City of Laredo Health Department.
* This value is not expressed as a relative percent difference. It represents the maximum allowable difference between the logarithm of the result of a
sample and the logarithm of the duplicate result. See Section B5.
** E.coli samples analyzed by SM 9223‐B should always be processed as soon as possible and within 8 hours. When transport conditions necessitate delays in
delivery longer than 6 hours, the holding time may be extended and samples must be processed as soon as possible and within 30 hours.
References:
United States Environmental Protection Agency (USEPA) Methods for Chemical Analysis of Water and Wastes, Manual #EPA‐600/4‐79‐020
American Public Health Association (APHA), American Water Works Association (AWWA), and Water Environment Federation (WEF), Standard Methods for
the Examination of Water and Wastewater, 20th Edition, 1998. (Note: The 21st edition may be cited if it becomes available.)
TCEQ SOP, V1 ‐ TCEQ Surface Water Quality Monitoring Procedures, Volume 1: Physical and Chemical Monitoring Methods, 2012 (RG‐415).
TCEQ SOP, V2 ‐ TCEQ Surface Water Quality Monitoring Procedures, Volume 2: Methods for Collecting and Analyzing Biological Assemblage and Habitat Data,
2014 (RG‐416)

Parameter
Units
Matrix
Method
Param
eter Code
Lab
FLOW STREAM, INSTANTANEOUS
(CUBIC FEET PER SEC)cfs water
TCEQ
SOP V100061 Field
FLOW SEVERITY:1=No
Flow,2=Low,3=Normal,4=Flood,5=High,6
=Dry
NU waterTCEQ
SOP V101351 Field
STREAM FLOW ESTIMATE (CFS) cfs WaterTCEQ
SOP V174069 Field
FLOW MTH 1=GAGE 2=ELEC 3=MECH
4=WEIR/FLU 5=DOPPLERNU other
TCEQ
SOP V189835 Field
TABLE A7.11 Measurement Performance Specifications for City of Laredo Health Department
Flow Parameters
The City of Laredo Health Department field sampling crew uses this table. References:
United States Environmental Protection Agency (USEPA) Methods for Chemical Analysis of Water and Wastes, Manual #EPA‐
600/4‐79‐020
American Public Health Association (APHA), American Water Works Association (AWWA), and Water Environment Federation
(WEF), Standard
Methods for the Examination of Water and Wastewater, 20th Edition, 1998. (Note: The 21st edition may be cited if it
becomes available.)
TCEQ SOP, V1 ‐ TCEQ Surface Water Quality Monitoring Procedures, Volume 1: Physical and Chemical Monitoring Methods,
2012 (RG‐415).
TCEQ SOP, V2 ‐ TCEQ Surface Water Quality Monitoring Procedures, Volume 2: Methods for Collecting and Analyzing
Biological Assemblage and Habitat Data, 2014 (RG‐416)

Parameter Units
Matrix
Method
Parameter
Code
TCEQ
AWRL
LOQ
LOQ
Verification
Sample %Rec
(Method
defined
)
Precision (RPD
of LCS/LCSD
)
Bias %Rec. of
LCS
Lab
BIOCHEMICAL OXYGEN DEMAND (MG/L, 5
DAY ‐ 20DEG Cmg/L water SM 5210B 00310 2 2 NA NA NA EPWU
NITROGEN, AMMONIA, TOTAL (MG/L AS N) mg/L water
EPA 350.1
Rev. 2.0
(1993)
00610 0.1 0.5 NA 20 80‐120 EPWU
CHLOROPHYLL‐A, FLUOROMETRIC METHOD,
UG/Lμg/L water EPA 445.0 70953 3 3 NA 20 80‐120 EPWU
TURBIDITY,LAB NEPHELOMETRIC TURBIDITY
UNITS, NTUNTU water SM 2130B 82079 0.5 0.1 NA NA NA EPWU
The EPWU lab analyzes samples collected by the USIBWC American Dam field office.
References:
United States Environmental Protection Agency (USEPA) Methods for Chemical Analysis of Water and Wastes, Manual #EPA‐600/4‐79‐020
American Public Health Association (APHA), American Water Works Association (AWWA), and Water Environment Federation (WEF), Standard Methods for the Examination of Water and
Wastewater, 20th Edition, 1998. (Note: The 21st edition may be cited if it becomes available.)
TCEQ SOP, V1 ‐ TCEQ Surface Water Quality Monitoring Procedures, Volume 1: Physical and Chemical Monitoring Methods, 2012 (RG‐415).
TCEQ SOP, V2 ‐ TCEQ Surface Water Quality Monitoring Procedures, Volume 2: Methods for Collecting and Analyzing Biological Assemblage and Habitat Data, 2014 (RG‐416)
Conventional Parameters in WaterTABLE A7.12 Measurement Performance Specifications for El Paso Water Utilities Laboratory
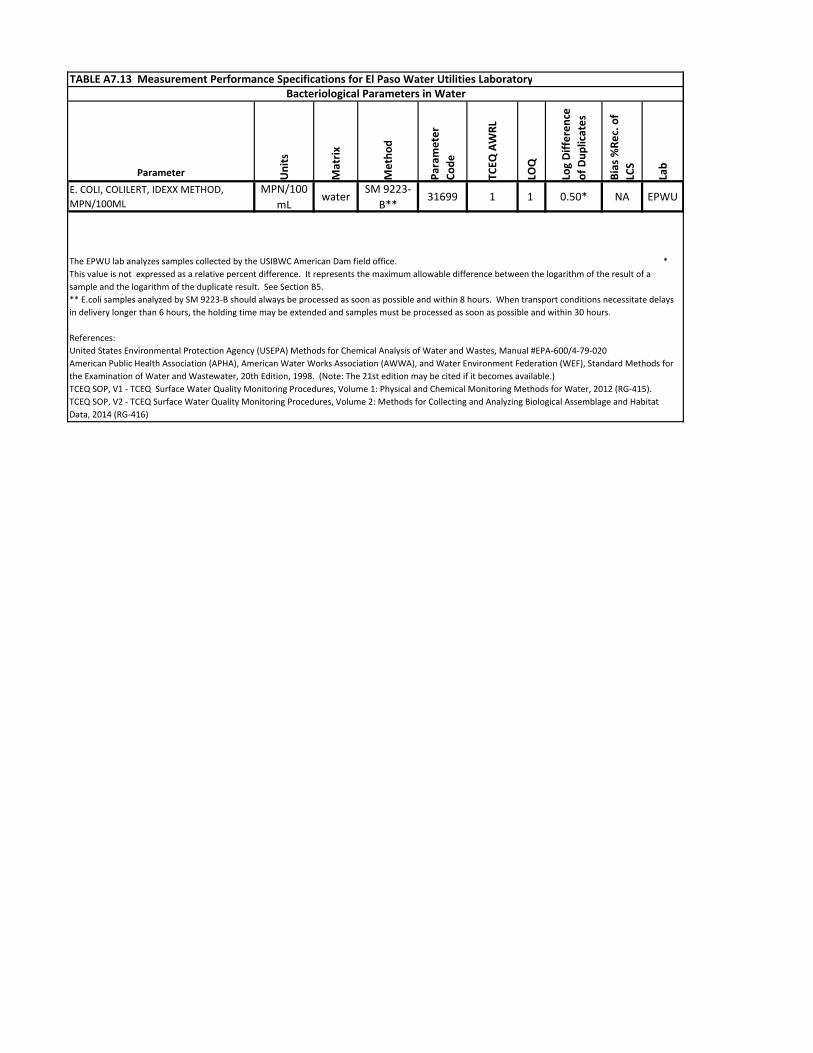
Parameter Units
Matrix
Method
Param
eter
Code
TCEQ
AWRL
LOQ
Log Difference
of Duplicates
Bias %Rec. of
LCS
Lab
E. COLI, COLILERT, IDEXX METHOD,
MPN/100ML
MPN/100
mLwater
SM 9223‐
B**31699 1 1 0.50* NA EPWU
TABLE A7.13 Measurement Performance Specifications for El Paso Water Utilities LaboratoryBacteriological Parameters in Water
The EPWU lab analyzes samples collected by the USIBWC American Dam field office. *
This value is not expressed as a relative percent difference. It represents the maximum allowable difference between the logarithm of the result of a
sample and the logarithm of the duplicate result. See Section B5.
** E.coli samples analyzed by SM 9223‐B should always be processed as soon as possible and within 8 hours. When transport conditions necessitate delays
in delivery longer than 6 hours, the holding time may be extended and samples must be processed as soon as possible and within 30 hours.
References:
United States Environmental Protection Agency (USEPA) Methods for Chemical Analysis of Water and Wastes, Manual #EPA‐600/4‐79‐020
American Public Health Association (APHA), American Water Works Association (AWWA), and Water Environment Federation (WEF), Standard Methods for
the Examination of Water and Wastewater, 20th Edition, 1998. (Note: The 21st edition may be cited if it becomes available.)
TCEQ SOP, V1 ‐ TCEQ Surface Water Quality Monitoring Procedures, Volume 1: Physical and Chemical Monitoring Methods for Water, 2012 (RG‐415).
TCEQ SOP, V2 ‐ TCEQ Surface Water Quality Monitoring Procedures, Volume 2: Methods for Collecting and Analyzing Biological Assemblage and Habitat
Data, 2014 (RG‐416)

USIBWC FY16-17 QAPP Page 81 Last revised on August 18, 2015 USIBWC CRP QAPP FY1617
Appendix B: Task 3 Work Plan & Sampling Process Design and
Monitoring Schedule (Plan)
Task 3: Water Quality Monitoring
Objectives: Water quality monitoring will focus on collecting information to characterize water quality in a variety of locations and conditions. These efforts will include a combination of:
planning and coordinating basin-wide monitoring;
routine, regularly-scheduled monitoring to collect long-term information and support statewide assessment of water quality;
systematic, regularly-scheduled short-term monitoring to screen water bodies for issues;
permit support monitoring to provide information for setting permit effluent limits; and
special study, intensive monitoring targeted to: o identify sources and causes of pollution; o assess priority water quality issues; o obtain background water quality information; o provide information for setting site-specific permit effluent limits; and o evaluate statewide, regional, and site-specific water quality standards.
Task Description: The study area encompasses the Rio Grande from the Texas-New Mexico border upstream of El Paso, Texas downstream to the Gulf of Mexico, including 1,255 miles of the international border with Mexico. For planning purposes the basin has been divided into 4 sub-basins as follows: the Upper Rio Grande Sub-Basin from El Paso to Amistad Dam; the Pecos River Sub-Basin from Red Bluff Reservoir to the confluence with the Rio Grande; the Middle Rio Grande Sub-Basin extending from below Amistad Dam downstream to Falcon Dam; and the Lower Rio Grande Sub-Basin from below Falcon Dam to the Gulf of Mexico. Monitoring Description - The actual number of sites, location, frequency and parameters collected for FY 2016 will be based on priorities identified at the Basin Advisory Committee Meetings, CMMs and included in the amended Appendix B schedule of the QAPP. USIBWC El Paso Headquarters and partner agencies collect water quality data at 58 stations throughout the basin. The parameter groups that may be collected include: field, conventionals, bacteria, flow (when possible), organics in sediment, and metals in water.
NOTE: Certain lab analyses for 32 of the stations listed above will be paid for outside of this Contract, either through funds from IBWC or in-kind services provided by partnering laboratories. Data from all 58 stations are included in IBWC’s QAPP. Additional details concerning the monitoring activities conducted by the USIBWC El Paso Headquarters are outlined in the USIBWC El Paso Headquarters QAPP. In general the USIBWC and all of the USIBWC’s partners will follow the guidelines prescribed in the USIBWC El Paso Headquarters QAPP, the TCEQ Surface Water Quality Monitoring Procedures, Volume 1: Physical and Chemical Monitoring Methods, 2012 (RG-415) and the TCEQ Surface Water Quality Monitoring Procedures, Volume 2: Methods for Collecting and Analyzing Biological Assemblage and Habitat Data, 2007 (RG-416).
USIBWC FY16-17 QAPP Page 82 Last revised on August 18, 2015 USIBWC CRP QAPP FY1617
Coordinated Monitoring Meeting - The USIBWC El Paso Headquarters will hold four annual coordinated monitoring meetings. USIBWC has traditionally held CMMs for the Upper, Middle and Lower Rio Grande Sub-Basins and a fourth for the Pecos River Sub-Basin. Additional CMMs may be added to facilitate attendance of partners covering a large geographical area. Qualified monitoring organizations will be invited to attend the working meeting in which monitoring needs and purposes will be discussed segment by segment and station by station. Information from participants and stakeholders will be used to select stations and parameters that will enhance overall water quality monitoring coverage, eliminate duplication of effort, and address basin priorities. A summary of the changes to the monitoring schedule will be provided to the participants within two weeks of the meeting. The changes to the monitoring schedule will be entered into the statewide database on the Internet (http://cms.lcra.org) and communicated to meeting attendees. Changes to monitoring that occur during the course of the year will be entered into the statewide database on the Internet and communicated to meeting attendees. Progress Report - Each Progress Report will include all types of monitoring and indicate the number of sampling events and the types of monitoring conducted in the quarter. Special Studies - Status reports of each special study will describe activities during the quarter. The status reports will be submitted along with the Progress Report. To help keep the public and basin stakeholders informed, the Web site will be updated in a timely manner to include key elements of Special Studies’ Reports or Summaries (e.g., status reports, executive summary, maps, data analysis). Deliverables & Dues Dates: September 1, 2015 through August 31, 2016
A. Conduct water quality monitoring, summarize activities, and submit with Progress Report - December 15, 2015; March 15 and June 15, 2016
B. Coordinated Monitoring Meeting - between March 15 and April 30, 2016 C. Coordinated Monitoring Meeting Summary of Changes - within two weeks of the meeting D. Email notification that Coordinated Monitoring Schedule updates are complete - May 31,
2016 E. Special Study - Status Reports - December 15, 2015; March 15 and June 15, 2016 F. Special Study - Draft Report - coordinate due date with TCEQ Project Manager G. Special Study - Final Report - coordinate due date with TCEQ Project Manager H. Special Study - post Final Report to Web - coordinate due date with TCEQ Project Manager
September 1, 2016 through August 31, 2017
A. Conduct water quality monitoring, summarize activities, and submit with Progress Report - September 15 and December 15, 2016; March 15 and June 15 and August 31, 2017
B. Coordinated Monitoring Meeting - between March 15 and April 30, 2017 C. Coordinated Monitoring Meeting Summary of Changes – within two weeks of the meeting D. Email notification that Coordinated Monitoring Schedule updates are complete - May 31,
2017
USIBWC FY16-17 QAPP Page 83 Last revised on August 18, 2015 USIBWC CRP QAPP FY1617
E. Special Study - Status Reports - September 15 and December 15, 2016; March 15 and June 15, 2017
F. Special Study - Draft Report - coordinate due date with TCEQ Project Manager G. Special Study - Final Report - coordinate due date with TCEQ Project Manager H. Special Study - post Final Report to Web - coordinate due date with TCEQ Project Manager

USIBWC FY16-17 QAPP Page 84 Last revised on August 18, 2015 USIBWC CRP QAPP FY1617
Appendix B Sampling Process Design and Monitoring Schedule (plan)
Sample Design Rationale FY 2016
The following changes or additions have been made to the monitoring schedule. These changes have come about because of concerns or requests of steering committee members or monitoring entities. Upper: Site 20558 removed from schedule until further notice. Partner has no sampling personnel at this time. Metals-in-water monitoring has been removed from all El Paso sites due to non-detects. Metals-in-water monitoring will continue in Presidio and state and national parks areas. Middle: Metals-in-water monitoring has been removed from all sites except Manadas Creek in
Laredo. Lower: No changes. Pecos: Station 14163 will be adding E.coli testing to their water monitoring.
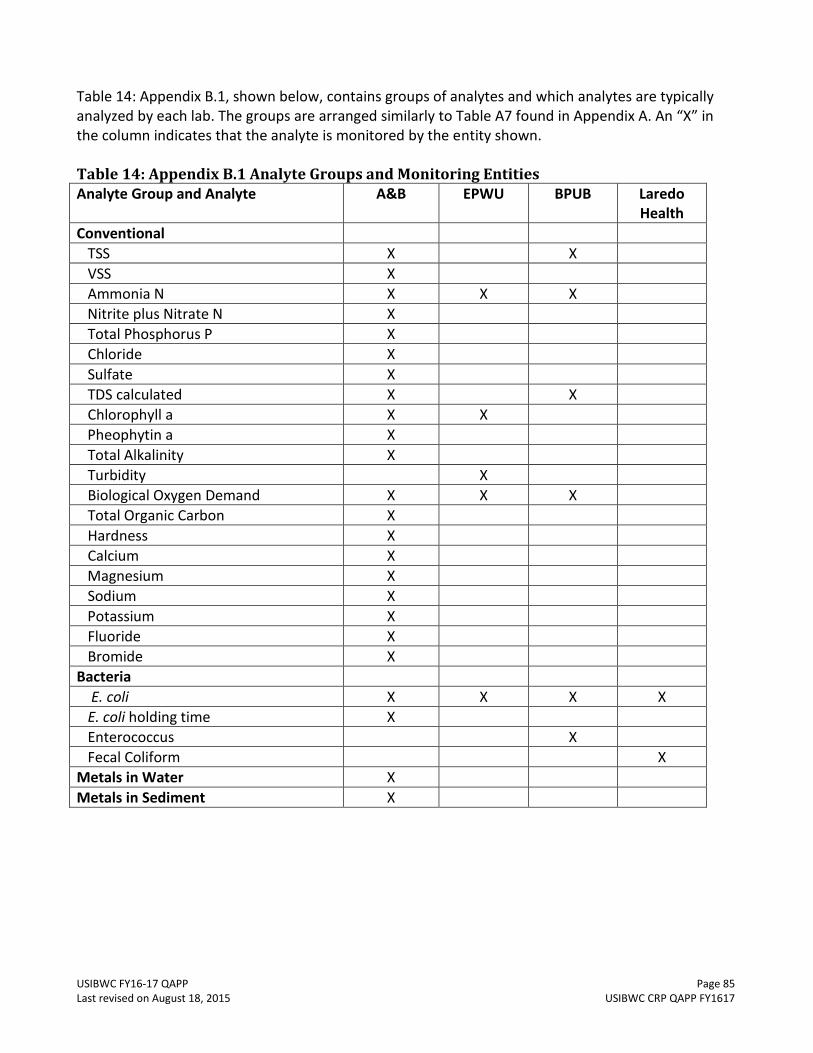
USIBWC FY16-17 QAPP Page 85 Last revised on August 18, 2015 USIBWC CRP QAPP FY1617
Table 14: Appendix B.1, shown below, contains groups of analytes and which analytes are typically analyzed by each lab. The groups are arranged similarly to Table A7 found in Appendix A. An “X” in the column indicates that the analyte is monitored by the entity shown. Table 14: Appendix B.1 Analyte Groups and Monitoring Entities Analyte Group and Analyte A&B EPWU BPUB Laredo
Health
Conventional
TSS X X
VSS X
Ammonia N X X X
Nitrite plus Nitrate N X
Total Phosphorus P X
Chloride X
Sulfate X
TDS calculated X X
Chlorophyll a X X
Pheophytin a X
Total Alkalinity X
Turbidity X
Biological Oxygen Demand X X X
Total Organic Carbon X
Hardness X
Calcium X
Magnesium X
Sodium X
Potassium X
Fluoride X
Bromide X
Bacteria
E. coli X X X X
E. coli holding time X
Enterococcus X
Fecal Coliform X
Metals in Water X
Metals in Sediment X

USIBWC FY16-17 QAPP Page 86 Last revised on August 18, 2015 USIBWC CRP QAPP FY1617
Table 15: Appendix B.2, shown below, specifies which lab each CRP partners sends their samples to for analysis. The groups are arranged similarly to Table A7 found in Appendix A. An “X” in the column indicates that the sends their samples to that particular lab. Table 15: Appendix B.2 CRP Partners and their Affiliated Lab Partner A&B EPWU BPUB Laredo
Health USIBWC American Dam Field Office Bacteria
Conventionals
USIBWC Amistad Dam Field Office Conventionals Bacteria
Metals in Sed
USIBWC Falcon Dam Field Office Conventionals Bacteria
USIBWC Presidio Field Office Conventionals Bacteria
Metals in Wat
USIBWC Mercedes Field Office Conventionals Bacteria
Big Bend National Park Conventionals Bacteria
Metals in Wat
Brownsville Public Utilities Board Bacteria Conventionals
El Paso Community College (with CRP) Conventionals Bacteria
City of Laredo Environmental Services Conventionals Bacteria
Metals in Wat Metals in Sed
City of Laredo Health Department Bacteria
Rio Grande International Study Center Conventionals Bacteria
TX Parks and Wildlife Department Conventionals Bacteria
Metals in Wat
University of Texas at Brownsville** Conventionals Bacteria (2)
Bacteria (entero at 2)
Midland College Conventionals Bacteria
University of TX at El Paso- Walsh (by herself and with CRP)
Conventionals Bacteria
USIBWC El Paso Headquarters Conventionals Bacteria
*Falcon Dam Field Office Station 13103 collects only TDS, T. Phosphorus, Nitrate+Nitrite, Ammonia and bacteria when there is flow. **UTB samples four sites, two tidal and two non-tidal stations. The non-tidal station bacteria samples are sent to A&B for E.coli analysis, and the two tidal station bacteria samples are sent to BPUB for Entero analysis.

USIBWC FY16-17 QAPP Page 87 Last revised on August 18, 2015 USIBWC CRP QAPP FY1617
Table 16: Appendix B.3, shown below, contains the CRP partners and what field sheets each partner uses. An “X” in the column indicates that the partner uses that particular field sheet(s).
Table 16: Appendix B.3 CRP Partners and their Field Sheets Partner Field form
With Turbidity
Field form without turbidity
Sediment sample
field form
Drought field form
Partial Field Form
USIBWC American Dam Field Office
X
USIBWC Amistad Dam Field Office X X X
USIBWC Falcon Dam Field Office X
USIBWC Presidio Field Office X X
USIBWC Mercedes Field Office X
Big Bend National Park X X
Brownsville Public Utilities Board
El Paso Community College (with CRP)
X X
City of Laredo Environmental Services
X X X
City of Laredo Health Department X
Rio Grande International Study Center
X
TX Parks and Wildlife Department X X
University of Texas at Brownsville X
Midland College X X
University of TX at El Paso- Walsh (by herself and with CRP)
X X
USIBWC El Paso Headquarters X X

USIBWC FY16-17 QAPP Page 88 Last revised on August 18, 2015 USIBWC CRP QAPP FY1617
Site Selection Criteria
This data collection effort involves monitoring routine water quality, using procedures that are consistent with the TCEQ SWQM program, for the purpose of data entry into the SWQMIS database maintained by the TCEQ. To this end, some general guidelines are followed when selecting sampling sites, as basically outlined below, and discussed thoroughly in SWQM Procedures. Overall consideration is given to accessibility and safety. All monitoring activities have been developed in coordination with the CRP Steering Committee and with the TCEQ. The site selection criteria set forth here may not apply to all programs. The site selection criteria specified are those the TCEQ would like considered in order to produce data which is complementary to that collected by the state and which can be used in assessments, etc. Other criteria may be considered and should be described. 1. Locate stream sites so that samples can be safely collected from the centroid of flow. Centroid is
defined as the midpoint of that portion of stream width which contains 50 percent of the total flow. If few sites are available for a stream segment, choose one that would best represent the water body, and not an unusual condition or contaminant source. Avoid backwater areas or eddies when selecting a stream site.
2. At a minimum for reservoirs, locate sites near the dam (reservoirs) and in the major arms. Larger reservoirs might also include stations in the middle and upper (riverine) areas. Select sites that best represent the water body by avoiding coves and back water areas. A single monitoring site is considered representative of 25 percent of the total reservoir acres, but not more than 5,120 acres.
3. Routine monitoring sites are selected to maximize stream coverage or basin coverage. Very long segments may require more stations. As a rule of thumb, stream segments between 25 and 50 miles long require two stations, and longer than 50 miles require three or more depending on the existence of areas with significantly different sources of contamination or potential water quality concerns. Major hydrological features, such as the confluence of a major tributary or an instream dam, may also limit the spatial extent of an assessment based on one station.
4. Because historical water quality data can be very useful in assessing use attainment or impairment, it may be best to use sites that are on current or past monitoring schedules.
5. All classified segments (including reservoirs) should have at least one routine monitoring site that adequately characterizes the water body, and should be coordinated with the TCEQ or other qualified monitoring entities reporting routine data to TCEQ.
6. Routine monitoring sites may be selected to bracket sources of pollution, influence of tributaries, changes in land uses, and hydrological modifications.
7. Sites should be accessible. When possible, stream sites should have a USGS or IBWC stream flow gauge. If not, it should be possible to conduct flow measurement during routine visits.

USIBWC FY16-17 QAPP Page 89 Last revised on August 18, 2015 USIBWC CRP QAPP FY1617
Monitoring Sites for FY 2016
Site Description
Station ID
Waterbody
ID
Basin
Region
SE CE MT
Field
Conv Bact Flow
24 hr DO
Aq Hab
Ben Nek MetWat
Org Wat
Met Sed
Org Sed
Fish Tissue
Amb Tox Wat
Amb Tox Sed
Comments
RIO GRANDE RIVER AT SABAL PALM SANCTUARY 370 METERS SOUTH AND 310 METERS EAST FROM THE INTERSECTION OF DAKOTA AVE AND SABAL PALM GROVE ROAD
16288 2301 23 15 IB UB RT 4 4 4
entero analyzed by BPUB. Conventionals by IBWC lab.
RIO GRANDE RIVER TIDAL AT THE END OF QUICKSILVER AVE 375 METERS SOUTH FROM THE INTERSECTION OF BOCA CHICA BLVD AND QUICKSILVER AVE
13176 2301 23 15 IB UB RT 4 4 4
RIO GRANDE 0.5 MI DOWNSTREAM ANZALDUAS DAM 12.2 MI FROM HIDALGO
13664 2302 23 15 IB IB RT 8 8 8 8
RIO GRANDE 300M UPSTREAM OF PHARR INTERNATIONAL BRIDGE/US 281
15808 2302 23 15 IB IB RT 8 8 8 8
RIO GRANDE AT EL JARDIN PUMP STATION LOCATED 350 METERS WEST OF INTERSECTION OF MONSEES ROAD AND CALLE MILPA VERDE
13177 2302 23 15 IB IB RT 8 8 8 8

USIBWC FY16-17 QAPP Page 90 Last revised on August 18, 2015 USIBWC CRP QAPP FY1617
Site Description Station ID
Waterbody ID
Basin
Region SE CE MT Fiel
d Conv Bact Flow
24 hr DO
Aq Hab Ben Nek Met
Wat Org Wat
Met Sed
Org Sed
Fish Tissue
Amb Tox Wat
Amb Tox Sed
Comments
RIO GRANDE AT FM 886 NEAR LOS EBANOS
13184 2302 23 15 IB IB RT 7 7 7 7
RIO GRANDE AT FORT RINGGOLD 1 MI DOWNSTREAM OF RIO GRANDE CITY
13185 2302 23 15 IB IB RT 12 12 12 12
RIO GRANDE DOWNSTREAM RIO ALAMO NEAR FRONTON
13186 2302 23 15 IB IB RT 8 8 8 8
RIO GRANDE INTERNATIONAL BRIDGE ON US 77 AT BROWNSVILLE
13178 2302 23 15 IB UB RT 4 4 4
RIO GRANDE RIVER AT BROWNSVILLE PUB WATER TREATMENT PLANT NUMBER 1 INTAKE BETWEEN WTP RESERVOIR AND RIO GRANDE LEVEE 910 METERS WEST AND 335 METERS SOUTH TO THE INTERSECTION OF WEST ELIZABETH STREET AND SOUTH MILITARY ROAD
20449 2302 23 15 IB BO RT 12 12 E. coli and limited conventionals
RIO GRANDE RIVER AT HWY 281/INTERNATIONAL BLVD IN HIDALGO
13181 2302 23 15 IB IB RT 8 8 8 8
RIO GRANDE RIVER AT RIVER BEND GOLF COURSE BOAT RAMP WEST OF BROWNSVILLE
13179 2302 23 15 IB UB RT 4 4 4

USIBWC FY16-17 QAPP Page 91 Last revised on August 18, 2015 USIBWC CRP QAPP FY1617
Site Description Station ID
Waterbody ID
Basin
Region SE CE MT Fiel
d Conv Bact Flow
24 hr DO
Aq Hab Ben Nek Met
Wat Org Wat
Met Sed
Org Sed
Fish Tissue
Amb Tox Wat
Amb Tox Sed
Comments
LOS OLMOS CREEK AT US 83/EAST 2ND STREET SOUTH OF RIO GRANDE CITY
13103 2302A 23 15 IB IB BF 3 3 3
Bacteria nitrates and field collected when flowing
FALCON LAKE AT INTERNATIONAL BOUNDARY MONUMENT I
13189 2303 23 16 IB IB RT 4 4 4
FALCON RESERVOIR AT SAN YGNACIO WTP INTAKE WEST OF US 83 INTERSECTION WITH FM 3169
15818 2303 23 16 IB RN RT 2 2 2
RIO GRANDE 115 METERS SOUTH AND 304 METERS WEST FROM THE INTERSECTION OF RANCHO VIEJO DRIVE/ZEBU COURT AND RIENDA DRIVE IN FATHER MCNABOE CITY PARK IN LAREDO
20650 2304 23 16 IB LA RT 12 12 ecoli and fecal
RIO GRANDE 12.8 MI DOWNSTREAM AMISTAD DAM NEAR GAGE 340 M UPSTREAM OF US 277 BRIDGE IN DEL RIO
13208 2304 23 16 IB IB RT 2 2 2 2
RIO GRANDE 4.5 MI DOWNSTREAM OF DEL RIO AT MOODY RANCH
13560 2304 23 16 IB IB RT 4 4 4 4
frequency reduced FY12 to add another station in Eagle Pass (20997)
RIO GRANDE 50 YD UPSTREAM OF CONFLUENCE OF ZACATA CREEK AND RIO GRANDE
13200 2304 23 16 IB LA RT 12 12
site used to be reported as 13201 but site is still same - Azteca park

USIBWC FY16-17 QAPP Page 92 Last revised on August 18, 2015 USIBWC CRP QAPP FY1617
Site Description Station ID
Waterbody ID
Basin
Region SE CE MT Fiel
d Conv Bact Flow
24 hr DO
Aq Hab Ben Nek Met
Wat Org Wat
Met Sed
Org Sed
Fish Tissue
Amb Tox Wat
Amb Tox Sed
Comments
RIO GRANDE AT APACHE RANCH WEST OF INTERSECTION OF PRIVATE ROAD AND EASTERN AIRSTRIP NO BETWEEN LARADO AND EAGLE PASS
17596 2304 23 16 IB IB RT 4 4 4 4
RIO GRANDE AT EL CENIZO PARK 220 METERS WEST OF INTERSECTION OF CADENA AND JIMENEZ
21542 2304 23 16 IB RN RT 4 4 4
RIO GRANDE AT JUAREZ-LINCOLN INTERNATIONAL BRIDGE / BRIDGE #2 IN LAREDO
15814 2304 23 16 IB LA RT 12 12 12
E. coli and FC; flow from IBWC gage; field data
RIO GRANDE AT JUAREZ-LINCOLN INTERNATIONAL BRIDGE / BRIDGE #2 IN LAREDO
15814 2304 23 16 IB RN RT 4 4 4 4
RIO GRANDE AT KICKAPOO CASINO BOAT RAMP SOUTH OF EAGLE PASS
20999 2304 23 16 IB IB RT 8 8 8 8 4 replaces 18795 and 18792
RIO GRANDE AT MAIN STREET BOAT RAMP APPROX 400 METERS UPSTREAM OF US 57/INTERNATIONAL BRIDGE IN EAGLE PASS
20997 2304 23 16 IB IB RT 4 4 4 4 2
new station FY12 to fill data gap in AU 2304_08

USIBWC FY16-17 QAPP Page 93 Last revised on August 18, 2015 USIBWC CRP QAPP FY1617
Site Description Station ID
Waterbody ID
Basin
Region SE CE MT Fiel
d Conv Bact Flow
24 hr DO
Aq Hab Ben Nek Met
Wat Org Wat
Met Sed
Org Sed
Fish Tissue
Amb Tox Wat
Amb Tox Sed
Comments
RIO GRANDE AT MASTERSON RD IN LAREDO 9.9KM DWNSTR INTL BRIDGE #1/WEST BRIDGE DWNSTR SOUTHSIDE WWTP AND UPSTREAM NUEVO LAREDO WWTP
15815 2304 23 16 IB LA RT 12 12 ecoli and fecal coliform, and field data
RIO GRANDE AT RIO BRAVO 0.5KM DWNSTR OF THE COMMUNITY OF EL CENIZO
15816 2304 23 16 IB RN RT 4 4 4 Reactivated for FY 15
RIO GRANDE AT THE COLOMBIA BRIDGE 2.7KM UPSTREAM OF THE DOLORES PUMP STATION 45.1KM UPSTREAM OF THE LAREDO WTP INTAKE
15839 2304 23 16 IB LA RT 12 12 12
E. coli and FC; flow from IBWC gage; field data
RIO GRANDE AT WEBB/ZAPATA COUNTY LINE
15817 2304 23 16 IB RN RT 12 12 12 12
RIO GRANDE AT WORLD TRADE BRIDGE ON FM 3484
17410 2304 23 16 IB RN RT 4 4 4 4
RIO GRANDE LAREDO WATER TREATMENT PLANT PUMP INTAKE
13202 2304 23 16 IB LA RT 12 12 E. coli and FC, and field
RIO GRANDE LAREDO WATER TREATMENT PLANT PUMP INTAKE
13202 2304 23 16 IB RN RT 4 4 4 4

USIBWC FY16-17 QAPP Page 94 Last revised on August 18, 2015 USIBWC CRP QAPP FY1617
Site Description Station ID
Waterbody ID
Basin
Region SE CE MT Fiel
d Conv Bact Flow
24 hr DO
Aq Hab Ben Nek Met
Wat Org Wat
Met Sed
Org Sed
Fish Tissue
Amb Tox Wat
Amb Tox Sed
Comments
MANADAS CREEK AT FM 1472 NORTH OF LAREDO
13116 2304B 23 16 IB LE RT 4 4 4 4 1
Also collecting metals in water, lab-filtered not field filtered. therefore not submitted to SWQMIS but available on IBWC website.
RIO GRANDE 1.04 KILOMETERS EAST AND 367 METERS SOUTH FROM THE SOUTH END OF FOSTERS RANCH ROAD IN VAL VERDE COUNTY
20627 2305 23 16 IB BB RT 1
field data collected at least once a year by canoe
RIO GRANDE 1.35 KILOMETERS DOWNSTREAM FROM LANGTRY CREEK AND PUMP CANYON AND 870 METERS EAST AND 350 METERS SOUTH FROM THE INTERSECTION OF STATE PARK ROAD 25 AND TORRES AVENUE IN VAL VERDE COUNTY
20630 2305 23 16 IB BB RT 1
field data collected at least once a year by canoe
RIO GRANDE 3.03 KILOMETERS UPSTREAM OF RATTLESNAKE CANYON SOUTHWEST OF LANGTRY
20624 2305 23 16 IB BB RT 1
field data collected at least once a year by canoe

USIBWC FY16-17 QAPP Page 95 Last revised on August 18, 2015 USIBWC CRP QAPP FY1617
Site Description Station ID
Waterbody ID
Basin
Region SE CE MT Fiel
d Conv Bact Flow
24 hr DO
Aq Hab Ben Nek Met
Wat Org Wat
Met Sed
Org Sed
Fish Tissue
Amb Tox Wat
Amb Tox Sed
Comments
RIO GRANDE 1.3 KILOMETERS DOWNSTREAM OF BEAR CANYON AND APPROXIMATELY 9.3 KILOMETERS DOWNSTREAM OF COOK CREEK IN TERRELL COUNTY
20628 2306 23 7 IB BB RT 1
field data collected at least once a year by canoe
RIO GRANDE 1.895 KILOMETERS SOUTH AND 552 METERS WEST FROM THE INTERSECTION OF UNNAMED STREET AND FOSTER RANCH ROAD AND 10.1021 KILOMETERS SOUTH AND 4.37 KILOMETERS WEST FROM THE INTERSECTION OF US HIGHWAY 90 AND FOSTERS RANCH ROAD IN VAL VERDE COUNTY CAM
13223 2306 23 16 IB BB RT 1
field data will be reported at least once in the year.
RIO GRANDE 449 METERS WEST AND 121 METERS SOUTH FROM THE INTERSECTION OF RANCH ROAD 170 AND RANCH ROAD 169 IN PRESIDIO COUNTY CAMS 758
13229 2306 23 6 IB IB RT 8 8 8 8 2
Metals - Total Mercury sampled since FY12
RIO GRANDE 50 METERS UPSTREAM OF SILBER CANYON SOUTH OF SANDERSON IN BREWSTER COUNTY
20625 2306 23 6 IB BB RT 1
field data collected at least once a year by canoe

USIBWC FY16-17 QAPP Page 96 Last revised on August 18, 2015 USIBWC CRP QAPP FY1617
Site Description Station ID
Waterbody ID
Basin
Region SE CE MT Fiel
d Conv Bact Flow
24 hr DO
Aq Hab Ben Nek Met
Wat Org Wat
Met Sed
Org Sed
Fish Tissue
Amb Tox Wat
Amb Tox Sed
Comments
RIO GRANDE 570 METERS NORTH AND 605 METERS WEST FROM THE SOUTH END OF SHAFTER CROSSING ROAD AND 1.90 KILOMETERS DOWNSTREAM OF BRITTON CANYON IN TERRELL COUNTY
20629 2306 23 7 IB BB RT 1
field data collected at least once a year by canoe
RIO GRANDE 7.5 KILOMETERS UPSTREAM FROM THE CONFLUENCE WITH SAN FRANCISCO CREEK IN BREWSTER COUNTY
20632 2306 23 6 IB BB RT 1
field data collected at least once a year by canoe
RIO GRANDE AT BOAT RAMP AT RIO GRANDE VILLAGE IN BIG BEND NATIONAL PARK
16730 2306 23 6 IB BB RT 8 8 8 8 2
Metals - Total Mercury sampled since FY12
RIO GRANDE AT BOQUILLAS CROSSING IN BIG BEND NATIONAL PARK
20619 2306 23 6 IB BB RT 1
field data collected at least once a year by canoe
RIO GRANDE AT FM 2627/GERSTACKER BRIDGE DOWNSTREAM BIG BEND
13225 2306 23 6 IB BB RT 1
field data will be reported at least once in the year
RIO GRANDE AT HORSE CANYON 2.4 MI DOWNSTREAM OF GERSTACKER BRIDGE
13224 2306 23 6 IB BB RT 1
field data will be reported at least once in the year

USIBWC FY16-17 QAPP Page 97 Last revised on August 18, 2015 USIBWC CRP QAPP FY1617
Site Description Station ID
Waterbody ID
Basin
Region SE CE MT Fiel
d Conv Bact Flow
24 hr DO
Aq Hab Ben Nek Met
Wat Org Wat
Met Sed
Org Sed
Fish Tissue
Amb Tox Wat
Amb Tox Sed
Comments
RIO GRANDE AT LAJITAS RESORT/FM 170 BOAT RAMP 240 M UPSTREAM OF BLACK HILLS CREEK CONFLUENCE NEAR LAJITAS
18441 2306 23 6 IB PW RT 4 4 4 2
Metals - Total Mercury sampled since FY12
RIO GRANDE AT PRESIDIO RAILROAD BRIDGE 3.25KM DOWNSTREAM OF US67 SOUTH OF PRESIDIO
17000 2306 23 6 IB IB RT 8 8 8
RIO GRANDE AT PRESIDIO/OJINAGA TOLL BRIDGE/INTERNATIONAL 0.75KM DOWNSTREAM OF US67 IN PRESIDIO
17001 2306 23 6 IB IB RT 8 8 8
RIO GRANDE AT STILLWELL CROSSING
13226 2306 23 6 IB BB RT 1
field data collected by canoe at least once a year.
RIO GRANDE AT TAYLORS FARM SOUTHWEST OF SANDERSON
20623 2306 23 6 IB BB RT 1
field data collected at least once a year by canoe
RIO GRANDE AT THE CONFLUENCE WITH INDIAN CREEK IN TERRELL COUNTY
20631 2306 23 7 IB BB RT 1
field data collected at least once a year by canoe
RIO GRANDE AT THE MOUTH OF SANTA ELENA CANYON
13228 2306 23 6 IB BB RT 8 8 8 8 2
Metals - Total Mercury sampled since FY12
RIO GRANDE DOWNSTREAM OF RODEO RAPIDS SOUTH OF SANDERSON IN BREWSTER COUNTY
20626 2306 23 6 IB BB RT 1
field data collected at least once a year by canoe
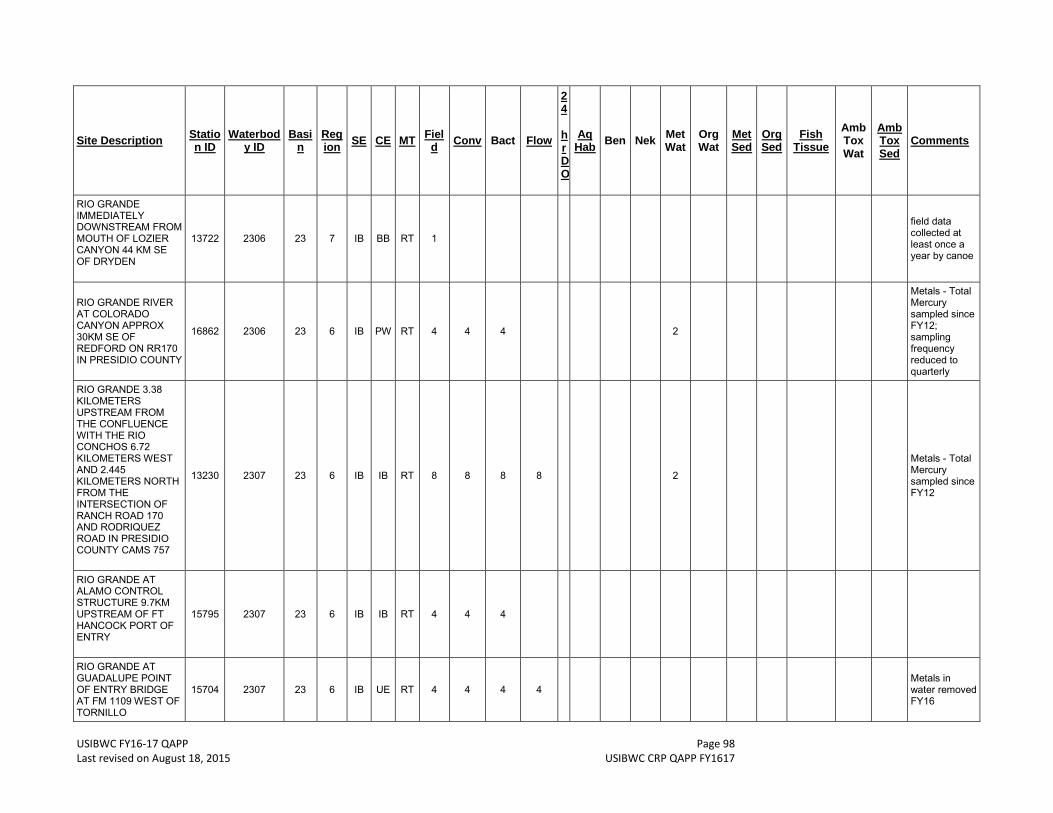
USIBWC FY16-17 QAPP Page 98 Last revised on August 18, 2015 USIBWC CRP QAPP FY1617
Site Description Station ID
Waterbody ID
Basin
Region SE CE MT Fiel
d Conv Bact Flow
24 hr DO
Aq Hab Ben Nek Met
Wat Org Wat
Met Sed
Org Sed
Fish Tissue
Amb Tox Wat
Amb Tox Sed
Comments
RIO GRANDE IMMEDIATELY DOWNSTREAM FROM MOUTH OF LOZIER CANYON 44 KM SE OF DRYDEN
13722 2306 23 7 IB BB RT 1
field data collected at least once a year by canoe
RIO GRANDE RIVER AT COLORADO CANYON APPROX 30KM SE OF REDFORD ON RR170 IN PRESIDIO COUNTY
16862 2306 23 6 IB PW RT 4 4 4 2
Metals - Total Mercury sampled since FY12; sampling frequency reduced to quarterly
RIO GRANDE 3.38 KILOMETERS UPSTREAM FROM THE CONFLUENCE WITH THE RIO CONCHOS 6.72 KILOMETERS WEST AND 2.445 KILOMETERS NORTH FROM THE INTERSECTION OF RANCH ROAD 170 AND RODRIQUEZ ROAD IN PRESIDIO COUNTY CAMS 757
13230 2307 23 6 IB IB RT 8 8 8 8 2
Metals - Total Mercury sampled since FY12
RIO GRANDE AT ALAMO CONTROL STRUCTURE 9.7KM UPSTREAM OF FT HANCOCK PORT OF ENTRY
15795 2307 23 6 IB IB RT 4 4 4
RIO GRANDE AT GUADALUPE POINT OF ENTRY BRIDGE AT FM 1109 WEST OF TORNILLO
15704 2307 23 6 IB UE RT 4 4 4 4 Metals in water removed FY16

USIBWC FY16-17 QAPP Page 99 Last revised on August 18, 2015 USIBWC CRP QAPP FY1617
Site Description Station ID
Waterbody ID
Basin
Region SE CE MT Fiel
d Conv Bact Flow
24 hr DO
Aq Hab Ben Nek Met
Wat Org Wat
Met Sed
Org Sed
Fish Tissue
Amb Tox Wat
Amb Tox Sed
Comments
RIO GRANDE 1.3 KM DOWNSTREAM FROM HASKELL ST WWTP OUTFALL
15528 2308 23 6 IB IB RT 12 12 12 12 partial conventional analysis
RIO GRANDE 2.4 KM UPSTREAM FROM HASKELL ST WWTP OUTFALL SOUTH OF BOWIE HIGH SCHOOL FOOTBALL STADIUM IN EL PASO
15529 2308 23 6 IB IB RT 12 12 12 12 partial conventional analysis
RIO GRANDE AT RIVERSIDE CANAL 1.8 KM DOWNSTREAM OF ZARAGOSA INTERNATIONAL BRIDGE
14465 2308 23 16 IB IB RT 12 12 12 12 partial conventional analysis
PECOS RIVER 0.1 KM UPSTREAM OF THE CONFLUENCE WITH INDEPENDENCE CREEK CHANDLER RANCH
13248 2310 23 7 IB MC RT 6 3 6
Collecting conv, field, flow 3x/yr; field and flow only 3 additional times/yr
PECOS RIVER APPROXIMATELY 0.5 MILES DOWNSTREAM FROM THE CONFLUENCE WITH INDEPENDENCE CREEK
14163 2310 23 7 IB MC RT 6 3 3 6
Collecting conv, bacteria, flow, field 3x/yr; field and flow only 3 additional times/yr
RIO GRANDE 40M SOUTH OF VINTON BRIDGE APPROXIMATELY 4 KM S OF ANTHONY
13275 2314 23 6 IB IB RT 4 4 4
in support of Paso del Norte Watershed Councils 319h grant and for stakeholder concerns for bacteria. Total Mercury removed FY16

USIBWC FY16-17 QAPP Page 100 Last revised on August 18, 2015 USIBWC CRP QAPP FY1617
Site Description Station ID
Waterbody ID
Basin
Region SE CE MT Fiel
d Conv Bact Flow
24 hr DO
Aq Hab Ben Nek Met
Wat Org Wat
Met Sed
Org Sed
Fish Tissue
Amb Tox Wat
Amb Tox Sed
Comments
RIO GRANDE AT ANAPRA BRIDGE ON SUNLAND PARK DRIVE 4.2 KM UPSTREAM OF AMERICAN DAM IN NEW MEXICO
17040 2314 23 6 IB EP RT 4 4 4 Total metals in water removed FY16
RIO GRANDE AT BORDERLAND RD NW OF EL PASO
13274 2314 23 6 IB IB RT 4 4
added FY12 in response to public concerns about recreation. Metals in water removed FY16
RIO GRANDE AT COURCHESNE BRIDGE 1.7 MI UPSTREAM FROM AMERICAN DAM CAMS 718
13272 2314 23 6 IB IB RT 12 12 12 12
partial conventional analysis. Additional non-accredited data available with IBWC for metals, organics, and other conventionals.
RIO GRANDE IMMED UPSTREAM OF THE CONFL WITH ANTHONY DRAIN WEST OF LA TUNA PRISON NEAR THE STATE LINE
13276 2314 23 6 IB IB RT 4 4 4
In support of Paso del Norte Watershed Councils 319h grant and for stakeholder recreation concerns. Total Mercury removed FY16

USIBWC FY16-17 QAPP Page 101 Last revised on August 18, 2015 USIBWC CRP QAPP FY1617
Site Description Station ID
Waterbody ID
Basin
Region SE CE MT Fiel
d Conv Bact Flow
24 hr DO
Aq Hab Ben Nek Met
Wat Org Wat
Met Sed
Org Sed
Fish Tissue
Amb Tox Wat
Amb Tox Sed
Comments
RIO GRANDE RIVER AT AMERICAN EAGLE BRICK FACTORY BRIDGE ABANDONED RR 0.1 MI DOWNSTREAM FROM SOUTHERN PACIFIC RR AT SMELTERTOWN
15089 2314 23 6 IB IB RT 3 3 3 Metals in water removed FY16
RIO GRANDE RIVER AT AMERICAN EAGLE BRICK FACTORY BRIDGE ABANDONED RR 0.1 MI DOWNSTREAM FROM SOUTHERN PACIFIC RR AT SMELTERTOWN
15089 2314 23 6 IB UE RT 2
2
Critical vs. non-critical measurements
All data taken for CRP and entered into SWQMIS are considered critical.
USIBWC FY16-17 QAPP Page 102 Last revised on August 18, 2015 USIBWC CRP QAPP FY1617
Appendix C: Station Location Maps

USIBWC FY16-17 QAPP Page 103 Last revised on August 18, 2015 USIBWC CRP QAPP FY1617
Station Location Maps
Maps of stations monitored by the USIBWC are provided below. The maps were generated by the USIBWC. This product is for informational purposes and may not have been prepared for or be suitable for legal, engineering, or surveying purposes. It does not represent an on-the-ground survey and represents only the approximate relative location of property boundaries. For more information concerning this map, contact the USIBWC El Paso Headquarters Program Manager, Leslie Grijalva, at 915-832-4770.

USIBWC FY16-17 QAPP Page 104 Last revised on August 18, 2015 USIBWC CRP QAPP FY1617
Figure 4: Map of the Rio Grande Basin, Northern Half

USIBWC FY16-17 QAPP Page 105 Last revised on August 18, 2015 USIBWC CRP QAPP FY1617
Figure 5: Map of the Upper Rio Grande Basin, Southern Half

USIBWC FY16-17 QAPP Page 106 Last revised on August 18, 2015 USIBWC CRP QAPP FY1617
Figure 6: Map of the Middle Rio Grande Basin

USIBWC FY16-17 QAPP Page 107 Last revised on August 18, 2015 USIBWC CRP QAPP FY1617
Figure 7: Map of the Lower Rio Grande Basin

USIBWC FY16-17 QAPP Page 108 Last revised on August 18, 2015 USIBWC CRP QAPP FY1617
Appendix D: Field Data Sheets

USIBWC FY16-17 QAPP Page 109 Last revised on August 18, 2015 USIBWC CRP QAPP FY1617
UNITED STATES INTERNATIONAL BOUNDARY AND WATER COMMISSION TEXAS CLEAN RIVERS PROGRAM
RIO GRANDE BASIN FIELD DATA REPORTING FORM
TAG# SET # COLLECTOR(printed)
I B TCEQ STATION ID SEGMENT SEQUENCE SE CE MT
Station Description______________________________________________________________________________________
GRAB SAMPLE
M M D D Y Y Y Y H H M M M = meters
DATE
TIME DEPTH
Measurement Comments and Field Observations: ____________________________________________________________________________________________________________________
____________________________________________________________________________________________________________________
_____________________________________________________________________________________________________
Signature of Collector: ___________________________________
00010 WATER TEMP (deg C only) 89835 FLOW MEASUREMENT METHOD 1-Gage 2-Electric 3-Mechanical 4-Weir/flume 5-Doppler
00020 AIR TEMP (deg C only) 74069 ESTIMATED FLOW (cfs)
00400 pH (SU) 89861 STREAM WIDTH (meters)
00300 D.O. (mg/L) 82903 WATER DEPTH (meters)
00094 SPECIFIC CONDUCTANCE (uS/cm) 31616 FECAL COLIFORM (CFU/100 ml)
00078 SECCHI DISK (meters) 31699 E. coli (MPN/100 ml)
72053 DAYS SINCE LAST SIGNIFICANT PRECIPITATION
31704 E. Coli Holding Time (Hours)
01351 FLOW 1-no flow 2-low SEVERITY 3-normal 4-flood 5-high 6-dry
89966 WEATHER 1-clear 2-cloudy 3-overcast 4-rain
89965 WIND INTENSITY 1-calm 2-slight 3-moderate 4-strong
00061 INSTANTANEOUS FLOW (cfs) 89010 WIND DIRECTION 1-north 2-south 3-east 4-west 5-NE 6-SE 7-NW 8-SW
89978 PRIMARY CONTACT, OBSERVED ACTIVITY (# OF PEOPLE OBSERVED)
89979 EVIDENCE OF PRIMARY CONTACT RECREATION (1 = OBSERVED, 0 = NOT OBSERVED)
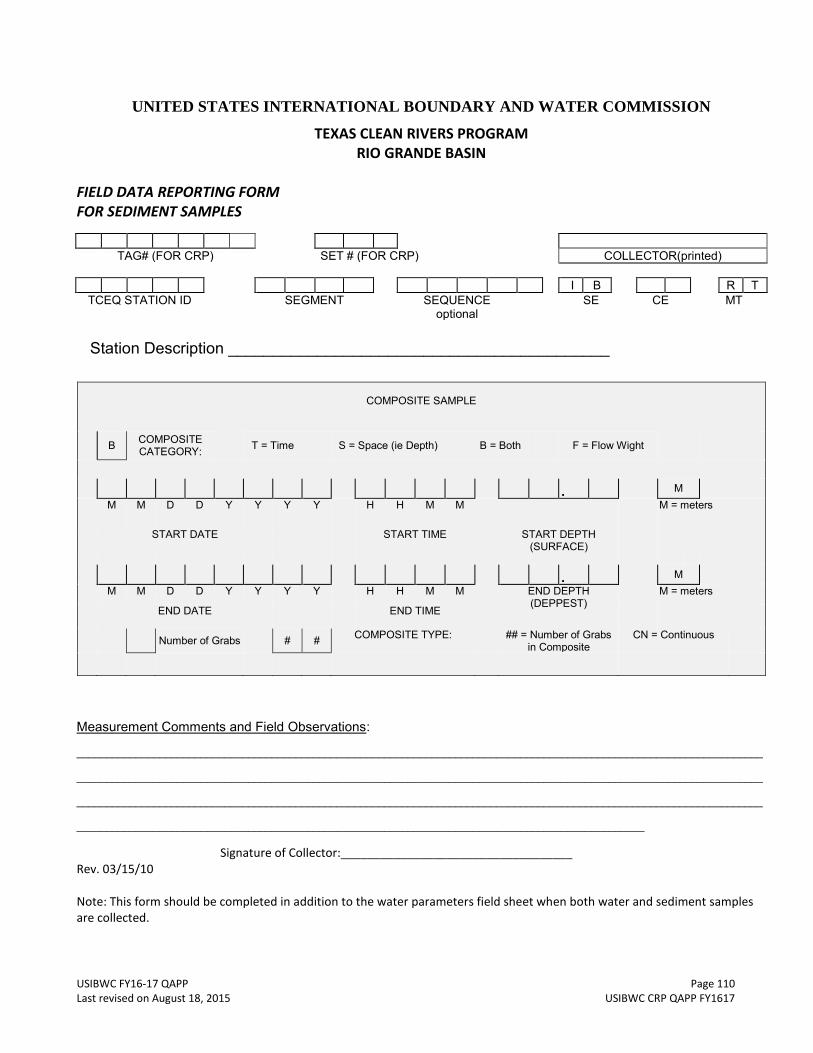
USIBWC FY16-17 QAPP Page 110 Last revised on August 18, 2015 USIBWC CRP QAPP FY1617
UNITED STATES INTERNATIONAL BOUNDARY AND WATER COMMISSION
TEXAS CLEAN RIVERS PROGRAM RIO GRANDE BASIN
FIELD DATA REPORTING FORM FOR SEDIMENT SAMPLES
TAG# (FOR CRP) SET # (FOR CRP) COLLECTOR(printed)
I B R T TCEQ STATION ID SEGMENT SEQUENCE SE CE MT
optional Station Description ___________________________________________
COMPOSITE SAMPLE
B COMPOSITE
CATEGORY:
T = Time S = Space (ie Depth) B = Both F = Flow Wight
. M
M M D D Y Y Y Y H H M M M = meters
START DATE
START TIME START DEPTH (SURFACE)
.
M
M M D D Y Y Y Y H H M M END DEPTH (DEPPEST)
M = meters
END DATE
END TIME
Number of Grabs # # COMPOSITE TYPE: ## = Number of Grabs in Composite
CN = Continuous
Measurement Comments and Field Observations: ____________________________________________________________________________________________________________________
____________________________________________________________________________________________________________________
____________________________________________________________________________________________________________________
________________________________________________________________________________________________
Signature of Collector:___________________________________ Rev. 03/15/10 Note: This form should be completed in addition to the water parameters field sheet when both water and sediment samples are collected.

USIBWC FY16-17 QAPP Page 111 Last revised on August 18, 2015 USIBWC CRP QAPP FY1617
UNITED STATES INTERNATIONAL BOUNDARY AND WATER COMMISSION TEXAS CLEAN RIVERS PROGRAM
RIO GRANDE BASIN
FIELD DATA REPORTING FORM
TAG# SET # COLLECTOR(printed)
I B R N R T TCEQ STATION ID SEGMENT SEQUENCE SE CE MT
Station Description___________________________________________________ ___
GRAB SAMPLE 0 .
3 M
M M D D Y Y Y Y H H M M M = meters
DATE
TIME DEPTH
Measurement Comments and Field Observations: ____________________________________________________________________________________________________________________
____________________________________________________________________________________________________________________
_____________________________________________________________________________________________________
Signature of Collector: ___________________________________ Rev. 08/18/10
00010 WATER TEMP (deg C only) 89835 FLOW MEASUREMENT METHOD 1-Gage 2-Electric 3-Mechanical 4-Weir/flume 5-Doppler
00020 AIR TEMP (deg C only) 74069 ESTIMATED FLOW (cfs)
00400 pH (SU) 89861 STREAM WIDTH (meters)
00300 D.O. (mg/L) 82903 WATER DEPTH (meters)
00094 SPECIFIC CONDUCTANCE (uS/cm) 31616 FECAL COLIFORM (CFU/100 ml)
00078 SECCHI DISK (meters) 31699 E. coli (MPN/100 ml)
72053 DAYS SINCE LAST SIGNIFICANT PRECIPITATION
89966 WEATHER 1-clear 2-cloudy 3-overcast 4-rain
01351 FLOW 1-no flow 2-low SEVERITY 3-normal 4-flood 5-high 6-dry
82078 Turbidity (NTU)
89965 WIND INTENSITY 1-calm 2-slight 3-moderate 4-strong
00061 INSTANTANEOUS FLOW (cfs) 89010 WIND DIRECTION 1-north 2-south 3-east 4-west 5-NE 6-SE 7-NW 8-SW
89978 PRIMARY CONTACT, OBSERVED ACTIVITY (# OF PEOPLE OBSERVED)
89979 EVIDENCE OF PRIMARY CONTACT RECREATION (1 = OBSERVED, 0 = NOT OBSERVED)

USIBWC FY16-17 QAPP Page 112 Last revised on August 18, 2015 USIBWC CRP QAPP FY1617
UNITED STATES INTERNATIONAL BOUNDARY AND WATER COMMISSION
TEXAS CLEAN RIVERS PROGRAM RIO GRANDE BASIN
DROUGHT FIELD DATA REPORTING FORM
TAG# SET # COLLECTOR(printed)
I B TCEQ STATION ID SEGMENT SEQUENCE SE CE MT
Station Description________________________________________________________________________________
GRAB SAMPLE
M M D D Y Y Y Y H H M M M = meters
DATE
TIME DEPTH
Measurement Comments and Field Observations: ____________________________________________________________________________________________________________________
____________________________________________________________________________________________________________________
_____________________________________________________________________________________________________
Signature of Collector: _________________________________________________________ Rev. 3/02/12
00010 WATER TEMP (deg C only) 89865 MAXIMUM POOL DEPTH AT TIME OF SAMPLING
00020 AIR TEMP (deg C only) 89869 POOL LENGTH (meters)
00400 pH (SU) 89870 % POOL COVERAGE IN 500 METER REACH
00300 D.O. (mg/L) 74069 ESTIMATED FLOW (cfs)
00094 SPECIFIC CONDUCTANCE (uS/cm) 89861 STREAM WIDTH (meters)
00078 SECCHI DISK (meters) 82903 WATER DEPTH (meters)
72053 DAYS SINCE LAST SIGNIFICANT PRECIPITATION
31616 FECAL COLIFORM (CFU/100 ml)
01351 FLOW 1-no flow 2-low SEVERITY 3-normal 4-flood 5-high 6-dry
31699 E. coli (MPN/100 ml)
00061 INSTANTANEOUS FLOW (cfs) 89966 WEATHER 1-clear 2-cloudy 3-overcast 4-rain
89835 FLOW MEASUREMENT METHOD 1-Gage 2-Electric 3-Mechanical 4-Weir/flume 5-Doppler
89965 WIND INTENSITY 1-calm 2-slight 3-moderate 4-strong
89864 MAXIMUM POOL WIDTH AT TIME OF SAMPLING (meters)
89010 WIND DIRECTION 1-north 2-south 3-east 4-west 5-NE 6-SE 7-NW 8-SW
89978 PRIMARY CONTACT, OBSERVED ACTIVITY (# OF PEOPLE OBSERVED)
89979 EVIDENCE OF PRIMARY CONTACT RECREATION (1 = OBSERVED, 0 = NOT OBSERVED)

USIBWC FY16-17 QAPP Page 113 Last revised on August 18, 2015 USIBWC CRP QAPP FY1617
TEXAS CLEAN RIVERS PROGRAM RIO GRANDE BASIN
FIELD DATA REPORTING FORM
TAG# SET # COLLECTOR(printed)
TCEQ STATION ID SEGMENT SEQUENCE SE/SC1 CE/SC2 MT/ PC
Station Description________________________________________________________________________________
GRAB SAMPLE 0 .
3 M
M M D D Y Y Y Y H H M M M = meters
DATE
TIME DEPTH
Measurement Comments and Field Observations: ____________________________________________________________________________________________________________________
____________________________________________________________________________________________________________________
____________________________________________________________________________________________________________________
________________________________________________________________________________________________
Signature of Collector:___________________________________ Rev. 08/21/2013
00010 WATER TEMP (deg C only) 31616 FECAL COLIFORM (CFU/100 ml)
00020 AIR TEMP (deg C only) 31699 E. coli (MPN/100 ml)
00094 SPECIFIC CONDUCTANCE (uS/cm) 89978
PRIMARY CONTACT, OBSERVED ACTIVITY (# OF PEOPLE OBSERVED)
72053 DAYS SINCE LAST SIGNIFICANT PRECIPITATION
89979
EVIDENCE OF PRIMARY CONTACT RECREATION (1 = OBSERVED, 0 = NOT OBSERVED)
01351 FLOW 1-no flow 2-low SEVERITY 3-normal 4-flood 5-high 6-dry
89966 WEATHER 1-clear 2-cloudy 3-overcast 4-rain
89965 WIND INTENSITY 1-calm 2-slight 3-moderate 4-strong
89010 WIND DIRECTION 1-north 2-south 3-east 4-west 5-NE 6-SE 7-NW 8-SW

USIBWC FY16-17 QAPP Page 114 Last revised on August 18, 2015 USIBWC CRP QAPP FY1617
Appendix E: Chain of Custody Forms

USIBWC FY16-17 QAPP Page 115 Last revised on August 18, 2015 USIBWC CRP QAPP FY1617
UNITED STATES INTERNATIONAL BOUNDARY AND WATER COMMISSION - TEXAS CLEAN RIVERS PROGRAM RIO GRANDE BASIN PARTNER
WATER QUALITY CHAIN OF CUSTODY/REQUEST FOR ANALYSIS FORM
A&B TAG# LABORATORY COC/LAB/WORK ORDER #
CHAIN OF CUSTODY CLIENT INFORMATION (To be filled out by CRP partner)
Relinquished by (printed): _______________________
Signature: ____________________________________
Date/Time: ___________________________________
No. Of Containers: _____________________________
Type of containers: ____________________________
Preservative used: _____________________________
Turnaround Time: __Standard____________________
(To be filled out by Laboratory)
Received by (printed): __________________________
Signature: ____________________________________
Date/Time: ___________________________________
Cooler Temperature ____________________________
Matrix Type: _______H2O_______________________
(To be filled out by CRP partner)
Requested by: _USIBWC Clean Rivers Program___________
Sample TCEQ Station No.: ____________________________
Sample Location Description:__________________________
__________________________________________________
__________________________________________________
Collected by: _______________________________________
Signature: _________________________________________
Segment/Sequence: _________________________________
Collection Date: ____________________________________
Collection Time: ___________________________________
Conventionals Conventionals
Storet Code
Analyze if
checked
Contract line no.
Parameter Storet Code
Analyze if checked
Contract line no.
Parameter
70300 √ TDS, dried at 180 deg C (mg/L) 00929 √ Sodium (mg/L)
00530 √ TSS (mg/L) 00916 √ Calcium (mg/L)
00535 √ VSS (mg/L) 00927 √ Magnesium (mg/L)
00940 √ Chloride (mg/L) 00935 √ Potassium
00945 √ Sulfate (mg/L) 00951 √ Fluoride (mg/L)
00680 √ TOC (mg/L as C) 00630 √ Nitrate+Nitrite
00610 √ Ammonia (mg/L as N) 00900 √ Total Hardness
00665 √ Total Phosphorus (mg/L as P) 00310 √ BOD (mg/L)
00956 √ Silica (mg/L) ** 00410 √ Total Alkalinity (mg/l)
32218 √ Phaeophytin (ug/L)
32211 √ Chlorophyll-a (ug/L) *All sample containers are provided
31699 √ Ecoli (MPN/100ml) with appropriate preservative.
**Analyzed but not reported to TCEQ
Send samples to: A&B Environmental Services, Inc. 10100 East Freeway, Suite 100 Houston, TX 77029 (P)713-453-6060, (F) 713- 453-6091
Submit report to: Texas Clean Rivers Program USIBWC 4171 N. Mesa, Suite C-100 El Paso, TX 79902
Non-compliance items should be addressed on an attached NCR by the lab. Rev. 04/16/2013

USIBWC FY16-17 QAPP Page 116 Last revised on August 18, 2015 USIBWC CRP QAPP FY1617
UNITED STATES INTERNATIONAL BOUNDARY AND WATER COMMISSION - TEXAS CLEAN RIVERS PROGRAM RIO GRANDE BASIN PARTNER
WATER QUALITY CHAIN OF CUSTODY/REQUEST FOR ANALYSIS FORM
A&B TAG# LABORATORY COC/LAB/WORK ORDER #
CHAIN OF CUSTODY CLIENT INFORMATION (To be filled out by CRP partner)
Relinquished by (printed): ______________________
Signature: ___________________________________
Date/Time: __________________________________
No. Of Containers: ____________________________
Type of containers: ____________________________
Preservative used: _____________________________
Turnaround Time: __Standard____________________
(To be filled out by Laboratory)
Received by (printed): __________________________
Signature: ____________________________________
Date/Time: ___________________________________
Cooler Temperature ____________________________
Matrix Type:_____sediment______________________
(To be filled out by CRP partner)
Requested by: _USIBWC Clean Rivers Program___________
Sample TCEQ Station No.: ____________________________
Sample Location Description:__________________________
__________________________________________________
__________________________________________________
Segment/Sequence: _________________________________
Collecting Entity Code: ______________________________
Collected by: _______________________________________
Signature: _________________________________________
Collection Date: ____________________________________
Collection Time: ___________________________________
Organics in sediment
Storet Code
Analyze if
checked
Contract line no.
Parameter Storet Code
Analyze if checked
Contract line no.
Parameter
39373 √ DDT (ug/kg) 39741 √ 2,4,5- T (ug/kg) 39368 √ DDE (ug/kg) 39761 √ Silvex (ug/kg) 39363 √ DDD (ug/kg) 34384 √ Fluorene (ug/kg) 39333 √ Aldrin (ug/kg) 34379 √ Fluoranthene (ug/kg) 39351 √ Chlordane (ug/kg) 34250 √ Benzo(a)pyrene (ug/kg)
39393 √ Endrin (ug/kg) 34445 √ Napthalene (ug/kg)
39413 √ Heptachlor (ug/kg) 34237 √ Benzene (ug/kg)
39481 √ Methoxychlor (ug/kg) 34483 √ Toluene (ug/kg)
39383 √ Dieldrin (ug/kg) 34374 √ Ethylbenzene (ug/kg)
39701 √ Hexachlorobenzene (ug/kg)
39519 √ Total PCBs (ug/kg) *All sample containers are provided
34364 √ Endosulfan I (ug/kg) with appropriate preservative.
39731 √ 2,4- D (ug/kg)
Send samples to: A&B Environmental Services, Inc. 10100 East Freeway, Suite 100 Houston, TX 77029 (P)713-453-6060, (F) 713- 453-6091Ph. (210) 340-8121, Fax. (210) 340-8123
Submit report to: Texas Clean Rivers Program USIBWC 4171 N. Mesa, Suite C-100 El Paso, TX 79902
Non-compliance items should be addressed on an attached NCR by the lab. Rev. 04/16/2013

USIBWC FY16-17 QAPP Page 117 Last revised on August 18, 2015 USIBWC CRP QAPP FY1617
UNITED STATES INTERNATIONAL BOUNDARY AND WATER COMMISSION - TEXAS CLEAN RIVERS PROGRAM RIO GRANDE BASIN PARTNER
WATER QUALITY CHAIN OF CUSTODY/REQUEST FOR ANALYSIS FORM
A&B TAG# LABORATORY COC/LAB/WORK ORDER #
CHAIN OF CUSTODY CLIENT INFORMATION (To be filled out by CRP partner)
Relinquished by (printed): _______________________
Signature: ____________________________________
Date/Time: ___________________________________
No. Of Containers: _____________________________
Type of containers: _____________________________
Preservative used: ______________________________
Turnaround Time: __Standard_____________________
(To be filled out by Laboratory)
Received by (printed): __________________________
Signature: ___________________________________
Date/Time: ___________________________________
Cooler Temperature ____________________________
Matrix Type: _______sediment___________________
(To be filled out by CRP partner)
Requested by: _USIBWC Clean Rivers Program___________
Sample TCEQ Station No.: ____________________________
Sample Location Description:__________________________
__________________________________________________
__________________________________________________
Segment/Sequence: _________________________________
Collecting Entity Code: ______________________________
Collected by: _______________________________________
Signature: _________________________________________
Collection Date: ____________________________________
Collection Time: ___________________________________
Analysis Requested Storet Code
Analyze if
checked
Contract line no.
Parameter
Metals in sediment (EPA 6010)
01108 √ Aluminum
01098 √ Antimony
01003 √ Arsenic
01008 √ Barium
01028 √ Cadmium
01029 √ Chromium
01043 √ Copper
01052 √ Lead
01068 √ Nickel
01148 √ Selenium
01078 √ Silver
01093 √ Zinc
71921 √ Mercury (EPA 7471)
Send samples to: A&B Environmental Services, Inc. 10100 East Freeway, Suite 100 Houston, TX 77029 (P)713-453-6060, (F) 713- 453-6091
Submit report to: Texas Clean Rivers Program USIBWC 4171 N. Mesa, Suite C-100 El Paso, TX 79902
Non-compliance items should be addressed on an attached NCR by the lab. Rev 04/16/2013

USIBWC FY16-17 QAPP Page 118 Last revised on August 18, 2015 USIBWC CRP QAPP FY1617
UNITED STATES INTERNATIONAL BOUNDARY AND WATER COMMISSION - TEXAS CLEAN RIVERS PROGRAM RIO GRANDE BASIN
WATER QUALITY CHAIN OF CUSTODY/REQUEST FOR ANALYSIS FORM
A&B TAG# LABORATORY COC/LAB/WORK ORDER #
CHAIN OF CUSTODY CLIENT INFORMATION (To be filled out by CRP partner)
Relinquished by (printed): _______________________
Signature: ____________________________________
Date/Time: __________________________________
No. Of Containers: ____________________________
Type of containers: ____________________________
Preservative used: _____________________________
Turnaround Time: __Standard____________________
(To be filled out by Laboratory)
Received by (printed): __________________________
Signature: ___________________________________
Date/Time: ___________________________________
Cooler Temperature ___________________________
Matrix Type: _______H2O______________________
(To be filled out by CRP partner)
Requested by: _USIBWC Clean Rivers Program___________
Sample TCEQ Station No.: ____________________________
Sample Location Description:__________________________
__________________________________________________
__________________________________________________
Segment/Sequence: _________________________________
Collecting Entity Code: ______________________________
Collected by: _______________________________________
Signature: _________________________________________
Collection Date: ____________________________________
Collection Time: ___________________________________
Analysis Requested Analysis Requested Storet Code
Analyze if
checked
Contract line no.
Parameter Storet Code
Analyze if
checked
Contract line no.
Parameter
Organics in water
34030 √ Benzene – EPA 624
34010 √ Toluene – EPA 624
34371 √ Ethylbenzene – EPA 624
34381 √ Fluorene – EPA 625
34376 √ Fluoranthene – EPA 625
34200 √ Acenaphthylene – EPA 625
34696 √ Napthalene – EPA 625
81551 √ Xylene- EPA 624
34571 √ 1,4- Dichlorobenzene- EPA 625 34396 √ Hexachloroethane- EPA 8260 *All sample containers are provided
31391 √ Hexaclrorobutadiene- EPA 8260 with appropriate preservative.
Send samples to: A&B Environmental Services, Inc. 10100 East Freeway, Suite 100 Houston, TX 77029 (P)713-453-6060, (F) 713- 453-6091
Submit report to: Texas Clean Rivers Program USIBWC 4171 N. Mesa, Suite C-100 El Paso, TX 79902
Non-compliance items should be addressed on an attached NCR by the lab. Rev. 04/16/2013
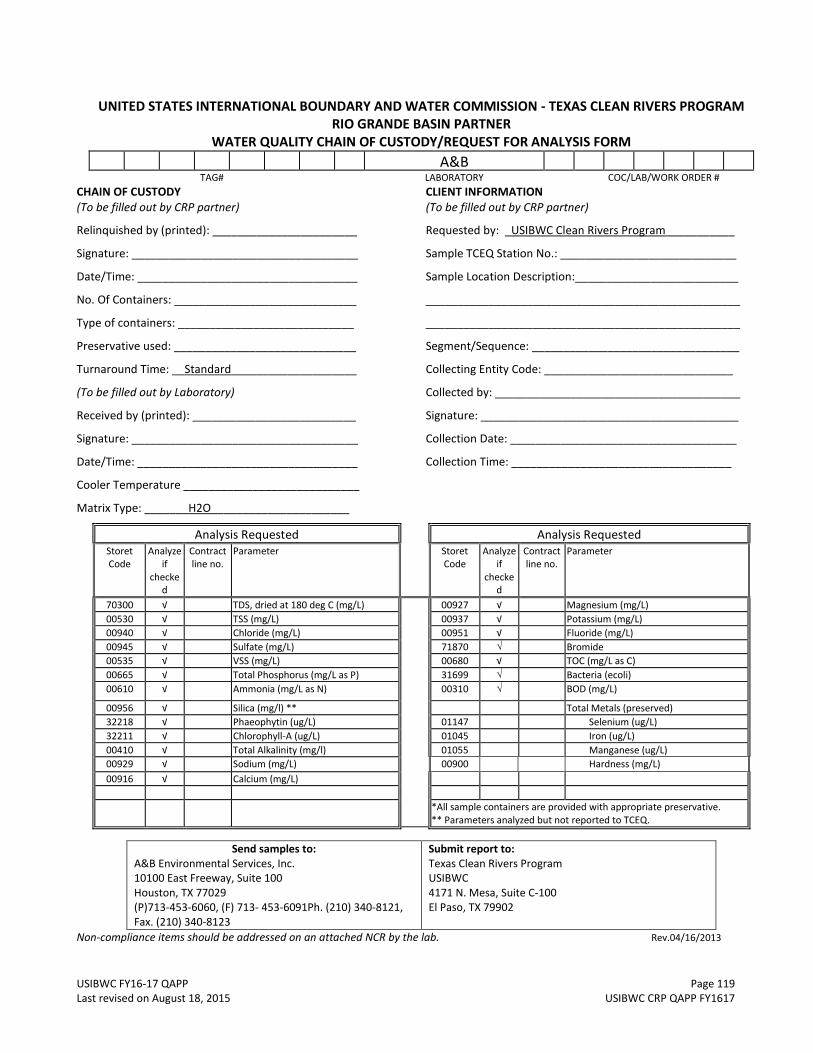
USIBWC FY16-17 QAPP Page 119 Last revised on August 18, 2015 USIBWC CRP QAPP FY1617
UNITED STATES INTERNATIONAL BOUNDARY AND WATER COMMISSION - TEXAS CLEAN RIVERS PROGRAM RIO GRANDE BASIN PARTNER
WATER QUALITY CHAIN OF CUSTODY/REQUEST FOR ANALYSIS FORM
A&B TAG# LABORATORY COC/LAB/WORK ORDER #
CHAIN OF CUSTODY CLIENT INFORMATION (To be filled out by CRP partner)
Relinquished by (printed): _______________________
Signature: ____________________________________
Date/Time: ___________________________________
No. Of Containers: _____________________________
Type of containers: ____________________________
Preservative used: _____________________________
Turnaround Time: __Standard____________________
(To be filled out by Laboratory)
Received by (printed): __________________________
Signature: ____________________________________
Date/Time: ___________________________________
Cooler Temperature ____________________________
Matrix Type: _______H2O______________________
(To be filled out by CRP partner)
Requested by: _USIBWC Clean Rivers Program___________
Sample TCEQ Station No.: ____________________________
Sample Location Description:__________________________
__________________________________________________
__________________________________________________
Segment/Sequence: _________________________________
Collecting Entity Code: ______________________________
Collected by: _______________________________________
Signature: _________________________________________
Collection Date: ____________________________________
Collection Time: ___________________________________
Analysis Requested Analysis Requested Storet Code
Analyze if
checked
Contract line no.
Parameter Storet Code
Analyze if
checked
Contract line no.
Parameter
70300 √ TDS, dried at 180 deg C (mg/L) 00927 √ Magnesium (mg/L)
00530 √ TSS (mg/L) 00937 √ Potassium (mg/L)
00940 √ Chloride (mg/L) 00951 √ Fluoride (mg/L)
00945 √ Sulfate (mg/L) 71870 √ Bromide
00535 √ VSS (mg/L) 00680 √ TOC (mg/L as C)
00665 √ Total Phosphorus (mg/L as P) 31699 √ Bacteria (ecoli)
00610 √ Ammonia (mg/L as N) 00310 √ BOD (mg/L)
00956 √ Silica (mg/l) ** Total Metals (preserved)
32218 √ Phaeophytin (ug/L) 01147 Selenium (ug/L)
32211 √ Chlorophyll-A (ug/L) 01045 Iron (ug/L)
00410 √ Total Alkalinity (mg/l) 01055 Manganese (ug/L)
00929 √ Sodium (mg/L) 00900 Hardness (mg/L)
00916 √ Calcium (mg/L)
*All sample containers are provided with appropriate preservative. ** Parameters analyzed but not reported to TCEQ.
Send samples to: A&B Environmental Services, Inc. 10100 East Freeway, Suite 100 Houston, TX 77029 (P)713-453-6060, (F) 713- 453-6091Ph. (210) 340-8121, Fax. (210) 340-8123
Submit report to: Texas Clean Rivers Program USIBWC 4171 N. Mesa, Suite C-100 El Paso, TX 79902
Non-compliance items should be addressed on an attached NCR by the lab. Rev.04/16/2013

USIBWC FY16-17 QAPP Page 120 Last revised on August 18, 2015 USIBWC CRP QAPP FY1617
UNITED STATES INTERNATIONAL BOUNDARY AND WATER COMMISSION- TEXAS CLEAN RIVERS PROGRAM RIO GRANDE BASIN PARTNER
WATER QUALITY CHAIN OF CUSTODY/REQUEST FOR ANALYSIS FORM
A&B TAG# LABORATORY COC/LAB/WORK ORDER #
CHAIN OF CUSTODY CLIENT INFORMATION (To be filled out by CRP partner) Relinquished by (printed): _______________________ Signature: ____________________________________ Date/Time: ___________________________________ No. Of Containers: _____________________________ Type of containers: _____________________________ Preservative used: ______________________________ Turnaround Time: _Standard______________________ (To be filled out by Laboratory) Received by (printed): ___________________________ Signature: ____________________________________ Date/Time: __________________________________ Cooler Temperature ____________________________ Matrix Type: _______H2O_______________________
(To be filled out by CRP partner) Requested by: _USIBWC Clean Rivers Program Sample TCEQ Station No.: _________________________ Sample Location Description: _______________________________________________
Segment/Sequence: ______________________________
Collecting Entity Code: ____________________________
Collected By: ____________________________________
Signature:_______________________________________
Collection Date: _________________________________ Collection Time: _________________________________
Conventionals Conventionals
Storet Code
Analyze if
checked
Contract line no.
Parameter Storet Code
Analyze if checked
Contract line no.
Parameter
71960 √ Total Mercury
Send samples to:
A&B Environmental Services, Inc. 10100 East Freeway, Suite 100 Houston, TX 77029 (P)713-453-6060, (F) 713- 453-6091
Submit report to: Texas Clean Rivers Program USIBWC 4171 N. Mesa, Suite C-100 El Paso, TX 79902
Non-compliance items should be addressed on an attached NCR by the lab. Rev. 05/2013

USIBWC FY16-17 QAPP Page 121 Last revised on August 18, 2015 USIBWC CRP QAPP FY1617
CITY OF LAREDO HEALTH DEPARTMENT 2600 CEDAR
LAREDO TEXAS 78044
Water Bacteriology Custody Form
1. Name of person releasing the sample(s) under custody:
________________________________ __________________________________________ Signature Print Name
2. Date and time sample(s) under custody is released: AM ________________ _________________ PM Date Time
3. Date sample(s) was/ were collected: __________________________
4. Name of person receiving the sample(s) under custody:
________________________________ __________________________________________ Signature Print Name
5. Condition of the sample(s) under custody:
_____________________________________________
6. Name of person testing sample(s) under custody:
________________________________ __________________________________________ Signature Print Name
7. Date and Time sample(s) was/were tested: ________________ ________________ Date Time
8. Sample(s) Collection Sites: Sites Collected (Circle One) Tested For: Fecal Coliform/ E. Coli
1. Columbia Yes/No Yes/No Yes/No 2. Father McNaboe Yes/No Yes/No Yes/No 3. Jefferson Intake Yes/No Yes/No Yes/No 4. Bridge II Yes/No Yes/No Yes/No 5. La Azteca Yes/No Yes/No Yes/No 6. Rio Bravo Yes/No Yes/No Yes/No 7. Masterson Road Yes/No Yes/No Yes/No 8. Quintero Property Yes/No Yes/No Yes/No
Other Site (s):

USIBWC FY16-17 QAPP Page 122 Last revised on August 18, 2015 USIBWC CRP QAPP FY1617
UNITED STATES INTERNATIONAL BOUNDARY AND WATER COMMISSION
TEXAS CLEAN RIVERS PROGRAM - RIO GRANDE BASIN WATER QUALITY CHAIN OF CUSTODY/REQUEST FOR ANALYSIS FORM
El Paso Water Utilities
TAG# LABORATORY COC/LAB #
CHAIN OF CUSTODY CLIENT INFORMATION Released by (printed): Requested by:_______________________________ Signature: _______________________________ Date/Time: Sample TCEQ Station No.__________ ___________ Received by (printed):_______________________ Sample Location Description:____________ ______ Signature:________________________________ _______________________________ ___________ Date/Time:_______________________________ Collected by: _______________________________ No. Of Containers:_________________________ Signature:__________________________________ Type of containers:________________________ Segment/Sequence:______ _________________ Preservative used:_________________________ Collection Date:_____________________________ Matrix Type:_____________________________ Collection Time: _____________________________
Chemistry Conventionals Microbiology
00610 √ Ammonia-Nitrogen (mg/L) 31616 √ Fecal Coliform, Membrane Filter, (CFU/100)
00310 √ BOD (mg/L) **
00900 √ Total Hardness (mg/L) 31699 √ E. Coli, IDEXX, (MPN/100)**
70300 √ TDS (mg/L)
82079 √ Turbidity (NTU) ** Metals
00665 √ Total Phosphorus as P (mg/l) √ Dissolved Metals (lab filtered, preserved) -Al, Ag, As, B, Ba, Be, Cd, Cr, Cu, Fe, Li, Mn, Ni, Pb, Se, Tl, Zn
32211 √ Chlorophyll-a (ug/l)**
32218 √ Pheophytin (ug/l) Organics
00956 √ Silica (mg/l) 46491 √ MTBE
71870 √ Bromide (mg/l) √ SVOCs (MDNR Pesticides)
00940 √ Chloride
00671 √ Ortho-phosphate as P (mg/l) 00625 √ TKN (mg/L)
00620 √ Nitrate-Nitrogen (mg/l)
00615 √ Nitrite-Nitrogen (mg/l)
00951 √ Fluoride (mg/l)
00916 √ Calcium (mg/l)
00927 √ Magnesium (mg/l) *All sample containers are provided
00935 √ Potassium (mg/l) with appropriate preservative.
00929 √ Sodium (mg/l) -Dissolved metals required by IBWC, not
00945 √ Sulfate (mg/l) Reported to TCEQ.
00410 √ Total Alkalinity (mg/L) **Parameters reported to TCEQ
Please return to: Texas Clean Rivers Program USIBWC
4171 N. Mesa, Suite C-100 Rev. 12/08/08 El Paso, TX 79902

USIBWC FY16-17 QAPP Page 123 Last revised on August 18, 2015 USIBWC CRP QAPP FY1617

USIBWC FY16-17 QAPP Page 124 Last revised on August 18, 2015 USIBWC CRP QAPP FY1617
Appendix F: Data Review Checklist and Summary Shells

USIBWC FY16-17 QAPP Page 125 Last revised on August 18, 2015 USIBWC CRP QAPP FY1617
Data Review Checklist
This checklist is to be used by the Planning Agency and other entities handling the monitoring data in order to review data before submitting to the TCEQ. This table may not contain all of the data review tasks being conducted.
Data Format and Structure ✔, ✘, or N/A
Are there any duplicate Tag Id numbers in the Events file?
Do the Tag prefixes correctly represent the entity providing the data?
Have any Tag Id numbers been used in previous data submissions?
Are TCEQ SLOC numbers assigned?
Are sampling Dates in the correct format, MM/DD/YYYY with leading zeros?
Are sampling Times based on the 24 hr clock (e.g. 09:04) with leading zeros?
Is the Comments field filled in where appropriate (e.g. unusual occurrence, sampling problems, unrepresentative of ambient water quality)?
Are submitting Entity, Collecting Entity, and Monitoring Type codes used correctly?
Do sampling dates in the Results file match those in the Events file for each Tag Id?
Are values represented by a valid parameter code with the correct units?
Are there any duplicate parameter codes for the same Tag Id?
Are there any invalid symbols in the Greater Than/Less Than (GT/LT) field?
Are there any Tag Ids in the Results file that are not in the Events file or vice versa?
Data Quality Review ✔, ✘, or N/A
Are “less-than” values reported at the LOQ? If no, explain in Data Summary.
Have the outliers been verified and a "1" placed in the Verify_flg field?
Have checks on correctness of analysis or data reasonableness been performed? e.g., Is ortho-phosphorus less than total phosphorus? Are dissolved metal concentrations less than or equal to total metals? Is the minimum 24 hour DO less than the maximum 24 hour DO? Do the values appear to be consistent with what is expected for site?
Have at least 10% of the data in the data set been reviewed against the field and laboratory data sheets?
Are all parameter codes in the data set listed in the QAPP?
Are all stations in the data set listed in the QAPP?
Documentation Review ✔, ✘, or N/A
Are blank results acceptable as specified in the QAPP?
Were control charts used to determine the acceptability of lab duplicates?
Was documentation of any unusual occurrences that may affect water quality included in the Event file’s Comments field?
Were there any failures in sampling methods and/or deviations from sample design requirements that resulted in unreportable data? If yes, explain in Data Summary.
Were there any failures in field and/or laboratory measurement systems that were not resolvable and resulted in unreportable data? If yes, explain in Data Summary.
Was the laboratory’s NELAP Accreditation current for analysis conducted?
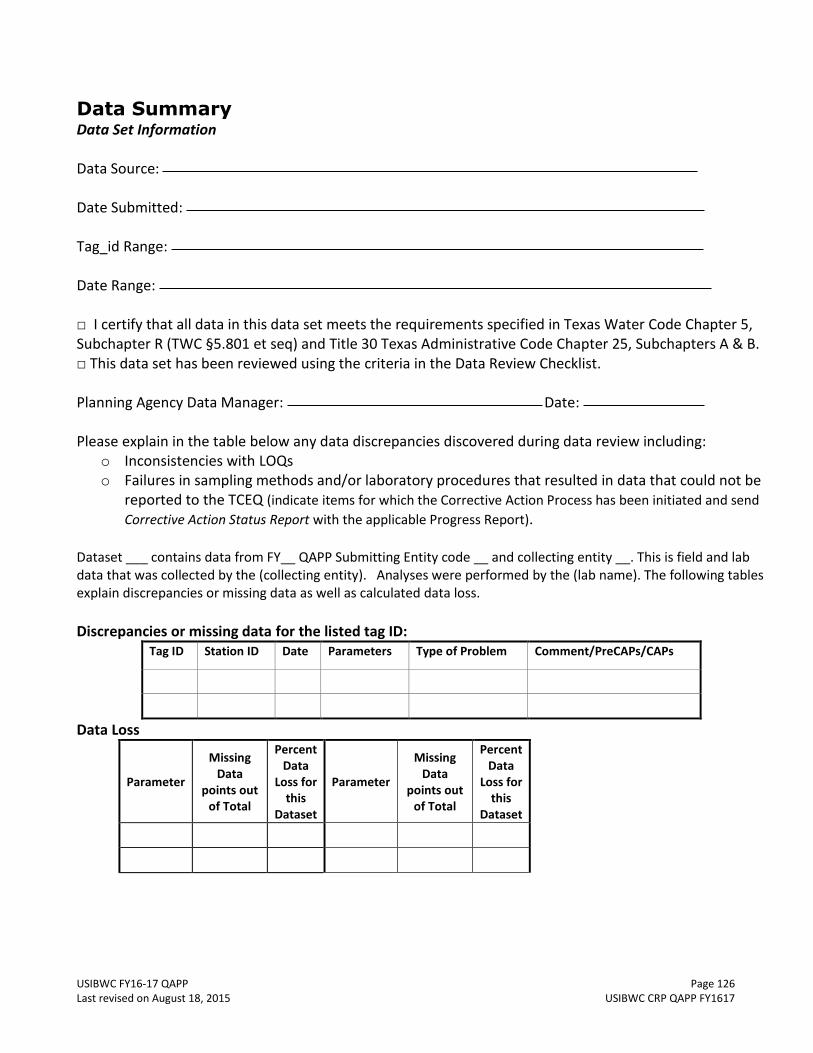
USIBWC FY16-17 QAPP Page 126 Last revised on August 18, 2015 USIBWC CRP QAPP FY1617
Data Summary Data Set Information Data Source: Date Submitted: Tag_id Range: Date Range: □ I certify that all data in this data set meets the requirements specified in Texas Water Code Chapter 5, Subchapter R (TWC §5.801 et seq) and Title 30 Texas Administrative Code Chapter 25, Subchapters A & B. □ This data set has been reviewed using the criteria in the Data Review Checklist. Planning Agency Data Manager: Date: Please explain in the table below any data discrepancies discovered during data review including:
o Inconsistencies with LOQs o Failures in sampling methods and/or laboratory procedures that resulted in data that could not be
reported to the TCEQ (indicate items for which the Corrective Action Process has been initiated and send
Corrective Action Status Report with the applicable Progress Report).
Dataset ___ contains data from FY__ QAPP Submitting Entity code __ and collecting entity __. This is field and lab data that was collected by the (collecting entity). Analyses were performed by the (lab name). The following tables explain discrepancies or missing data as well as calculated data loss.
Discrepancies or missing data for the listed tag ID:
Tag ID Station ID Date Parameters Type of Problem Comment/PreCAPs/CAPs
Data Loss
Parameter
Missing Data
points out of Total
Percent Data
Loss for this
Dataset
Parameter
Missing Data
points out of Total
Percent Data
Loss for this
Dataset

USIBWC FY16-17 QAPP Page 127 Last revised on August 18, 2015 USIBWC CRP QAPP FY1617
ATTACHMENT 1 Letter to Document Adherence to the QAPP

USIBWC FY16-17 QAPP Page 128 Last revised on August 18, 2015 USIBWC CRP QAPP FY1617
TO: (name) (organization)
RE: FY2016-17 USIBWC El Paso Headquarters QAPP This letter will summarize the understanding between the United States Section, International Boundary and Water Commission (USIBWC) Texas Clean Rivers Program (CRP) and the Partner on the surface water quality-monitoring program for the Rio Grande. Enclosed is a copy of the FY 2016-17 Rio Grande Basin Monitoring Program (RGBMP) Quality Assurance Project Plan (QAPP), which outlines the procedures and quality assurance requirements of the RGBMP. Please indicate your acceptance and adherence to the RGBMP QAPP by signing and returning the terms of agreement/endorsement (Attachment 1) at the bottom of this letter to the USIBWC. The following lists the responsibilities of Partner and USIBWC to fulfill this understanding: Partner 1. Partner will collect water quality samples during the period of September 1, 2015 through August 31,
2017, as listed in the attached Monitoring Schedule. (Attachment 2) 2. Partner will perform the field data collection to include instantaneous flow and submit the results to
the USIBWC El Paso Headquarters. 3. For each water sample designated for conventional analysis, including duplicates, Partner will complete
and attach to each shipment a Chain of Custody Form and submit to the USIBWC contract laboratory for analysis. Partner will submit the Field Data Reporting Forms to the USIBWC.
4. Partner will follow the procedures for sampling as described in the Surface Water Quality Procedures Manual, TCEQ, 2012 or subsequent editions, the RGBMP QAPP and the USIBWC El Paso Headquarters SOP for YSI 556 Calibration and Maintenance.
5. Partner will notify the USIBWC El Paso Headquarters staff of any problems with the monitoring effort
and will work with staff to resolve problems as they occur. 6. If possible, Partner should participate in the annual coordinated monitoring meeting to be scheduled
between March 15 and April 30 of the contract years in order to provide input on the monitoring schedule and local water quality issues.
7. Partner will participate in a monitoring systems audit every two years to ensure proper monitoring
procedures. US International Boundary and Water Commission

USIBWC FY16-17 QAPP Page 129 Last revised on August 18, 2015 USIBWC CRP QAPP FY1617
1. Staff from the USIBWC El Paso Headquarters will meet as needed with Partner to assess the
effectiveness of this monitoring effort and will work with Partner to resolve problems as they occur. USIBWC El Paso Headquarters will perform a monitoring systems audit of Partner once every two years.
2. The USIBWC will incur laboratory costs for the samples and field splits collected by Partner. 3. The USIBWC will also incur the shipping costs for the samples being sent to the contract laboratory.
Please contact the CRP staff to obtain shipping account information. 4. On an as-needed basis, staff from the USIBWC El Paso Headquarters will provide any training and
supplies necessary to accomplish the objectives of the CRP monitoring program. The USIBWC appreciates the willingness of Partner to participate in this cooperative effort to collect water quality information in the Rio Grande Basin. If you have any questions please contact me at 915-832-4779.
Sincerely,
Andres Garcia Quality Assurance Officer USIBWC Clean Rivers Program
Enclosure(s): As Stated bcc: CRP files

USIBWC FY16-17 QAPP Page 130 Last revised on August 18, 2015 USIBWC CRP QAPP FY1617
Terms of Agreement The USIBWC Clean Rivers Program Sampling Partners agree to the long- term collection or analysis of water quality samples and environmental data at designated monitoring stations on a prescribed schedule. The types of samples and data collected by each partner may vary in time, commitment, and geography. A Sampling Partner’s signature on the Section A1 Approval Page of the Rio Grande Basin Monitoring Program Quality Assurance Project Plan indicates acknowledgment that the Sampling Partner does not expect to be paid for his/her work, compensated for expenses associated with said in-kind work, and will abide by the Texas Commission on Environmental Quality procedures. In addition, USIBWC non-federal entity Sampling Partners release, waive, discharge and covenant not to sue the USIBWC, including its officers and employees, with respect to any and all liability, claims or causes of action whatsoever related to any damages or injury that they may sustain, whether caused by the negligence of the USIBWC or otherwise, while performing tasks under this QAPP. USIBWC Sampling Partners are aware and fully responsible for guarding against any risks involved with such activity, and choose to participate voluntarily and at their own risk. They voluntarily assume full responsibility for any property damage or personal injury that they may sustain while participating in, or related to the above activity. ENDORSEMENT I acknowledge receipt of the “RIO GRANDE BASIN MONITORING PROGRAM QUALITY ASSURANCE PROJECT PLAN, FY2016-2017”. I understand the document(s) describe quality assurance, quality control, data management and reporting, and other technical activities that must be implemented to ensure the results of work performed will satisfy stated performance criteria. My signature on this document signifies that I have read and approved the document contents pertaining to my program. Furthermore, I will ensure that all staff members participating in Clean Rivers Program activities will be required to familiarize themselves with the document contents and adhere to them as well. _______________________________________________ Signature Date _______________________________________________ Sampling Partner
Adherence letters may vary as needed to address specific partners. Copies of the signed forms should be sent by the USIBWC to the TCEQ CRP Project Manager within 60 days of TCEQ approval of the QAPP.

USIBWC QAPP AMENDMENT 1
USIBWC FY CRP1617QAPP_AMENDMENT 1
Amendment # 1 to the Rio Grande Basin Clean Rivers Program FY 2016/2017 QAPP
Prepared by the U.S. International Boundary and Water Commission in Cooperation with the Texas Commission on Environmental Quality (TCEQ)
Effective: Immediately upon approval by all parties Questions concerning this QAPP should be directed to: Leslie Grijalva USIBWC El Paso Headquarters Program Manager 4171 N. Mesa St., Ste. C‐100 El Paso, TX 79902 (915) 832‐4770 [email protected]
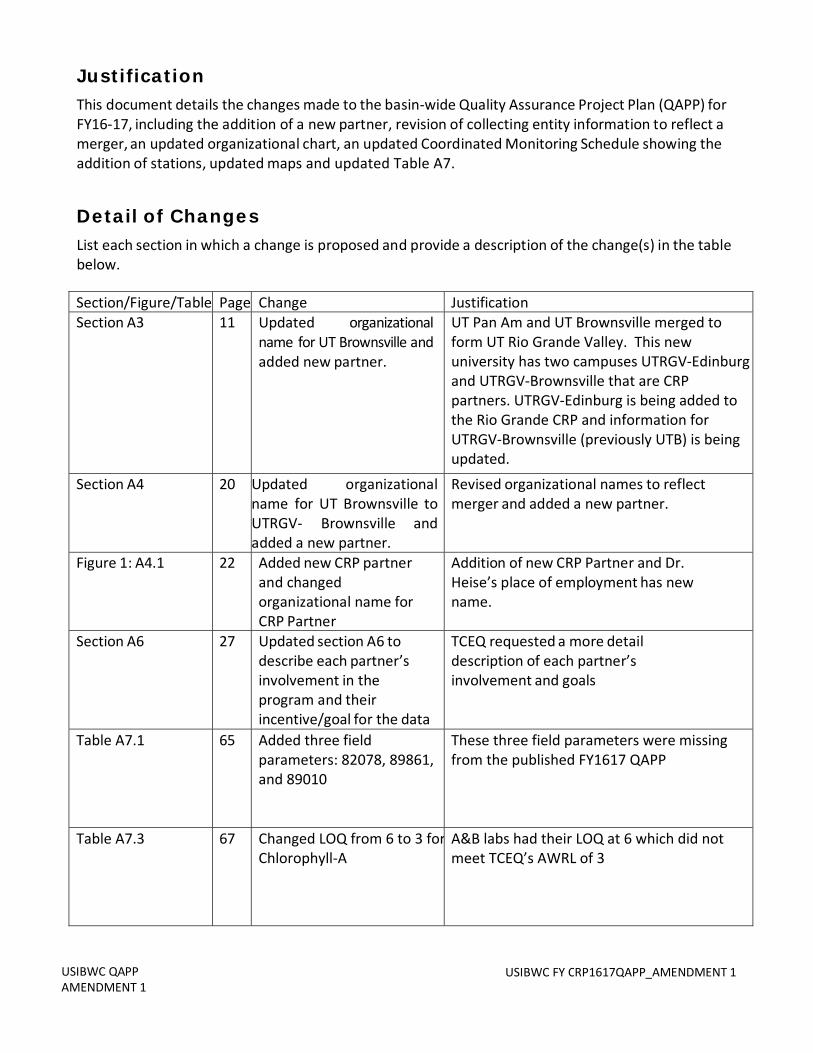
USIBWC QAPP AMENDMENT 1
USIBWC FY CRP1617QAPP_AMENDMENT 1
Justification
This document details the changes made to the basin‐wide Quality Assurance Project Plan (QAPP) for FY16‐17, including the addition of a new partner, revision of collecting entity information to reflect a merger, an updated organizational chart, an updated Coordinated Monitoring Schedule showing the addition of stations, updated maps and updated Table A7.
Detail of Changes
List each section in which a change is proposed and provide a description of the change(s) in the table below.
Section/Figure/Table Page Change Justification Section A3 11 Updated organizational
name for UT Brownsville and added new partner.
UT Pan Am and UT Brownsville merged to form UT Rio Grande Valley. This new university has two campuses UTRGV‐Edinburg and UTRGV‐Brownsville that are CRP partners. UTRGV‐Edinburg is being added to the Rio Grande CRP and information for UTRGV‐Brownsville (previously UTB) is being updated.
Section A4 20 Updated organizational name for UT Brownsville to UTRGV‐ Brownsville and added a new partner.
Revised organizational names to reflect merger and added a new partner.
Figure 1: A4.1 22 Added new CRP partner and changed organizational name for CRP Partner
Addition of new CRP Partner and Dr. Heise’s place of employment has new name.
Section A6 27 Updated section A6 to describe each partner’s involvement in the program and their incentive/goal for the data
TCEQ requested a more detail description of each partner’s involvement and goals
Table A7.1 65 Added three field parameters: 82078, 89861, and 89010
These three field parameters were missing from the published FY1617 QAPP
Table A7.3 67 Changed LOQ from 6 to 3 forChlorophyll‐A
A&B labs had their LOQ at 6 which did not meet TCEQ’s AWRL of 3

USIBWC QAPP AMENDMENT 1
USIBWC FY CRP1617QAPP_AMENDMENT 1
Table A7.6 72 Added method (SM 2540G) for parameter 81373 and removed ASTM D 422 and ASTM 442‐63.
Update the method that A&B uses for this parameter.
Table A7.12 79 Changed parameter for Chlorophyll‐A from 70953 to 32211
The EPWU lab tests for Chlorophyll‐A using the Spectrophotometric method, not the fluorometric method
Table 8: B10.1 51 Added new CRP partner and changed University of Texas at Brownsville to University of Texas Rio Grande Valley –
Addition of new CRP Partner and organization name change
Table C1 55 Added an additional footnote to Table C1
TCEQ requested and additional footnote on auditing if EPCC and UTEP collect independently
Table 15: Appendix B.2
86 Added new code for new CRP partner and changed University of Texas at
Addition of new CRP Partner and organization name change
Table 16: Appendix B.3
87 Added new code for new CRP partner and changed University of Texas at Brownsville to University of Texas Rio Grande Valley‐
Addition of new CRP Partner and organization name change
Monitoring Schedule 89 Updated the monitoring schedule in Appendix B with a comment that indicates which sites might have a variation in collecting entity. Added new sites for new partner.
UTRGV‐Edinburg will be collecting at four
sites; three sites are new to this QAPP and one
site, already recorded in the Monitoring Table,
will be collected by both PT and IB.
Monitoring Schedule Changed monitoring type code for site 13103 from BF to RT.
Upon discussion, TCEQ and RG‐CRP decided that both partners (Falcon FO and UTRGV‐Edinburg) will be instructed to follow the schedule and simply report as dry when it is dry.

USIBWC QAPP AMENDMENT 1
USIBWC FY CRP1617QAPP_AMENDMENT 1
Distribution
QAPP Amendments and Revisions to Appendices will be distributed to all personnel on the distribution list maintained by the Planning Agency.
These changes will be incorporated into the QAPP document and TCEQ and the USIBWC will acknowledge and accept these changes by signing this amendment.
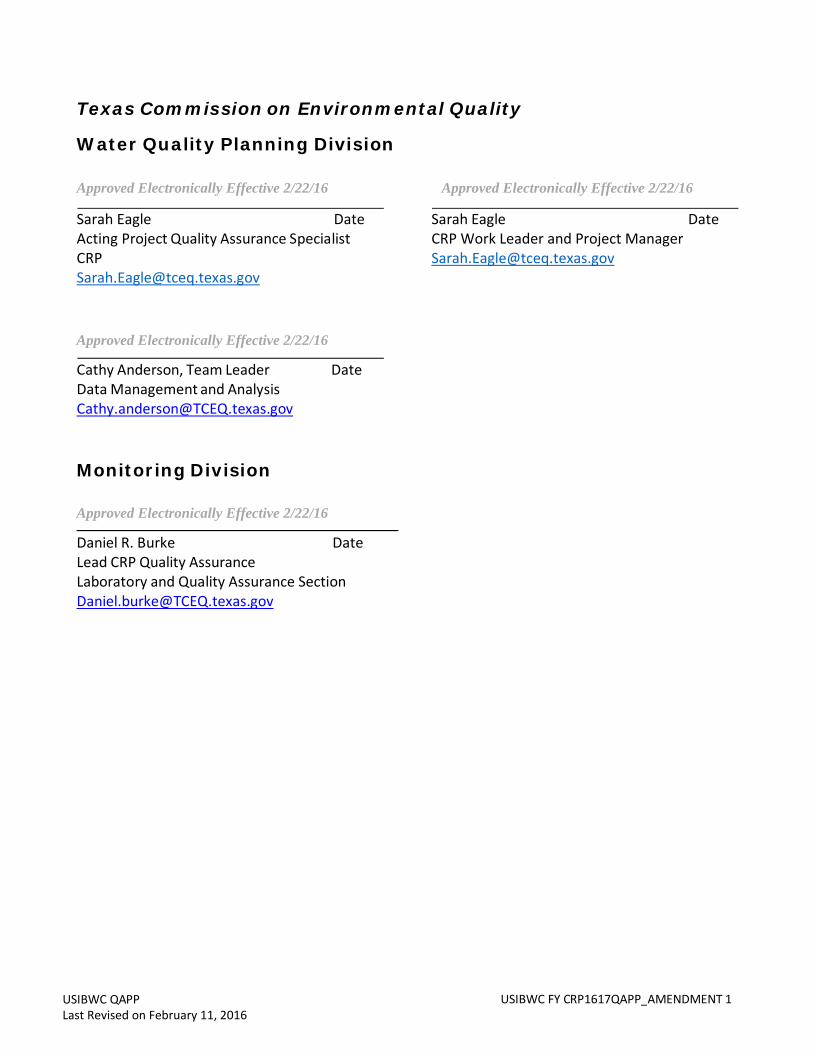
USIBWC QAPP Last Revised on February 11, 2016
USIBWC FY CRP1617QAPP_AMENDMENT 1
Texas Commission on Environmental Quality
Water Quality Planning Division Approved Electronically Effective 2/22/16 Approved Electronically Effective 2/22/16
Sarah Eagle Date Acting Project Quality Assurance Specialist CRP [email protected]
Sarah Eagle Date CRP Work Leader and Project Manager [email protected]
Approved Electronically Effective 2/22/16
Cathy Anderson, Team Leader Date Data Management and Analysis [email protected]
Monitoring Division
Approved Electronically Effective 2/22/16
Daniel R. Burke Date Lead CRP Quality Assurance Laboratory and Quality Assurance Section [email protected]
USIBWC QAPP Last Revised on February 11, 2016 USIBWC FY CRP1617QAPP_AMENDMENT 1
United States Section, International Boundary and Water Commission (USIBWC), Environmental Management Division
Approved Electronically Effective 2/22/16 Approved Electronically Effective 2/22/16
Leslie Grijalva Date USIBWC El Paso Headquarters Project Manager
Andres Garcia Date USIBWC El Paso Headquarters Quality Assurance Officer

USIBWC QAPP Last Revised on February 11, 2016 USIBWC FY CRP1617QAPP_AMENDMENT 1
A&B Environmental Services, Inc.
Approved Electronically Effective 2/22/16 Approved Electronically Effective 2/22/16
Yuhui Zhang Date A&B Laboratory Manager
Rita Wells Date A&B Quality Assurance Officer

USIBWC QAPP Last Revised on February 11, 2016
USIBWC FY CRP1617QAPP_AMENDMENT 1
El Paso Water Utilities Public Service Board, International Water Quality Laboratory
Approved Electronically Effective 2/22/16 Approved Electronically Effective 2/22/16
______________________________________ __________________________________ Richard Wilcox Date Richard Wilcox Date Acting Laboratory Manager Quality Assurance Chemist
The USIBWC will secure written documentation from each sub‐tier project participant (e.g., subcontractors, sub participants, or other units of government) stating the organization’s awareness of and commitment to requirements contained in this quality assurance project plan and any amendments or added appendices of this plan. Alternatively, additional signature blocks for sub‐tier participants may be added to section A1. Signatures in section A1 will eliminate the need for adherence letter maintenance. The USIBWC will maintain this documentation as part of the project’s quality assurance records, and will ensure the documentation is available for review.

USIBWC QAPP Last Revised on February 11, 2016 USIBWC FY CRP1617QAPP_AMENDMENT 1
A3 Distribution List
University of Texas Rio Grande Valley‐ Brownsville Environmental and Earth Sciences One West University Blvd. Brownsville, TX 78520
Dr. Elizabeth Heise, Associate Professor (956) 882‐6769
University of Texas Rio Grande Valley‐ Edinburg Department of Civil Engineering 1201 West University Drive Edinburg, TX 78539‐2999
Dr. Jungseok Ho, Assistant Professor (956) 665‐3104

USIBWC QAPP Last Revised on February 11, 2016
USIBWC FY CRP1617QAPP_AMENDMENT 1
A4 PROJECT/TASK ORGANIZATION
Description of Responsibilities Dr. Elizabeth Heise University of Texas Rio Grande Valley‐ Brownsville Responsible for water quality monitoring and data review in the Brownsville area of the Rio Grande. Samples collected are submitted to A&B Environmental Services, Inc. for analysis.
Dr. Jungseok Ho University of Texas Rio Grande Valley‐ Edinburg Responsible for water quality monitoring and data review of Arroyo Los Olmos, a tributary to the Rio Grande, and one site on the Rio Grande. Samples collected are submitted to A&B Environmental Services, Inc. for analysis.
Terms of Agreement
The USIBWC Clean Rivers Program Sampling Partners agree to the long‐term collection of water quality samples and environmental data at designated monitoring stations on a prescribed schedule. The types of samples and data collected by each partner may vary in time, commitment, and geography. A Sampling Partner’s signature on the Section A1 Approval Page of the Rio Grande Basin Monitoring Program Quality Assurance Project Plan or on a Letter of Adherence (see Attachment 1) indicates acknowledgment that the Sampling Partner does not expect to be paid for his/her work, compensation for expenses associated with said in‐kind work, and will abide by the Texas Commission on Environmental Quality procedures.
In Addition, USIBWC non‐federal entity Sampling Partners release, waive, discharge and covenant not to sue the USIBWC, including its officers and employees, with respect to any and all liability, claims or causes of action whatsoever related to any damages or injury that they may sustain, whether caused by the negligence of the USIBWC or otherwise, while performing tasks under this QAPP. USIBWC Sampling Partners are aware and fully responsible for guarding against any risks involved with such activity, and choose to participate voluntarily and at their own risk. They voluntarily assume full responsibility for any property damage or personal injury that they may sustain while participating in, or related to the above activity.
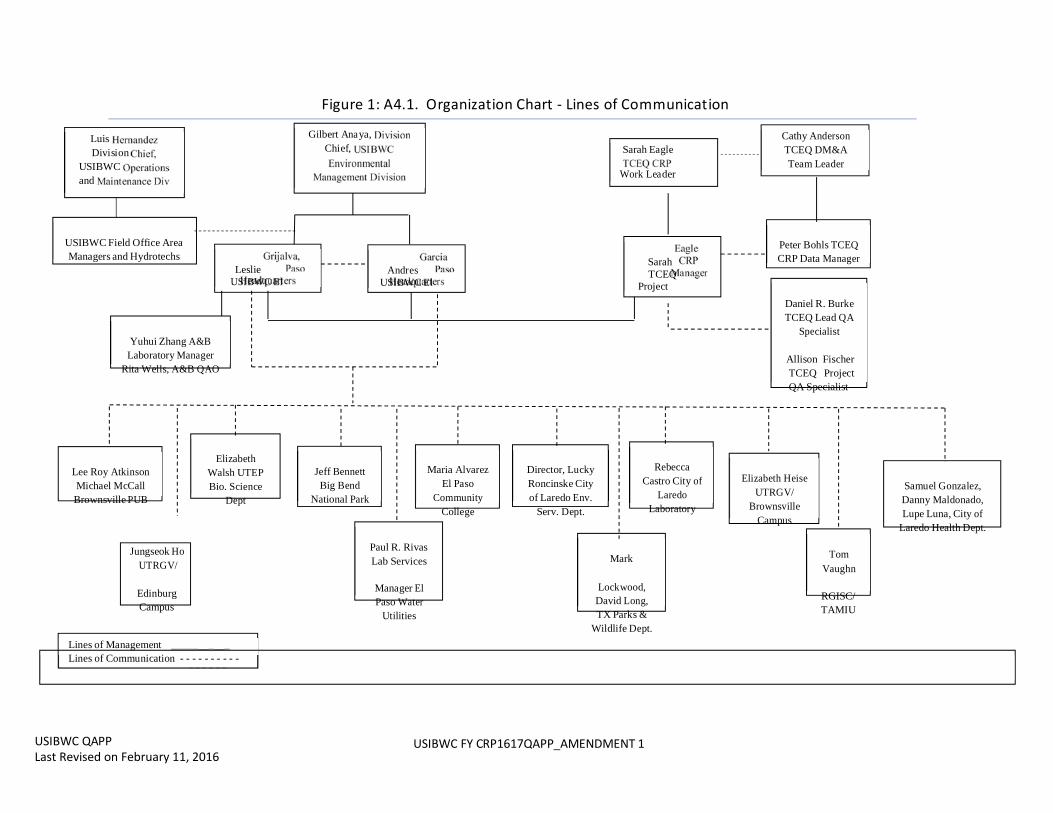
USIBWC FY CRP1617QAPP_AMENDMENT 1
USIBWC QAPP Last Revised on February 11, 2016
Figure 1: A4.1. O rganization Chart ‐ Lines of Communicat ion
Luis Division
USIBWC and
Gilbert Ana ya, Chief, Sarah Eagle
Work Lea der
Cathy Anderson TCEQ DM&A Team Leader
USIBWC Field Office Area Managers and Hydrotechs
Yuhui Zhang A&B Laboratory Manager
Rita Wells, A&B QAO
Leslie
USIBWC El
Andres USIBWC El
Sarah TCEQ
Project
Peter Bohls TCEQ CRP Data Manager
Daniel R. Burke TCEQ Lead QA
Specialist
Allison Fischer TCEQ Project QA Specialist
Lee Roy Atkinson Michael McCall Brownsville PUB
Jungseok Ho UTRGV/
Elizabeth Walsh UTEP Bio. Science
Dept
Jeff Bennett Big Bend
National Park
Maria Alvarez
El Paso Community
College
Paul R. Rivas Lab Services
Director, Lucky Roncinske City of Laredo Env.
Serv. Dept.
Mark
Rebecca
Castro City of Laredo
Laboratory
Elizabeth Heise
UTRGV/ Brownsville
Campus
Tom Vaughn
Samuel Gonzalez, Danny Maldonado, Lupe Luna, City of
Laredo Health Dept.
Edinburg Campus
Lines of Management _____ _ _ Lines of Communication - - - - - - - - - -
Manager El Paso Water
Utilities
Lockwood, David Long, TX Parks &
Wildlife Dept.
RGISC/ TAMIU

USIBWC FY CRP1617QAPP_AMENDMENT 1
USIBWC QAPP Last Revised on February 11, 2016
City of Laredo Health Dept. uses the City of Laredo Health Dep. Lab, BPUB analyzes their own data and the enterococcus samples for the Brownsville area, and American Dam uses the El Paso Water Utilities Lab. All other partners use A&B.

USIBWC FY CRP1617QAPP_AMENDMENT 1
USIBWC QAPP Last Revised on February 11, 2016
This Page Intentionally Left Blank

USIBWC QAPP Last Revised on February 11, 2016
USIBWC FY CRP1617QAPP_AMENDMENT 1
A6 Project/Task Description
See Appendix B for the project‐related work plan tasks and schedule of deliverables for a description of work defined in this QAPP. Attach work plan tasks pertaining to this QAPP.
See Appendix B for sampling design and monitoring pertaining to this QAPP.
USIBWC El Paso Headquarters administers the Clean Rivers Program in the Rio Grande basin by
coordinating monitoring efforts among a large number of partners to routinely collect surface water
quality data from more than 60 sites throughout the basin. Partners in the Rio Grande basin include
universities, municipalities, non‐profit organizations, and other agencies which monitor water quality in the
Rio Grande basin for their own purposes and also at the request of the Clean Rivers Program. The USIBWC
El Paso Headquarters collects this data and uses it for assessments of water quality under the Clean Rivers
Program. The data are also widely used by state water quality managers, cities, counties, consultants,
students and the general public; the data are also used to monitor water quality for use in assessment
for the attainment of uses and numerical criteria. Smaller non‐classified water bodies are also monitored
in response to perceived risk for pollution and/or to define water quality. The USIBWC’s Quality Assurance
Project Plan is the mechanism for bringing this data into the statewide water quality database (SWQMIS).
Basin‐wide monitoring program contains sites collected by USIBWC El Paso Headquarters staff, partners
as listed in A4, and TCEQ field office staff throughout the basin. Monitoring sites are evaluated for
location, frequency of collection, and parameters annually at coordinated monitoring meetings located
at four locations in the basin. For FY2016‐2017, routine monitoring is defined as field, flow,
conventionals, and bacteriological samples. Organics in sediment will only be analyzed at sites where
organics have been detected in the previous two years. Metals and certain organics in water and
sediment will still be collected at sites where they have historically shown levels of concern and
where stakeholder interest requests continued collection. (For a more detailed description of the
monitoring plan and how it is designed, please see Appendix B.)
The USIBWC El Paso Headquarters requires a large number of in‐kind partners to collect samples
throughout the Rio Grande Basin. The CRP monitoring partners in the Rio Grande basin are: USIBWC El
Paso Headquarters, USIBWC field offices (American Dam, Amistad Dam, Falcon Dam, Presidio, Mercedes),
El Paso Community College, El Paso Water Utilities, University of Texas at El Paso, Big Bend National Park,
Texas Parks and Wildlife, City of Laredo Health Department, City of Laredo Environmental Services, Rio
Grande International Study Center, Midland College, University of Texas Rio Grande Valley (Brownsville
and Edinburg campuses), and the Brownsville Public Utilities Board. All CRP partners in the Rio Grande
basin monitoring program are required to be trained by the USIBWC El Paso Headquarters, and they must
agree to follow the QAPP by signing this document or an adherence letter. Various partners collect limited
field and/or laboratory parameters due to issues such as remoteness of the site, shipping problems,

USIBWC QAPP Last Revised on February 11, 2016
USIBWC FY CRP1617QAPP_AMENDMENT 1
accreditation, or to a standing Memorandum of Agreement/Understanding between the entity and the
USIBWC. Only data meeting the specifications detailed in the QAPP are reported to TCEQ. For any partner
reporting five parameters or less, the USIBWC El Paso Headquarters considers this as limited
conventionals analysis.
USIBWC Field Offices (Amistad Dam, Falcon Dam, Presidio, Mercedes) conduct routine monitoring at
sites in and around their geographical areas. Monitoring is conducted at various frequencies based on
the data needs of the TCEQ or USIBWC and whether that monitoring is shared among other program
partners. The Amistad Dam Field Office collects metals in sediment samples twice per year at one site
and quarterly at another site due to concerns over mining activities in the surrounding areas. The Presidio
Field Office collected metals in water samples twice per year at two sites, also due to concerns over mining
activities in the surrounding areas. Falcon Dam Field Office collects conventionals at station 13103. These
field offices ship samples to A&B Laboratory.
USIBWC American Dam Field Office conducts routine monitoring at sites in and around their geographic
area. Water samples are analyzed at EPWU through a cooperative agreement with the USIBWC. USIBWC
personnel conduct monitoring and EPWU uses this data for the wastewater treatment plants.
The University of Texas at El Paso (UTEP) conducts quarterly routine monitoring at one station on the
Rio Grande Riverside Diversion Dam, and bacteria and field parameters twice a year at one station on
the Rio Grande above International Dam, both in the El Paso area. Monitoring is conducted in
conjunction with USIBWC El Paso HQ staff. Water samples are shipped to A&B Laboratory for analyses.
UTEP has been a longstanding CRP partner. Monitoring events are simultaneously a student training
event and support Rio‐Grande‐related graduate research and work.
The El Paso Community College conducts quarterly monitoring at one site on the Rio Grande in the El
Paso area. EPCC also conducts routine monitoring three times a year, and field and flow sampling an
additional three times a year at one site on the Rio Grande in El Paso in conjunction with USIBWC CRP Staff.
Water samples are shipped to A&B Laboratory for analyses. EPCC has been a longstanding CRP partner.
Monitoring events are simultaneously a student training event and support Rio‐Grande‐related
graduate research and work.
Big Bend National Park conducts field monitoring once per year at 16 stations in Segments 2305 and
2306. These stations are in the Lower Canyons reach of the park and are only accessible by canoe.
The park staff take an annual trip down the Lower Canyons and sample these sites for the program
for field parameters only. Big Bend National Park also conducts monitoring at two additional sites – these
sites are monitored for routine parameters eight times per year and for total mercury in water biannually.
Total mercury sampling is conducted due to concerns about ongoing mining activities in the area. Water

USIBWC QAPP Last Revised on February 11, 2016
USIBWC FY CRP1617QAPP_AMENDMENT 1
samples are shipped to A&B Laboratories for analysis. There is much recreation in the river in this area, so Big
Bend National Park conducts this monitoring in order to stay informed about the state of the river and
also to provide information to TCEQ for water quality assessment.
Texas Parks and Wildlife Department conducts routine monitoring at two sites in Segment 2306 in and
around Big Bend Ranch State Park. Each site is also sampled biannually for total mercury in water due to
concerns for ongoing mining activities in the area. Water samples are shipped to A&B Laboratories for
analysis. There is much recreation in the river in this area, so TPWD conducts this monitoring to stay
informed about the state of the river and also to provide information to TCEQ for water quality
assessment.
The City of Laredo Health Department sanitation inspectors conduct monthly monitoring at six stations
on Segment 2304. Monthly monitoring consists of limited field parameters, bacteria, and flow where an
IBWC gage is available. Water samples are analyzed by the City of Laredo Health Department lab with
supplies provided by USIBWC CRP. The City of Laredo Health Department uses the data to supplement
the city testing requirements for the wastewater treatment plants.
The City of Laredo Environmental Services Department conducts quarterly routine monitoring at one
site on Manadas Creek. Metals in sediment are collected quarterly due to the known contamination of this
water body. Samples are analyzed by A&B Laboratory.
Rio Grande International Study Center (RGISC) conducts routine monitoring at five stations quarterly
and one site monthly on the Rio Grande below Amistad Reservoir. Water samples are shipped to A&B
Laboratory for analysis. RGISC is a non‐ profit organization that participates in CRP by collecting samples
at numerous sites so that they can stay informed about the state of the river, while helping to monitor
and attempt to improve water quality in the area.
The University of TX Rio Grande Valley‐ Edinburg campus (UTRGV‐Edinburg) conducts routine
monitoring quarterly at three sites and three times per year at one site. Monitoring stations are on Arroyo
Los Olmos, an impaired tributary to the Rio Grande, and one site on the Rio Grande downstream of said
tributary. Water samples are shipped to A&B Laboratory for analyses. UTRGV‐Edinburg is interested in how
the water quality of the Rio Grande affects the Rio Grande Valley and plan to use the CRP sampling events
to train students in water programs, as well as for research on Rio Grande‐related graduate work.
The University of TX Rio Grande Valley‐ Brownsville campus (UTRGV‐Brownsville, formerly UT
Brownsville) conducts quarterly routine monitoring at four sites in the lower Rio Grande, including two
tidal stations. Conventional and E. coli samples are shipped to A&B Laboratory for analysis while enterococcus
samples are provided to BPUB for analysis. UTRGV‐Brownsville has been a CRP partner for many years and they
conduct the only routine monitoring on Segment 2301. Monitoring events provide an opportunity to train
students in water programs and for research on Rio Grande‐related graduate work.
USIBWC QAPP Last Revised on February 11, 2016
USIBWC FY CRP1617QAPP_AMENDMENT 1
Brownsville Public Utilities Board (BPUB) conducts monthly monitoring at one site near their water
treatment facility intake on the Rio Grande in conjunction with their requirements to for the city of
Brownsville. Bacteriological and limited conventionals are collected. No field or flow data is collected.
Midland College collects samples along the Pecos River. They use the CRP sampling events to train
students in water programs, as well as for research on Pecos‐related graduate work and projects.
Amendments to the QAPP Revisions to the QAPP may be necessary to address incorrectly documented information or to reflect
changes in project organization, tasks, schedules, objectives, and methods. Requests for amendments will
be directed from the USIBWC Project Manager to the CRP Project Manager electronically. The USIBWC
will submit a completed QAPP Amendment document, including a justification of the amendment, a table
of changes, and all pages, sections or attachments affected by the amendment. Amendments are
effective immediately upon approval by the USIBWC Program Manager, the USIBWC QAO, the CRP Project
Manager, the TCEQ QA Manager (or designee), the CRP Project QA Specialist, and additional parties
affected by the amendment. Amendments are not retroactive. No work shall be implemented without an
approved QAPP or amendment prior to the start of work. Any activities under this contract that
commence prior to the approval of the governing QA document constitute a deficiency and are subject
to corrective action as described in section C1 of this QAPP. Any deviation or deficiency from this QAPP
which occurs after the execution of this QAPP should be addressed through a Corrective Action Plan
(CAP). An Amendment may be a component of a CAP to prevent future recurrence of a deviation.
Amendments will be incorporated into the QAPP by way of attachment and distributed to personnel on
the distribution list by the USIBWC Program Manager.
Special Project Appendices Projects requiring QAPP appendices will be planned in consultation with the USIBWC and the TCEQ Project
Manager and TCEQ technical staff. Appendices will be written in an abbreviated format and will reference
the Basin QAPP where appropriate. Appendices will be approved by the USIBWC Program Manager, the
USIBWC QAO, the Laboratory (as applicable), and the CRP Project Manager, the CRP Project QA Specialist,
the TCEQ QA Manager (or designee) and other TCEQ personnel, as appropriate.
Copies of approved QAPP appendices will be distributed by the USIBWC to project participants before
data collection activities commence.

USIBWC QAPP Last Revised on February 11, 2016
USIBWC FY CRP1617QAPP_AMENDMENT 1
Table A7.1 ‐ Measurement Performance Specifications
TABLE A7.1 Measurement Performance Specifications for Partners
Field Parameters
Parameter
Units
Matrix
Method
Param
eter
Code
Lab
TEMPERATURE, WATER (DEGREES CENTIGRADE) DEG C water
SM 2550 B and TCEQ SOP V1
00010 Field
TEMPERATURE, AIR (DEGREES CENTIGRADE) DEG C air TCEQ SOP V1 00020 Field
RESERVOIR ACCESS NOT POSSIBLE LEVEL TOO LOW ENTER 1 IF REPORTING
NS other TCEQ
Drought Guidance
00051 Field
RESERVOIR STAGE (FT ABOVE MEAN SEA LEVEL) ** FT ABOVE MSL water TWDB 00052 Field
RESERVOIR PERCENT FULL**
% RESERVOIR CAPACITY water
TWDB 00053 Field
TRANSPARENCY, SECCHI DISC (METERS) meters water TCEQ SOP V1 00078 Field
SPECIFIC CONDUCTANCE,FIELD (US/CM @ 25C) us/cm water
EPA 120.1 and TCEQ SOP, V1
00094 Field
OXYGEN, DISSOLVED (MG/L) mg/L water
SM 4500‐O G and TCEQ SOP V1
00300 Field
PH (STANDARD UNITS) s.u water
EPA 150.1 and TCEQ SOP V1
00400 Field
DAYS SINCE PRECIPITATION EVENT (DAYS) days other TCEQ SOP V1 72053 Field
TURBIDITY, FIELD NEPHELOMETRIC TURBIDITY UNITS, N NTU water SM 2130‐B 82078 Field
WIND DIRECTION (1=North, 2=South, 3=East, 4=West, 5=NE, 6=SE, 7=NW, 8=SW)
NU other NA 89010 Field
AVERAGE STREAM WIDTH (METERS) meters water TCEQ SOP V1 89861 Field
DEPTH OF BOTTOM OF WATER BODY AT SAMPLE SITE meters water TCEQ SOP V2 82903 Field
MAXIMUM POOL WIDTH AT TIME OF STUDY (METERS)*** meters other TCEQ SOP V2 89864 Field
MAXIMUM POOL DEPTH AT TIME OF STUDY(METERS)*** meters other TCEQ SOP V2 89865 Field
POOL LENGTH, METERS*** meters other TCEQ SOP V2 89869 Field
% POOL COVERAGE IN 500 METER REACH*** % other TCEQ SOP V2 89870 Field
WIND INTENSITY (1=CALM,2=SLIGHT,3=MOD.,4=STRONG) NU other NA 89965 Field
PRESENT WEATHER (1=CLEAR,2=PTCLDY,3=CLDY,4=RAIN,5=OTHER) NU other NA 89966 Field
WATER SURFACE(1=CALM,2=RIPPLE,3=WAVE,4=WHITECAP) NU water NA 89968 Field
PRIMARY CONTACT, OBSERVED ACTIVITY (# OF PEOPLE OBSERVED) # of people observed other
NA 89978 Field
EVIDENCE OF PRIMARY CONTACT RECREATION (1 = OBSERVED, 0 = NOT OBSERVED) NU other NA 89979 Field
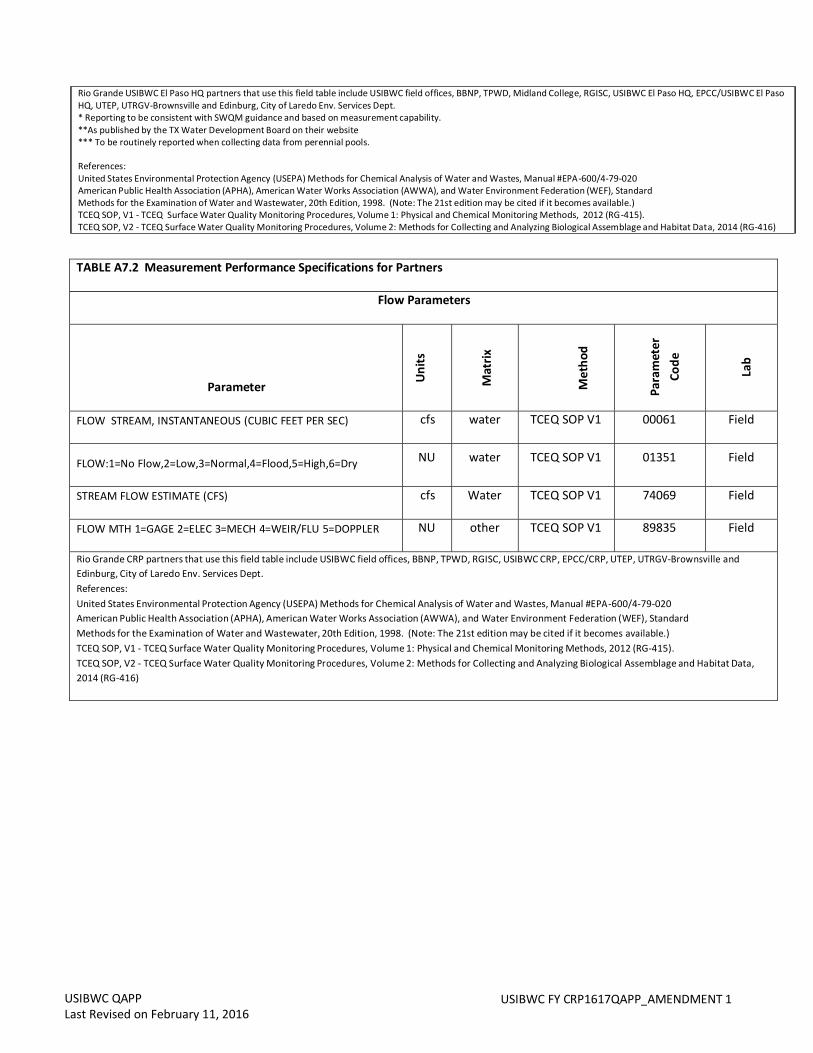
USIBWC QAPP Last Revised on February 11, 2016
USIBWC FY CRP1617QAPP_AMENDMENT 1
Rio Grande USIBWC El Paso HQ partners that use this field table include USIBWC field offices, BBNP, TPWD, Midland College, RGISC, USIBWC El Paso HQ, EPCC/USIBWC El PasoHQ, UTEP, UTRGV‐Brownsville and Edinburg, City of Laredo Env. Services Dept. * Reporting to be consistent with SWQM guidance and based on measurement capability. **As published by the TX Water Development Board on their website *** To be routinely reported when collecting data from perennial pools.
References: United States Environmental Protection Agency (USEPA) Methods for Chemical Analysis of Water and Wastes, Manual #EPA ‐600/4‐79‐020 American Public Health Association (APHA), American Water Works Association (AWWA), and Water Environment Federation (WEF), Standard Methods for the Examination of Water and Wastewater, 20th Edition, 1998. (Note: The 21st edition may be cited if it becomes available.) TCEQ SOP, V1 ‐ TCEQ Surface Water Quality Monitoring Procedures, Volume 1: Physical and Chemical Monitoring Methods, 2012 (RG ‐415). TCEQ SOP, V2 ‐ TCEQ Surface Water Quality Monitoring Procedures, Volume 2: Methods for Collecting and Analyzing Biological Assemblage and Habitat Dat a, 2014 (RG‐416)
TABLE A7.2 Measurement Performance Specifications for Partners
Flow Parameters
Parameter
Units
Matrix
Method
Param
eter
Code
Lab
FLOW STREAM, INSTANTANEOUS (CUBIC FEET PER SEC) cfs water TCEQ SOP V1 00061 Field
FLOW:1=No Flow,2=Low,3=Normal,4=Flood,5=High,6=Dry NU water TCEQ SOP V1 01351 Field
STREAM FLOW ESTIMATE (CFS) cfs Water TCEQ SOP V1 74069 Field
FLOW MTH 1=GAGE 2=ELEC 3=MECH 4=WEIR/FLU 5=DOPPLER NU other TCEQ SOP V1 89835 Field
Rio Grande CRP partners that use this field table include USIBWC field offices, BBNP, TPWD, RGISC, USIBWC CRP, EPCC/CRP, UTEP, UTRGV‐Brownsville and
Edinburg, City of Laredo Env. Services Dept.
References:
United States Environmental Protection Agency (USEPA) Methods for Chemical Analysis of Water and Wastes, Manual #EPA ‐600/4‐79‐020
American Public Health Association (APHA), American Water Works Association (AWWA), and Water Environment Federation (WEF), Standard
Methods for the Examination of Water and Wastewater, 20th Edition, 1998. (Note: The 21st edition may be cited if it becomes available.)
TCEQ SOP, V1 ‐ TCEQ Surface Water Quality Monitoring Procedures, Volume 1: Physical and Chemical Monitoring Methods, 2012 (RG‐415).
TCEQ SOP, V2 ‐ TCEQ Surface Water Quality Monitoring Procedures, Volume 2: Methods for Collecting and Analyzing Biological Assemblage and Habitat Data,
2014 (RG‐416)

USIBWC QAPP Last Revised on February 11, 2016
USIBWC FY CRP1617QAPP_AMENDMENT 1
TABLE A7.3 Measurement Performance Specifications for Partners that use A&B Environmental Services Inc.
Conventional Parameters in Water
Parameter
Units
Matrix
Method
Param
eter Code
TCEQ
AWRL
LOQ
LOQ Verification
Sample %Rec
(Method defined
) Precision (RPD of
LCS/LCSD
)
Bias %Rec. o
f LCS
Lab
BIOCHEMICAL OXYGEN DEMAND
(MG/L, 5 DAY ‐ 20DEG C
mg/L
water EPA 405.1, 00310 2 2
NA
NA NA A&B
CHEMICAL OXYGEN DEMAND,
.025N K2CR2O7 (MG/L)
mg/L
water
EPA 410.4,
SM 5220C
or D 00335 10 10
70‐130
20
80‐
120 A&B
ALKALINITY, TOTAL (MG/L AS
CACO3)
mg/L
water EPA 310.1,
SM 2320B 00410 20 20
NA
20 NA A&B
RESIDUE, TOTAL NONFILTRABLE
(MG/L)
mg/L
water SM 2540B,
SM 2540D 00530 5 2.5
NA
NA NA A&B
RESIDUE, VOLATILE
NONFILTRABLE (MG/L)
mg/L
water EPA 160.4 00535 5 2.5
NA
NA NA A&B
NITROGEN, AMMONIA, TOTAL
(MG/L AS N)
mg/L
water
EPA 350.3,
SM 4500‐
NH3 D 00610 0.1 0.1
70‐130
20
80‐
120 A&B
NITRITE PLUS NITRATE, TOTAL 1
DET. (MG/L AS N)
mg/L
water
EPA 300.0,
EPA 353.2,
EPA 353.3,
EPA 9056,
SM 4500‐
NO3 E
00630
0.05
0.05
70‐130
20
80‐
120
A&B
PHOSPHORUS, TOTAL, WET
METHOD (MG/L AS P)
mg/L
water
EPA 200.7,
EPA 365.2,
SM 4500‐P
E
00665
0.06
0.05
70‐130
20 80‐
120
A&B
CARBON, TOTAL ORGANIC, NPOC
(TOC), MG/L
mg/L
water
EPA 415.1,
EPA 9060,
SM 5310 B 00680 2
1
70‐130
10
80‐
120 A&B
HARDNESS, TOTAL (MG/L AS
CACO3)*
mg/L
water
EPA 130.2,
SM 2340 B
or C 00900 5
1
70‐130
20
80‐
120 A&B

USIBWC QAPP Last Revised on February 11, 2016
USIBWC FY CRP1617QAPP_AMENDMENT 1
Parameter
Units
Matrix
Method
Param
eter Code
TCEQ
AWRL
LOQ
LOQ Verification
Sample %Rec
(Method defined
) Precision (RPD of
LCS/LCSD
)
Bias %Rec. o
f LCS
Lab
SULFATE (MG/L AS SO4)
mg/L
water
EPA 300.0
Rev. 2.1
(1993),
EPA 9056
00945
5
0.1
70‐130
20 80‐
120
A&B
BROMIDE, TOTAL (MG/L as BR)
mg/L
water EPA 300.0,
EPA 9056 71870 NA 0.1 70‐130
20 80‐
120 A&B
CHLOROPHYLL‐A UG/L
SPECTROPHOTOMETRIC ACID.
METH
ug/L
water
SM 10200
H 32211 3 3 60‐140
20
80‐
120 A&B
PHEOPHYTIN‐A UG/L
SPECTROPHOTOMETRIC ACID.
METH.
μg/L
water
SM 10200
H 32218 3 3 60‐140
NA NA A&B
RESIDUE,TOTAL FILTRABLE (DRIED
AT 180C) (MG/L)
mg/L
water SM 2540C 70300 10 10 NA
20 80‐
120 A&B
TURBIDITY,LAB NEPHELOMETRIC
TURBIDITY UNITS, NTU
NTU
water EPA 180.1,
SM 2130B 82079 0.5 0.1 70‐130
NA NA A&B
Rio Grande CRP partners that use this field table include USIBWC field offices, BBNP, TPWD, RGISC, USIBWC CRP, EPCC/CRP, UTEP, UTRGV‐Brownsville and
Edinburg, City of Laredo Env. Services Dept.
Calcium, Sodium, and Potassium are listed here because they are part of the contract laboratory conventionals analysis for the USIBWC CRP monitoring program.
*Hardness is not used for regulatory purposes but is used to assess metals in water at inland sites (estuarine sites do not require hardness analysis).
References: United States Environmental Protection Agency (USEPA) Methods for Chemical Analysis of Water and Wastes, Manual #EPA ‐600/4‐79‐020American
Public Health Association (APHA), American Water Works Association (AWWA), and Water Environment Federation (WEF), Standard Methods for the Examination
of Water and Wastewater, 20th Edition, 1998. (Note: The 21st edition may be cited if it becomes available.) TCEQ SOP, V1 ‐ TCEQ Surface Water Quality Monitoring
Procedures, Volume 1: Physical and Chemical Monitoring Methods, 2012 (RG‐415).
TCEQ SOP, V2 ‐ TCEQ Surface Water Quality Monitoring Procedures, Volume 2: Methods for Collecting and Analyzing Biological Assemblage and Habitat Data,
2014 (RG‐416)

USIBWC QAPP Last Revised on February 11, 2016
USIBWC FY CRP1617QAPP_AMENDMENT 1
TABLE A7.6 Measurement Performance Specifications for Partners that use A&B Environmental Services Inc.
Metals in Sediment
Parameter
Units
Matrix
Method
Param
eter Code
TCEQ
AWRL
LOQ
LOQ Verification
Sample %Rec
Precision (RPD of
LCS/LCSD
)
Bias %Rec. of LCS
Lab
ARSENIC, BOTTOM DEPOSITS (MG/KG AS AS DRY WT)
mg/kg sediment EPA 6010, EPA
6020 01003 16.5 0.5
60‐140
30 60‐140
A&B
BARIUM, BOTTOM DEPOSITS (MG/KG AS BA DRY WT)
mg/kg sediment EPA 6010, EPA
6020 01008 NA 0.5
60‐140
30 60‐140
A&B
CADMIUM,TOTAL, BOTTOM DEPOSITS (MG/KG,DRY WT)
mg/kg sediment EPA 6010, EPA
6020 01028 2.49 0.5
60‐140
30 60‐140
A&B
CHROMIUM,TOTAL, BOTTOM DEPOSITS (MG/KG,DRY WT
mg/kg sediment EPA 6010, EPA
6020 01029 55.5 0.5
60‐140
30 60‐140
A&B
COPPER, BOTTOM DEPOSITS (MG/KG AS CU DRY WT)
mg/kg sediment EPA 6010, EPA
6020 01043 74.5 0.5
60‐140
30 60‐140
A&B
LEAD, BOTTOM DEPOSITS (MG/KG AS PB DRY WT)
mg/kg sediment EPA 6010, EPA
6020 01052 64 0.5
60‐140
30 60‐140
A&B
MANGANESE, BOTTOM DEPOSITS (MG/KG AS MN DRY WG
mg/kg sediment EPA 6010, EPA
6020 01053 550 0.5
60‐140
30 60‐140
A&B
NICKEL, TOTAL, BOTTOM DEPOSITS (MG/KG,DRY WT)
mg/kg sediment EPA 6010, EPA
6020 01068 24.3 0.5
60‐140
30 60‐140
A&B
SILVER, BOTTOM DEPOSITS (MG/KG AS AG DRY WT)
mg/kg sediment EPA 6010, EPA
6020 01078 1.1 0.5
60‐140
30 60‐140
A&B
ZINC, BOTTOM DEPOSITS (MG/KG AS ZN DRY WT)
mg/kg sediment EPA 6010, EPA
6020 01093 205 0.5
60‐140
30 60‐140
A&B
ANTIMONY, BOTTOM DEPOSITS (MG/KG AS SB DRY WT
mg/kg sediment EPA 6010, EPA
6020A 01098 12.5 1.25
60‐140
30 60‐140
A&B
ALUMINUM, BOTTOM DEPOSITS (MG/KG AS AL DRY WT
mg/kg sediment EPA 6010, EPA
6020 01108 NA 0.5
60‐140
30 60‐140
A&B
SELENIUM, BOTTOM DEPOSITS (MG/KG AS SE DRY WT)
mg/kg sediment EPA 6010, EPA
6020 01148 NA 0.5
60‐140
30 60‐140
A&B
MERCURY,TOT. IN BOT. DEPOS. (MG/KG) AS HG DRY WG
mg/kg sediment EPA 7470 71921 0.355 0.01 60‐140
30 60‐140
A&B
SEDIMENT PRTCL.SIZE CLASS >2.0MM GRAVEL %DRY WT*
% DRY WT
sediment ASTM D 422, ASTM 442‐63
80256 NA NA NA %gravel ‐
20 NA A&B

USIBWC QAPP Last Revised on February 11, 2016
USIBWC FY CRP1617QAPP_AMENDMENT 1
SOLIDS IN SEDIMENT, PERCENT BY WEIGHT (DRY)
% DRY WT
sediment SM 2540G 81373 NA NA NA 20 NA A&B
TABLE A7.6 Measurement Performance Specifications for Partners that use A&B Environmental Services Inc.
Metals in Sediment
Parameter
Units
Matrix
Method
Param
eter Code
TCEQ
AWRL
LOQ
LOQ Verification Sam
ple
%Rec (M
ethod defined)
Precision (RPD of
LCS/LCSD
)
Bias %Rec. of LCS
Lab
PARTICLE SIZE, 0.05‐0.002mm SILT, DRYWT,SEDIMENT*
% sediment ASTM D 422, ASTM 442‐63
49906 NA NA NA %silt ‐ 20 NA A&B
SEDIMENT PRTL.SIZE CLASS.0039‐.0625 SILT %DRY W*
% DRY WT
sediment ASTM D 422, ASTM 442‐63
82008 NA NA NA %silt ‐ 20 NA A&B
PARTICLE SIZE,CLAY0.002‐0.0002mm DRYWT,SEDIMENT%*
% sediment ASTM D 422, ASTM 442‐63
49900 NA NA NA %clay – 20
NA A&B
SEDIMENT PRCTL.SIZE CLASS <.0039 CLAY %DRY WT*
% sediment ASTM D 422, ASTM 442‐63
82009 NA NA NA %clay – 20
NA A&B
SEDIMENT PRCTL.SIZE CLASS,SAND .0625‐2MM %DRYWT*
% sediment ASTM D 422, ASTM 442‐63
89991 NA NA NA %sand ‐
20 NA A&B
Rio Grande CRP partners that use this field table include USIBWC Amistad Dam field office and City of Laredo Env. Services Dept. *Sediment conventionals are not used for regulatory purposes but are extremely important in determining the availability of sediment toxics. Sediment grain size and TOC are recommended when analyzing metals and/or organics in sediment. References: United States Environmental Protection Agency (USEPA) Methods for Chemical Analysis of Water and Wastes, Manual #EPA‐600/4‐79‐020American Public Health Association (APHA), American Water Works Association (AWWA), and Water Environment Federation (WEF), Standard Methods for the Examination of Water and Wastewater, 20th Edition, 1998. (Note: The 21st edition may be cited if it becomes available.) TCEQ SOP, V1 ‐ TCEQ Surface Water Quality Monitoring Procedures, Volume 1: Physical and Chemical Monitoring Methods, 2012 (RG‐415). TCEQ SOP, V2 ‐ TCEQ Surface Water Quality Monitoring Procedures, Volume 2: Methods for Collecting and Analyzing Biological Assemblage and Habitat Data, 2014 (RG‐416)
TABLE A7.12 Measurement Performance Specifications for El Paso Water Utilities Laboratory
Conventional Parameters in Water

USIBWC QAPP Last Revised on February 11, 2016
USIBWC FY CRP1617QAPP_AMENDMENT 1
Parameter
Units
Matrix
Method
Param
eter Code
TCEQ
AWRL
LOQ
LOQ Verification
Sample %Rec
(Method
defined)
Precision (RPD
of LCS /LCSD
)
Bias %Rec. of
LCS
Lab
BIOCHEMICAL OXYGEN DEMAND (MG/L, 5 DAY ‐ 20DEG C
mg/L water SM 5210B 00310 2 2 NA NA NA EPWU
NITROGEN, AMMONIA, TOTAL (MG/L AS N)
mg/L water EPA 350.1 Rev. 2.0 (1993)
00610 0.1 0.5 NA 20 80‐120 EPWU
CHLOROPHYLL‐A UG/L SPECTROPHOTOMETRIC ACID. METH
μg/L water SM 10200
H 32211 3 3 NA 20 80‐120 EPWU
TURBIDITY,LAB NEPHELOMETRIC TURBIDITY UNITS, NTU
NTU water SM 2130B 82079 0.5 0.1 NA NA NA EPWU
The EPWU lab analyzes samples collected by the USIBWC American Dam field office. References: United States Environmental Protection Agency (USEPA) Methods for Chemical Analysis of Water and Wastes, Manual #EPA‐600/4‐79‐020 American Public Health Association (APHA), American Water Works Association (AWWA), and Water Environment Federation (WEF), Standard Methods for the Examination of Water and Wastewater, 20th Edition, 1998. (Note: The 21st edition may be cited if it becomes available.) TCEQ SOP, V1 ‐ TCEQ Surface Water Quality Monitoring Procedures, Volume 1: Physical and Chemical Monitoring Methods, 2012 (RG‐415). TCEQ SOP, V2 ‐ TCEQ Surface Water Quality Monitoring Procedures, Volume 2: Methods for Collecting and Analyzing Biological Assemblage and Habitat Data, 2014 (RG‐416)

USIBWC QAPP Last Revised on February 11, 2016
USIBWC FY CRP1617QAPP_AMENDMENT 1
B10 Data Management
Data Dictionary Terminology and field descriptions are included in the DMRG, or most recent version. A table outlining the entities that will be used when submitting data under this QAPP is included below for the purpose of verifying which entity codes are included in this QAPP.
Table 8: B10.1 Submitting and Collecting Entity Codes
Name of Monitoring Entity Tag Prefix Submitting Entity
Collecting Entity
USIBWC American Dam Field Office BD IB IB
USIBWC Amistad Dam Field Office BA IB IB
USIBWC Falcon Dam Field Office BF IB IB
USIBWC Presidio Office BP IB IB
USIBWC Mercedes Field Office BM IB IB
USIBWC El Paso Headquarters BH IB IB
Rio Grande International Study Center B IB RN
Big Bend National Park B IB BB
City of Laredo Health Serv. B IB LA
City of Laredo Env. Services B IB LE
Univ. of TX at El Paso B IB UE
Brownsville PUB B IB BO
El Paso Community College B IB EP
TX Parks and Wildlife Dept. B IB PW
Midland College B IB MC
Univ. of Texas Rio Grande Valley‐ Edinburg B IB PT
Univ. of TX Rio Grande Valley – Brownsville B IB UB

USIBWC QAPP Last revised on February 11, 2016 USIBWC FY CRP1617QAPP_AMENDMENT 1
C1 Assessments and Response Actions
The following table presents the types of assessments and response actions for data collection activities applicable to the QAPP.
Table C1.1 Assessments and Response Requirements
Assessment Activity
Approximate Schedule
Responsible
Party
Scope Response
RequirementsStatus Monitoring Oversight, etc.
Continuous USIBWC Monitoring of the project status and records to ensure requirements are being fulfilled
Report to TCEQ inQuarterly Report
Monitoring Systems Audit of Basin Planning Agency
Dates to be determined by TCEQ CRP
TCEQ Field sampling, handlingand measurement; facility review; and data management as they relate to CRP
30 days to respond inwriting to the TCEQ to address corrective actions
Monitoring Systems Audit of Program Subparticipants
Dates to be determined by the USIBWC (at least 4 in‐ person audits per year)
USIBWC Field sampling, handlingand measurement; facility review; and data management as they relate to CRP
30 days to respond inwriting to the USIBWC. PA will report problems to TCEQ in Progress Report.
Laboratory Inspection
Dates to be determined by TCEQ
TCEQ Laboratory Inspector
Analytical and quality control procedures employed at the laboratory and the contract laboratory
30 days to respond in writing to the TCEQ to address corrective actions
Desk Audit/Data Traceability Review
Dates to be determined by the USIBWC (every biennium an on‐site visit is not conducted)
USIBWC Review of all calibrationdocumentation, field sheet and chain of custody records. Data will be checked by selecting a date range and checking the data against USIBWC El Paso Headquarters records.
30 days to respond inwriting to the USIBWC.PA will report problems to TCEQ in Progress Report.
*The USIBWC El Paso Headquarters and the TCEQ Project Manager discussed adjusting the audits for the next contract years due to budgetary
constraints. The new contract allows for the QAPP to specify that the USIBWC El Paso Headquarters will conduct a minimum of 4 in‐person,
on‐site monitoring systems audits of partners every year, excluding the laboratories. Every biennium an on‐ site monitoring systems audit is
not conducted, a desk audit or data traceability review may be conducted, for a total of 7 desk audits. Readiness reviews will be conducted with all new partners, and all partners with new personnel.
** The USIBWC El Paso Headquarters would like to note that two partners (UTEP‐ Walsh, EPCC) do not sample independently, they sample
with the USIBWC El Paso Headquarters, and assist the USIBWC El Paso Headquarters by collecting the water samples. USIBWC El Paso
Headquarters has direct oversight on UTEP and EPCC and could not perform an unbiased audit. However, UTEP may become independent
enough to begin sampling on their own, at which time the USIBWC El Paso Headquarters would audit them.

USIBWC QAPP Last revised on February 11, 2016 USIBWC FY CRP1617QAPP_AMENDMENT 1
Table 15: Appendix B.2, shown below, specifies which lab each CRP partners sends their samples to for analysis. The groups are arranged similarly to Table A7 found in Appendix A. An “X” in the column indicates that the sends their samples to that particular lab.
Table15:AppendixB.2CRPPartnersandtheirAffiliatedLabPartner A&B EPWU BPUB Laredo
Health USIBWC American Dam Field Office Bacteria
Conventionals
USIBWC Amistad Dam Field Office ConventionalsBacteria
Metals in Sed
USIBWC Falcon Dam Field Office ConventionalsBacteria
USIBWC Presidio Field Office Conventionals
Bacteria Metals in Wat
USIBWC Mercedes Field Office Conventionals
Bacteria
Big Bend National Park ConventionalsBacteria
Metals in Wat
Brownsville Public Utilities Board Bacteria Conventionals
El Paso Community College (with CRP) ConventionalsBacteria
City of Laredo Environmental Services ConventionalsBacteria
Metals in Wat Metals in Sed
City of Laredo Health Department Bacteria
Rio Grande International Study Center ConventionalsBacteria
TX Parks and Wildlife Department ConventionalsBacteria
Metals in Wat
University of Texas Rio Grande Valley‐ Brownsville*
Conventionals
Bacteria (2) Bacteria
(entero at 2)
University of Texas Rio Grande Valley‐ Edinburg
Conventionals Bacteria
Midland College ConventionalsBacteria
University of TX at El Paso‐ Walsh ConventionalsBacteria
USIBWC El Paso Headquarters ConventionalsBacteria
*UTRGV ‐ Brownsville samples four sites, two tidal and two non‐tidal stations. The non‐tidal station bacteria samples are sent to A&B for
E.coli analysis, and the two tidal station bacteria samples are sent to BPUB for Entero analysis.

USIBWC QAPP Last revised on February 11, 2016 USIBWC FY CRP1617QAPP_AMENDMENT 1
Table16: AppendixB.3CRPPartnersandtheirFieldSheets
Partner Field form
With Turbidity
Field form without turbidity
Sediment sample
field form
Drought field form
Partial Field Form
Big Bend National Park X X
Brownsville Public Utilities Board
City of Laredo Environmental Services
X X X
City of Laredo Health Department X El Paso Community College (with USIBWC El Paso HQ)
X X
Midland College X X Rio Grande International Study Center
X
TX Parks and Wildlife Department X X
University of Texas Rio Grande Valley‐ Brownsville
X
University of Texas Rio Grande Valley‐ Edinburg
X
University of TX at El Paso‐ Walsh (by herself and with USIBWC El Paso HQ)
X X
USIBWC American Dam Field Office
X
USIBWC Amistad Dam Field Office X X X
USIBWC Falcon Dam Field Office X
USIBWC Presidio Field Office X X
USIBWC Mercedes Field Office X
USIBWC El Paso Headquarters X X
Monitoring Sites for FY 2016
USIBWCQAPP Last revised on February 11, 2016
USIBWC FY CRP1617QAPP_AMENDMENT 1

USIBWC FY CRP1617QAPP_AMENDMENT 1
USIBWC QAPP Last Revised on February 11, 2016
Site Description
Station
ID
Water body
ID
Regio
n SE
CE MT
24 hr
DO
Aq Hab Ben Nek Met Wat Org
WatMetSed
Org Sed
Conv
Amb Tox Wat
Amb Tox Sed
Bact Flow FishTiss Field Comments
Segment 2301 Rio Grande Tidal | Map
RIO GRANDE RIVER TIDAL AT THE END OF QUICKSILVER AVE 375 METERS SOUTH FROM THE INTERSECTION OF BOCA CHICA BLVD AND QUICKSILVER AVE | Map
13176
2301
15
IB
UB
RT
4
4
4
RIO GRANDE RIVER AT SABAL PALM SANCTUARY 370 METERS SOUTH AND 310 METERS EAST FROM THE INTERSECTION OF DAKOTA AVE AND SABAL PALM GROVE ROAD | Map
16288
2301
15
IB
UB
RT
4
4
4
Entero analyzed by BPUB. Conventionals by IBW C lab.
Segment 2302 Rio Grande Below Falcon Reservoir | Map
RIO GRANDE AT EL JARDIN PUMP STATION LOCATED 350 METERS W EST OF INTERSECTION OF MONSEES ROAD AND CALLE MILPA VERDE | Map
13177
2302
15
IB
IB
RT
8
8
8
8
RIO GRANDE INTERNATIONAL BRIDGE ON US 77 AT BROW NSVILLE | Map
13178
2302
15
IB
UB
RT
4
4
4

USIBWC FY CRP1617QAPP_AMENDMENT 1
USIBWC QAPP Last Revised on February 11, 2016
Site Description
Station
ID
Water body
ID
Regio
n
SE
CE MT24 hr
DO
AqHab Ben Nek Met Wat Org
WatMet Sed
Org Sed Conv
Amb Tox Wat
Amb Tox Sed
Bact Flow FishTiss Field Comments
RIO GRANDE RIVER AT RIVER BEND GOLF COURSE BOAT RAMP WEST OF BROW NSVILLE | Map
13179
2302
15
IB
UB
RT
4
4
4
RIO GRANDE RIVER AT HW Y 281/INTERNATIONAL BLVD IN HIDALGO | Map
13181
2302
15
IB
IB RT
8
8
8
8
RIO GRANDE AT FM 886 NEAR LOS EBANOS | Map
13184
2302
15
IB
IB RT
7
7 7
7
RIO GRANDE AT FORT RINGGOLD 1 MI DOW NSTREAM OF RIO GRANDE CITY | Map
13185
2302
15
IB
IB
RT
12
12
12
12
RIO GRANDE DOW NSTREAM RIO ALAMO NEAR FRONTON | Map
13186
2302
15
IB
IB
RT
8
8
8
8
RIO GRANDE 0.5 MI DOW NSTREAM ANZALDUAS DAM 12.2 MI FROM HIDALGO | Map
13664
2302
15
IB
IB RT
8
8
8
8
RIO GRANDE 300M UPSTREAM OF PHARR INTERNATIONAL BRIDGE/US 281 | Map
15808
2302
15
IB
IB
RT
8
8
8
8

USIBWC FY CRP1617QAPP_AMENDMENT 1
USIBWC QAPP Last Revised on February 11, 2016
Site Description
Station
ID
Water body
ID
Regio
n SE
CE MT
24 hr
DO
Aq Hab Ben Nek Met Wat Org
WatMetSed
Org Sed
Conv
Amb Tox Wat
Amb Tox Sed
Bact Flow FishTiss Field Comments
RIO GRANDE RIVER AT BROW NSVILLE PUB WATER TREATMENT PLANT NUMBER 1 INTAKE BETWEEN WTP RESERVOIR AND RIO GRANDE LEVEE 910 METERS W EST AND 335 METERS SOUTH TO THE INTERSECTION OF WEST ELIZABETH STREET AND SOUTH MILITARY ROAD | Map
20449
2302
15
IB
BO
RT
12
12
E. coli and limited conventionals
RIO GRANDE APPROX 380 METERS DOW NSTREAM OF CONFLUENCE W ITH LOS OLMOS CREEK | Map
21749
2302
15
IB
PT
RT
4
4
4
4 New site, added FY16
LOS OLMOS CREEK AT US 83/EAST 2ND STREET SOUTH OF RIO GRANDE CITY | Map
13103
2302A
15
IB
IB
RT
3
3
3
3
LOS OLMOS CREEK AT US 83/EAST 2ND STREET SOUTH OF RIO GRANDE CITY | Map
13103
2302A
15
IB
PT RT
3
3
3
3 Added FY16.
ARROYO LOS OLMOS AT SH 755 NW OF RIO GRANDE CITY | Map
13104
2302A
15
IB
PT RT
4
4 4 4 Added FY16.
ARROYO LOS OLMOS 400M UPSTREAM OF CONFLUENCE W ITH RIO GRANDE NEAR RIO GRANDE CITY
21591
2302A
15
IB
PT RT
4 4 4 4 Added FY16.
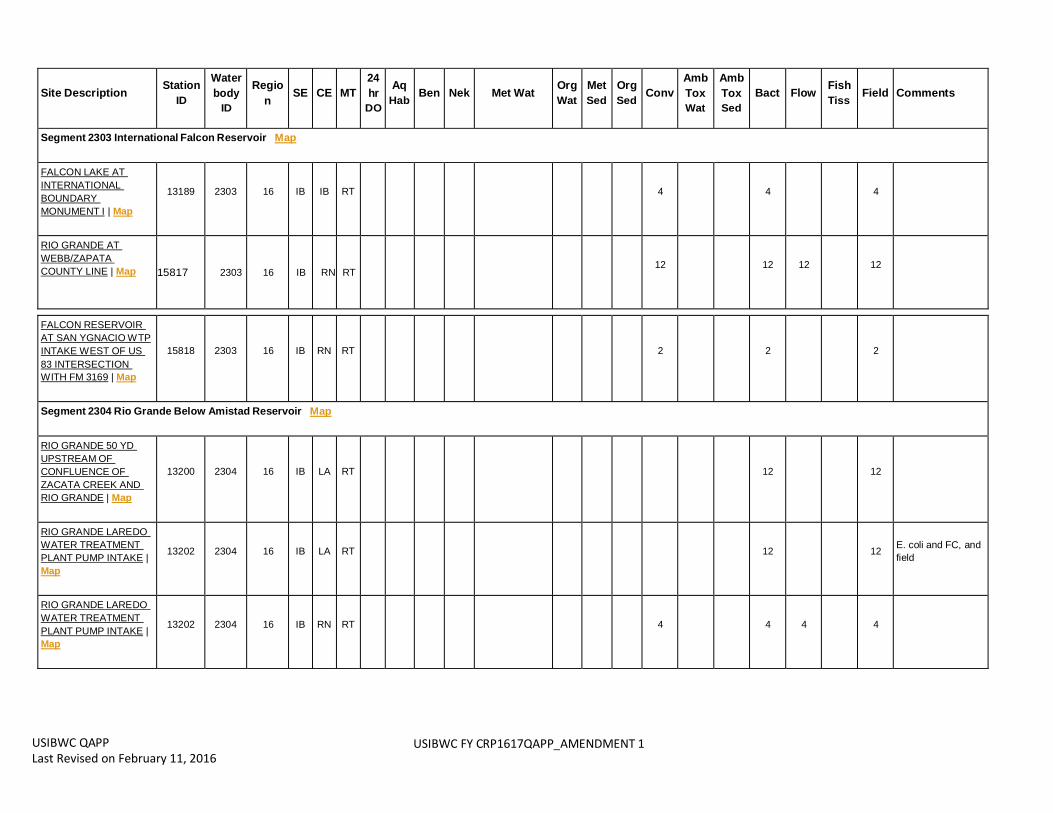
USIBWC FY CRP1617QAPP_AMENDMENT 1
USIBWC QAPP Last Revised on February 11, 2016
Site Description
Station
ID
Water body
ID
Regio
n SE
CE MT
24 hr
DO
Aq Hab Ben Nek Met Wat Org
WatMetSed
Org Sed
Conv
Amb Tox Wat
Amb Tox Sed
Bact Flow FishTiss Field Comments
Segment 2303 International Falcon Reservoir Map
FALCON LAKE AT INTERNATIONAL BOUNDARY MONUMENT I | Map
13189
2303
16
IB
IB
RT
4
4
4
RIO GRANDE AT WEBB/ZAPATA COUNTY LINE | Map 15817 2303 16 IB RN RT
12
12
12
12
FALCON RESERVOIR AT SAN YGNACIO W TP INTAKE WEST OF US 83 INTERSECTION WITH FM 3169 | Map
15818
2303
16
IB
RN
RT
2
2
2
Segment 2304 Rio Grande Below Amistad Reservoir Map
RIO GRANDE 50 YD UPSTREAM OF CONFLUENCE OF ZACATA CREEK AND RIO GRANDE | Map
13200
2304
16
IB
LA
RT
12
12
RIO GRANDE LAREDO WATER TREATMENT PLANT PUMP INTAKE | Map
13202
2304
16
IB
LA
RT
12
12 E. coli and FC, and
field
RIO GRANDE LAREDO WATER TREATMENT PLANT PUMP INTAKE | Map
13202
2304
16
IB
RN
RT
4
4
4
4

USIBWC FY CRP1617QAPP_AMENDMENT 1
USIBWC QAPP Last Revised on February 11, 2016
Site Description
Station
ID
Water body
ID
Regio
n SE
CE MT
24 hr
DO
Aq Hab Ben Nek Met Wat Org
WatMetSed
Org Sed
Conv
Amb Tox Wat
Amb Tox Sed
Bact Flow FishTiss Field Comments
RIO GRANDE 12.8 MI DOW NSTREAM AMISTAD DAM NEAR GAGE 340 M UPSTREAM OF US 277 BRIDGE IN DEL RIO | Map
13208
2304
16
IB
IB
RT
2
2
2
2
RIO GRANDE 4.5 MI DOW NSTREAM OF DEL RIO AT MOODY RANCH | Map
13560
2304
16
IB
IB
RT
4
4
4
4
frequency reduced FY12 to add another station in Eagle Pass (20997)
RIO GRANDE AT JUAREZ-LINCOLN INTERNATIONAL BRIDGE / BRIDGE #2 IN LAREDO | Map
15814
2304
16
IB
LA
RT
12
12
12 E. coli and FC; flow from IBW C gage; field data
RIO GRANDE AT JUAREZ-LINCOLN INTERNATIONAL BRIDGE / BRIDGE #2 IN LAREDO | Map
15814
2304
16
IB
RN
RT
4
4
4
4
RIO GRANDE AT MASTERSON RD IN LAREDO 9.9KM DW NSTR INTL BRIDGE #1/W EST BRIDGE DW NSTR SOUTHSIDE WWTP AND UPSTREAM NUEVO LAREDO WWTP | Map
15815
2304
16
IB
LA
RT
12
12
E.coli and fecal coliform, and field data
RIO GRANDE AT RIO BRAVO 0.5KM DW NSTR OF THE COMMUNITY OF EL CENIZO | Map
15816
2304
16
IB
RN
RT
4
4
4 Reactivated for FY 15

USIBWC FY CRP1617QAPP_AMENDMENT 1
USIBWC QAPP Last Revised on February 11, 2016
Site Description
Station
ID
Water body
ID
Regio
n SE
CE MT
24 hr
DO
Aq Hab Ben Nek Met Wat Org
WatMetSed
Org Sed
Conv
Amb Tox Wat
Amb Tox Sed
Bact Flow FishTiss Field Comments
RIO GRANDE AT WEBB/ZAPATA COUNTY LINE | Map
15817
2304
16
IB
RN RT
12
12 12
12
RIO GRANDE AT THE COLOMBIA BRIDGE 2.7KM UPSTREAM OF THE DOLORES PUMP STATION 45.1KM UPSTREAM OF THE LAREDO W TP INTAKE | Map
15839
2304
16
IB
LA
RT
12
12
12
E. coli and FC; flow from IBW C gage; field data
RIO GRANDE AT WORLD TRADE BRIDGE ON FM 3484 | Map
17410
2304
16
IB
RN
RT
4
4
4
4
RIO GRANDE AT APACHE RANCH W EST OF INTERSECTION OF PRIVATE ROAD AND EASTERN AIRSTRIP NO BETW EEN LARADO AND EAGLE PASS | Map
17596
2304
16
IB
IB
RT
4
4
4
4
RIO GRANDE 115 METERS SOUTH AND 304 METERS W EST FROM THE INTERSECTION OF RANCHO VIEJO DRIVE/ZEBU COURT AND RIENDA DRIVE IN FATHER MCNABOE CITY PARK IN LAREDO | Map
20650
2304
16
IB
LA
RT
12
12
E.coli and fecal

USIBWC FY CRP1617QAPP_AMENDMENT 1
USIBWC QAPP Last Revised on February 11, 2016
Site Description
Station
ID
Water body
ID
Regio
n SE
CE MT
24 hr
DO
Aq Hab Ben Nek Met Wat Org
WatMetSed
Org Sed
Conv
Amb Tox Wat
Amb Tox Sed
Bact Flow FishTiss Field Comments
RIO GRANDE AT MAIN STREET BOAT RAMP APPROX 400 METERS UPSTREAM OF US 57/INTERNATIONAL BRIDGE IN EAGLE PASS | Map
20997
2304
16
IB
IB
RT
2
4
4
4
4
new station FY12 to fill data gap in AU 2304_08
RIO GRANDE AT KICKAPOO CASINO BOAT RAMP SOUTH OF EAGLE PASS | Map
20999
2304
16
IB
IB
RT
4
8
8
8
8 replaces 18795 and
18792
RIO GRANDE AT EL CENIZO PARK 220 METERS W EST OF INTERSECTION OF CADENA AND JIMENEZ | Map
21542
2304
16
IB
RN
RT
4
4
4
MANADAS CREEK AT FM 1472 NORTH OF LAREDO | Map
13116
2304B
16
IB
LE
RT
4
1
4
4
4
Also collecting metals in water, lab-filtered not field filtered. Therefore not submitted to SW QMIS but available on IBW C website.

USIBWC FY CRP1617QAPP_AMENDMENT 1
USIBWC QAPP Last Revised on February 11, 2016
Site Description
Station
ID
Water body
ID
Regio
n SE
CE MT
24 hr
DO
Aq Hab Ben Nek Met Wat Org
WatMetSed
Org Sed
Conv
Amb Tox Wat
Amb Tox Sed
Bact Flow FishTiss Field Comments
Segment 2305 International Amistad Reservoir Map
RIO GRANDE 3.03 KILOMETERS UPSTREAM OF RATTLESNAKE CANYON SOUTHW EST OF LANGTRY | Map
20624
2305
16
IB
BB
RT
1
field data collected at least once a year by canoe
RIO GRANDE 1.04 KILOMETERS EAST AND 367 METERS SOUTH FROM THE SOUTH END OF FOSTERS RANCH ROAD IN VAL VERDE COUNTY | Map
20627
2305
16
IB
BB
RT
1
field data collected at least once a year by canoe
RIO GRANDE 1.35 KILOMETERS DOW NSTREAM FROM LANGTRY CREEK AND PUMP CANYON AND 870 METERS EAST AND 350 METERS SOUTH FROM THE INTERSECTION OF STATE PARK ROAD 25 AND TORRES AVENUE IN VAL VERDE COUNTY | Map
20630
2305
16
IB
BB
RT
1
field data collected at least once a year by canoe

USIBWC FY CRP1617QAPP_AMENDMENT 1
USIBWC QAPP Last Revised on February 11, 2016
Site Description
Station
ID
Water body
ID
Regio
n SE
CE MT
24 hr
DO
Aq Hab Ben Nek Met Wat Org
WatMetSed
Org Sed
Conv
Amb Tox Wat
Amb Tox Sed
Bact Flow FishTiss Field Comments
Segment 2306 Rio Grande Above Amistad Reservoir Map
RIO GRANDE 1.895 KILOMETERS SOUTH AND 552 METERS WEST FROM THE INTERSECTION OF UNNAMED STREET AND FOSTER RANCH ROAD AND 10.1021 KILOMETERS SOUTH AND 4.37 KILOMETERS WEST FROM THE INTERSECTION OF US HIGHWAY 90 AND FOSTERS RANCH ROAD IN VAL VERDE COUNTY CAMS 759 | Map
13223
2306
16
IB
BB
RT
1
Field data will be reported at least once in the year.
RIO GRANDE AT HORSE CANYON 2.4 MI DOW NSTREAM OF GERSTACKER BRIDGE | Map
13224
2306
6
IB
BB
RT
1 field data will be reported at least once in the year
RIO GRANDE AT FM 2627/GERSTACKER BRIDGE DOW NSTREAM BIG BEND | Map
13225
2306
6
IB
BB
RT
1 field data will be reported at least once in the year
RIO GRANDE AT STILLW ELL CROSSING | Map
13226
2306
6
IB
BB RT
1
Field data collected by canoe at least once a year.
RIO GRANDE AT THE MOUTH OF SANTA ELENA CANYON | Map
13228
2306
6
IB
BB RT
2
8
8 8
8
Metals - Total Mercury sampled FY12
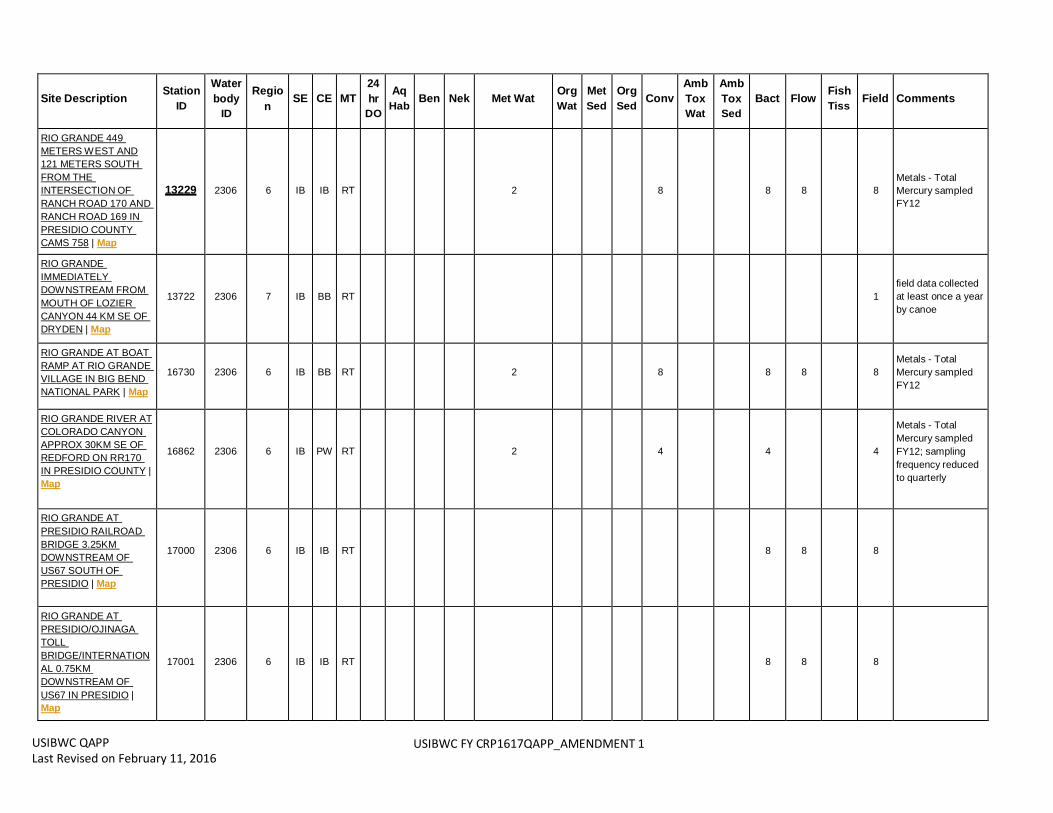
USIBWC FY CRP1617QAPP_AMENDMENT 1
USIBWC QAPP Last Revised on February 11, 2016
Site Description
Station
ID
Water body
ID
Regio
n SE
CE MT
24 hr
DO
Aq Hab Ben Nek Met Wat Org
WatMetSed
Org Sed
Conv
Amb Tox Wat
Amb Tox Sed
Bact Flow FishTiss Field Comments
RIO GRANDE 449 METERS W EST AND 121 METERS SOUTH FROM THE INTERSECTION OF RANCH ROAD 170 AND RANCH ROAD 169 IN PRESIDIO COUNTY CAMS 758 | Map
13229
2306
6
IB
IB
RT
2
8
8
8
8
Metals - Total Mercury sampled FY12
RIO GRANDE IMMEDIATELY DOW NSTREAM FROM MOUTH OF LOZIER CANYON 44 KM SE OF DRYDEN | Map
13722
2306
7
IB
BB
RT
1
field data collected at least once a year by canoe
RIO GRANDE AT BOAT RAMP AT RIO GRANDE VILLAGE IN BIG BEND NATIONAL PARK | Map
16730
2306
6
IB
BB
RT
2
8
8
8
8
Metals - Total Mercury sampled FY12
RIO GRANDE RIVER AT COLORADO CANYON APPROX 30KM SE OF REDFORD ON RR170 IN PRESIDIO COUNTY | Map
16862
2306
6
IB
PW
RT
2
4
4
4
Metals - Total Mercury sampled FY12; sampling frequency reduced to quarterly
RIO GRANDE AT PRESIDIO RAILROAD BRIDGE 3.25KM DOW NSTREAM OF US67 SOUTH OF PRESIDIO | Map
17000
2306
6
IB
IB
RT
8
8
8
RIO GRANDE AT PRESIDIO/OJINAGA TOLL BRIDGE/INTERNATION AL 0.75KM DOW NSTREAM OF US67 IN PRESIDIO | Map
17001
2306
6
IB
IB
RT
8
8
8

USIBWC FY CRP1617QAPP_AMENDMENT 1
USIBWC QAPP Last Revised on February 11, 2016
Site Description
Station
ID
Water body
ID
Regio
n SE
CE MT
24 hr
DO
Aq Hab Ben Nek Met Wat Org
WatMetSed
Org Sed
Conv
Amb Tox Wat
Amb Tox Sed
Bact Flow FishTiss Field Comments
RIO GRANDE AT LAJITAS RESORT/FM 170 BOAT RAMP 240 M UPSTREAM OF BLACK HILLS CREEK CONFLUENCE NEAR LAJITAS | Map
18441
2306
6
IB
PW
RT
2
4
4
4
Metals - Total Mercury sampled FY12
RIO GRANDE AT BOQUILLAS CROSSING IN BIG BEND NATIONAL PARK | Map
20619
2306
6
IB
BB
RT
1
field data collected at least once a year by canoe
RIO GRANDE AT TAYLORS FARM SOUTHW EST OF SANDERSON | Map
20623
2306
6
IB
BB
RT
1
field data collected at least once a year by canoe
RIO GRANDE 50 METERS UPSTREAM OF SILBER CANYON SOUTH OF SANDERSON IN BREW STER COUNTY | Map
20625
2306
6
IB
BB
RT
1
field data collected at least once a year by canoe
RIO GRANDE DOW NSTREAM OF RODEO RAPIDS SOUTH OF SANDERSON IN BREW STER COUNTY | Map
20626
2306
6
IB
BB
RT
1
field data collected at least once a year by canoe
RIO GRANDE 1.3 KILOMETERS DOW NSTREAM OF BEAR CANYON AND APPROXIMATELY 9.3 KILOMETERS DOW NSTREAM OF COOK CREEK IN TERRELL COUNTY | Map
20628
2306
7
IB
BB
RT
1
field data collected at least once a year by canoe

USIBWC FY CRP1617QAPP_AMENDMENT 1
USIBWC QAPP Last Revised on February 11, 2016
Site Description
Station
ID
Water body
ID
Regio
n SE
CE MT
24 hr
DO
Aq Hab Ben Nek Met Wat Org
WatMetSed
Org Sed
Conv
Amb Tox Wat
Amb Tox Sed
Bact Flow FishTiss Field Comments
RIO GRANDE 570 METERS NORTH AND 605 METERS W EST FROM THE SOUTH END OF SHAFTER CROSSING ROAD AND 1.90 KILOMETERS DOW NSTREAM OF BRITTON CANYON IN TERRELL COUNTY | Map
20629
2306
7
IB
BB
RT
1
field data collected at least once a year by canoe
RIO GRANDE AT THE CONFLUENCE W ITH INDIAN CREEK IN TERRELL COUNTY | Map
20631
2306
7
IB
BB
RT
1 field data collected at least once a year by canoe
RIO GRANDE 7.5 KILOMETERS UPSTREAM FROM THE CONFLUENCE W ITH SAN FRANCISCO CREEK IN BREW STER COUNTY | Map
20632
2306
6
IB
BB
RT
1
field data collected at least once a year by canoe
Segment 2307 Rio Grande Below Riverside Diversion Dam Map
RIO GRANDE 3.38 KILOMETERS UPSTREAM FROM THE CONFLUENCE W ITH THE RIO CONCHOS 6.72 KILOMETERS WEST AND 2.445 KILOMETERS NORTH FROM THE INTERSECTION OF RANCH ROAD 170 AND RODRIQUEZ ROAD IN PRESIDIO COUNTY CAMS 757 | Map
13230
2307
6
IB
IB
RT
2
8
8
8
8
Metals - Total Mercury sampled FY12

USIBWC FY CRP1617QAPP_AMENDMENT 1
USIBWC QAPP Last Revised on February 11, 2016
Site Description
Station
ID
Water body
ID
Regio
n SE
CE MT
24 hr
DO
Aq Hab Ben Nek Met Wat Org
WatMetSed
Org Sed
Conv
Amb Tox Wat
Amb Tox Sed
Bact Flow FishTiss Field Comments
RIO GRANDE AT RIVERSIDE CANAL 1.8 KM DOWNSTREAM OF ZARAGOSA INTERNATIONAL BRIDGE | Map
14465
2307 16 IB IB RT
12 12 12 12
Monitored by IBWC American Dam FO. Partial conventional analysis. Additional data for metals, organics and other conventionals available thru IBWC.
RIO GRANDE AT GUADALUPE POINT OF ENTRY BRIDGE AT FM 1109 W EST OF TORNILLO | Map
15704
2307
6
IB
UE
RT
4
4
4
4 Metals in water removed FY16
RIO GRANDE AT ALAMO CONTROL STRUCTURE 9.7KM UPSTREAM OF FT HANCOCK PORT OF ENTRY | Map
15795
2307
6
IB
IB
RT
4
4
4
Segment 2308 Rio Grande Below International Dam | Map
RIO GRANDE 1.3 KM DOW NSTREAM FROM HASKELL ST WWTP OUTFALL | Map
15528
2308
6
IB
IB
RT
12
12
12
12
Monitored by IBW C American Dam FO. Partial conventional analysis. Additional data for metals, organics and other conventionals available thru IBW C.
RIO GRANDE 2.4 KM UPSTREAM FROM HASKELL ST WWTP OUTFALL SOUTH OF BOWIE HIGH SCHOOL FOOTBALL STADIUM IN EL PASO | Map
15529
2308
6
IB
IB
RT
12
12
12
12
Monitored by IBW C American Dam FO. Partial conventional analysis. Additional data for metals, organics and other conventionals available thru IBW C.
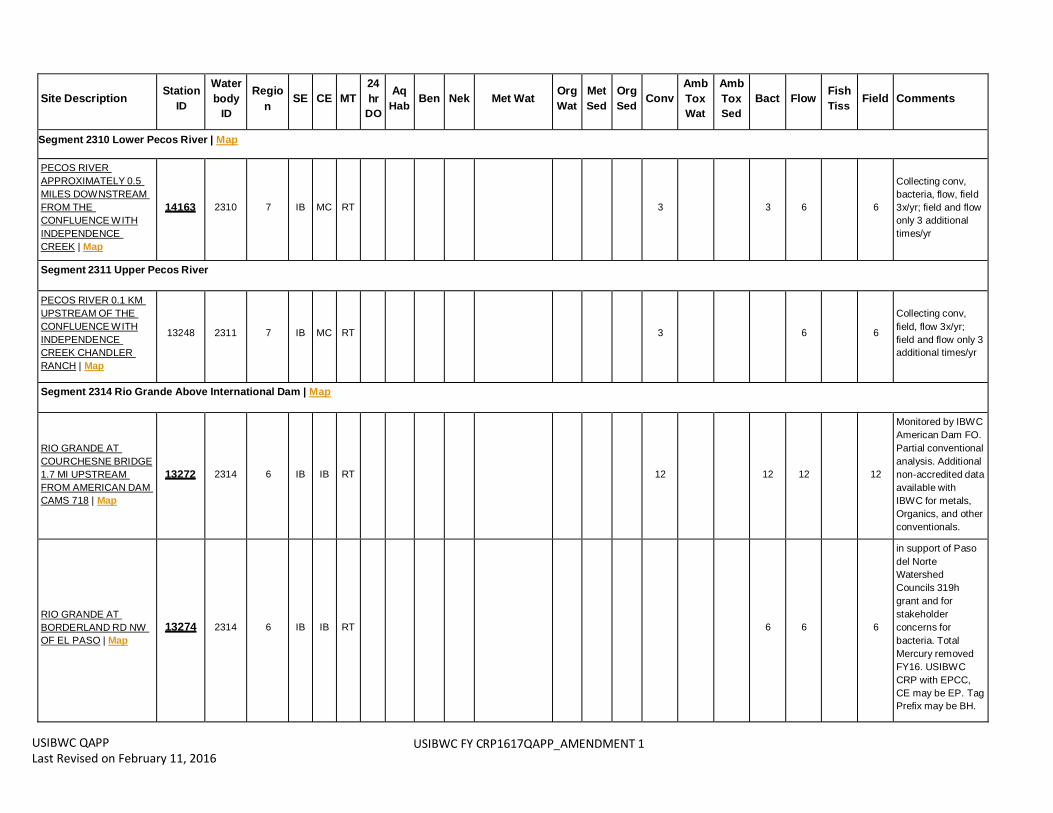
USIBWC FY CRP1617QAPP_AMENDMENT 1
USIBWC QAPP Last Revised on February 11, 2016
Site Description
Station
ID
Water body
ID
Regio
n SE
CE MT
24 hr
DO
Aq Hab Ben Nek Met Wat Org
WatMetSed
Org Sed
Conv
Amb Tox Wat
Amb Tox Sed
Bact Flow FishTiss Field Comments
Segment 2310 Lower Pecos River | Map
PECOS RIVER APPROXIMATELY 0.5 MILES DOW NSTREAM FROM THE CONFLUENCE W ITH INDEPENDENCE CREEK | Map
14163
2310
7
IB
MC
RT
3
3
6
6
Collecting conv, bacteria, flow, field 3x/yr; field and flow only 3 additional times/yr
Segment 2311 Upper Pecos River
PECOS RIVER 0.1 KM UPSTREAM OF THE CONFLUENCE W ITH INDEPENDENCE CREEK CHANDLER RANCH | Map
13248
2311
7
IB
MC
RT
3
6
6 Collecting conv, field, flow 3x/yr; field and flow only 3 additional times/yr
Segment 2314 Rio Grande Above International Dam | Map
RIO GRANDE AT COURCHESNE BRIDGE 1.7 MI UPSTREAM FROM AMERICAN DAM CAMS 718 | Map
13272
2314
6
IB
IB
RT
12
12
12
12
Monitored by IBW C American Dam FO. Partial conventional analysis. Additional non-accredited data available with IBW C for metals, Organics, and other conventionals.
RIO GRANDE AT BORDERLAND RD NW OF EL PASO | Map
13274
2314
6
IB
IB
RT
6
6
6
in support of Paso del Norte Watershed Councils 319h grant and for stakeholder concerns for bacteria. Total Mercury removed FY16. USIBW C CRP with EPCC, CE may be EP. Tag Prefix may be BH.

USIBWC FY CRP1617QAPP_AMENDMENT 1
USIBWC QAPP Last Revised on February 11, 2016
Site Description
Station
ID
Water body
ID
Regio
n SE
CE MT
24 hr
DO
Aq Hab Ben Nek Met Wat Org
WatMetSed
Org Sed
Conv
Amb Tox Wat
Amb Tox Sed
Bact Flow FishTiss Field Comments
RIO GRANDE 40M SOUTH OF VINTON BRIDGE APPROXIMATELY 4 KM S OF ANTHONY | Map
13275
2314
6
IB
IB
RT
6
6
6
in support of Paso del Norte Watershed Councils 319h grant and for stakeholder concerns for bacteria. Total Mercury removed FY16. USIBW C CRP with EPCC, CE may be EP. Tag Prefix may be BH.
RIO GRANDE IMMED UPSTREAM OF THE CONFL W ITH ANTHONY DRAIN WEST OF LA TUNA PRISON NEAR THE STATE LINE | Map
13276
2314
6
IB
EP
RT
3
3
6
6
USIBW C CRP with EPCC. 3x/yr report field only.
RIO GRANDE IMMED UPSTREAM OF THE CONFL W ITH ANTHONY DRAIN WEST OF LA TUNA PRISON NEAR THE STATE LINE | Map
13276
2314
6
IB
IB
RT
4
4
4
In support of Paso del Norte Watershed Councils 319h grant and for stakeholder recreation concerns. Total Mercury removed FY16. Monitored by USIBW C CRP with EPCC, when no students Tag Prefix BH.
RIO GRANDE RIVER AT AMERICAN EAGLE BRICK FACTORY BRIDGE ABANDONED RR 0.1 MI DOW NSTREAM FROM SOUTHERN PACIFIC RR AT SMELTERTOW N | Map
15089
2314
6
IB
IB
RT
3
3
3
Metals in water removed FY16. Monitored by USIBW C CRP, Tag Prefix BH.

USIBWC FY CRP1617QAPP_AMENDMENT 1
USIBWC QAPP Last Revised on February 11, 2016
Site Description
Station
ID
Water body
ID
Regio
n SE
CE MT
24 hr
DO
Aq Hab Ben Nek Met Wat Org
WatMetSed
Org Sed
Conv
Amb Tox Wat
Amb Tox Sed
Bact Flow FishTiss Field Comments
RIO GRANDE RIVER AT AMERICAN EAGLE BRICK FACTORY BRIDGE ABANDONED RR 0.1 MI DOW NSTREAM FROM SOUTHERN PACIFIC RR AT SMELTERTOW N | Map
15089
2314
6
IB
UE
RT
2
2
RIO GRANDE AT ANAPRA BRIDGE ON SUNLAND PARK DRIVE 4.2 KM UPSTREAM OF AMERICAN DAM IN NEW MEXICO | Map
17040
2314
6
IB
EP
RT
4
4
4
Total metals in water removed FY16

LOWER RIO GRANDE SUB-BASIN


USIBWC CRP Amendment #_2_ Page 1 Last revised on July 7, 2016 crp_qapp appendix b update_fy1617 amendment 2 draft6_sde.doc
Amendment # 2 Update to Appendix B Sampling
Process Design and Monitoring Schedule to the Rio Grande Basin Clean Rivers Program FY
2016/2017 QAPP
Prepared by the Basin Planning Agency
in Cooperation with the Texas Commission on Environmental Quality
(TCEQ)
Effective: Immediately upon approval by all parties
Questions concerning this QAPP should be directed to: Leslie Grijalva USIBWC CRP Program Manager 4171 N. Mesa St., Ste. C‐100 El Paso, TX 79902 (915) 832‐[email protected]

USIBWC CRP Amendment #_2_ Page 2 Last revised on July 7, 2016 crp_qapp appendix b update_fy1617 amendment 2 draft6_sde.doc
Justification
This document details the changes made to the basin-wide Quality Assurance Project Plan to update Appendix B for fiscal year 2017.
Summary of Changes
The following information in Appendix B is amended to reflect changes to:
Sample design rationale FY 2017
Monitoring Sites table with updated legends
Maps of sampling sites
Detail of Changes
Section/Figure/Table Page Change Justification
A1 Approval Page 2
“Allison Fischer” was changed to “Kelly Rodibaugh” as the TCEQ CRP Project Quality Assurance Specialist.
The Approval Page was changed to reflect personnel changes at TCEQ
A4 Project/Task Organization
16
“Allison Fischer” was changed to “Kelly Rodibaugh” as the TCEQ CRP Project Quality Assurance Specialist.
The Project/Task Organization Page was changed to reflect personnel changes at TCEQ
Figure A4.1 22
“Allison Fischer” was changed to “Kelly Rodibaugh” as the TCEQ CRP Project Quality Assurance Specialist.
Organization Chart Page was changed to reflect personnel changes at TCEQ
A3 Distribution List 13
“Director” was changed to “John Porter” for the Laredo Environmental Services Health Department.
Distribution List Page was changed to reflect personnel changes at the Laredo Environmental Services Health Department.
A4 Project/Task Organization
19
“Director” was changed to “John Porter” for the Laredo Environmental Services Health Department.
The Project/Task Organization Page was changed to reflect personnel changes at the Laredo Environmental Services Health Department.

USIBWC CRP Amendment #_2_ Page 3 Last revised on July 7, 2016 crp_qapp appendix b update_fy1617 amendment 2 draft6_sde.doc
Figure A4.1 22
“Director” was changed to “John Porter” for the Laredo Environmental Services Health Department.
Organization Chart Page was changed to reflect personnel changes at the Laredo Environmental Services Health Department.
Table A7.3 and A7.5 67, 70
Footnote added that Magnesium and Total Hardness are part of the testing of conventionals.
Footnotes added to each table identifying that Calcium, Sodium, Magnesium, Fluoride, Total Hardness and Potassium are part of the contract laboratory testing of conventionals.
Upper Rio Grande Sub-basin El Paso to Forgotten Stretch map
104 Adding station 17407 Map was changed to reflect addition of Station. Effective FY17.
Monitoring Schedule 98
Adding station 17407 under Presidio FO. Added quarterly for field, bacteria, flow, and conventionals
Monitoring schedule changed to reflect addition of Station. Effective FY17.
Monitoring Schedule 92
Removed sediment sampling from USIBWC’s schedule at Station 20999.
Monitoring schedule was changed to reflect removal of sediment sampling. Effective FY17.
Monitoring Schedule 92
Added quarterly sediment sampling to Station 20997, to complement TCEQ’s sediment sampling at Station 18792.
Monitoring schedule was changed to reflect addition of quarterly sediment sampling. Effective FY17.
Monitoring Schedule 99-101
Changing collecting entity codes for UTEP and EPCC sites to IB. Addition of remarks in comment section are “. USIBWC Hdqrts with EPCC, CE may be EP” and “USIBWC Hdqrts with UTEP, CE may be UE”
Monitoring schedule was changed to reflect change of entity codes and the addition of remarks. Effective FY17.
Sample Design Rationale FY 2017

USIBWC CRP Amendment #_2_ Page 4 Last revised on July 7, 2016 crp_qapp appendix b update_fy1617 amendment 2 draft6_sde.doc
Monitoring Sites Table
The attached monitoring Table in Appendix B is added to reflect monitoring for FY 2017.
Maps
The attached maps are added to Appendix C to reflect monitoring sites for FY 2017.


USIBWC CRP Amendment #_2_ Page 7 Last revised on July 7, 2016 crp_qapp appendix b update_fy1617 amendment 2 draft6_sde.doc
A3 Distribution List
City of Laredo Environmental Services Department 619 Reynolds St. Laredo, TX 78040 John Porter, Director Lucky Roncinske, Environmental Technician II (956) 794-1650 956-794-1650
A4 PROJECT/TASK ORGANIZATION Kelly Rodibaugh CRP Project Quality Assurance Specialist Serves as liaison between CRP management and TCEQ QA management. Participates in the development, approval, implementation, and maintenance of written QA standards (e.g., Program Guidance, SOPs, QAPPs, QMP). Serves on planning team for CRP special projects and reviews QAPPs in coordination with other CRP staff. Coordinates documentation and implementation of corrective action for the CRP. John Porter City of Laredo Environmental Services Department Responsible for supervising water quality monitoring staff at the City of Laredo Environmental Services Department.

USIBWC CRP Amendment #_2_ Page 8 Last revised on July 7, 2016 crp_qapp appendix b update_fy1617 amendment 2 draft6_sde.doc
PROJECT ORGANIZATION CHART
Figure 1: A4.1. Organization Chart - Lines of Communication
Sarah Eagle TCEQ CRP
Work Leader
Leslie Grijalva,
USIBWC CRP Program Manager
Sarah Eagle TCEQ CRP
Project Manager
Elizabeth Walsh
UTEP Bio.
Sciences Dept.
Jeff Bennett Big Bend
National Park
John Porter, Lucky Roncinske
City of Laredo
Env. Serv. Dept.
Elizabeth Heise UTB
Environmental
Science Dept.
Yuhui Zhang, A&B
Laboratory Manager
Rita Wells, A&B QAO
Tom
Vaughan
RGISC/
TAMIU
Daniel R. Burke
TCEQ Lead QA Specialist
------------------
Kelly Rodibaugh TCEQ Project
QA Specialist
Luis Hernandez
Division Chief,
USIBWC Operations
and Maintenance Div.
USIBWC Field Office Area
Managers and Hydrotechs Lee Roy Atkinson,
Michael McCall
Brownsville PUB
Rebecca Castro
City of Laredo
Laboratory
Paul R. Rivas
Lab Services
Manager
El Paso Water Utilities
Maria Alvarez
El Paso
Community
College
Mark
Lockwood,
David Long,
TX Parks &
Wildlife Dept.
Samuel Gonzalez, Danny Maldonado,
Lupe Luna, City of
Laredo Health Dept.
Peter Bohls
TCEQ CRP Data Manager
Lines of Management Lines of Communication
Cathy Anderson TCEQ DM&A
Team Leader
Gilbert Anaya, Division
Chief, USIBWC
Environmental
Management Division
Andres Garcia
USIBWC CRP
QAO
City of Laredo Health Dept. uses the City of Laredo Health Dept. lab, BPUB analyzes their own data and the enterococcus samples for the Brownville area, and American Dam uses the El Paso Water Utilities lab. All other
partners use A&B.
Jungseok Ho UTRGV/
Edinburg
Campus

USIBWC CRP Amendment #_2_ Page 9 Last revised on July 7, 2016 crp_qapp appendix b update_fy1617 amendment 2 draft6_sde.doc
TABLE A7.3 Measurement Performance Specifications for A&B Environmental Services Inc.
Conventional Parameters in Water
Parameter
Un
its
Mat
rix
Me
tho
d
Par
ame
ter
Co
de
TCEQ
AW
RL
LOQ
LOQ
Ve
rifi
cati
on
Sam
ple
%R
ec
(Me
tho
d
de
fin
ed
)
Pre
cisi
on
(R
PD
of
LCS/
LCSD
)
Bia
s %
Re
c. o
f
LCS
Lab
BIOCHEMICAL OXYGEN DEMAND (MG/L, 5 DAY - 20DEG C
mg/L water EPA 405.1, 00310 2 2 NA NA NA A&B
CHEMICAL OXYGEN DEMAND, .025N K2CR2O7 (MG/L)
mg/L water EPA 410.4, SM 5220D
00335 10 10 70-130 20 80-120
A&B
ALKALINITY, TOTAL (MG/L AS CACO3)
mg/L water EPA 310.1, SM 2320B
00410 20 20 NA 20 NA A&B
RESIDUE, TOTAL NONFILTRABLE (MG/L)
mg/L water SM 2540B, SM 2540D
00530 5 2.5 NA NA NA A&B
RESIDUE, VOLATILE NONFILTRABLE (MG/L)
mg/L water EPA 160.4 00535 5 2.5 NA NA NA A&B
NITROGEN, AMMONIA, TOTAL (MG/L AS N)
mg/L water EPA 350.3, SM 4500-
NH3 D 00610 0.1 0.1 70-130 20
80-120
A&B
NITRITE PLUS NITRATE, TOTAL ONE LAB DETERMINED VALUE (MG/L AS N)
mg/L water
EPA 300.0, EPA 353.2, EPA 353.3, EPA 9056, SM 4500-
NO3 E
00630 0.05 0.05 70-130 20 80-120
A&B
PHOSPHORUS, TOTAL, WET METHOD (MG/L AS P)
mg/L water
EPA 200.7, EPA 365.2, SM 4500-P
E
00665 0.06 0.05 70-130 20 80-120
A&B
CARBON, TOTAL ORGANIC, NPOC (TOC), MG/L
mg/L water EPA 415.1, EPA 9060, SM 5310 B
00680 2 1 70-130 10 80-120
A&B
HARDNESS, TOTAL (MG/L AS CACO3)*
mg/L water EPA 130.2, SM 2340 B or C
00900 5 1 70-130 20 80-120
A&B
CHLORIDE (MG/L AS CL) mg/L water
EPA 300.0 Rev. 2.1
(1993), EPA 9056
00940 5 0.1 70-130 20 80-120
A&B
SULFATE (MG/L AS SO4) mg/L water
EPA 300.0 Rev. 2.1
(1993), EPA 9056
00945 5 0.1 70-130 20 80-120
A&B
BROMIDE, TOTAL (MG/L as BR)
mg/L water EPA 300.0, EPA 9056
71870 NA 0.1 70-130 20 80-120
A&B
CHLOROPHYLL-A UG/L SPECTROPHOTOMETRIC ACID. METH
ug/L water SM 10200
H 32211 3 3 60-140 20
80-120
A&B

USIBWC CRP Amendment #_2_ Page 10 Last revised on July 7, 2016 crp_qapp appendix b update_fy1617 amendment 2 draft6_sde.doc
TABLE A7.3 Measurement Performance Specifications for A&B Environmental Services Inc.
Conventional Parameters in Water
Parameter
Un
its
Mat
rix
Me
tho
d
Par
ame
ter
Co
de
TCEQ
AW
RL
LOQ
LOQ
Ve
rifi
cati
on
Sam
ple
%R
ec
(Me
tho
d
de
fin
ed
)
Pre
cisi
on
(R
PD
of
LCS/
LCSD
)
Bia
s %
Re
c. o
f
LCS
Lab
PHEOPHYTIN-A UG/L SPECTROPHOTOMETRIC ACID. METH.
μg/L water SM 10200
H 32218 3 3 60-140 NA NA A&B
RESIDUE,TOTAL FILTRABLE (DRIED AT 180C) (MG/L)
mg/L water SM 2540C 70300 10 10 NA 20 80-120
A&B
TURBIDITY,LAB NEPHELOMETRIC TURBIDITY UNITS, NTU
NTU water EPA 180.1, SM 2130B
82079 0.5 0.1 70-130 NA NA A&B
Rio Grande USIBWC El Paso HQ partners that use this field table include USIBWC field offices, BBNP, TPWD, Midland College, RGISC, USIBWC El Paso HQ, EPCC/USIBWC El Paso HQ, UTEP, UTB, City of Laredo Env. Services Dept. Calcium, Sodium, Magnesium, Fluoride, Total Hardness and Potassium are listed in the Metals in Water but are part of the contract laboratory conventionals analysis for the USIBWC Clean Rivers monitoring program. *Hardness is not used for regulatory purposes but is used to assess metals in water at inland sites (estuarine sites do not require hardness analysis). References:United States Environmental Protection Agency (USEPA) Methods for Chemical Analysis of Water and Wastes, Manual #EPA-600/4-79-020American Public Health Association (APHA), American Water Works Association (AWWA), and Water Environment Federation (WEF), Standard Methods for the Examination of Water and Wastewater, 20th Edition, 1998. (Note: The 21st edition may be cited if it becomes available.)TCEQ SOP, V1 - TCEQ Surface Water Quality Monitoring Procedures, Volume 1: Physical and Chemical Monitoring Methods, 2012 (RG-415).TCEQ SOP, V2 - TCEQ Surface Water Quality Monitoring Procedures, Volume 2: Methods for Collecting and Analyzing Biological Assemblage and Habitat Data, 2014 (RG-416)

USIBWC CRP Amendment #_2_ Page 11 Last revised on July 7, 2016 crp_qapp appendix b update_fy1617 amendment 2 draft6_sde.doc
TABLE A7.5 Measurement Performance Specifications for Partners that use A&B Environmental Services Inc.
Metals in Water
Parameter
Un
its
Mat
rix
Me
tho
d
Par
ame
ter
Co
de
TCEQ
AW
RL
LOQ
LOQ
Ve
rifi
cati
on
Sam
ple
%R
ec
(Me
tho
d
de
fin
ed
) P
reci
sio
n (
RP
D
of
LCS/
LCSD
)
Bia
s %
Re
c. o
f
LCS
Lab
HARDNESS, TOTAL (MG/L AS CACO3)*€
mg/L water EPA 130.2, SM 2340 B or C
00900 5 0.066 70-130 20 80-120
A&B
CALCIUM, TOTAL (MG/L AS CA)€
mg/L water EPA 200.7, EPA 6010
00916 0.5 0.02 70-130 20 80-120
A&B
MAGNESIUM, TOTAL (MG/L AS MG)€
mg/L water EPA 200.7, EPA 6010
00927 0.5 0.02 70-130 20 80-120
A&B
SODIUM, TOTAL (MG/L AS NA)€
mg/L water EPA 200.7, EPA 6010
00929 NA 0.1 70-130 20 80-120
A&B
POTASSIUM, TOTAL (MG/L AS K)€
mg/L water EPA 200.7, EPA 6010
00937 NA 1 70-130 20 80-120
A&B
FLUORIDE, TOTAL (MG/L AS F)€
mg/L water
EPA 300.0, EPA 340.2, EPA 9056, SM 4500-FC
00951 0.5 0.1 70-130 20 80-120
A&B
BARIUM, TOTAL (UG/L AS BA)
μg/L water
EPA 200.7, EPA 200.8, EPA 6010, EPA 6020
01007 NA 10/1** 70-130 20 80-120
A&B
BERYLLIUM, TOTAL (UG/L AS BE)
μg/L water
EPA 200.7, EPA 200.8, EPA 6010, EPA 6020
01012 NA 10/1** 70-130 20 80-120
A&B
CHROMIUM, TOTAL (UG/L AS CR)
μg/L water
EPA 200.7, EPA 200.8, EPA 6010, EPA 6020
01034 NA 10/1** 70-130 20 80-120
A&B
COBALT, TOTAL (UG/L AS CO)
μg/L water
EPA 200.7, EPA 200.8, EPA 6010, EPA 6020
01037 NA 10/1** 70-130 20 80-120
A&B

USIBWC CRP Amendment #_2_ Page 12 Last revised on July 7, 2016 crp_qapp appendix b update_fy1617 amendment 2 draft6_sde.doc
TABLE A7.5 Measurement Performance Specifications for Partners that use A&B Environmental Services Inc.
Metals in Water
Parameter U
nit
s
Mat
rix
Me
tho
d
Par
ame
ter
Co
de
TCEQ
AW
RL
LOQ
LOQ
Ve
rifi
cati
on
Sam
ple
%R
ec
(Me
tho
d
de
fin
ed
) P
reci
sio
n (
RP
D
of
LCS/
LCSD
)
Bia
s %
Re
c. o
f
LCS
Lab
COPPER, TOTAL (UG/L AS CU)
μg/L water
EPA 200.7, EPA 200.8, EPA 6010, EPA 6020
01042 NA 10/1** 70-130 20 80-120
A&B
IRON, TOTAL (UG/L AS FE)
μg/L water
EPA 200.7, EPA 200.8, EPA 6010, EPA 6020
01045 300 10/1** 70-130 20 80-120
A&B
MANGANESE, TOTAL (UG/L AS MN)
μg/L water
EPA 200.7, EPA 200.8, EPA 6010, EPA 6020
01055 50 10/1** 70-130 20 80-120
A&B
THALLIUM, TOTAL (UG/L AT TL)
μg/L water EPA 200.8 01059 NA 1 70-130 20 80-120
A&B
MOLYBDENUM, TOTAL (UG/L AS MO)
μg/L water
EPA 200.7, EPA 200.8, EPA 6010, EPA 6020
01062 NA 10/1** 70-130 20 80-120
A&B
NICKEL, TOTAL (UG/L AS NI)
μg/L water
EPA 200.7, EPA 200.8, EPA 6010, EPA 6020
01067 NA 10/1** 70-130 20 80-120
A&B
SILVER, TOTAL (UG/L AS AG)
μg/L water EPA 200.7, EPA 200.8, EPA 6010
01077 NA 10/1** 70-130 20 80-120
A&B
ZINC, TOTAL (UG/L AS ZN)
μg/L water
EPA 200.7, EPA 200.8, EPA 6010, EPA 6020
01092 NA 10/1** 70-130 20 80-120
A&B
ANTIMONY, TOTAL (UG/L AS SB)
μg/L water
EPA 200.7, EPA 200.8, EPA 6010, EPA 6020
01097 NA 10/1** 70-130 20 80-120
A&B
TIN, TOTAL, UG/L AS SN
μg/L water EPA 200.7 01102 NA 0.1 70-130 20 80-120
A&B
ALUMINUM, TOTAL (UG/L AS AL)
ug/L water
EPA 200.7, EPA 200.8, EPA 6010, EPA 6020
01105 NA 10/1** 70-130 20 80-120
A&B
ARSENIC, TOTAL (UG/L AS AS)
ug/L water
EPA 200.7, EPA 200.8, EPA 6010, EPA 6020
01002 NA 10/1** 70-130 20 80-120
A&B

USIBWC CRP Amendment #_2_ Page 13 Last revised on July 7, 2016 crp_qapp appendix b update_fy1617 amendment 2 draft6_sde.doc
TABLE A7.5 Measurement Performance Specifications for Partners that use A&B Environmental Services Inc.
Metals in Water
Parameter U
nit
s
Mat
rix
Me
tho
d
Par
ame
ter
Co
de
TCEQ
AW
RL
LOQ
LOQ
Ve
rifi
cati
on
Sam
ple
%R
ec
(Me
tho
d
de
fin
ed
) P
reci
sio
n (
RP
D
of
LCS/
LCSD
)
Bia
s %
Re
c. o
f
LCS
Lab
CADMIUM, TOTAL (UG/L AS Cd)
ug/L water
EPA 200.7, EPA 200.8, EPA 6010, EPA 6020
01027 NA 10/1** 70-130 20 80-120
A&B
LEAD, TOTAL (UG/L AS Pb)
ug/L water
EPA 200.7, EPA 200.8, EPA 6010, EPA 6020
01051 NA 10/1** 70-130 20 80-120
A&B
MERCURY TOTAL, WATER, METHOD 1631 ug/L
ug/L water EPA 1631E 71960 0.0006 0.0005 70-130 20 80-120
Sub to Summit
SELENIUM, TOTAL (UG/L AS SE)
ug/L water
EPA 200.7, EPA 200.8 Rev 5.4 (1998), EPA 6010, EPA 6020
01147 2 10/1** 70-130 20 80-120
A&B
Rio Grande USIBWC El Paso HQ partners that use this field table include USIBWC field offices, BBNP, TPWD, Midland College, RGISC, USIBWC El Paso HQ, EPCC/USIBWC El Paso HQ, UTEP, UTB, City of Laredo Env. Services Dept. Mercury analysis is subcontracteed by A&B to Summit Laboratories, whose adherence letter is on file. *Hardness is not used for regulatory purposes but is used to assess metals in water at inland sites (estuarine sites do not require hardness analysis). **The calibration curve and LOQ are different depending on the technology used. The ICP-OES method (200.7 or 6010) has an LOQ of 10 ppb. The ICP-MS method (200.8 or 6020) has an LOQ of 1 ppb. It is expressed in the table as 10/1 for 200.7/200.8. € Total Hardness, Calcium, Magnesium, Sodium, Potassium, and Fluoride are part of the contract laboratory conventionals analysis for the USIBWC Clean Rivers monitoring program. References: United States Environmental Protection Agency (USEPA) Methods for Chemical Analysis of Water and Wastes, Manual #EPA-600/4-79-020 American Public Health Association (APHA), American Water Works Association (AWWA), and Water Environment Federation (WEF), Standard Methods for the Examination of Water and Wastewater, 20th Edition, 1998. (Note: The 21st edition may be cited if it becomes available.) TCEQ SOP, V1 - TCEQ Surface Water Quality Monitoring Procedures, Volume 1: Physical and Chemical Monitoring Methods, 2012 (RG-415). TCEQ SOP, V2 - TCEQ Surface Water Quality Monitoring Procedures, Volume 2: Methods for Collecting and Analyzing Biological Assemblage and Habitat Data, 2014 (RG-416)
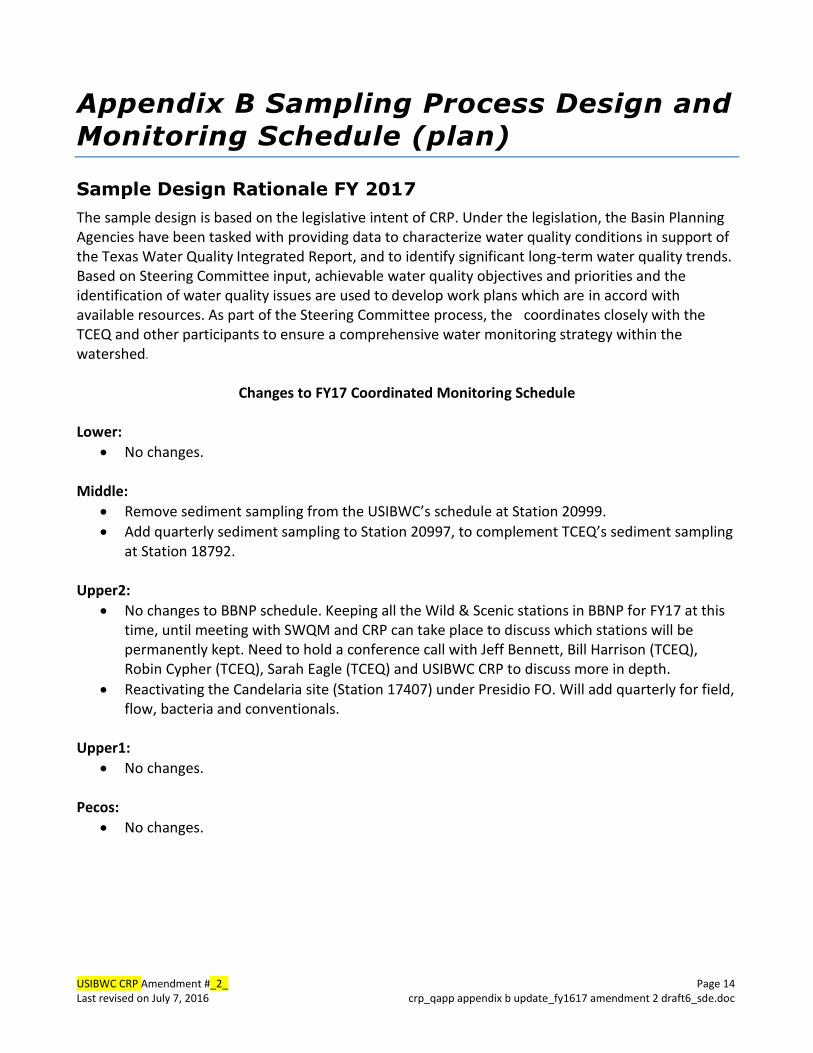
USIBWC CRP Amendment #_2_ Page 14 Last revised on July 7, 2016 crp_qapp appendix b update_fy1617 amendment 2 draft6_sde.doc
Appendix B Sampling Process Design and
Monitoring Schedule (plan)
Sample Design Rationale FY 2017
The sample design is based on the legislative intent of CRP. Under the legislation, the Basin Planning Agencies have been tasked with providing data to characterize water quality conditions in support of the Texas Water Quality Integrated Report, and to identify significant long-term water quality trends. Based on Steering Committee input, achievable water quality objectives and priorities and the identification of water quality issues are used to develop work plans which are in accord with available resources. As part of the Steering Committee process, the coordinates closely with the TCEQ and other participants to ensure a comprehensive water monitoring strategy within the watershed.
Changes to FY17 Coordinated Monitoring Schedule Lower:
No changes. Middle:
Remove sediment sampling from the USIBWC’s schedule at Station 20999.
Add quarterly sediment sampling to Station 20997, to complement TCEQ’s sediment sampling at Station 18792.
Upper2:
No changes to BBNP schedule. Keeping all the Wild & Scenic stations in BBNP for FY17 at this time, until meeting with SWQM and CRP can take place to discuss which stations will be permanently kept. Need to hold a conference call with Jeff Bennett, Bill Harrison (TCEQ), Robin Cypher (TCEQ), Sarah Eagle (TCEQ) and USIBWC CRP to discuss more in depth.
Reactivating the Candelaria site (Station 17407) under Presidio FO. Will add quarterly for field, flow, bacteria and conventionals.
Upper1:
No changes.
Pecos:
No changes.

USIBWC El Paso Headquarter Amendment #_2_ Page 15 Last revised on June 15, 2016 crp_qapp appendix b update_fy1617 amendment 2 draft6_sde.doc
Monitoring Sites for FY 2017
The sample design for SWQM is shown in Table B1.1 below.
Table B1.1 Sample Design and Schedule, FY 2017
Site Description
Station ID
Water body
ID
Regio n
SE
CE
MT
24 hr
DO
Aq Hab
Ben
Nek
Met Wat
Org Wat
Met Sed
Org Sed
Conv
Amb Tox Wat
Amb Tox Sed
Bact
Flow
Fish Tiss
Field
Comments
Segment 2301 Rio Grande Tidal | Map
RIO GRANDE RIVER TIDAL AT THE END OF QUICKSILVER AVE 375 METERS SOUTH FROM THE INTERSECTION OF BOCA CHI CA BLVD AND QUICKSILVER AVE | Map
13176
2301
15
IB
UB
RT
4
4
4
RIO GRANDE RIVER AT SABAL PALM SANCTUARY 370 METERS SOUTH AND 310 METERS EAST FROM THE INTERSECTION OF DAKOTA AVE AND SABAL PALM GROVE ROAD | Map
16288
2301
15
IB
UB
RT
4
4
4
Entero analyzed by BPUB. Conventionals by IBW C lab.
Segment 2302 Rio Grande Below Falcon Reservoir | Map
RIO GRANDE AT EL JARDIN PUMP STATION LOCATED 350 METERS W EST OF INTERSECTION OF MONSEES ROAD AND CALLE MILPA VERDE | Map
13177
2302
15
IB
IB
RT
8
8
8
8

USIBWC El Paso Headquarter Amendment #_2_ Page 16 Last revised on June 15, 2016 crp_qapp appendix b update_fy1617 amendment 2 draft6_sde.doc
Site Description
Station ID
Water body ID
Regio
n
SE
CE
MT
24 hr
DO
Aq Hab
Ben
Nek
Met Wat
Org Wat
Met Sed
Org Sed
Conv
Amb Tox Wat
Amb Tox Sed
Bact
Flow
Fish Tiss
Field
Comments
RIO GRANDE INTERNATIONAL BRIDGE ON US 77 AT BROW NSVILLE | Map
13178
2302
15
IB
UB
RT
4
4
4

USIBWC El Paso Headquarter Amendment #_2_ Page 17 Last revised on June 15, 2016 crp_qapp appendix b update_fy1617 amendment 2 draft6_sde.doc
Site Description
Station ID
Water body
ID
Regio n
SE
CE
MT
24 hr
DO
Aq Hab
Ben
Nek
Met Wat
Org Wat
Met Sed
Org Sed
Conv
Amb Tox Wat
Amb Tox Sed
Bact
Flow
Fish Tiss
Field
Comments
RIO GRANDE RIVER AT RIVER BEND GOLF COURSE BOAT RAMP WEST OF BROW NSVILLE | Map
13179
2302
15
IB
UB
RT
4
4
4
RIO GRANDE RIVER AT HW Y 281/INTERNATIONAL BLVD IN HIDALGO | Map
13181
2302
15
IB
IB
RT
8
8
8
8
RIO GRANDE AT FM 886 NEAR LOS EBANOS | Map
13184
2302
15
IB
IB
RT
7
7
7
7
RIO GRANDE AT FORT RINGGOLD 1 MI DOW NSTREAM OF RIO GRANDE CITY | Map
13185
2302
15
IB
IB
RT
12
12
12
12
RIO GRANDE DOW NSTREAM RIO ALAMO NEAR FRONTON | Map
13186
2302
15
IB
IB
RT
8
8
8
8
RIO GRANDE 0.5 MI DOW NSTREAM ANZALDUAS DAM 12.2 MI FROM HIDALGO | Map
13664
2302
15
IB
IB
RT
8
8
8
8
RIO GRANDE 300M UPSTREAM OF PHARR INTERNATIONAL BRIDGE/US 281 | Map
15808
2302
15
IB
IB
RT
8
8
8
8

USIBWC El Paso Headquarter Amendment #_2_ Page 18 Last revised on June 15, 2016 crp_qapp appendix b update_fy1617 amendment 2 draft6_sde.doc
Site Description
Station ID
Water body
ID
Regio n
SE
CE
MT
24 hr
DO
Aq Hab
Ben
Nek
Met Wat
Org Wat
Met Sed
Org Sed
Conv
Amb Tox Wat
Amb Tox Sed
Bact
Flow
Fish Tiss
Field
Comments
RIO GRANDE RIVER AT BROW NSVILLE PUB W ATER TREATMENT PLANT NUMBER 1 INTAKE BETW EEN W TP RESERVOIR AND RIO GRANDE LEVEE 910 METERS W EST AND 335 METERS SOUTH TO THE INTERSECTION OF W EST ELIZABETH STREET AND SOUTH MILITARY ROAD | Map
20449
2302
15
IB
BO
RT
12
12
E. coli and limited conventionals
RIO GRANDE APPROX 380 METERS DOW NSTREAM OF CONFLUENCE W ITH LOS OLMOS CREEK | Map
21749
2302
15
IB
PT
RT
4
4
4
4
New site, added FY16
LOS OLMOS CREEK AT US 83/EAST 2ND STREET SOUTH OF RIO GRANDE CITY | Map
13103
2302A
15
IB
IB
RT
3
3
3
3
LOS OLMOS CREEK AT US 83/EAST 2ND STREET SOUTH OF RIO GRANDE CITY | Map
13103
2302A
15
IB
PT
RT
3
3
3
3
Added FY16.
ARROYO LOS OLMOS AT SH 755 NW OF RIO GRANDE CITY | Map
13104
2302A
15
IB
PT
RT
4
4
4
4
Added FY16.
ARROYO LOS OLMOS 400M UPSTREAM OF CONFLUENCE W ITH RIO GRANDE NEAR RIO GRANDE CITY
21591
2302A
15
IB
PT
RT
4
4
4
4
Added FY16.

USIBWC El Paso Headquarter Amendment #_2_ Page 19 Last revised on June 15, 2016 crp_qapp appendix b update_fy1617 amendment 2 draft6_sde.doc
Site Description
Station ID
Water body
ID
Regio n
SE
CE
MT
24 hr
DO
Aq Hab
Ben
Nek
Met Wat
Org Wat
Met Sed
Org Sed
Conv
Amb Tox Wat
Amb Tox Sed
Bact
Flow
Fish Tiss
Field
Comments
Segment 2303 International Falcon Reservoir Map
FALCON LAKE AT INTERNATIONAL BOUNDARY MONUME NT I | Map
13189
2303
16
IB
IB
RT
4
4
4
RIO GRANDE AT WEBB/ZAPATA COUNTY LINE | Map
15817
2303
16
IB
RN
RT
12
12
12
12
FALCON RESERVOIR AT SAN YGNACIO W TP INTAKE W EST OF US 83 INTERSECTION W ITH FM 3169 | Map
15818
2303
16
IB
RN
RT
2
2
2
Segment 2304 Rio Grande Below Amistad Reservoir Map
RIO GRANDE 50 YD UPSTREAM OF CONFLUENCE OF ZACATA CREEK AND RIO GRANDE | Map
13200
2304
16
IB
LA
RT
12
12
RIO GRANDE LARE DO W ATER TREATMENT PLANT PUMP INTAKE | Map
13202
2304
16
IB
LA
RT
12
12
E. coli and FC, and field
RIO GRANDE LARE DO W ATER TREATMENT PLANT PUMP INTAKE | Map
13202
2304
16
IB
RN
RT
4
4
4
4

USIBWC El Paso Headquarter Amendment #_2_ Page 20 Last revised on June 15, 2016 crp_qapp appendix b update_fy1617 amendment 2 draft6_sde.doc
Site Description
Station ID
Water body
ID
Regio n
SE
CE
MT
24 hr
DO
Aq Hab
Ben
Nek
Met Wat
Org Wat
Met Sed
Org Sed
Conv
Amb Tox Wat
Amb Tox Sed
Bact
Flow
Fish Tiss
Field
Comments
RIO GRANDE 12.8 MI DOW NSTREAM AMISTAD DAM NEAR GAGE 340 M UPSTREAM OF US 277 BRIDGE IN DEL RIO | Map
13208
2304
16
IB
IB
RT
2
2
2
2
RIO GRANDE 4.5 MI DOW NSTREAM OF DEL RIO AT MOODY RA NCH | Map
13560
2304
16
IB
IB
RT
4
4
4
4
frequency reduced FY12 to add another station in Eagle Pass (20997)
RIO GRANDE AT JUAREZ-LINCOLN INTERNATIONAL BRIDGE / BRIDGE #2 IN LAREDO | Map
15814
2304
16
IB
LA
RT
12
12
12
E. coli and FC; flow from IBW C gage; field data
RIO GRANDE AT JUAREZ-LINCOLN INTERNATIONAL BRIDGE / BRIDGE #2 IN LAREDO | Map
15814
2304
16
IB
RN
RT
4
4
4
4
RIO GRANDE AT MASTERSON RD IN LAREDO 9.9KM DW NSTR INTL BRIDGE #1/W EST BRIDGE DW NSTR SOUTHSIDE WWTP AND UPSTREAM NUEVO LAREDO WW TP | Map
15815
2304
16
IB
LA
RT
12
12
E.coli and fecal coliform, and field data
RIO GRANDE AT RIO BRAVO 0.5KM DW NSTR OF THE COMMUNITY OF EL CENIZO | Map
15816
2304
16
IB
RN
RT
4
4
4
Reactivated for FY 15
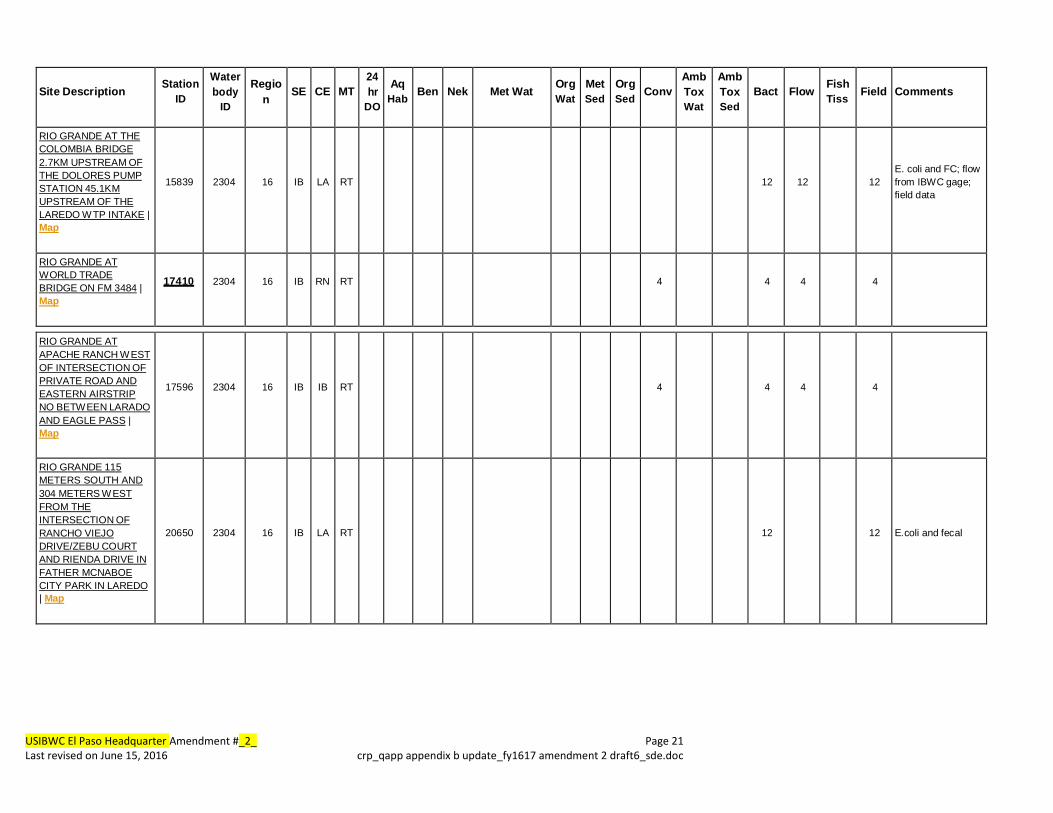
USIBWC El Paso Headquarter Amendment #_2_ Page 21 Last revised on June 15, 2016 crp_qapp appendix b update_fy1617 amendment 2 draft6_sde.doc
Site Description
Station ID
Water body
ID
Regio n
SE
CE
MT
24 hr
DO
Aq Hab
Ben
Nek
Met Wat
Org Wat
Met Sed
Org Sed
Conv
Amb Tox Wat
Amb Tox Sed
Bact
Flow
Fish Tiss
Field
Comments
RIO GRANDE AT THE COLOMBIA BRIDGE 2.7KM UPSTREAM OF THE DOLORES PUMP STATION 45.1KM UPSTREAM OF THE LAREDO W TP INTAKE | Map
15839
2304
16
IB
LA
RT
12
12
12
E. coli and FC; flow from IBW C gage; field data
RIO GRANDE AT WORLD TRADE BRIDGE ON FM 3484 | Map
17410
2304
16
IB
RN
RT
4
4
4
4
RIO GRANDE AT APACHE RANCH W EST OF INTERSECTION OF PRIVATE ROAD AND EASTERN AIRSTRIP NO BETW EEN LARADO AND EAGLE PASS | Map
17596
2304
16
IB
IB
RT
4
4
4
4
RIO GRANDE 115 METERS SOUTH AND 304 METERS W EST FROM THE INTERSECTION OF RANCHO VIEJO DRIVE/ZEBU COURT AND RIENDA DRIVE IN FATHER MCNABOE CITY PARK IN LAREDO | Map
20650
2304
16
IB
LA
RT
12
12
E.coli and fecal

USIBWC El Paso Headquarter Amendment #_2_ Page 22 Last revised on June 15, 2016 crp_qapp appendix b update_fy1617 amendment 2 draft6_sde.doc
Site Description
Station ID
Water body
ID
Regio n
SE
CE
MT
24 hr
DO
Aq Hab
Ben
Nek
Met Wat
Org Wat
Met Sed
Org Sed
Conv
Amb Tox Wat
Amb Tox Sed
Bact
Flow
Fish Tiss
Field
Comments
RIO GRANDE AT MAIN STREET BOAT RAMP APPROX 400 METERS UPSTREAM OF US 57/INTERNATIONAL BRIDGE IN EAGLE PASS | Map
20997
2304
16
IB
IB
RT
4
4
4
4
4
new station FY12 to fill data gap in AU 2304_08; quarterly sampling of metals in sediment added FY17.
RIO GRANDE AT KICKAPOO CASINO BOAT RAMP SOUTH OF EAGLE PASS | Map
20999
2304
16
IB
IB
RT
8
8
8
8
replaces 18795 and 18792; removal of metals in sediment FY17.
RIO GRANDE AT EL CENIZO PARK 220 METERS W EST OF INTERSECTION OF CADENA AND JIMENEZ | Map
21542
2304
16
IB
RN
RT
4
4
4
MANA DAS CREEK AT FM 1472 NORTH OF LAREDO | Map
13116
2304B
16
IB
LE
RT
4
1
4
4
4
Also collecting metals in water, Lab-filtered not field filtered. Therefore not submitted to SW QMIS but available on IBW C website.
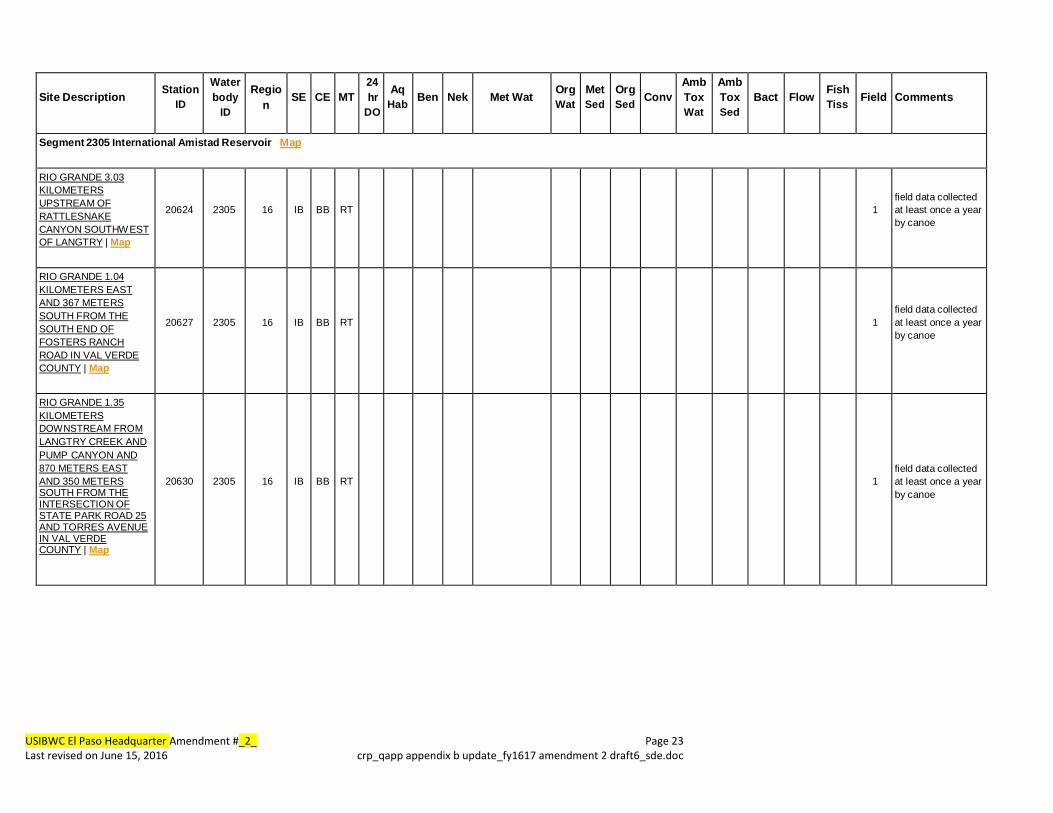
USIBWC El Paso Headquarter Amendment #_2_ Page 23 Last revised on June 15, 2016 crp_qapp appendix b update_fy1617 amendment 2 draft6_sde.doc
Site Description
Station ID
Water body
ID
Regio n
SE
CE
MT
24 hr
DO
Aq Hab
Ben
Nek
Met Wat
Org Wat
Met Sed
Org Sed
Conv
Amb Tox Wat
Amb Tox Sed
Bact
Flow
Fish Tiss
Field
Comments
Segment 2305 International Amistad Reservoir Map
RIO GRANDE 3.03 KILOMETERS UPSTREAM OF RATTLESNAKE CANYON SOUTHW EST OF LANGTRY | Map
20624
2305
16
IB
BB
RT
1
field data collected at least once a year by canoe
RIO GRANDE 1.04 KILOMETERS EAST AND 367 METERS SOUTH FROM THE SOUTH END OF FOSTERS RANCH ROAD IN VAL VERDE COUNTY | Map
20627
2305
16
IB
BB
RT
1
field data collected at least once a year by canoe
RIO GRANDE 1.35 KILOMETERS DOW NSTREAM FROM LANGTRY CREEK AND PUMP CANYON AND 870 METERS EAST AND 350 METERS SOUTH FROM THE INTERSECTION OF STATE PARK ROAD 25 AND TORRES AVENUE IN VAL VERDE COUNTY | Map
20630
2305
16
IB
BB
RT
1
field data collected at least once a year by canoe

USIBWC El Paso Headquarter Amendment #_2_ Page 24 Last revised on June 15, 2016 crp_qapp appendix b update_fy1617 amendment 2 draft6_sde.doc
Site Description
Station ID
Water body
ID
Regio n
SE
CE
MT
24 hr
DO
Aq Hab
Ben
Nek
Met Wat
Org Wat
Met Sed
Org Sed
Conv
Amb Tox Wat
Amb Tox Sed
Bact
Flow
Fish Tiss
Field
Comments
Segment 2306 Rio Grande Above Amistad Reservoir Map
RIO GRANDE 1.895 KILOMETERS SOUTH AND 552 METERS W EST FROM THE INTERSECTION OF UNNAMED STREET AND FOSTER RANCH ROAD AND 10.1021 KILOMETERS SOUTH AND 4.37 KILOMETERS W EST FROM THE INTERSECTION OF US HIGHW AY 90 AND FOSTERS RANCH ROAD IN VAL VERDE COUNTY CAMS 759 | Map
13223
2306
16
IB
BB
RT
1
Field data will be reported at least once in the year.
RIO GRANDE AT HORSE CA NYON 2.4 MI DOW NSTREAM OF GERSTACKER BRIDGE | Map
13224
2306
6
IB
BB
RT
1
field data will be reported at least once in the year
RIO GRANDE AT FM 2627/GERSTACKER BRIDGE DOW NSTREAM BIG BEND | Map
13225
2306
6
IB
BB
RT
1
field data will be reported at least once in the year
RIO GRANDE AT STILLW ELL CROSSING | Map
13226
2306
6
IB
BB
RT
1
Field data collected by canoe at least once a year.
RIO GRANDE AT THE MOUTH OF SANTA ELENA CANYON | Map
13228
2306
6
IB
BB
RT
2
8
8
8
8
Metals - Total Mercury sampled FY12

USIBWC El Paso Headquarter Amendment #_2_ Page 25 Last revised on June 15, 2016 crp_qapp appendix b update_fy1617 amendment 2 draft6_sde.doc
Site Description
Station ID
Water body
ID
Regio n
SE
CE
MT
24 hr
DO
Aq Hab
Ben
Nek
Met Wat
Org Wat
Met Sed
Org Sed
Conv
Amb Tox Wat
Amb Tox Sed
Bact
Flow
Fish Tiss
Field
Comments
RIO GRANDE 449 METERS W EST AND 121 METERS SOUTH FROM THE INTERSECTION OF RANCH ROAD 170 AND RANCH ROAD 169 IN PRESIDIO COUNTY CAMS 758 | Map
13229
2306
6
IB
IB
RT
2
8
8
8
8
Metals - Total Mercury sampled FY12
RIO GRANDE IMMEDIATELY DOW NSTREAM FROM MOUTH OF LOZIER CANYON 44 KM SE OF DRYDEN | Map
13722
2306
7
IB
BB
RT
1
field data collected at least once a year by canoe
RIO GRANDE AT BOAT RAMP AT RIO GRANDE VILLAGE IN BIG BEND NATIONAL PARK | Map
16730
2306
6
IB
BB
RT
2
8
8
8
8
Metals - Total Mercury sampled FY12
RIO GRANDE RIVER AT COLORA DO CANYON APPROX 30KM SE OF REDFORD ON RR170 IN PRESIDIO COUNTY | Map
16862
2306
6
IB
PW
RT
2
4
4
4
Metals - Total Mercury sampled FY12; sampling frequency reduced to quarterly
RIO GRANDE AT PRESIDIO RAILROAD BRIDGE 3.25KM DOW NSTREAM OF US67 SOUTH OF PRESIDIO | Map
17000
2306
6
IB
IB
RT
8
8
8
RIO GRANDE AT PRESIDIO/OJINAGA TOLL BRIDGE/INTERNATION AL 0.75KM DOW NSTREAM OF US67 IN PRESIDIO | Map
17001
2306
6
IB
IB
RT
8
8
8

USIBWC El Paso Headquarter Amendment #_2_ Page 26 Last revised on June 15, 2016 crp_qapp appendix b update_fy1617 amendment 2 draft6_sde.doc
Site Description
Station ID
Water body
ID
Regio n
SE
CE
MT
24 hr
DO
Aq Hab
Ben
Nek
Met Wat
Org Wat
Met Sed
Org Sed
Conv
Amb Tox Wat
Amb Tox Sed
Bact
Flow
Fish Tiss
Field
Comments
RIO GRANDE AT LAJITAS RESORT/FM 170 BOAT RAMP 240 M UPSTREAM OF BLACK HILLS CREEK CONFLUENCE NEAR LAJITAS | Map
18441
2306
6
IB
PW
RT
2
4
4
4
Metals - Total Mercury sampled FY12
RIO GRANDE AT BOQUILLAS CROSSING IN BIG BEND NATIONAL PARK | Map
20619
2306
6
IB
BB
RT
1
field data collected at least once a year by canoe
RIO GRANDE AT TAYLORS FARM SOUTHW EST OF SANDERSON | Map
20623
2306
6
IB
BB
RT
1
field data collected at least once a year by canoe
RIO GRANDE 50 METERS UPSTREAM OF SILBER CANYON SOUTH OF SANDERSON IN BREW STER COUNTY | Map
20625
2306
6
IB
BB
RT
1
field data collected at least once a year by canoe
RIO GRANDE DOW NSTREAM OF RODEO RAPIDS SOUTH OF SANDERSON IN BREW STER COUNTY | Map
20626
2306
6
IB
BB
RT
1
field data collected at least once a year by canoe
RIO GRANDE 1.3 KILOMETERS DOW NSTREAM OF BEAR CANYON AND APPROXIMATELY 9.3 KILOMETERS DOW NSTREAM OF COOK CREEK IN TERRELL COUNTY | Map
20628
2306
7
IB
BB
RT
1
field data collected at least once a year by canoe

USIBWC El Paso Headquarter Amendment #_2_ Page 27 Last revised on June 15, 2016 crp_qapp appendix b update_fy1617 amendment 2 draft6_sde.doc
Site Description
Station ID
Water body
ID
Regio n
SE
CE
MT
24 hr
DO
Aq Hab
Ben
Nek
Met Wat
Org Wat
Met Sed
Org Sed
Conv
Amb Tox Wat
Amb Tox Sed
Bact
Flow
Fish Tiss
Field
Comments
RIO GRANDE 570 METERS NORTH AND 605 METERS W EST FROM THE SOUTH END OF SHAFTER CROSSING ROAD AND 1.90 KILOMETERS DOW NSTREAM OF BRITTON CANYON IN TERRELL COUNTY | Map
20629
2306
7
IB
BB
RT
1
field data collected at least once a year by canoe
RIO GRANDE AT THE CONFLUENCE W ITH INDIAN CREEK IN TERRELL COUNTY | Map
20631
2306
7
IB
BB
RT
1
field data collected at least once a year by canoe
RIO GRANDE 7.5 KILOMETERS UPSTREAM FROM THE CONFLUENCE W ITH SAN FRANCISCO CREEK IN BREW STER COUNTY | Map
20632
2306
6
IB
BB
RT
1
field data collected at least once a year by canoe
Segment 2307 Rio Grande Below Riverside Diversion Dam Map
RIO GRANDE 3.38 KILOMETERS UPSTREAM FROM THE CONFLUENCE W ITH THE RIO CONCHOS 6.72 KILOMETERS W EST AND 2.445 KILOMETERS NORTH FROM THE INTERSECTION OF RANCH ROAD 170 AND RODRIQUEZ ROAD IN PRESIDIO COUNTY CAMS 757 | Map
13230
2307
6
IB
IB
RT
2
8
8
8
8
Metals - Total Mercury sampled FY12
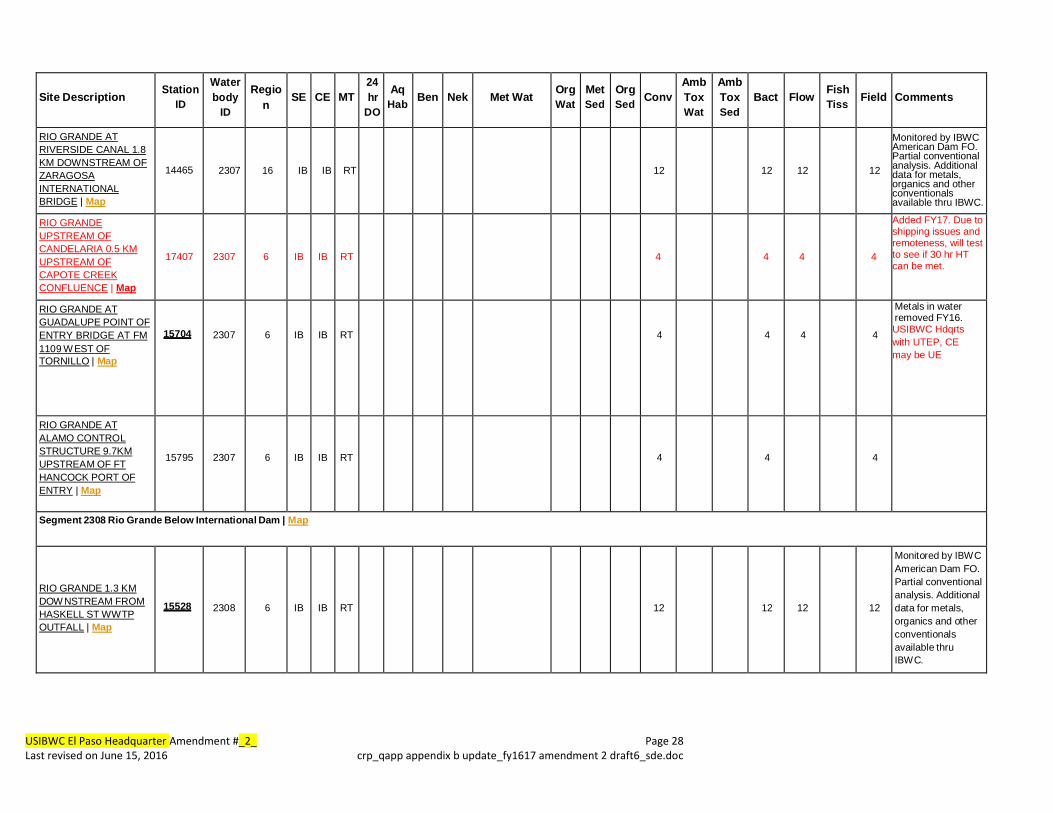
USIBWC El Paso Headquarter Amendment #_2_ Page 28 Last revised on June 15, 2016 crp_qapp appendix b update_fy1617 amendment 2 draft6_sde.doc
Site Description
Station ID
Water body
ID
Regio n
SE
CE
MT
24 hr
DO
Aq Hab
Ben
Nek
Met Wat
Org Wat
Met Sed
Org Sed
Conv
Amb Tox Wat
Amb Tox Sed
Bact
Flow
Fish Tiss
Field
Comments
RIO GRANDE AT RIVERSIDE CANAL 1.8 KM DOWNSTREAM OF ZARAGOSA INTERNATIONAL BRIDGE | Map
14465
2307
16
IB
IB
RT
12
12
12
12
Monitored by IBWC American Dam FO. Partial conventional analysis. Additional data for metals, organics and other conventionals available thru IBWC.
RIO GRANDE UPSTREAM OF CANDELARIA 0.5 KM UPSTREAM OF CAPOTE CREEK CONFLUENCE | Map
17407 2307 6 IB IB RT 4 4 4 4
Added FY17. Due to shipping issues and remoteness, will test to see if 30 hr HT can be met.
RIO GRANDE AT GUADALUPE POINT OF ENTRY BRIDGE AT FM 1109 W EST OF TORNILLO | Map
15704
2307
6
IB
IB
RT
4
4
4
4
Metals in water removed FY16. USIBWC Hdqrts with UTEP, CE may be UE
RIO GRANDE AT ALAMO CONTROL STRUCTURE 9.7KM UPSTREAM OF FT HANCOCK PORT OF ENTRY | Map
15795
2307
6
IB
IB
RT
4
4
4
Segment 2308 Rio Grande Below International Dam | Map
RIO GRANDE 1.3 KM DOW NSTREAM FROM HASKELL ST WW TP OUTFALL | Map
15528
2308
6
IB
IB
RT
12
12
12
12
Monitored by IBW C American Dam FO. Partial conventional analysis. Additional data for metals, organics and other conventionals available thru IBW C.

USIBWC El Paso Headquarter Amendment #_2_ Page 29 Last revised on June 15, 2016 crp_qapp appendix b update_fy1617 amendment 2 draft6_sde.doc
Site Description
Station ID
Water body ID
Regio n
SE
CE
MT
24 hr
DO
Aq Hab
Ben
Nek
Met Wat
Org Wat
Met Sed
Org Sed
Conv
Amb Tox Wat
Amb Tox Sed
Bact
Flow
Fish Tiss
Field
Comments
RIO GRANDE 2.4 KM UPSTREAM FROM HASKELL ST WW TP OUTFALL SOUTH OF BOW IE HIGH SCHOOL FOOTBALL STADIUM IN EL PASO | Map
15529
2308
6
IB
IB
RT
12
12
12
12
Monitored by IBW C American Dam FO. Partial conventional analysis. Additional data for metals, organics and other conventionals available thru IBW C.

USIBWC El Paso Headquarter Amendment #_2_ Page 30 Last revised on June 15, 2016 crp_qapp appendix b update_fy1617 amendment 2 draft6_sde.doc
Site Description
Station ID
Water body
ID
Regio n
SE
CE
MT
24 hr
DO
Aq Hab
Ben
Nek
Met Wat
Org Wat
Met Sed
Org Sed
Conv
Amb Tox Wat
Amb Tox Sed
Bact
Flow
Fish Tiss
Field
Comments
Segment 2310 Lower Pecos River | Map
PECOS RIVER APPROXIMATELY 0.5 MILES DOW NSTREAM FROM THE CONFLUENCE W ITH INDEPENDENCE CREEK | Map
14163
2310
7
IB
MC
RT
3
3
6
6
Collecting conv, bacteria, flow, field 3x/yr; field and flow only 3 additional times/yr
Segment 2311 Upper Pecos River
PECOS RIVER 0.1 KM UPSTREAM OF THE CONFLUENCE W ITH INDEPENDENCE CREEK CHANDLER RANCH | Map
13248
2311
7
IB
MC
RT
3
6
6
Collecting conv, field, flow 3x/yr; field and flow only 3 additional times/yr
Segment 2314 Rio Grande Above International Dam | Map
RIO GRANDE AT COURCHESNE BRIDGE 1.7 MI UPSTREAM FROM AMERICAN DAM CAMS 718 | Map
13272
2314
6
IB
IB
RT
12
12
12
12
Monitored by IBW C American Dam FO. Partial conventional analysis. Additional non-accredited data available with IBW C for metals, Organics, and other conventionals.
RIO GRANDE AT BORDERLAND RD NW OF EL PASO | Map
13274
2314
6
IB
IB
RT
4 4 4 4
in support of Paso del Norte Watershed Councils 319h grant and for stakeholder concerns for bacteria. Total Mercury removed FY16. USIBWC Hdqrts with EPCC, CE may be EP.

USIBWC El Paso Headquarter Amendment #_2_ Page 31 Last revised on June 15, 2016 crp_qapp appendix b update_fy1617 amendment 2 draft6_sde.doc
Site Description
Station ID
Water body
ID
Regio n
SE
CE
MT
24 hr
DO
Aq Hab
Ben
Nek
Met Wat
Org Wat
Met Sed
Org Sed
Conv
Amb Tox Wat
Amb Tox Sed
Bact
Flow
Fish Tiss
Field
Comments
RIO GRANDE 40M SOUTH OF VINTON BRIDGE APPROXIMATELY 4 KM S OF ANTHONY | Map
13275
2314
6
IB
IB
RT
4 4 4 4
in support of Paso del Norte Watershed Councils 319h grant and for stakeholder concerns for bacteria. Total Mercury removed FY16. USIBWC Hdqrts with EPCC, CE may be EP.
RIO GRANDE IMMED UPSTREAM OF THE CONFL W ITH ANTHONY DRAIN WEST OF LA TUNA PRISON NEAR THE STATE LINE | Map
13276
2314
6
IB
IB
RT
4 4 8 8
In support of Paso del Norte Watershed Councils 319h grant and for stakeholder recreation concerns. Total Mercury removed FY16. 4x/yr field data only. USIBWC Hdqrts with EPCC, CE may be EP.
RIO GRANDE RIVER AT AMERICAN EAGLE BRICK FACTORY BRIDGE ABANDONED RR 0.1 MI DOW NSTREAM FROM SOUTHERN PACIFIC RR AT SMELTERTOW N | Map
15089 2314 6 IB IB RT 3 5 5
Metals in water removed FY16. 2x/yr bacteria and field data only. USIBWC Hdqrts with UTEP, CE may be UE
RIO GRANDE AT ANAPRA BRIDGE ON SUNLAND PARK DRIVE 4.2 KM UPSTREAM OF AMERICAN DAM IN NEW MEXICO | Map
17040 2314 6 IB IB RT 4 4 4
Total metals in water removed FY16. 2x/yr field only. USIBWC Hdqrts with EPCC, CE may be EP.

USIBWC El Paso Headquarter Amendment #_2_ Page 32 Last revised on June 15, 2016 crp_qapp appendix b update_fy1617 amendment 2 draft6_sde.doc
Critical vs. non-critical measurements
All data collected under this QAPP and entered into SWQMIS are considered critical.

USIBWC El Paso Headquarter Amendment #_2_ Page 33 Last revised on June 15, 2016 crp_qapp appendix b update_fy1617 amendment 2 draft6_sde.doc
Appendix C: Station Location Maps
Station Location Maps
Maps of stations monitored by the USIBWC CRP are provided below. The maps were generated by the USIBWC. This product is for informational purposes and may not have been prepared for or be suitable for legal, engineering, or surveying purposes. It does not represent an on-the-ground survey and represents only the approximate relative location of property boundaries. For more information concerning this map, contact the USIBWC CRPProgram Manager, Leslie Grijalva, at 915-832-4770.

USIBWC El Paso Headquarter Amendment #_2_ Page 34 Last revised on June 15, 2016 crp_qapp appendix b update_fy1617 amendment 2 draft6_sde.doc
Figure 4: Map of the Rio Grande Basin, Northern
17407

USIBWC El Paso Headquarter Amendment #_3_ Page 1 October 21, 2016 crp_qapp amendment 3
Amendment # 3 to the Rio Grande Basin Clean Rivers Program FY 2016/2017 QAPP
Prepared by the U.S. International Boundary and Water Commission in Cooperation with the Texas Commission on Environmental Quality (TCEQ)
Effective: Immediately upon approval by all parties Questions concerning this QAPP should be directed to: Leslie Grijalva USIBWC El Paso Headquarters Program Manager 4171 N. Mesa St., Ste. C‐100 El Paso, TX 79902 (915) 832‐4770 [email protected]

USIBWC El Paso Headquarter Amendment #_3_ Page 2 October 21, 2016 crp_qapp amendment 3
Justification
This document details changes made to Table B1.1 to reflect actual planned monitoring at USIBWC CRP sites
Summary of Changes
The following information in Amendment 3 is amended to reflect changes to:
Table B1.1 of Appendix B
Sample Design Rationale of Appendix B
Figure 5 of Appendix C
Detail of Changes
Section/Figure/Table Page Change Justification
Sample Design Rationale FY 2017
89 Added text to signify changes to the coordinated monitoring schedule.
Outline the changes to the coordinated monitoring schedule.
Table B1.1 94 Update to Station 13116‐ Removed note of organics in sediment
Review of the monitoring schedule found that the organics in sediment section for Station 13116 was outdated. It reflected that organics in sediment analyses were being conducted, but organics analyses have not been conducted in some time. Section updated.
Table B1.1
94 Updating Station 13116 by adding quarterly analysis of metals in water
Review of the monitoring schedule showed that analyses at this site were inaccurate. Total metals in water are tested from samples collected by Laredo Environmental and reported to TCEQ, and have been for many years Updated this section to reflect current sampling.

USIBWC El Paso Headquarter Amendment #_3_ Page 3 October 21, 2016 crp_qapp amendment 3
Table B1.1 94 Updating remarks in comment section for Station 13116.
The testing of dissolved metals are for USIBWC use and not reported to TCEQ. Comment now reads: Total Metals in Water and Dissolved Metals in Water are both being analyzed. The Total Metals are submitted to TCEQ and the Dissolved Metals are not, due to when the sample is filtered. Dissolved Metals in water data can be found on IBWC website.
Table B1.1 102 Revised station description for station 14163
The location of station 14163 was moved 130 meters to reflect where sampling was actually occurring. This change resulted in a revision to the station description as well.
Table B1.1 102 Added Station 14164 and removed Station 13248
Sampling was recorded at station 13248, but actually took place near station 14164. Station 14164 was moved less than 150 meters to where sampling was actually occurring and future sampling will be recorded at the revised location for station 14164. This change resulted in a revision to the station description as well.
Figure 5 105 Added Station 14164 and removed Station 13248
Removed marker of Station 13248 and replaced it with new Station 14164 on Figure 5 Map of the Upper Rio Grande Basin, Southern Half.

USIBWC El Paso Headquarter Amendment #_3_ Page 4 October 21, 2016 crp_qapp amendment 3
Distribution
QAPP Amendments and Revisions to Appendices will be distributed to all personnel on the distribution list maintained by the Planning Agency.
These changes will be incorporated into the QAPP document and TCEQ and the USIBWC will acknowledge and accept these changes by signing this amendment.

USIBWC El Paso Headquarter Amendment #_3_ Page 5 October 21, 2016 crp_qapp amendment 3
Texas Commission on Environmental Quality
Water Quality Planning Division
Approved Electronically Effective 10/28/2016 Approved Electronically Effective 10/28/2016
Sarah Eagle Date Project Manager Clean Rivers Program [email protected]
Sarah Eagle, Work Leader Date Clean Rivers Program
Approved Electronically Effective 10/28/2016 Approved Electronically Effective 10/28/2016
Kelly Rodibaugh Date Project Quality Assurance Specialist Clean River Program [email protected]
Cathy Anderson, Team Leader Date Data Management and Analysis
Monitoring Division
Approved Electronically Effective 10/28/2016
Daniel R. Burke Date Lead CRP Quality Assurance Laboratory and Quality Assurance Section [email protected]

USIBWC El Paso Headquarter Amendment #_3_ Page 6 October 21, 2016 crp_qapp amendment 3
United States Section, International Boundary and Water Commission (USIBWC), Environmental Management Division
Approved Electronically Effective 10/28/2016 Approved Electronically Effective 10/28/2016
Leslie Grijalva Date USIBWC CRP Project Manager [email protected]
Andres Garcia Date USIBWC CRP Quality Assurance Officer
The USIBWC will secure written documentation from each sub‐tier project participant (e.g., subcontractors, sub participants, or other units of government) stating the organization’s awareness of and commitment to requirements contained in this quality assurance project plan and any amendments or added appendices of this plan. Alternatively, additional signature blocks for sub‐tier participants may be added to section A1. Signatures in section A1 will eliminate the need for adherence letter maintenance. The USIBWC will maintain this documentation as part of the project’s quality assurance records, and will ensure the documentation is available for review.

USIBWC El Paso Headquarter Amendment #_3_ Page 7 October 21, 2016 crp_qapp amendment 3
A3 Distribution List
City of Laredo Environmental Services Department 619 Reynolds St. Laredo, TX 78040 John Porter, Director Lucky Roncinske, Environmental Technician II
(956) 794‐1650 (956) 794‐1650
Midland College Fox Science Building, Room 203 3600 N. Garfield Midland, TX 79705 Mr. Greg Larson, Associate Professor of Biology
(432) 685‐6732

USIBWC El Paso Headquarter Amendment #_3_ Page 8 October 21, 2016 crp_qapp amendment 3
Appendix B Sampling Process Design and Monitoring Schedule (plan)
Sample Design Rationale FY 2017 The sample design is based on the legislative intent of CRP. Under the legislation, the Basin Planning Agencies have been tasked with providing data to characterize water quality conditions in support of the Texas Water Quality Integrated Report, and to identify significant long‐term water quality trends. Based on Steering Committee input, achievable water quality objectives and priorities and the identification of water quality issues are used to develop work plans which are in accord with available resources. As part of the Steering Committee process, the IBWC coordinates closely with the TCEQ and other participants to ensure a comprehensive water monitoring strategy within the watershed.
Changes to FY17 Coordinated Monitoring Schedule Lower:
No changes. Middle:
Added quarterly metals in water sampling to site 13116 to reflect the sampling as it has been done. Clarified text in the comment section. Removed the note on organics.
Upper2:
No changes.
Upper1:
No changes.
Pecos: Replaced station 13248 with station 14164 to reflect the location where sampling had actually
been occurring and will continue to occur.
Revised description of station 14163 to reflect the minor change in location.

USIBWC El Paso Headquarter Amendment #_3_ Page 9 October 21, 2016 crp_qapp amendment 3
Monitoring Sites for FY 2017 The sample design for SWQM is shown in Table B1.1 below.
Table B1.1 Sample Design and Schedule, FY 2017
Site Description
Station ID
Water body
ID
Region
SE
CE MT
24 hr
DO
Aq Hab Ben Nek Met Wat Org
WatMetSed
Org Sed
Conv
Amb Tox Wat
Amb Tox Sed
Bact Flow FishTiss
Field Comments
Segment 2301 Rio Grande Tidal | Map
RIO GRANDE RIVER TIDAL AT THE END OF QUICKSILVER AVE 375 METERS SOUTH FROM THE INTERSECTION OF BOCA CHI CA BLVD AND QUICKSILVER AVE | Map
13176
2301
15
IB
UB
RT
4
4
4
RIO GRANDE RIVER AT SABAL PALM SANCTUARY 370 METERS SOUTH AND 310 METERS EAST FROM THE INTERSECTION OF DAKOTA AVE AND SABAL PALM GROVE ROAD | Map
16288
2301
15
IB
UB
RT
4
4
4
Entero analyzed by BPUB. Conventionals by IBW C lab.
Segment 2302 Rio Grande Below Falcon Reservoir | Map
RIO GRANDE AT EL JARDIN PUMP STATION LOCATED 350 METERS W EST OF INTERSECTION OF MONSEES ROAD AND CALLE MILPA VERDE | Map
13177
2302
15
IB
IB
RT
8
8
8
8

USIBWC El Paso Headquarter Amendment #_3_ Page 10 October 21, 2016 crp_qapp amendment 3
Site Description
Station ID
Water body ID
Regio
n
SE
CE
MT
24 hr
DO
AqHab
Ben
Nek
Met Wat
OrgWat
MetSed
Org Sed
Conv
Amb Tox Wat
Amb Tox Sed
Bact
Flow
FishTiss
Field
Comments
RIO GRANDE INTERNATIONAL BRIDGE ON US 77 AT BROW NSVILLE | Map
13178
2302
15
IB
UB
RT
4
4
4
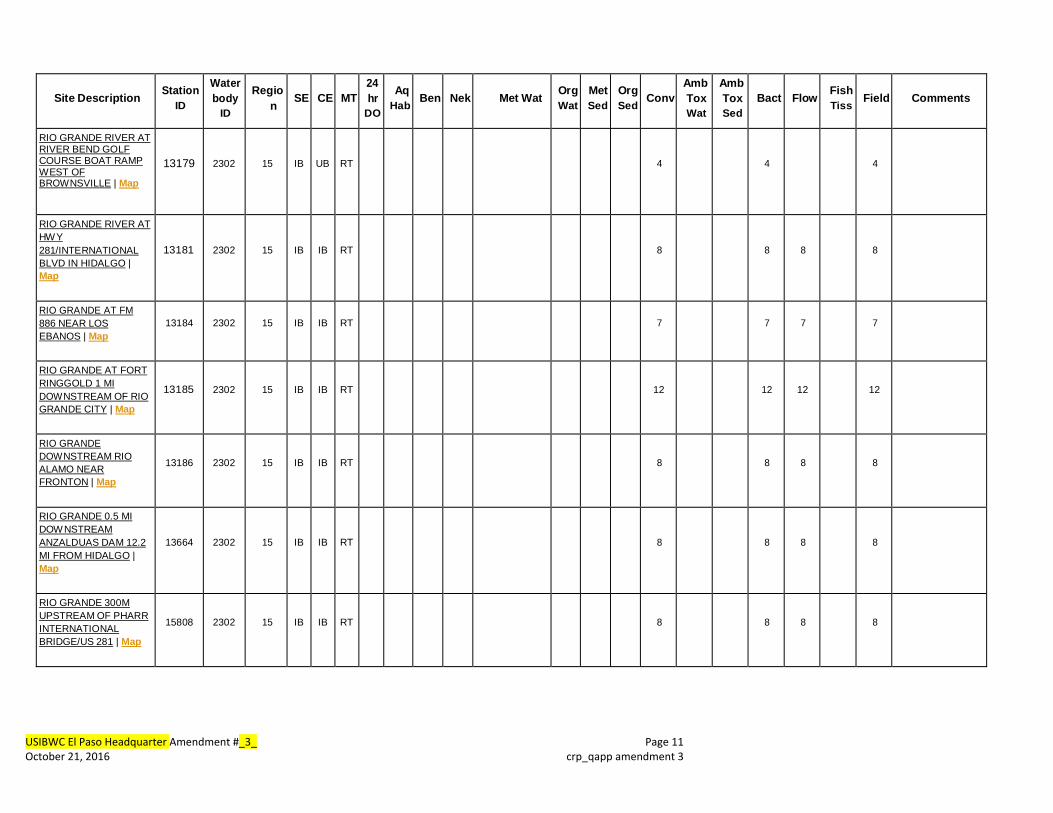
USIBWC El Paso Headquarter Amendment #_3_ Page 11 October 21, 2016 crp_qapp amendment 3
Site Description
Station ID
Water body
ID
Regio n
SE
CE MT
24 hr
DO
AqHab Ben Nek Met Wat Org
WatMetSed
Org Sed
Conv
Amb Tox Wat
Amb Tox Sed
Bact Flow FishTiss Field Comments
RIO GRANDE RIVER AT RIVER BEND GOLF COURSE BOAT RAMP WEST OF BROW NSVILLE | Map
13179
2302
15
IB
UB
RT
4
4
4
RIO GRANDE RIVER AT HW Y 281/INTERNATIONAL BLVD IN HIDALGO | Map
13181
2302
15
IB
IB RT
8
8
8
8
RIO GRANDE AT FM 886 NEAR LOS EBANOS | Map
13184
2302
15
IB
IB RT
7
7 7
7
RIO GRANDE AT FORT RINGGOLD 1 MI DOW NSTREAM OF RIO GRANDE CITY | Map
13185
2302
15
IB
IB
RT
12
12
12
12
RIO GRANDE DOW NSTREAM RIO ALAMO NEAR FRONTON | Map
13186
2302
15
IB
IB
RT
8
8
8
8
RIO GRANDE 0.5 MI DOW NSTREAM ANZALDUAS DAM 12.2 MI FROM HIDALGO | Map
13664
2302
15
IB
IB RT
8
8
8
8
RIO GRANDE 300M UPSTREAM OF PHARR INTERNATIONAL BRIDGE/US 281 | Map
15808
2302
15
IB
IB
RT
8
8
8
8
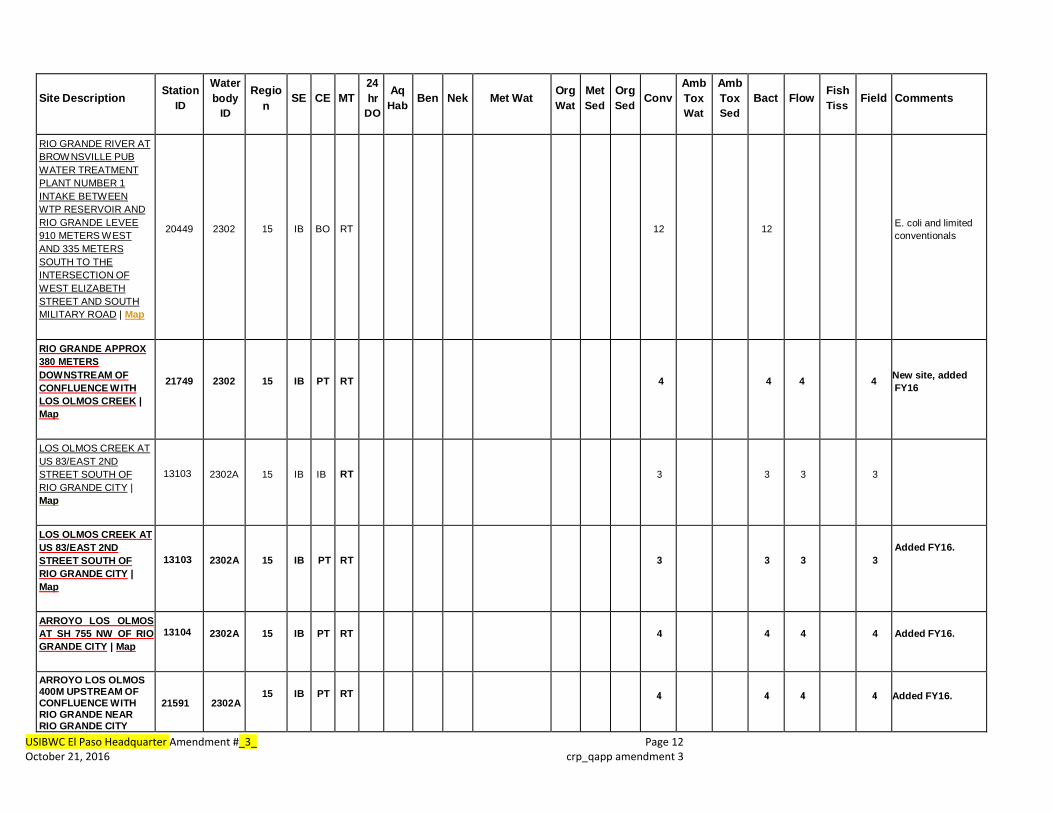
USIBWC El Paso Headquarter Amendment #_3_ Page 12 October 21, 2016 crp_qapp amendment 3
Site Description
Station ID
Water body
ID
Regio n
SE
CE MT
24 hr
DO
Aq Hab Ben Nek Met Wat Org
WatMetSed
Org Sed
Conv
Amb Tox Wat
Amb Tox Sed
Bact Flow FishTiss
Field Comments
RIO GRANDE RIVER AT BROW NSVILLE PUB W ATER TREATMENT PLANT NUMBER 1 INTAKE BETW EEN W TP RESERVOIR AND RIO GRANDE LEVEE 910 METERS W EST AND 335 METERS SOUTH TO THE INTERSECTION OF W EST ELIZABETH STREET AND SOUTH MILITARY ROAD | Map
20449
2302
15
IB
BO
RT
12
12
E. coli and limited conventionals
RIO GRANDE APPROX 380 METERS DOW NSTREAM OF CONFLUENCE W ITH LOS OLMOS CREEK | Map
21749
2302
15
IB
PT
RT
4
4
4
4
New site, added FY16
LOS OLMOS CREEK AT US 83/EAST 2ND STREET SOUTH OF RIO GRANDE CITY | Map
13103
2302A
15
IB
IB
RT
3
3
3
3
LOS OLMOS CREEK AT US 83/EAST 2ND STREET SOUTH OF RIO GRANDE CITY | Map
13103
2302A
15
IB
PT RT
3
3
3
3 Added FY16.
ARROYO LOS OLMOS AT SH 755 NW OF RIO GRANDE CITY | Map
13104
2302A
15
IB
PT RT
4
4 4
4 Added FY16.
ARROYO LOS OLMOS 400M UPSTREAM OF CONFLUENCE W ITH RIO GRANDE NEAR RIO GRANDE CITY
21591
2302A
15
IB
PT RT
4
4 4
4 Added FY16.
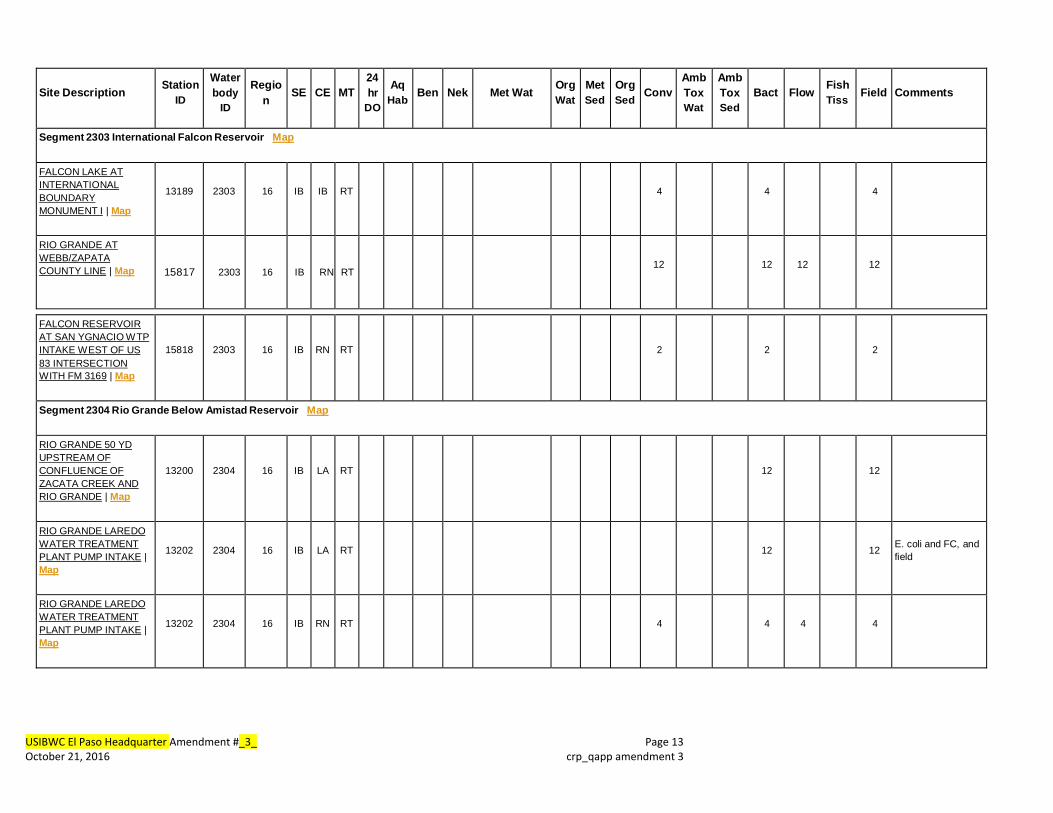
USIBWC El Paso Headquarter Amendment #_3_ Page 13 October 21, 2016 crp_qapp amendment 3
Site Description
Station ID
Water body
ID
Regio n
SE
CE MT
24 hr
DO
Aq Hab Ben Nek Met Wat Org
WatMetSed
Org Sed
Conv
Amb Tox Wat
Amb Tox Sed
Bact Flow FishTiss
Field Comments
Segment 2303 International Falcon Reservoir Map
FALCON LAKE AT INTERNATIONAL BOUNDARY MONUME NT I | Map
13189
2303
16
IB
IB
RT
4
4
4
RIO GRANDE AT WEBB/ZAPATA COUNTY LINE | Map
15817
2303
16
IB
RN RT
12
12
12
12
FALCON RESERVOIR AT SAN YGNACIO W TP INTAKE W EST OF US 83 INTERSECTION W ITH FM 3169 | Map
15818
2303
16
IB
RN
RT
2
2
2
Segment 2304 Rio Grande Below Amistad Reservoir Map
RIO GRANDE 50 YD UPSTREAM OF CONFLUENCE OF ZACATA CREEK AND RIO GRANDE | Map
13200
2304
16
IB
LA
RT
12
12
RIO GRANDE LARE DO W ATER TREATMENT PLANT PUMP INTAKE | Map
13202
2304
16
IB
LA
RT
12
12 E. coli and FC, and
field
RIO GRANDE LARE DO W ATER TREATMENT PLANT PUMP INTAKE | Map
13202
2304
16
IB
RN
RT
4
4
4
4
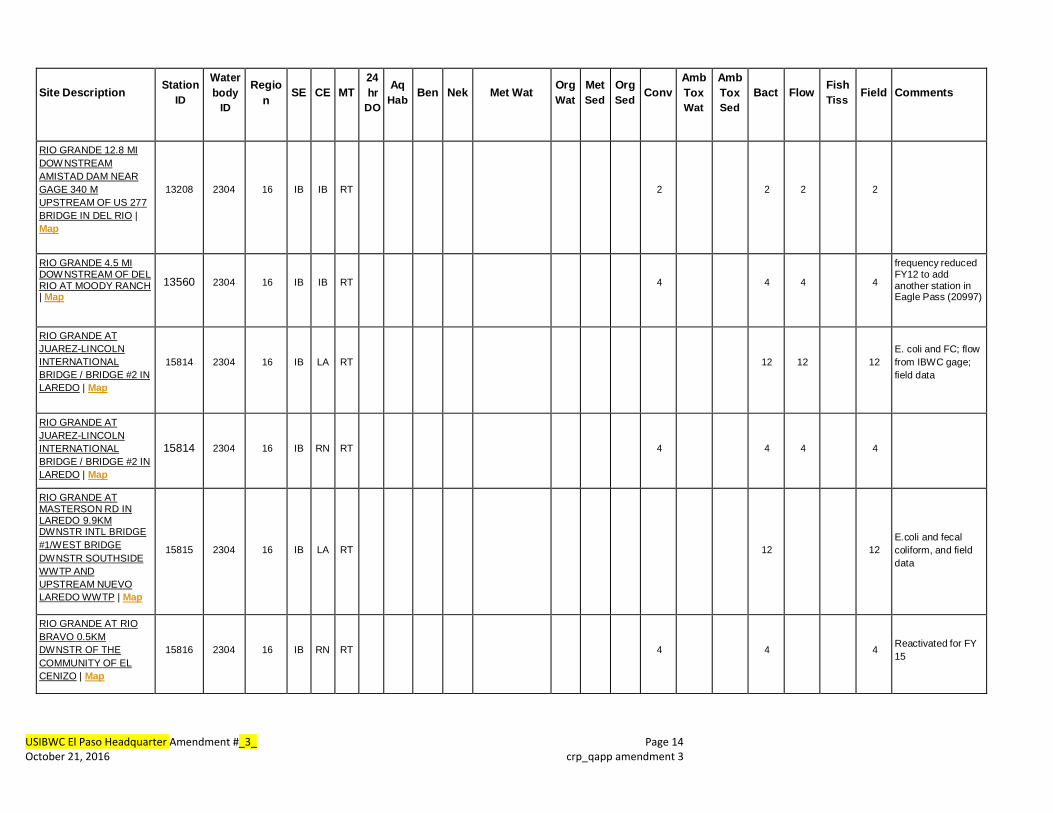
USIBWC El Paso Headquarter Amendment #_3_ Page 14 October 21, 2016 crp_qapp amendment 3
Site Description
Station ID
Water body
ID
Regio n
SE
CE MT
24 hr
DO
Aq Hab Ben Nek Met Wat Org
WatMetSed
Org Sed
Conv
Amb Tox Wat
Amb Tox Sed
Bact Flow FishTiss
Field Comments
RIO GRANDE 12.8 MI DOW NSTREAM AMISTAD DAM NEAR GAGE 340 M UPSTREAM OF US 277 BRIDGE IN DEL RIO | Map
13208
2304
16
IB
IB
RT
2
2
2
2
RIO GRANDE 4.5 MI DOW NSTREAM OF DEL RIO AT MOODY RA NCH | Map
13560
2304
16
IB
IB
RT
4
4
4
4
frequency reduced FY12 to add another station in Eagle Pass (20997)
RIO GRANDE AT JUAREZ-LINCOLN INTERNATIONAL BRIDGE / BRIDGE #2 IN LAREDO | Map
15814
2304
16
IB
LA
RT
12
12
12 E. coli and FC; flow from IBW C gage; field data
RIO GRANDE AT JUAREZ-LINCOLN INTERNATIONAL BRIDGE / BRIDGE #2 IN LAREDO | Map
15814
2304
16
IB
RN
RT
4
4
4
4
RIO GRANDE AT MASTERSON RD IN LAREDO 9.9KM DW NSTR INTL BRIDGE #1/W EST BRIDGE DW NSTR SOUTHSIDE WWTP AND UPSTREAM NUEVO LAREDO WW TP | Map
15815
2304
16
IB
LA
RT
12
12
E.coli and fecal coliform, and field data
RIO GRANDE AT RIO BRAVO 0.5KM DW NSTR OF THE COMMUNITY OF EL CENIZO | Map
15816
2304
16
IB
RN
RT
4
4
4
Reactivated for FY 15

USIBWC El Paso Headquarter Amendment #_3_ Page 15 October 21, 2016 crp_qapp amendment 3
Site Description
Station ID
Water body
ID
Regio n
SE
CE MT
24 hr
DO
Aq Hab Ben Nek Met Wat Org
WatMetSed
Org Sed
Conv
Amb Tox Wat
Amb Tox Sed
Bact Flow FishTiss
Field Comments
RIO GRANDE AT THE COLOMBIA BRIDGE 2.7KM UPSTREAM OF THE DOLORES PUMP STATION 45.1KM UPSTREAM OF THE LAREDO W TP INTAKE | Map
15839
2304
16
IB
LA
RT
12
12
12
E. coli and FC; flow from IBW C gage; field data
RIO GRANDE AT WORLD TRADE BRIDGE ON FM 3484 | Map
17410
2304
16
IB
RN
RT
4
4
4
4
RIO GRANDE AT APACHE RANCH W EST OF INTERSECTION OF PRIVATE ROAD AND EASTERN AIRSTRIP NO BETW EEN LARADO AND EAGLE PASS | Map
17596
2304
16
IB
IB
RT
4
4
4
4
RIO GRANDE 115 METERS SOUTH AND 304 METERS W EST FROM THE INTERSECTION OF RANCHO VIEJO DRIVE/ZEBU COURT AND RIENDA DRIVE IN FATHER MCNABOE CITY PARK IN LAREDO | Map
20650
2304
16
IB
LA
RT
12
12
E.coli and fecal

USIBWC El Paso Headquarter Amendment #_3_ Page 16 October 21, 2016 crp_qapp amendment 3
Site Description
Station ID
Water body
ID
Regio n
SE
CE MT
24 hr
DO
Aq Hab Ben Nek Met Wat Org
WatMetSed
Org Sed
Conv
Amb Tox Wat
Amb Tox Sed
Bact Flow FishTiss
Field Comments
RIO GRANDE AT MAIN STREET BOAT RAMP APPROX 400 METERS UPSTREAM OF US 57/INTERNATIONAL BRIDGE IN EAGLE PASS | Map
20997
2304
16
IB
IB
RT
4
4
4
4
4
new station FY12 to fill data gap in AU 2304_08; quarterly sampling of metals in sediment added FY17.
RIO GRANDE AT KICKAPOO CASINO BOAT RAMP SOUTH OF EAGLE PASS | Map
20999
2304
16
IB
IB
RT
8
8
8
8 replaces 18795 and
18792; removal of metals in sediment FY17.
RIO GRANDE AT EL CENIZO PARK 220 METERS W EST OF INTERSECTION OF CADENA AND JIMENEZ | Map
21542
2304
16
IB
RN
RT
4
4
4
MANA DAS CREEK AT FM 1472 NORTH OF LAREDO | Map
13116
2304B
16
IB
LE
RT
4
4
4
4
4
Total Metals in Water and Dissolved Metals in Water are both being analyzed. The Total Metals are submitted to TCEQ and the Dissolved Metals are not, due to when the sample is filtered. Dissolved Metals in water data can be found on IBWC website.
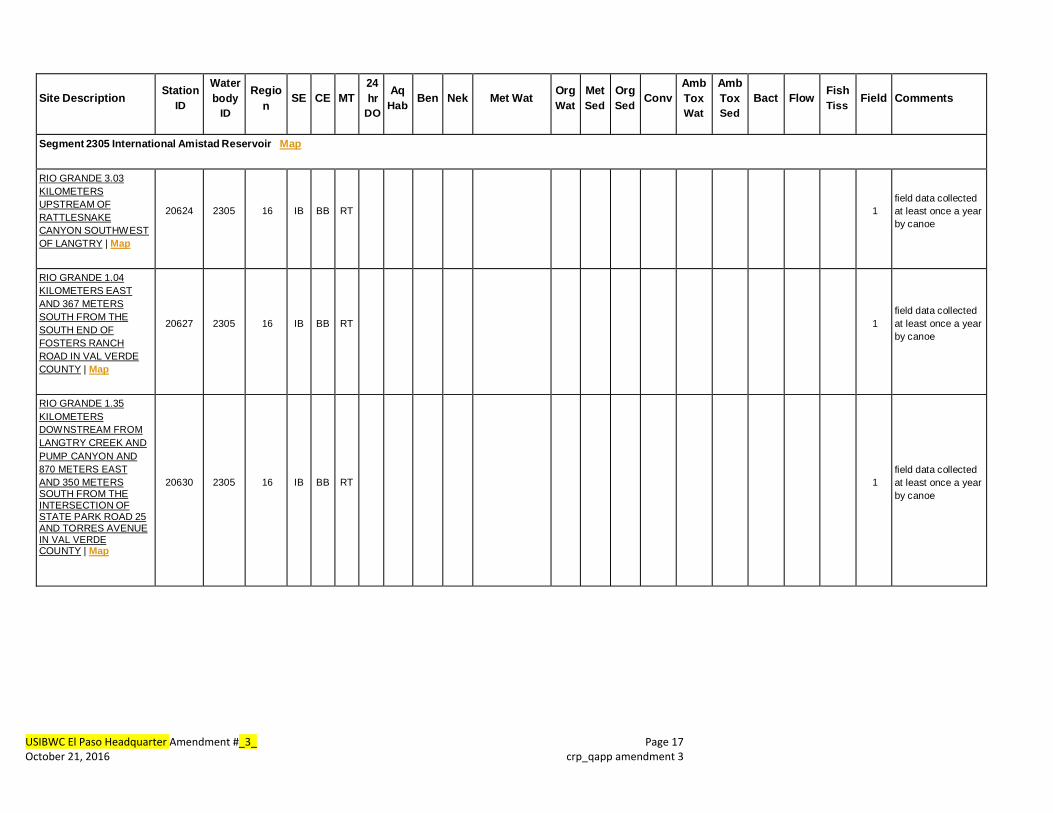
USIBWC El Paso Headquarter Amendment #_3_ Page 17 October 21, 2016 crp_qapp amendment 3
Site Description
Station ID
Water body
ID
Regio n
SE
CE MT
24 hr
DO
Aq Hab Ben Nek Met Wat Org
WatMetSed
Org Sed
Conv
Amb Tox Wat
Amb Tox Sed
Bact Flow FishTiss
Field Comments
Segment 2305 International Amistad Reservoir Map
RIO GRANDE 3.03 KILOMETERS UPSTREAM OF RATTLESNAKE CANYON SOUTHW EST OF LANGTRY | Map
20624
2305
16
IB
BB
RT
1
field data collected at least once a year by canoe
RIO GRANDE 1.04 KILOMETERS EAST AND 367 METERS SOUTH FROM THE SOUTH END OF FOSTERS RANCH ROAD IN VAL VERDE COUNTY | Map
20627
2305
16
IB
BB
RT
1
field data collected at least once a year by canoe
RIO GRANDE 1.35 KILOMETERS DOW NSTREAM FROM LANGTRY CREEK AND PUMP CANYON AND 870 METERS EAST AND 350 METERS SOUTH FROM THE INTERSECTION OF STATE PARK ROAD 25 AND TORRES AVENUE IN VAL VERDE COUNTY | Map
20630
2305
16
IB
BB
RT
1
field data collected at least once a year by canoe

USIBWC El Paso Headquarter Amendment #_3_ Page 18 October 21, 2016 crp_qapp amendment 3
Site Description
Station ID
Water body
ID
Regio n
SE
CE MT
24 hr
DO
Aq Hab Ben Nek Met Wat Org
WatMetSed
Org Sed
Conv
Amb Tox Wat
Amb Tox Sed
Bact Flow FishTiss
Field Comments
Segment 2306 Rio Grande Above Amistad Reservoir Map
RIO GRANDE 1.895 KILOMETERS SOUTH AND 552 METERS W EST FROM THE INTERSECTION OF UNNAMED STREET AND FOSTER RANCH ROAD AND 10.1021 KILOMETERS SOUTH AND 4.37 KILOMETERS W EST FROM THE INTERSECTION OF US HIGHW AY 90 AND FOSTERS RANCH ROAD IN VAL VERDE COUNTY CAMS 759 | Map
13223
2306
16
IB
BB
RT
1
Field data will be reported at least once in the year.
RIO GRANDE AT HORSE CA NYON 2.4 MI DOW NSTREAM OF GERSTACKER BRIDGE | Map
13224
2306
6
IB
BB
RT
1 field data will be reported at least once in the year
RIO GRANDE AT FM 2627/GERSTACKER BRIDGE DOW NSTREAM BIG BEND | Map
13225
2306
6
IB
BB
RT
1 field data will be reported at least once in the year
RIO GRANDE AT STILLW ELL CROSSING | Map
13226
2306
6
IB
BB RT
1
Field data collected by canoe at least once a year.
RIO GRANDE AT THE MOUTH OF SANTA ELENA CANYON | Map
13228
2306
6
IB
BB RT
2
8
8 8
8
Metals - Total Mercury sampled FY12

USIBWC El Paso Headquarter Amendment #_3_ Page 19 October 21, 2016 crp_qapp amendment 3
Site Description
Station ID
Water body
ID
Regio n
SE
CE MT
24 hr
DO
Aq Hab Ben Nek Met Wat Org
WatMetSed
Org Sed
Conv
Amb Tox Wat
Amb Tox Sed
Bact Flow FishTiss
Field Comments
RIO GRANDE 449 METERS W EST AND 121 METERS SOUTH FROM THE INTERSECTION OF RANCH ROAD 170 AND RANCH ROAD 169 IN PRESIDIO COUNTY CAMS 758 | Map
13229
2306
6
IB
IB
RT
2
8
8
8
8
Metals - Total Mercury sampled FY12
RIO GRANDE IMMEDIATELY DOW NSTREAM FROM MOUTH OF LOZIER CANYON 44 KM SE OF DRYDEN | Map
13722
2306
7
IB
BB
RT
1
field data collected at least once a year by canoe
RIO GRANDE AT BOAT RAMP AT RIO GRANDE VILLAGE IN BIG BEND NATIONAL PARK | Map
16730
2306
6
IB
BB
RT
2
8
8
8
8
Metals - Total Mercury sampled FY12
RIO GRANDE RIVER AT COLORA DO CANYON APPROX 30KM SE OF REDFORD ON RR170 IN PRESIDIO COUNTY | Map
16862
2306
6
IB
PW
RT
2
4
4
4
Metals - Total Mercury sampled FY12; sampling frequency reduced to quarterly
RIO GRANDE AT PRESIDIO RAILROAD BRIDGE 3.25KM DOW NSTREAM OF US67 SOUTH OF PRESIDIO | Map
17000
2306
6
IB
IB
RT
8
8
8
RIO GRANDE AT PRESIDIO/OJINAGA TOLL BRIDGE/INTERNATION AL 0.75KM DOW NSTREAM OF US67 IN PRESIDIO | Map
17001
2306
6
IB
IB
RT
8
8
8

USIBWC El Paso Headquarter Amendment #_3_ Page 20 October 21, 2016 crp_qapp amendment 3
Site Description
Station ID
Water body
ID
Regio n
SE
CE MT
24 hr
DO
Aq Hab Ben Nek Met Wat Org
WatMetSed
Org Sed
Conv
Amb Tox Wat
Amb Tox Sed
Bact Flow FishTiss
Field Comments
RIO GRANDE AT LAJITAS RESORT/FM 170 BOAT RAMP 240 M UPSTREAM OF BLACK HILLS CREEK CONFLUENCE NEAR LAJITAS | Map
18441
2306
6
IB
PW
RT
2
4
4
4
Metals - Total Mercury sampled FY12
RIO GRANDE AT BOQUILLAS CROSSING IN BIG BEND NATIONAL PARK | Map
20619
2306
6
IB
BB
RT
1
field data collected at least once a year by canoe
RIO GRANDE AT TAYLORS FARM SOUTHW EST OF SANDERSON | Map
20623
2306
6
IB
BB
RT
1
field data collected at least once a year by canoe
RIO GRANDE 50 METERS UPSTREAM OF SILBER CANYON SOUTH OF SANDERSON IN BREW STER COUNTY | Map
20625
2306
6
IB
BB
RT
1
field data collected at least once a year by canoe
RIO GRANDE DOW NSTREAM OF RODEO RAPIDS SOUTH OF SANDERSON IN BREW STER COUNTY | Map
20626
2306
6
IB
BB
RT
1
field data collected at least once a year by canoe
RIO GRANDE 1.3 KILOMETERS DOW NSTREAM OF BEAR CANYON AND APPROXIMATELY 9.3 KILOMETERS DOW NSTREAM OF COOK CREEK IN TERRELL COUNTY | Map
20628
2306
7
IB
BB
RT
1
field data collected at least once a year by canoe

USIBWC El Paso Headquarter Amendment #_3_ Page 21 October 21, 2016 crp_qapp amendment 3
Site Description
Station ID
Water body
ID
Regio n
SE
CE MT
24 hr
DO
Aq Hab Ben Nek Met Wat Org
WatMetSed
Org Sed
Conv
Amb Tox Wat
Amb Tox Sed
Bact Flow FishTiss
Field Comments
RIO GRANDE 570 METERS NORTH AND 605 METERS W EST FROM THE SOUTH END OF SHAFTER CROSSING ROAD AND 1.90 KILOMETERS DOW NSTREAM OF BRITTON CANYON IN TERRELL COUNTY | Map
20629
2306
7
IB
BB
RT
1
field data collected at least once a year by canoe
RIO GRANDE AT THE CONFLUENCE W ITH INDIAN CREEK IN TERRELL COUNTY | Map
20631
2306
7
IB
BB
RT
1 field data collected at least once a year by canoe
RIO GRANDE 7.5 KILOMETERS UPSTREAM FROM THE CONFLUENCE W ITH SAN FRANCISCO CREEK IN BREW STER COUNTY | Map
20632
2306
6
IB
BB
RT
1
field data collected at least once a year by canoe
Segment 2307 Rio Grande Below Riverside Diversion Dam Map
RIO GRANDE 3.38 KILOMETERS UPSTREAM FROM THE CONFLUENCE W ITH THE RIO CONCHOS 6.72 KILOMETERS W EST AND 2.445 KILOMETERS NORTH FROM THE INTERSECTION OF RANCH ROAD 170 AND RODRIQUEZ ROAD IN PRESIDIO COUNTY CAMS 757 | Map
13230
2307
6
IB
IB
RT
2
8
8
8
8
Metals - Total Mercury sampled FY12
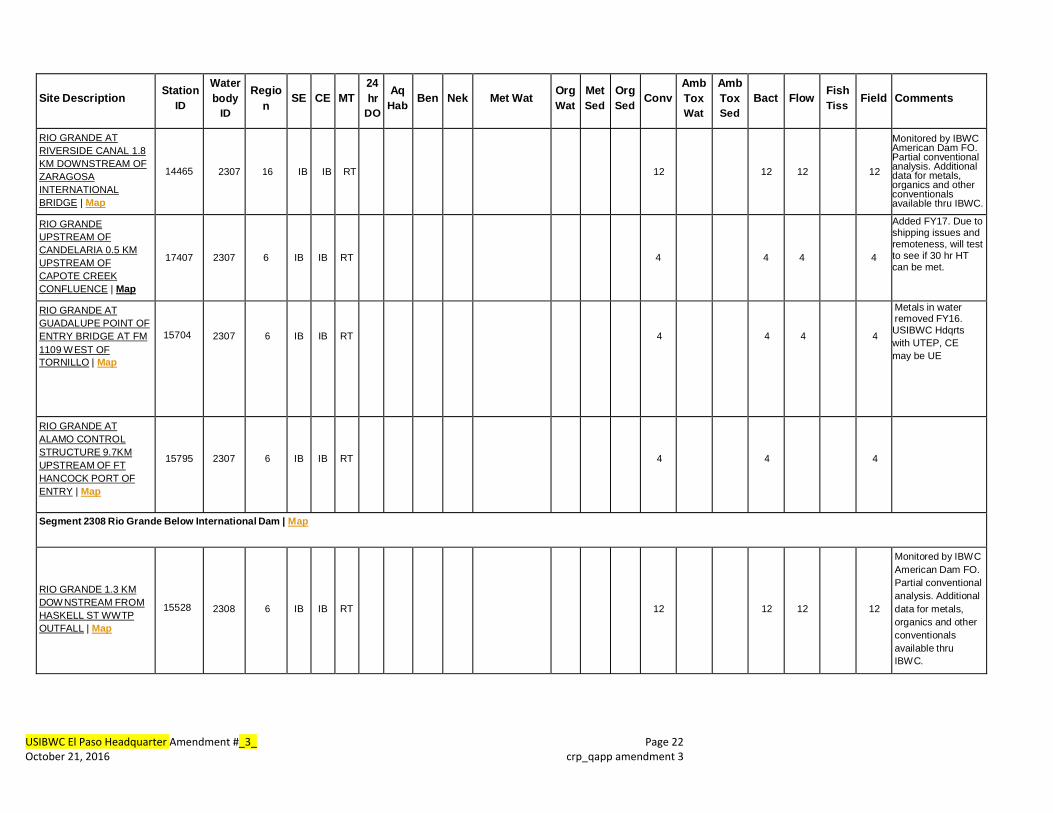
USIBWC El Paso Headquarter Amendment #_3_ Page 22 October 21, 2016 crp_qapp amendment 3
Site Description
Station ID
Water body
ID
Regio n
SE
CE MT
24 hr
DO
Aq Hab Ben Nek Met Wat Org
WatMetSed
Org Sed
Conv
Amb Tox Wat
Amb Tox Sed
Bact Flow FishTiss
Field Comments
RIO GRANDE AT RIVERSIDE CANAL 1.8 KM DOWNSTREAM OF ZARAGOSA INTERNATIONAL BRIDGE | Map
14465
2307
16
IB
IB
RT
12
12
12
12
Monitored by IBWC American Dam FO. Partial conventional analysis. Additional data for metals, organics and other conventionals available thru IBWC.
RIO GRANDE UPSTREAM OF CANDELARIA 0.5 KM UPSTREAM OF CAPOTE CREEK CONFLUENCE | Map
17407 2307 6 IB IB RT 4 4 4 4
Added FY17. Due to shipping issues and remoteness, will test to see if 30 hr HT can be met.
RIO GRANDE AT GUADALUPE POINT OF ENTRY BRIDGE AT FM 1109 W EST OF TORNILLO | Map
15704
2307
6
IB
IB
RT
4
4
4
4
Metals in water removed FY16. USIBWC Hdqrts with UTEP, CE may be UE
RIO GRANDE AT ALAMO CONTROL STRUCTURE 9.7KM UPSTREAM OF FT HANCOCK PORT OF ENTRY | Map
15795
2307
6
IB
IB
RT
4
4
4
Segment 2308 Rio Grande Below International Dam | Map
RIO GRANDE 1.3 KM DOW NSTREAM FROM HASKELL ST WW TP OUTFALL | Map
15528
2308
6
IB
IB
RT
12
12
12
12
Monitored by IBW C American Dam FO. Partial conventional analysis. Additional data for metals, organics and other conventionals available thru IBW C.
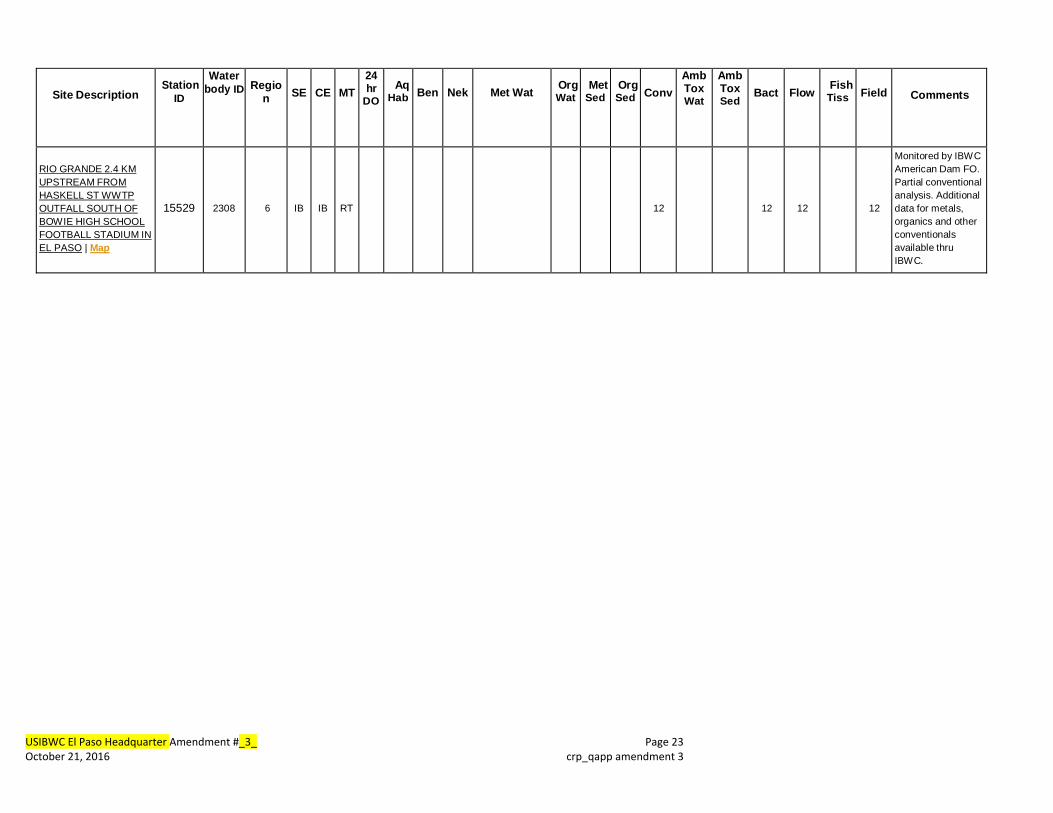
USIBWC El Paso Headquarter Amendment #_3_ Page 23 October 21, 2016 crp_qapp amendment 3
Site Description
Station ID
Water body ID
Regio n
SE
CE MT
24 hr
DOAq
Hab Ben Nek Met Wat OrgWat
MetSed
Org Sed Conv
Amb Tox Wat
Amb Tox Sed
Bact Flow FishTiss Field Comments
RIO GRANDE 2.4 KM UPSTREAM FROM HASKELL ST WW TP OUTFALL SOUTH OF BOW IE HIGH SCHOOL FOOTBALL STADIUM IN EL PASO | Map
15529
2308
6
IB
IB
RT
12
12
12
12
Monitored by IBW C American Dam FO. Partial conventional analysis. Additional data for metals, organics and other conventionals available thru IBW C.

USIBWC El Paso Headquarter Amendment #_3_ Page 24 October 21, 2016 crp_qapp amendment 3
Site Description
Station ID
Water body
ID
Regio n
SE
CE MT
24 hr
DO
Aq Hab Ben Nek Met Wat Org
WatMetSed
Org Sed
Conv
Amb Tox Wat
Amb Tox Sed
Bact Flow FishTiss
Field Comments
Segment 2310 Lower Pecos River | Map
PECOS RIVER APPROX 355 METERS DOWNSTREAM FROM THE CONFLUENCE WITH INDEPENDENCE CREEK | Map
14163
2310
7
IB
MC
RT
3
3
6
6
Collecting conv, bacteria, flow, field 3x/yr; field and flow only 3 additional times/yr
Segment 2311 Upper Pecos River
PECOS RIVER APPROXIMATELY 2.98 KM UPSTREAM OF THE CONFLUENCE WITH INDEPENDENCE CREEK | Map
14164
2311
7
IB
MC
RT
3
6
6
Collecting conv, field, flow 3x/yr; field and flow only 3 additional times/yr
Segment 2314 Rio Grande Above International Dam | Map
RIO GRANDE AT COURCHESNE BRIDGE 1.7 MI UPSTREAM FROM AMERICAN DAM CAMS 718 | Map
13272
2314
6
IB
IB
RT
12
12
12
12
Monitored by IBW C American Dam FO. Partial conventional analysis. Additional non-accredited data available with IBW C for metals, Organics, and other conventionals.
RIO GRANDE AT BORDERLAND RD NW OF EL PASO | Map
13274
2314
6
IB
IB
RT
4 4 4 4
In support of Paso del Norte WatershedCouncils 319h grant and for stakeholder concerns for bacteria. Total Mercury removed FY16. USIBWC Hdqrts with EPCC, CE may be EP.

USIBWC El Paso Headquarter Amendment #_3_ Page 25 October 21, 2016 crp_qapp amendment 3
Site Description
Station ID
Water body
ID
Regio n
SE
CE MT
24 hr
DO
Aq Hab Ben Nek Met Wat Org
WatMet Sed
Org Sed
ConvAmb Tox Wat
Amb Tox Sed
Bact Flow FishTiss
Field Comments
RIO GRANDE 40M SOUTH OF VINTON BRIDGE APPROXIMATELY 4 KM S OF ANTHONY | Map
13275
2314
6
IB
IB
RT
4 4 4 4
In support of Paso del Norte WatershedCouncils 319h grant and for stakeholder concerns for bacteria. Total Mercury removed FY16. USIBWC Hdqrts with EPCC, CE may be EP.
RIO GRANDE IMMED UPSTREAM OF THE CONFL W ITH ANTHONY DRAIN WEST OF LA TUNA PRISON NEAR THE STATE LINE | Map
13276
2314
6
IB
IB
RT
4 4 8 8
In support of Paso del Norte Watershed Councils 319h grant and for stakeholder recreation concerns. Total Mercury removed FY16. 4x/yr field data only. USIBWC Hdqrts with EPCC, CE may be EP.
RIO GRANDE RIVER AT AMERICAN EAGLE BRICK FACTORY BRIDGE ABANDONED RR 0.1 MI DOW NSTREAM FROM SOUTHERN PACIFIC RR AT SMELTERTOW N | Map
15089 2314 6 IB IB RT 3 5 5
Metals in water removed FY16. 2x/yr bacteria and field data only. USIBWC Hdqrts with UTEP, CE may be UE
RIO GRANDE AT ANAPRA BRIDGE ON SUNLAND PARK DRIVE 4.2 KM UPSTREAM OF AMERICAN DAM IN NEW MEXICO | Map
17040 2314 6 IB IB RT 4 4 4
Total metals in water removed FY16. 2x/yr field only. USIBWC Hdqrts with EPCC, CE may be EP.

USIBWC El Paso Headquarter Amendment #_3_ Page 26 October 21, 2016 crp_qapp amendment 3
Figure 5: Map of the Upper Rio Grande Basin, Southern Half