quality assessment in higher education using the servqual model
TRANSCRIPT
39
QUALITY ASSESSMENT IN HIGHER EDUCATION USING THE SERVQUAL MODEL
Sabina Đonlagić* Samira Fazlić**
Received: 21. 1. 2015 Preliminary communication Accepted: 10. 6. 2015 UDC 378 (497.6)
Economy in Bosnia and Herzegovina is striving towards growth and increased employment and it has been proven by empirical studies worldwide that higher education contributes to socio-economic development of a country. Universities are important for generation, preservation and dissemination of knowledge in order to contribute to socio-economic benefits of a country. Higher education institutions are being pressured to improve value for their activities and providing quality higher education service to students should be taken seriously. In this paper we will address the emerging demand for quality in higher education. Higher education institutions should assess quality of their services and establish methods for improving quality. Activities of quality assurance should be integrated into the management process at higher education institutions. This paper is addressing the issue of service quality measurement in higher education institutions. The most frequently used model in this context is the SERVQUAL model. This model is measuring quality from the students' point of view, since students are considered to be one of the most important stakeholders for a higher education institution. The main objective of this research is to provide empirical evidence that the adapted SERVQAL model can be used in higher education and to identify the service quality gap based on its application at one institution of higher education (Faculty of Economics) in Bosnia and Herzegovina. Furthermore, results of the gap analysis using the SERVQUAL methodology provide relevant information in which areas improvement is necessary in order to enhance service quality.
* Sabina Đonlagić, PhD, Associate professor, University of Tuzla, Faculty of Economics,
Univerzitetska 8, 75000 Tuzla, Bosnia and Herzegovina, E-mail: [email protected] ** Samira Fazlić, PhD, Associate professor, University of Tuzla, Faculty of Economics,
Univerzitetska 8, 75000 Tuzla, Bosnia and Herzegovina, E-mail: [email protected]

Management, Vol. 20, 2015, 1, pp. 39-57 S. Đonlagić, S. Fazlić: Quality assessment in higher education using the SERVQUAL model
40
1. INTRODUCTION It is a proven fact that higher education plays an important role in
achieving economic development. In the current economic shift towards knowledge economies, the role of higher education is even more emphasized. Higher education has three vital functions in a knowledge economy: knowledge creation, knowledge diffusion and knowledge transfer. Basically, it is expected that higher education institutions provide skilled knowledge workers with all the necessary technical, managerial, professional and other skills. Higher education should enhance research activities and strengthen ties with the real sector in order to enhance innovation and competitiveness of enterprises. Third function of higher education institutions in a knowledge economy, i.e. transmission of knowledge, takes place primarily through teaching activities. Various studies have confirmed the relevance of higher education for economic development. This relevance is even more important in transition economies, such as Bosnia and Herzegovina. Higher education in this country is facing serious problems, and the most important one is related to the quality of higher education itself.
However, in order to explain the necessity for quality improvement in
higher education in Bosnia and Herzegovina, three dominant reasons which put the issue of quality in higher education into the focus of this research need to be explained:
1 Bologna declaration and its requirements regarding quality assurance in higher education.
2 Changed legal framework and requirements made by ministries, accreditation agencies, etc.
3 Increased competition among higher education institutions due to mushrooming of private higher education institutions.
4 Increasing number of students leaving Bosnia and Herzegovina to study abroad.
In this context, higher education institutions can only benefit from quality
higher education service as a competitive advantage. According to Bologna Stocktaking reports introduced by Bologna follow-up group in 20071 and Bologna process national reports from 2003 until 20122, quality assurance, especially internal quality assurance, has been identified as one of the key problems at higher education institutions in Bosnia and Herzegovina. In order to 1http://www.ond.vlaanderen.be/hogeronderwijs/bologna/documents/WGR2007/Stocktaking_repo
rt2007.pdf 2 http://www.ehea.info/article-details.aspx?ArticleId=86
Management, Vol. 20, 2015, 1, pp. 39-57 S. Đonlagić, S. Fazlić: Quality assessment in higher education using the SERVQUAL model
41
overcome this serious quality problem, higher education institutions need to develop and implement quality management systems and use tools for its improvement.
2. INTEGRATING QUALITY ASSURANCE AND STRATEGIC
MANAGEMENT AT HIGHER EDUCATION INSTITUTIONS Although strategic management and quality assurance in higher education
are disciplines which have been developing independently of each other, contemporary higher education institutions management approaches should integrate both of these approaches. The assessment of quality at higher education institutions is in the heart of the quality assurance system. Based on the results of this assessment, an improvement plan should be made. These plans are usually devised for longer periods of time since they include human resources, infrastructure improvement etc. and they can be considered strategic goals for higher education institutions.
The results of service quality assessment should be used as inputs in
planning and defining a strategy. Since quality improvement can include improvement in various areas such as human resource management, finance and budget, infrastructure, ICT infrastructure, administrative processes etc. a strategic plan is necessary in order to meet the goals. Quality assessment and quality management should become tools for strategic development of higher education institutions. According to Kettunen (2012), the quality assurance system supplements strategic management, because the purpose of quality assurance is to ensure that higher education institutions meet their strategic objectives. We would argue that vice versa results of quality assessment are used to define strategic objectives of higher education institutions. Quality evaluation is the basis for a quality policy and institutional strategy. Quality assessment and quality assurance at higher education institutions within a strategic context should incorporate means by which the university itself undertakes activities to implement changes and improvements.
For higher education institutions it is crucial to apply the stakeholder
approach to strategic management due to the variety of stakeholders which are important for internal and external evaluations, quality assurance, study program development, etc. This approach to strategic management is all about understaning demands of stakeholders and stakeholders relationships in order to achieve institutional development objectives.
Management, Vol. 20, 2015, 1, pp. 39-57 S. Đonlagić, S. Fazlić: Quality assessment in higher education using the SERVQUAL model
42
3. STUDENTS AS STAKEHOLDERS OF HIGHER EDUCATION INSTITUTIONS
Higher education institutions have been urged with the need to evaluate
their role in the society and identify their stakeholders. We believe that the success of a higher education institution is to some extent determined by its capability to identify its stakeholders and manage their demands and interests. Higher education institutions need to meet the demands and expectations of different stakeholders. For quality assurance to be achieved, managing relations with stakeholders is crucial because they are involved in internal and external evaluations of higher education institutions. The quality of services provided by higher education institutions must be continuously improved in order to keep up with the demands and interests of their stakeholders.
Various categories of stakeholders are involved in the higher education
system. However, for a higher education institution it is important to identify its key stakeholders and their needs, demands, interests. There are different approaches to identifying stakeholders for higher education institutions by different authors depending on the characteristics of the higher education system in a specific country. For example, according to Kasetwar (2008) key stakeholder categories of higher education institutions are: students, educationalists, parents, faculties, institutional management, industry, statutory bodies, trainers, education loan providers, researchers and academics, society, politicians, judiciary. In another research, conducted by Marić (2013), stakeholder categories and constitutive groups for higher education institutions are: government entities, administration, employees, clientele, suppliers, competitors, donors, communities, government regulators, non-government regulators, financial intermediaries, etc.
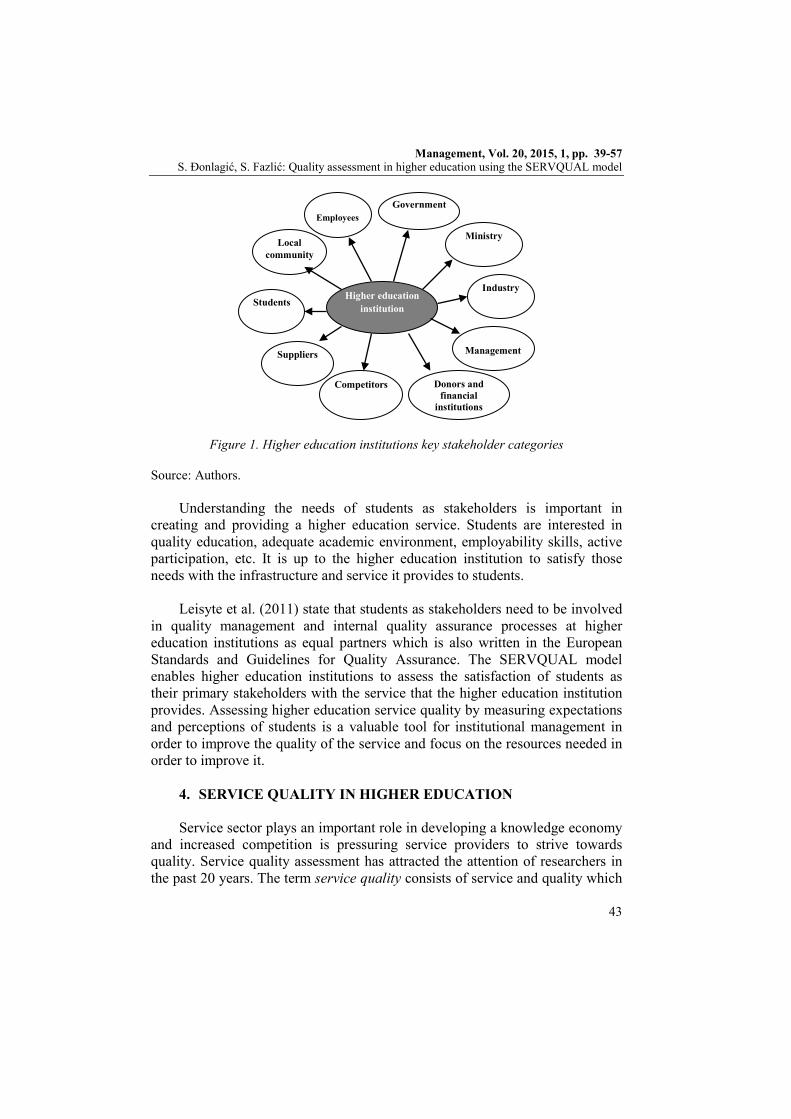
Based on the theoretical framework for stakeholder analysis, key
stakeholder categories for higher education institutions are proposed (Figure 1). For a higher education institution, students are an important category of stakeholders and they need to deliver value to this stakeholder category. The recognition of students as stakeholders was introduced in the literature in the mid-1970s (Douglas et al., 1993) and the importance of students as a stakeholder category has been growing and universities are expected to provide accountability, quality, effectiveness and efficiency (Jongbloed et al. 2008). Higher education institutions need to identify their needs and demands as students as stakeholders are seen as customers and customer satisfaction is related to service quality.
Management, Vol. 20, 2015, 1, pp. 39-57 S. Đonlagić, S. Fazlić: Quality assessment in higher education using the SERVQUAL model
43
Figure 1. Higher education institutions key stakeholder categories
Source: Authors. Understanding the needs of students as stakeholders is important in
creating and providing a higher education service. Students are interested in quality education, adequate academic environment, employability skills, active participation, etc. It is up to the higher education institution to satisfy those needs with the infrastructure and service it provides to students.
Leisyte et al. (2011) state that students as stakeholders need to be involved
in quality management and internal quality assurance processes at higher education institutions as equal partners which is also written in the European Standards and Guidelines for Quality Assurance. The SERVQUAL model enables higher education institutions to assess the satisfaction of students as their primary stakeholders with the service that the higher education institution provides. Assessing higher education service quality by measuring expectations and perceptions of students is a valuable tool for institutional management in order to improve the quality of the service and focus on the resources needed in order to improve it.
4. SERVICE QUALITY IN HIGHER EDUCATION Service sector plays an important role in developing a knowledge economy
and increased competition is pressuring service providers to strive towards quality. Service quality assessment has attracted the attention of researchers in the past 20 years. The term service quality consists of service and quality which
Higher education institution
Government Employees
Students
Ministry
Industry
Suppliers
Local community
Management
Competitors Donors and financial
institutions
Management, Vol. 20, 2015, 1, pp. 39-57 S. Đonlagić, S. Fazlić: Quality assessment in higher education using the SERVQUAL model
44
are both linked to the consumer. From a theoretical standpoint, there is no universal definition of quality - it may be defined as the conformance of requirement, being fit to use, or technical and functional aspects of quality can be distinguished. According to Parasuraman and Zeithaml (1985), quality is an elusive and indistinct construct. Whatever definition we consider it all comes down to the consumer of the service (e.g. his experience, his expectations) and the long-term goal of the service provider is to satisfy the consumer, strengthen relations with the service provider and achieve consumer loyalty.
As a universal definition of quality does not exist, there is a lack of a
universal model of measuring quality. Grönroos (1984) states that quality of service consists of three key dimensions: functional, technical and image and that the quality of service depends on two variables: the expected and perceived service. Functional quality of services is assessed by customers' attitudes. In order to overcome difficulties in assessing quality due to difficulty in explaining this term, Zeithaml and Parasuraman proposed a model based on a multiple-item scale for measuring service quality – the SERVQUAL model. They referred to this model as the gap model because the gap which is identified between customer expectations and customer perceptions needs to be closed in order to offer excellent quality.
Service Quality (Q) = Expectations (E) – Perceptions(P)
The SERVQUAL is founded on the view that customers' assessment of service quality is paramount. Major dimensions in the SERVQUAL model for determining the gap between customer expectations and perceptions are:
1. Tangibles (physical facilities, equipment, appearance of personnel, etc.) 2. Reliability (capability to provide the promised service accurately and
dependably) 3. Responsiveness (willingness to provide prompt service and help
customers) 4. Assurance (courtesy and knowledge of personnel and ability to convey
confidence and trust) 5. Empathy (attention provided to individual customer).
However, it must be pointed out that other authors investigated critical
factors of service quality and identified over 100 factors influencing the ability of an organization to manage service quality (Prasad, Jha, 2013: 25). Buttle (1996) argued that the five dimensions in this model are not universal because the numbers of dimensions which comprise service quality are contextualized. There has also been some debate over whether assessing service quality based

Management, Vol. 20, 2015, 1, pp. 39-57 S. Đonlagić, S. Fazlić: Quality assessment in higher education using the SERVQUAL model
45
on the difference between expectations and perceptions of customers is sufficient. Nevertheless, most authors agree that this model is particularly applicable in the higher education sector and can be used to measure university service quality.
Developing a model to assess service quality in higher education is a
complex issue due to the main problem which is identifying quality dimensions. Although there are different approaches to resolving this issue, the SERVQUAL model is the most commonly used for assessing quality of service in higher education. As will be presented, it has been used all around the world by researchers as a tool for measuring service quality in higher education.
Hill (1995) discussed aspects of the service quality in higher education and
conducted a research in Britain focusing on the role of students as primary consumers measuring their expectations and perceptions. Legcevic (2012) used this model in Croatian higher education sector to identify the gap between expectations and perceptions of educational services from the point of view of students using the SERVQUAL instrument. Based on this research it was concluded that the negative gap in service dimensions can be used as a guideline for planning and allocating resources in order to improve educational service quality. Higher education in developing countries has serious quality problems and De Oliviera and Fereira (2009) used SERVQUAL to identify the gap between expectations and perceptions of students and to adapt the SERVQUAL generic scale for the higher education sector in Brazil. Tan and Kek (2004) used this methodology to assess student satisfaction at the University in Singapore and concluded that some cultural factors need to be taken into consideration when developing the SERVQUAL questionnaire.
Zafiropoulos and Vrana (2008) assessed service quality in Greek higher
education using this model based on an adjusted questionnaire in the educational context and included students and staff in the research. The research showed that staff's results differentiated significantly from students' scores indicating a gap in the way how students and academic staff perceive quality of the education. Dado et al. (2011) conducted an empirical investigation into the construct of higher education service quality using the SERVQUAL scale in Serbia and concluded there was a significant gap between students' expectations and perceptions. According to Beaumont (2012), students are primary stakeholders for higher education institutions and therefore assessing service quality from their viewpoint is crucial for making improvements at higher education institutions.
Management, Vol. 20, 2015, 1, pp. 39-57 S. Đonlagić, S. Fazlić: Quality assessment in higher education using the SERVQUAL model
46
5. ASSESSING HIGHER EDUCATION SERVICE QUALITY USING SERVQUAL AT THE FACULTY OF ECONOMICS
5.1. Methodology The main aim of this research is to develop a tool based on the
SERVQUAL model for measuring quality in higher education and to explore whether it can be used to identify the gap between expectations and perceptions of the higher education service providing the basis for necessary improvements. For the purpose of this research the following research hypotheses were formed:
H1: Adapted SERVQUAL model can be used in higher education in order to
determine in which areas improvements are necessary and should be made by the institution, in order to increase the perceived quality of the education service provided to students.
H2: There is a negative gap between student expectations and perceptions of
service quality at the analyzed institution.
The research was conducted at one institution of higher education (Faculty of Economics) in Bosnia and Herzegovina. In order to conduct this research, the population, i.e. the total number of students at the Faculty of Economics and the sample were identified. The total number of students enrolled for the first time3 in all years of study on the first cycle of study according to the official data4 in 2014 was 725.
In social science research, a sample with a sampling rate over 5% is
considered to be a large enough sample. However, for this research a sampling rate of 10.06% was set and the total number of students in the sample was N=73 (10.06% of the population). The following was taken into consideration during sample design: the aim of the research, the size of the population, the confidence level, the level of data variability, the costs of the research, and time needed. The structure of the proportional stratified sample, according to the year of study, is presented in the following table.
3 For the purpose of this study only students who were enrolled for the first time in any year of study were considered to be more relevant and were included in the research because they were consuming this service for the first time at the specific year of study and were not biased based on their previous experiences and perceptions. 4 Self-evaluation report of the analyzed institution for the academic year of 2013/2014.
Management, Vol. 20, 2015, 1, pp. 39-57 S. Đonlagić, S. Fazlić: Quality assessment in higher education using the SERVQUAL model
47
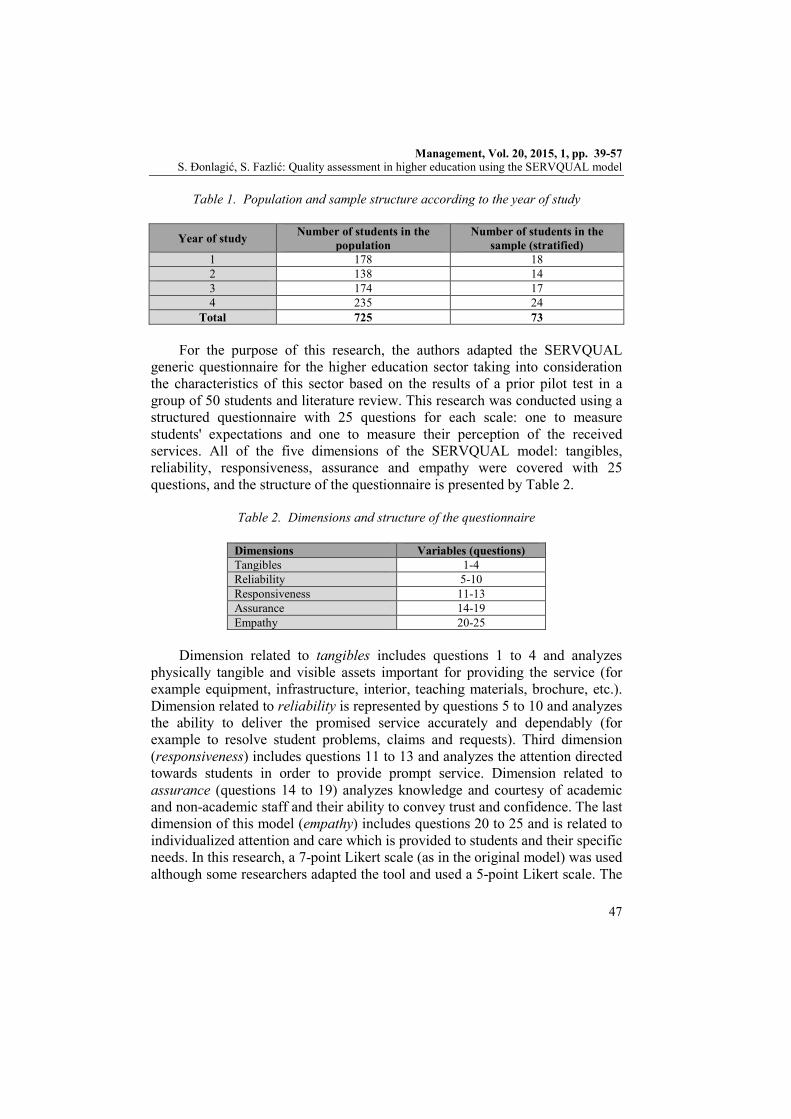
Table 1. Population and sample structure according to the year of study
Year of study Number of students in the population
Number of students in the sample (stratified)
1 178 18 2 138 14 3 174 17 4 235 24
Total 725 73
For the purpose of this research, the authors adapted the SERVQUAL generic questionnaire for the higher education sector taking into consideration the characteristics of this sector based on the results of a prior pilot test in a group of 50 students and literature review. This research was conducted using a structured questionnaire with 25 questions for each scale: one to measure students' expectations and one to measure their perception of the received services. All of the five dimensions of the SERVQUAL model: tangibles, reliability, responsiveness, assurance and empathy were covered with 25 questions, and the structure of the questionnaire is presented by Table 2.
Table 2. Dimensions and structure of the questionnaire
Dimensions Variables (questions) Tangibles 1-4 Reliability 5-10 Responsiveness 11-13 Assurance 14-19 Empathy 20-25
Dimension related to tangibles includes questions 1 to 4 and analyzes
physically tangible and visible assets important for providing the service (for example equipment, infrastructure, interior, teaching materials, brochure, etc.). Dimension related to reliability is represented by questions 5 to 10 and analyzes the ability to deliver the promised service accurately and dependably (for example to resolve student problems, claims and requests). Third dimension (responsiveness) includes questions 11 to 13 and analyzes the attention directed towards students in order to provide prompt service. Dimension related to assurance (questions 14 to 19) analyzes knowledge and courtesy of academic and non-academic staff and their ability to convey trust and confidence. The last dimension of this model (empathy) includes questions 20 to 25 and is related to individualized attention and care which is provided to students and their specific needs. In this research, a 7-point Likert scale (as in the original model) was used although some researchers adapted the tool and used a 5-point Likert scale. The
Management, Vol. 20, 2015, 1, pp. 39-57 S. Đonlagić, S. Fazlić: Quality assessment in higher education using the SERVQUAL model
48
scale was defined so that strongly agree is coded as 7 and strongly disagree as 1. After data collection, the data was analyzed using descriptive statistics before it was used in accordance with the SERVQUAL methodology to identify the gap between students’ expectations and perceptions.
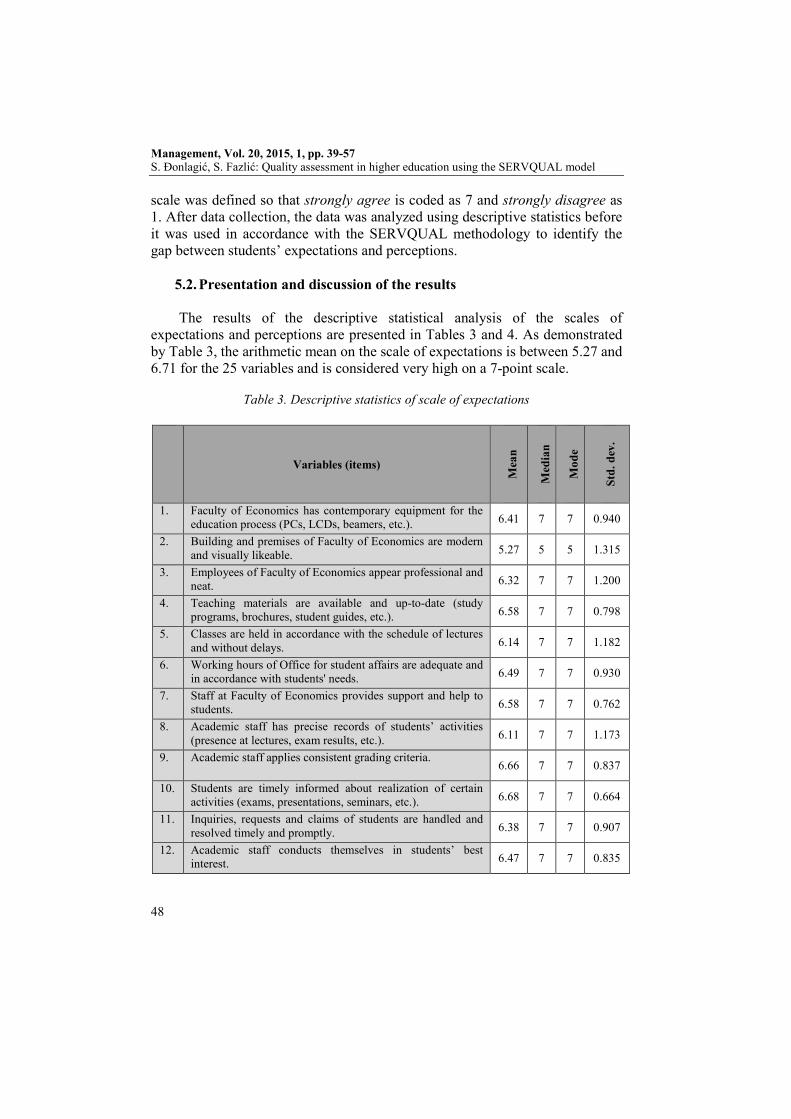
5.2. Presentation and discussion of the results The results of the descriptive statistical analysis of the scales of
expectations and perceptions are presented in Tables 3 and 4. As demonstrated by Table 3, the arithmetic mean on the scale of expectations is between 5.27 and 6.71 for the 25 variables and is considered very high on a 7-point scale.
Table 3. Descriptive statistics of scale of expectations
Variables (items)
Mea
n
Med
ian
Mod
e
Std.
dev
.
1. Faculty of Economics has contemporary equipment for the education process (PCs, LCDs, beamers, etc.). 6.41 7 7 0.940
2. Building and premises of Faculty of Economics are modern and visually likeable. 5.27 5 5 1.315
3. Employees of Faculty of Economics appear professional and neat. 6.32 7 7 1.200
4. Teaching materials are available and up-to-date (study programs, brochures, student guides, etc.). 6.58 7 7 0.798
5. Classes are held in accordance with the schedule of lectures and without delays. 6.14 7 7 1.182
6. Working hours of Office for student affairs are adequate and in accordance with students' needs. 6.49 7 7 0.930
7. Staff at Faculty of Economics provides support and help to students. 6.58 7 7 0.762
8. Academic staff has precise records of students’ activities (presence at lectures, exam results, etc.). 6.11 7 7 1.173
9. Academic staff applies consistent grading criteria. 6.66 7 7 0.837
10. Students are timely informed about realization of certain activities (exams, presentations, seminars, etc.). 6.68 7 7 0.664
11. Inquiries, requests and claims of students are handled and resolved timely and promptly. 6.38 7 7 0.907
12. Academic staff conducts themselves in students’ best interest. 6.47 7 7 0.835
Management, Vol. 20, 2015, 1, pp. 39-57 S. Đonlagić, S. Fazlić: Quality assessment in higher education using the SERVQUAL model
49
Variables (items)
Mea
n
Med
ian
Mod
e
Std.
dev
.
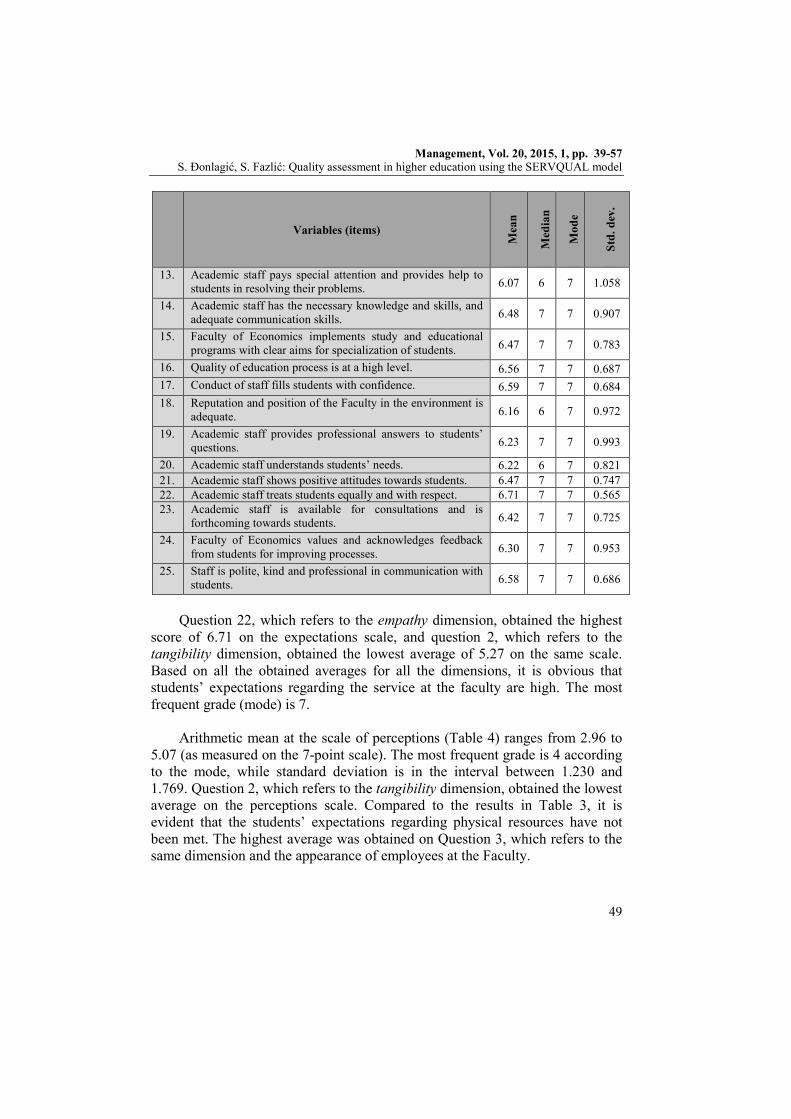
13. Academic staff pays special attention and provides help to students in resolving their problems. 6.07 6 7 1.058
14. Academic staff has the necessary knowledge and skills, and adequate communication skills. 6.48 7 7 0.907
15. Faculty of Economics implements study and educational programs with clear aims for specialization of students. 6.47 7 7 0.783
16. Quality of education process is at a high level. 6.56 7 7 0.687 17. Conduct of staff fills students with confidence. 6.59 7 7 0.684 18. Reputation and position of the Faculty in the environment is
adequate. 6.16 6 7 0.972
19. Academic staff provides professional answers to students’ questions. 6.23 7 7 0.993
20. Academic staff understands students’ needs. 6.22 6 7 0.821 21. Academic staff shows positive attitudes towards students. 6.47 7 7 0.747 22. Academic staff treats students equally and with respect. 6.71 7 7 0.565 23. Academic staff is available for consultations and is
forthcoming towards students. 6.42 7 7 0.725
24. Faculty of Economics values and acknowledges feedback from students for improving processes. 6.30 7 7 0.953
25. Staff is polite, kind and professional in communication with students. 6.58 7 7 0.686
Question 22, which refers to the empathy dimension, obtained the highest
score of 6.71 on the expectations scale, and question 2, which refers to the tangibility dimension, obtained the lowest average of 5.27 on the same scale. Based on all the obtained averages for all the dimensions, it is obvious that students’ expectations regarding the service at the faculty are high. The most frequent grade (mode) is 7.
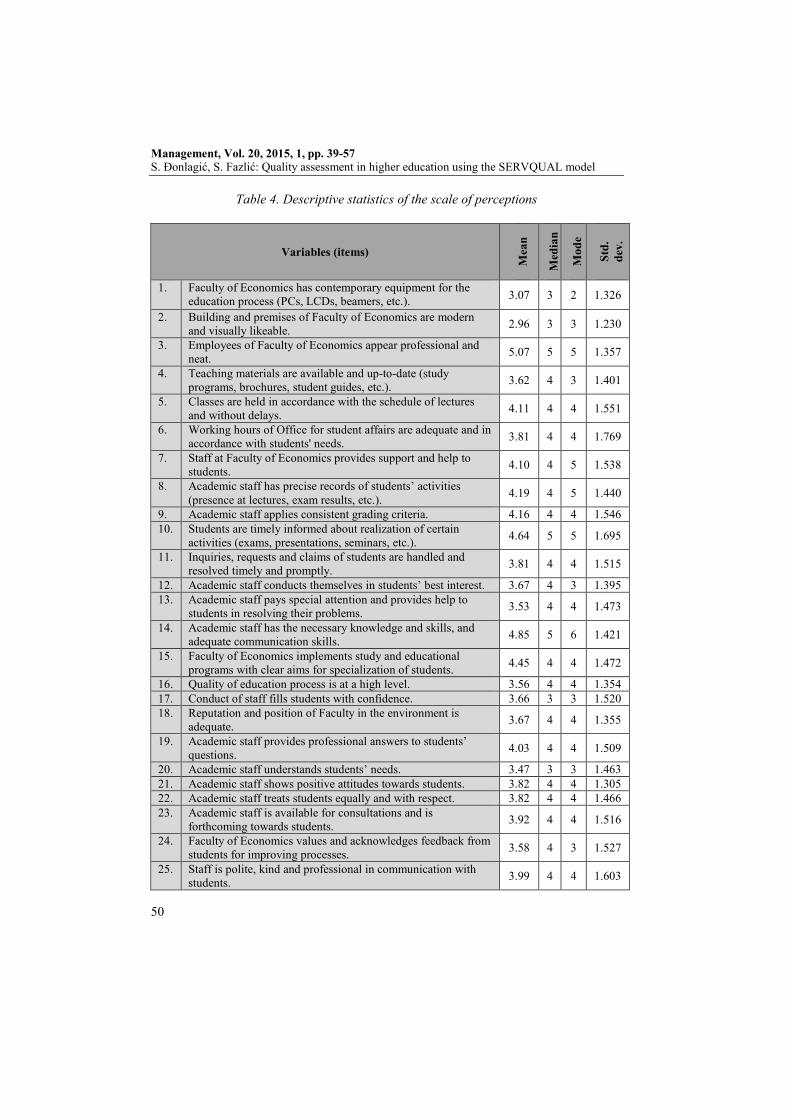
Arithmetic mean at the scale of perceptions (Table 4) ranges from 2.96 to
5.07 (as measured on the 7-point scale). The most frequent grade is 4 according to the mode, while standard deviation is in the interval between 1.230 and 1.769. Question 2, which refers to the tangibility dimension, obtained the lowest average on the perceptions scale. Compared to the results in Table 3, it is evident that the students’ expectations regarding physical resources have not been met. The highest average was obtained on Question 3, which refers to the same dimension and the appearance of employees at the Faculty.
Management, Vol. 20, 2015, 1, pp. 39-57 S. Đonlagić, S. Fazlić: Quality assessment in higher education using the SERVQUAL model
50
Table 4. Descriptive statistics of the scale of perceptions
Variables (items)
Mea
n
Med
ian
Mod
e
Std.
de
v.
1. Faculty of Economics has contemporary equipment for the education process (PCs, LCDs, beamers, etc.). 3.07 3 2 1.326
2. Building and premises of Faculty of Economics are modern and visually likeable. 2.96 3 3 1.230
3. Employees of Faculty of Economics appear professional and neat. 5.07 5 5 1.357
4. Teaching materials are available and up-to-date (study programs, brochures, student guides, etc.). 3.62 4 3 1.401
5. Classes are held in accordance with the schedule of lectures and without delays. 4.11 4 4 1.551
6. Working hours of Office for student affairs are adequate and in accordance with students' needs. 3.81 4 4 1.769
7. Staff at Faculty of Economics provides support and help to students. 4.10 4 5 1.538
8. Academic staff has precise records of students’ activities (presence at lectures, exam results, etc.). 4.19 4 5 1.440
9. Academic staff applies consistent grading criteria. 4.16 4 4 1.546 10. Students are timely informed about realization of certain
activities (exams, presentations, seminars, etc.). 4.64 5 5 1.695
11. Inquiries, requests and claims of students are handled and resolved timely and promptly. 3.81 4 4 1.515
12. Academic staff conducts themselves in students’ best interest. 3.67 4 3 1.395 13. Academic staff pays special attention and provides help to
students in resolving their problems. 3.53 4 4 1.473
14. Academic staff has the necessary knowledge and skills, and adequate communication skills. 4.85 5 6 1.421
15. Faculty of Economics implements study and educational programs with clear aims for specialization of students. 4.45 4 4 1.472
16. Quality of education process is at a high level. 3.56 4 4 1.354 17. Conduct of staff fills students with confidence. 3.66 3 3 1.520 18. Reputation and position of Faculty in the environment is
adequate. 3.67 4 4 1.355
19. Academic staff provides professional answers to students’ questions. 4.03 4 4 1.509
20. Academic staff understands students’ needs. 3.47 3 3 1.463 21. Academic staff shows positive attitudes towards students. 3.82 4 4 1.305 22. Academic staff treats students equally and with respect. 3.82 4 4 1.466 23. Academic staff is available for consultations and is
forthcoming towards students. 3.92 4 4 1.516
24. Faculty of Economics values and acknowledges feedback from students for improving processes. 3.58 4 3 1.527
25. Staff is polite, kind and professional in communication with students. 3.99 4 4 1.603
Management, Vol. 20, 2015, 1, pp. 39-57 S. Đonlagić, S. Fazlić: Quality assessment in higher education using the SERVQUAL model
51
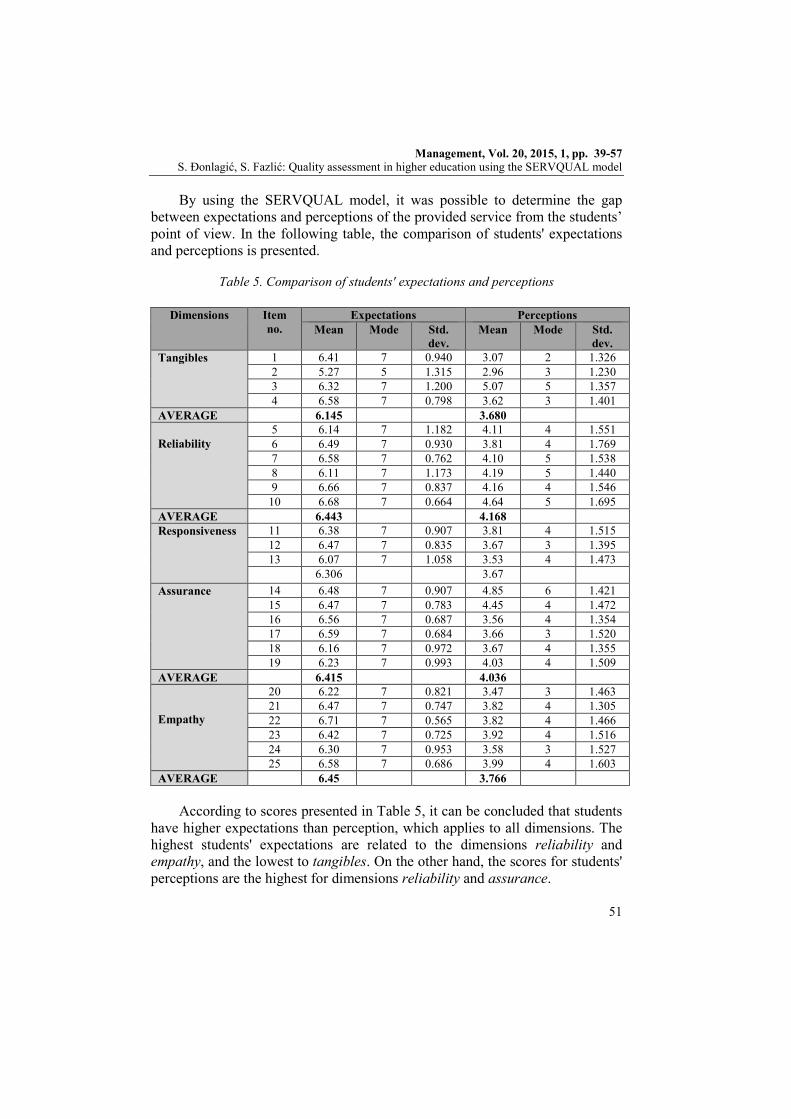
By using the SERVQUAL model, it was possible to determine the gap between expectations and perceptions of the provided service from the students’ point of view. In the following table, the comparison of students' expectations and perceptions is presented.
Table 5. Comparison of students' expectations and perceptions
Dimensions Item
no. Expectations Perceptions
Mean Mode Std. dev.
Mean Mode Std. dev.
Tangibles
1 6.41 7 0.940 3.07 2 1.326 2 5.27 5 1.315 2.96 3 1.230 3 6.32 7 1.200 5.07 5 1.357 4 6.58 7 0.798 3.62 3 1.401
AVERAGE 6.145 3.680 Reliability
5 6.14 7 1.182 4.11 4 1.551 6 6.49 7 0.930 3.81 4 1.769 7 6.58 7 0.762 4.10 5 1.538 8 6.11 7 1.173 4.19 5 1.440 9 6.66 7 0.837 4.16 4 1.546
10 6.68 7 0.664 4.64 5 1.695 AVERAGE 6.443 4.168 Responsiveness 11 6.38 7 0.907 3.81 4 1.515
12 6.47 7 0.835 3.67 3 1.395 13 6.07 7 1.058 3.53 4 1.473
6.306 3.67 Assurance 14 6.48 7 0.907 4.85 6 1.421
15 6.47 7 0.783 4.45 4 1.472 16 6.56 7 0.687 3.56 4 1.354 17 6.59 7 0.684 3.66 3 1.520 18 6.16 7 0.972 3.67 4 1.355 19 6.23 7 0.993 4.03 4 1.509
AVERAGE 6.415 4.036 Empathy
20 6.22 7 0.821 3.47 3 1.463 21 6.47 7 0.747 3.82 4 1.305 22 6.71 7 0.565 3.82 4 1.466 23 6.42 7 0.725 3.92 4 1.516 24 6.30 7 0.953 3.58 3 1.527 25 6.58 7 0.686 3.99 4 1.603
AVERAGE 6.45 3.766
According to scores presented in Table 5, it can be concluded that students have higher expectations than perception, which applies to all dimensions. The highest students' expectations are related to the dimensions reliability and empathy, and the lowest to tangibles. On the other hand, the scores for students' perceptions are the highest for dimensions reliability and assurance.
Management, Vol. 20, 2015, 1, pp. 39-57 S. Đonlagić, S. Fazlić: Quality assessment in higher education using the SERVQUAL model
52
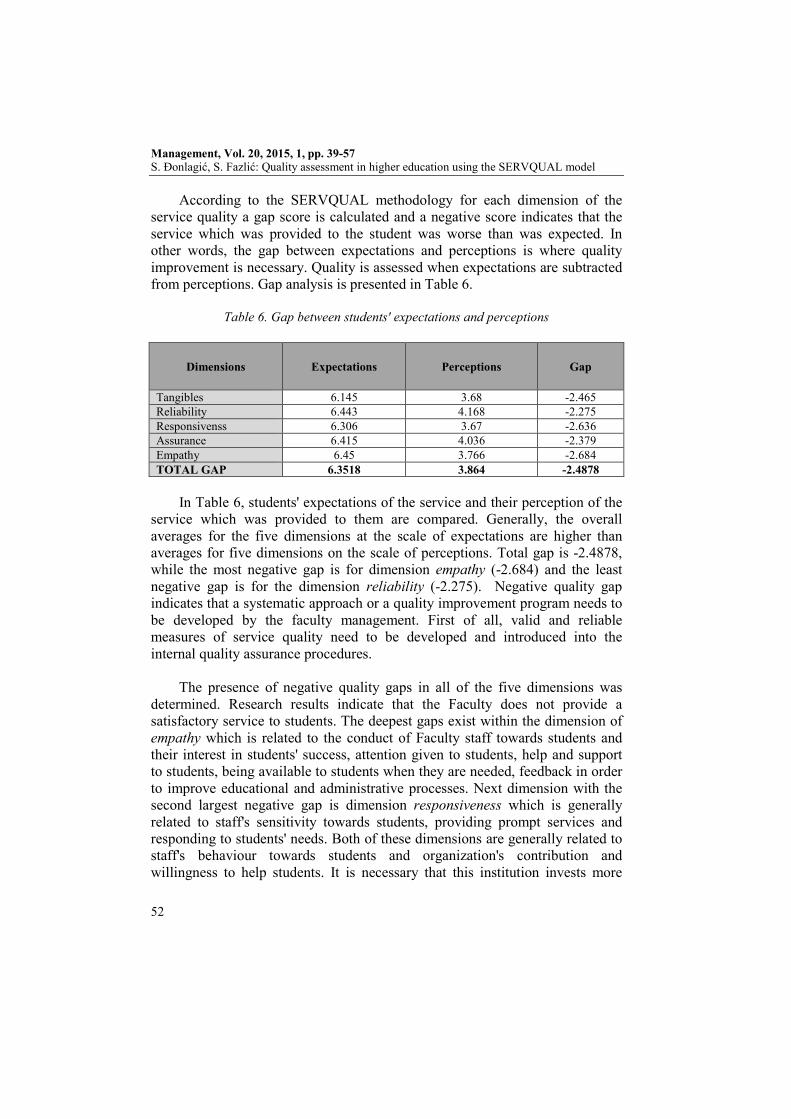
According to the SERVQUAL methodology for each dimension of the service quality a gap score is calculated and a negative score indicates that the service which was provided to the student was worse than was expected. In other words, the gap between expectations and perceptions is where quality improvement is necessary. Quality is assessed when expectations are subtracted from perceptions. Gap analysis is presented in Table 6.
Table 6. Gap between students' expectations and perceptions
Dimensions Expectations Perceptions Gap
Tangibles 6.145 3.68 -2.465 Reliability 6.443 4.168 -2.275 Responsivenss 6.306 3.67 -2.636 Assurance 6.415 4.036 -2.379 Empathy 6.45 3.766 -2.684 TOTAL GAP 6.3518 3.864 -2.4878
In Table 6, students' expectations of the service and their perception of the
service which was provided to them are compared. Generally, the overall averages for the five dimensions at the scale of expectations are higher than averages for five dimensions on the scale of perceptions. Total gap is -2.4878, while the most negative gap is for dimension empathy (-2.684) and the least negative gap is for the dimension reliability (-2.275). Negative quality gap indicates that a systematic approach or a quality improvement program needs to be developed by the faculty management. First of all, valid and reliable measures of service quality need to be developed and introduced into the internal quality assurance procedures.
The presence of negative quality gaps in all of the five dimensions was
determined. Research results indicate that the Faculty does not provide a satisfactory service to students. The deepest gaps exist within the dimension of empathy which is related to the conduct of Faculty staff towards students and their interest in students' success, attention given to students, help and support to students, being available to students when they are needed, feedback in order to improve educational and administrative processes. Next dimension with the second largest negative gap is dimension responsiveness which is generally related to staff's sensitivity towards students, providing prompt services and responding to students' needs. Both of these dimensions are generally related to staff's behaviour towards students and organization's contribution and willingness to help students. It is necessary that this institution invests more
Management, Vol. 20, 2015, 1, pp. 39-57 S. Đonlagić, S. Fazlić: Quality assessment in higher education using the SERVQUAL model
53
efforts in both academic and non-academic staff education and training. Dimension tangibles is also a dimension with a big negative gap which implies that modernization of infrastructure and utilization of information-communication technologies is necessary at this faculty. Dimensions reliability and assurance which are, generally speaking, related to the quality of the academic staff - their knowledge and competencies and the ability to perform reliable education service are dimensions with the lowest negative gap. This leads us to the conclusion that students perceive the quality of human resources at the faculty as the best, which is important for a higher education institution.
6. CONCLUSION The study fulfilled its objective presented in the paper. The quantitative
approach (based on a survey instrument) in this research was appropriate for the study. The adapted SERVQUAL model was used for assesing service quality in higher education and the existence of a negative gap between students' expectations and perceptions of the higher education service provided by the higher education institution was determined. In conclusion, based on the results of the research using the adapted SERVQUAL model it can be concluded that both research hypotheses are positively confirmed. The SERVQUAL model based on the adapted scales of the higher education sector can be used in assesing the quality in higher education institutions. Based on the research results a negative gap between students' expectations and perceptions of the service quality was identified.
However, there are some limitations to this research which need to be
pointed out. Based on an extensive literature review, it was stated that using a 5-point Likert scale, instead of the original 7-point scale might be appropriate for higher education institutions. Furthermore, due to diversity within the university, i.e. different faculties with different characteristics, the findings of this research cannot be generalized to the institution as a whole. Furthermore, we recommend that a qualitative analysis is conducted based on the research results in order to get a clearer insight into students' expectations and the service provided to them.
It should also be pointed out that retroactive inquiry of students'
expectations might impact the research results, therefore it is recommended that higher education institutions research students' expectations when they enroll in a study program or at the beginning of the academic year. What also needs to be taken into consideration is that students' expectations and perceptions might be influenced by the time they studied at a higher education institutions, their
Management, Vol. 20, 2015, 1, pp. 39-57 S. Đonlagić, S. Fazlić: Quality assessment in higher education using the SERVQUAL model
54
expectations for example might change after the first year of study compared to their expectations at the beginning of the study. Therefore, it is also recommended that service quality is measured within the institution for each generation of students in order to determine whether the length of time spent studying has an impact on their expectations and perceptions.
The importance of students as a stakeholder category of higher education
institutions as well the importance of integrating quality assurance and strategic management at the institution were also emphasised. We believe that higher education institutions can only benefit from service quality measurement. However, without implementing changes measuring quality is pointless. In this paper, we presented a negative quality gap that is present at all of the five dimensions of service quality. The smaller the gap the better the service quality. Based on empirical evidence, the gap cannot be considered small.
Improvement is necessary in all segments of the higher education service.
It is obvious that a systematic approach is needed to improve the quality of higher education service at this institution due to the necessity of improving all of the aspects of higher education service. Quality is one of the major goals of universities in order to attract students and improve institutional processes. Improving quality of the service at this higher education institution will need considerable investment in financial and human resources in order to meet students' expectations and achieve a long-term competitiveness on the higher education market. As pointed out, higher education institutions should strive towards strategic thinking and acting and effective quality operations. Based on the research results and the theoretical background of the research, it can be concluded that quality assessment at the Faculty is the first step towards development of an internal quality assurance system. However, the Faculty should develop a strategic plan focusing on making improvements in all of the areas where negative quality gap was detected. Generally speaking, the faculty management should strive towards an integrated management approach based on strategic management and quality assessment and assurance in order to manage the quality of its services and long-term development of the institution.
For the Faculty of Economics it is a great challenge to integrate quality
assurance and strategic management into an integrated management system. However, this is necessery in order to adequately cope with the dynamic environment and demands of students and other stakeholders. The quality assurance system at the level of the Faculty has not been implemented. Even though there are regular student surveys based on questionnaires, which do not cover all the aspects of higher education service, these results are not used as
Management, Vol. 20, 2015, 1, pp. 39-57 S. Đonlagić, S. Fazlić: Quality assessment in higher education using the SERVQUAL model
55
inputs for setting strategic objectives and developing strategic plans in order to insure improvement. Quality assessment and quality assurance are not integrated within strategic management process at the Faculty. When we talk about the maturity of the higher education institutions we think of its readiness to develop elements for strategic management and quality assurance in order to cope with internal and external changes. The evolution towards institutional maturity is determined by the level of importance given to strategic management and quality assurance activities. It is clear that strategic and quality culture at the Faculty are weak and that strategic management activities and quality assurance process should be improved. REFERENCES 1. Beaumont, D. J. (2012): Service quality in Higher Education: The students'
viewpoint. University of Manchester, Manchester Business School, Manchester, UK
2. Bogue, E. G., K. Bingham-Hall (2003): Quality and Accountability in Higher Education: improving policy, enhancing performance. Westport, USA: Praeger Publishers.
3. Buttle, F. (1996): SERVQUAL: review, critique, research agenda. European Journal of Marketing, 30 (1), pp. 8-32.
4. Çerri, S. (2012): Assessing the quality of higher education services using a modified SERVQUAL scale, Annales Universitatis Apulensis Series Oeconomica, 14 (2), pp. 664-679.
5. Chopra, R., Chawla, M., T. Sharma. (2014): Service Quality in Higher Education: A Comparative Study of Management and Education Institutions. NMIMS Management Review, Volume XXIV, April-May, pp.59-72.
6. Craft, A. (2005): Quality Assurance in Higher Education, Proceedings of an International Conference, 2nd edition, Taylor & Francis e-library
7. Dado, J., Petrovicova, J. T., Riznic, D., T. Rajic. (2011): An Empirical Investigation into the Construct of Higher Education Service Quality, International Review of Management and Marketing, 1 (3), pp. 30-42.
8. De Oliviera O. J., Fereira, E. C. (2009): Adaptation and application of the SERVQUAL scale in Higher Education. Available at: http://www. pomsmeetings.org/ConfPapers/011/011-0072.pdf, Accessed January 12, 2015.
9. Douglas J., McClelland, R., Davies J. (1993): The development of a conceptual model of student satisfaction with their experience in higher education. Quality Assurance in Education, 16 (1), pp. 19-35.
Management, Vol. 20, 2015, 1, pp. 39-57 S. Đonlagić, S. Fazlić: Quality assessment in higher education using the SERVQUAL model
56
10. Hill, F. M., (1995): Managing service quality in higher education: the role of the student as primary consumer. Quality Assurance in Education, 3 (3), 10-21.
11. Jongbloed, B., Enders, J., Salermo, C. (2008): Higher Education and its communities: Interconnections, interdependencies and a research agenda. Higher Education, 56, pp. 303-324.
12. Kanakana, M. G. (2014): Assessing Service Quality in Higher Education using the SERVQUAL tool, Proceedings of the 2014 International Conference on Industrial Engineering and Operations management, Indonesia
13. Kandiko, C. B., Mawer, M. (2003): Student expectations and perceptions of Higher education, A study of UK Higher Education, Commissioned by the Quality Assurance Agency, King's College London, London, UK
14. Kasetwar, R. B. (2008): Quality in Higher Education, University News, 46 (20), pp. 6-12
15. Kettunen, J. (2012): Integrated Higher Education Management: Summary of Management Approaches, Quality Assurance and Management, Prof. Mehmet Savsar (Ed), In Tech, available at: http://www.intechopen.com/books/quality-assurance-and-management/ integrated-higher-education-management-summary-of-management-approaches
16. Leisyte, L., Westerheijden, D. F., Epping, E., Faber, M., de Weert, E. (2011): Stakeholders and Quality Assurance in Higher Education, Center for Higher Education Policy Studies, Lausanne.
17. Marić, I. (2013): Stakeholder analysis of higher education institutions. Interdisciplinary Description of Complex Systems, 11 (2), pp. 217-226
18. Ozsoy, C. (2008): The Contribution of Higher Education to Economic Development, Conference Proceedings, 8th Global Conference on Business and Economics, Florence, Italy
19. Parasuraman, A., Zeithaml, V. A., Berry, L. L. (1985): A Conceptual Model of Service Quality and Its Implications for Future Research. Journal of Marketing, 49, pp. 41-50.
20. Parasuraman, A., Zeithaml, V. A., Berry, L. L. (1986): SERVQUAL: A Multiple-item Scale for Measuring Customer Perceptions of Service Quality, Marketing Science Institute, Cambridge.
21. Prasad, R. K, Kumar Jha M., (2013): Quality Measures in Higher Education: A Review and Conceptual Model. Quest Journals, Journal of Research in Business and Management, 1 (3), pp. 23-40.
22. Shauchenka, H., Buslowska, E. (2010): Methods and Tools for Higher Education Service Quality Assessment (Survey). Informatyka, 5, pp. 87-102
Management, Vol. 20, 2015, 1, pp. 39-57 S. Đonlagić, S. Fazlić: Quality assessment in higher education using the SERVQUAL model
57
23. Tan, K. C., Kek, S. W. (2004): Service quality in Higher education using and enhanced SERVQUAL approach. Quality in Higher education, 10 (1), pp. 17-24.
24. Yousapronpaiboon. K., (2014): SERVQUAL: Measuring higher education service quality in Thailand, 5th World Conference on Educational Sciences-WCES 2013, Procedia - Social and Behavioral Sciences, 116, pp. 1088-1095.
25. Zafiropoulos, C. & Vrana, V. (2008): Service Quality Assessment in a Greek Higher Education Institute. Journal of Business Economics and Management, 9 (1), pp. 33-45.
PROCJENA KVALITETE VISOKOG OBRAZOVANJA UZ POMOĆ MODELA SERVQUAL
Sažetak
Gospodarstvo Bosne i Hercegovine teži rastu i povećanju zaposlenosti, a empirijski je dokazano da visoko obrazovanje doprinosi socio-ekonomskom razvoju. Sveučilišta imaju veliki značaj za stvaranje, očuvanje i diseminaciju znanja, s ciljem povećanja socio-ekonomskih učinaka. Same su institucije visokog obrazovanja pod pritiskom za povećanje vrijednosti, koju stvaraju njihove aktivnosti, zbog čega bi se i kvaliteta obrazovne usluge, pružena studentima, trebala ozbiljno shvatiti. U ovom se radu raspravlja o mjerenju kvalitete usluga u institucijama visokog obrazovanja. Najčešće korišten model u tom kontekstu je SEVQUAL. On mjeri kvalitetu iz studentskog motrišta, s obzirom da se studenti smatraju jednim od najvažnijih dionika institucije visokog obrazovanja. Temeljni je cilj ovog istraživanja pružiti empirijske dokaze da se prilagođeni SERVQUAL model može koristiti u visokom obrazovanju, kao i utvrditi nedostatak u kvaliteti usluge, na temelju primjene modela na jednoj visokoškolskoj instituciji (Ekonomskom fakultetu) u Bosni i Hercegovini. Nadalje, na temelju prethodnih rezultata, identificiraju se relevantne informacije o potrebi unapređenja kvalitete usluge.
