quality and safety in population health
TRANSCRIPT

QUALITY and SAFETY In
Population Health
Mary Reich Cooper MD JD
Associate Professor
Program Director, Masters in Healthcare Quality and Safety
Jefferson College of Population Health
Chief Quality Officer, Connecticut Hospital Association
PHLS PopTalk Webinar

No Conflicts of Interest

Boy Who Died From Asthma or
Allergies at School Was Not Given
Epi, Had Expired Inhaler
A 10-year-old Ontario boy with asthma
and food allergies, who died after
collapsing in his school’s office, was
without proper asthma controller
medication and didn’t have epinephrine
administered quickly enough, even
though he was carrying an auto-injector,
the investigating coroner has revealed.
Apr 5 2016
Training in asthma awareness will be
offered to 500 school nurses across
the North West of England following
the deaths of three children from the
condition over the past 12 months.
Jan 17 2013
Child deaths spark
extra asthma training
for school nurses
Another Philadelphia student dies
at a public school with no nurse
05/22/14
In September, a 12-year-old fell ill at
her Philadelphia elementary school
and later died after suffering an
asthma attack. A nurse was assigned
to her school just twice a week. The
day that she died was not one of
those days.
Asthma Caused
UConn Student's Death
A former standout Killingly
High School running back was
found dead in his UConn dorm
room over the weekend. Aug
26 2013

Objectives
• Review the volume to value movement
• Discuss traditional models of quality improvement and
patient safety in population health
• Describe the translation of concepts, methods, and tools
from organizational improvement to population health
management
• Provide ideas for simple approaches to create results

When you are no longer changing one
person’s condition, or fixing one
organization’s opportunities for
improvement, what do you do?

Institute of Medicine Approach to Quality
Eff
ecti
ve
Tim
ely
Eff
icie
nt
Pati
en
t-C
en
tere
d
Eff
ecti
ve
Eq
uit
ab
le
SAFE
IOM 2001
Crossing the Quality Chasm

Medical error—the third leading cause of
death in the US. Makary et al
BMJ 2016;353:i2139

Safe Care in Population Health
• Infections
• Diagnostic Error
• Delayed Diagnosis
• Falls
• Medication Errors
• Age (un)friendly systems
• Access to care
• Disparities in care and outcomes

Moving from Volume to Value

A Map for the Past…and for the Future
10

Pay-for-performance (P4P) is a major
priority for the current Administrator of
the Centers for Medicare & Medicaid
Services (CMS) who believes Medicare
should seek opportunities to encourage
improvements in the quality of care
provided to Medicare beneficiaries.
Discussion Paper for the MMA §623e
Advisory Board Prepared by
CMS/ORDI/MDPG
May 24, 2005
Pay-for-Performance /
Quality Incentives

From Volume to Value
• Historical system pays for the episode of care
• Outcome of that care is secondary
• Presently we measure either the “steps” in the
system or the complications of care (process
metrics)
• True outcome is not what we measure
• Patients’ needs should define what we should
measure

National Health Expenditures• NHE grew 4.3% to $3.3 trillion in 2016, or $10,348 per person, and
accounted for 17.9% of Gross Domestic Product (GDP).
• Medicare spending grew 3.6% to $672.1 billion in 2016, or 20 percent of total NHE.
• Medicaid spending grew 3.9% to $565.5 billion in 2016, or 17 percent of total NHE.
• Private health insurance spending grew 5.1% to $1,123.4 billion in 2016, or 34 percent of total NHE.
• Out of pocket spending grew 3.9% to $352.5 billion in 2016, or 11 percent of total NHE.
• Hospital expenditures grew 4.7% to $1,082.5 billion in 2016, slower than the 5.7% growth in 2015.
• Physician and clinical services expenditures grew 5.4% to $664.9 billion in 2016, a slower growth than the 5.9% in 2015.
• Prescription drug spending increased 1.3% to $328.6 billion in 2016, slower than the 8.9% growth in 2015.
• The elderly were the smallest population group (14%) and accounted for approximately 34% of all spending in 2012
https://www.cms.gov/research-statistics-data-and-systems/statistics-trends-and-
reports/nationalhealthexpenddata/nhe-fact-sheet.html accessed 7.5.2018

National Health Expenditures Projected
• National health spending is projected to grow at an average
rate of 5.5 percent per year for 2017-26 and to reach $5.7
trillion by 2026
• 7.3% 1990 to 2007
• 4.2% 2008 to 2016
• Health spending is projected to grow 1.0 percentage point
faster than Gross Domestic Product (GDP) per year over the
2017-26 period; as a result, the health share of GDP is
expected to rise from 17.9 percent in 2016 to 19.7 percent
by 2026
• Growth in spending for Medicare (7.4 percent per year) and
Medicaid (5.8 percent per year) reflect the impact of an
aging population

https://www.cms.gov/Medicare/Quality-Initiatives-
Patient-Assessment-Instruments/Value-Based-
Programs/Value-Based-Programs.html

Bundled Payments for Care Improvement (BPCI)
Initiative
https://innovation.cms.gov/initiatives/bundled-payments/
accessed 9.5.2016https://innovation.cms.gov/initiatives/bundled-payments/ accessed
4.28.2018

Alternative Payment Models (APMs)
APMs give us new ways to pay health care providers for the
care they give Medicare beneficiaries. For example:
From 2019-2024, pay some participating health care
providers a lump-sum incentive payment.
Increased transparency of physician-focused payment
models.
Starting in 2026, offers some participating health care
providers higher annual payments.
Accountable Care Organizations (ACOs), Medicare Shared
Savings Programs, Patient Centered Medical Homes
and bundled payment models are some examples of APMs.

Risk or no risk?

https://www.aha.org/account
able-care-organizations-acos


ACO Performance

Why Does Population Health
Need
Healthcare Quality and Safety?

Primary Care: One Patient at a Time
Hospitals and Health Systems: Groups of
Patients
States and Regions: Large Groups of Patients
ACOs, Bundled Payments, APMs: Large Groups
of Patients with Financial Risk
How Do We Change Healthcare?
…But the Technique is the Same

Some of the tools have already been in
your armamentarium.


Community health needs assessment and
profiles

Geocoding and hotspotting

Benchmarking Data Sets
28

https://www.carevive.com/why-cancer-registries-matter-for-
survivorship-care-programs/
Registries

Donabedian Model
•Structure
•Process
•Outcomes

What is Healthcare Quality?
Healthcare Quality is defined as:
The level that healthcare systems, services
and supplies increase the likelihood for
positive health outcomes for patients, and
are consistent with current state of the art
knowledge and practices.

Population health has been
defined as the health outcomes
of a group of individuals,
including the distribution of
such outcomes within the group• Kindig D, Stoddart G. What is population health? American Journal of Public
Health 2003 Mar;93(3):380–3. Retrieved 2008-10-12

A Systems Approach to Health Care
Quality
Quality efforts should focus on health care systems and
the outcomes they produce
To evaluate the effectiveness of a health care delivery
system in achieving such outcomes, a strategic
improvement model should be used
Avedis Donabedian’s health care quality model
Provides a requisite framework using the following:
Structure
Process
Outcome
Improvement in structure leads to process
improvement which results in improved outcomes

IOM Health Outcome
Logic Model
Reflects the definition of
quality in population
(public) health

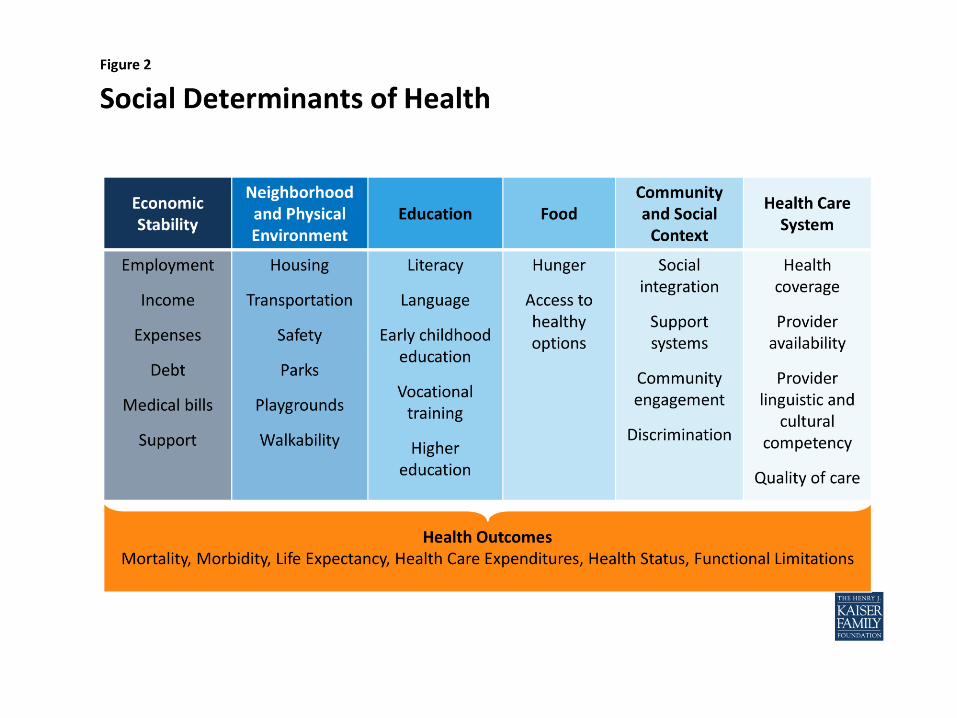
The social determinants of health are the
conditions in which people are born, grow,
live, work and age. These circumstances are
shaped by the distribution of money, power
and resources at global, national and local
levels. The social determinants of health are
mostly responsible for health inequities - the
unfair and avoidable differences in health
status seen within and between countries.
World Health Organization

Tarasuk et al. Canadian Medical Association Journal
2015. 67,033 patients surveyed in Ontario
Compared with total annual health care costs in food-secure households,
adjusted annual costs were 16% ($235) higher in households with marginal
food insecurity (95% confidence interval [CI] 10%-23% [$141-$334]), 32%
($455) higher in households with moderate food insecurity (95% CI 25%-39%
[$361-$553]) and 76% ($1092) higher in households with severe food
insecurity (95% CI 65%-88% [$934-$1260]). When costs of prescription drugs
covered by the Ontario Drug Benefit Program were included, the adjusted
annual costs were 23% higher in households with marginal food insecurity
(95% CI 16%-31%), 49% higher in those with moderate food insecurity (95% CI
41%-57%) and 121% higher in those with severe food insecurity (95% CI 107%-
136%).
Association between household food insecurity
and annual health care costs
https://www.ncbi.nlm.nih.gov/pub
med/26261199

Where Do The Data Come From?

Copyright: <a
href='http://www.123rf.com/profile_radiantskies'
>radiantskies / 123RF Stock Photo</a>
Electronic Medical Records: A Way to
Jack up Billings, Put Patients in
Control, or Both?JAMES FALLOWS
MAR 30, 2014
The Promised Land?

Claims-Based Data

Medicare Claims Public
Use Files
Medicare Provider
Analysis and Review
(MEDPAR) File
Long Term Care
Minimum Data
Set (MDS)

Health Of Populations Is The Product
Of The Intersecting Influences From
These Different Domains
Genetic and gestational endowments
Social circumstances
Environmental conditions
Behavioral choices
Medical care
The Case For More Active Policy Attention To Health
Promotion
J. Michael McGinnis, Pamela Williams-Russo and James
R. Knickman Health Affairs, 21, no.2 (2002):78-93
J.M. McGinnis, “United
States,” in Critical Issues in
Global Health, ed. C.E.
Koop(San Francisco: Jossey-
Bass, 2001), 80–90.

Example
Your area has a high incidence of asthma.
What are you going to design to improve
the health of asthma patients?
How will you pay for it?
How will you measure it?

Precontemplation
Contemplation
Preparation
Action
Maintenance
Termination
The Transtheoretical Model of Health Behavior Change
Prochaska and Velicer, Am J Health Promot September 1997vol. 12 no. 1 38-48

Population Health: Health outcomes and their distribution within a
population
Health determinants that influence distribution
Policies and interventions that impact these
determinants
We sometimes blur the distinction between strategies that help
people achieve/sustain good “health” and strategies we
implement to improve “healthcare” outcomes.
Implementing strategies to improve population health is a pivotal
issue in the transformation of healthcare, in large part because it
integrates patient outcomes, quality of care and payment models.
Developing the initiatives that promote the “systems” changes are
needed to eliminate variations in care related to cost, quality and
outcomes – so that specific populations can be cared for in a high-
quality, cost effective setting.

Mary Reich Cooper, MD, JDProgram Director, HQSMAssociate Professor
• Email: [email protected]
• Phone: 215.955.3888
Chief Quality Officer, CHA
• Email: [email protected]
• Phone: 203.294.7285
Questions?