qualitative research: design, data gathering, analysis ... working papers/qualitative researc… ·...
TRANSCRIPT

Qualitative Research Design | January 2017 www.researchdesignreview.com ©Margaret R. Roller
Qualitative Research: A Collection of Articles from Research Design Review Published in 2016
w w w . r o l l e r r e s e a r c h . c o m
r m r @ r o l l e r r e s e a r c h . c o m
J a n u a r y 2 0 1 7
Margaret R. Roller
Research Design Review – www.researchdesignreview.com– is a blog first
published in November 2009. RDR currently includes nearly 160 articles
concerning quantitative and qualitative research design issues. Many of
the articles published in 2016 were dedicated to qualitative research for
the simple reason that qualitative researchers are faced with myriad
issues when attempting to achieve quality outcomes, and yet there is
relatively little discussion about the quality standards by which to guide
their research. RDR attempts to fill this void by focusing on the unique
attributes of qualitative research and how they serve to define the
optimal approaches to conducting qualitative research that is credible,
analyzable, transparent, and useful. This paper presents the 17 RDR
articles that were published in 2016 devoted to qualitative research. Five
of these articles concern the Total Quality Framework – the subject of
Applied Qualitative Research Design: A Total Quality Framework
Approach (Roller & Lavrakas, 2015) – 5 articles pertain to qualitative data
and analysis, 4 articles relate to specific methods, 2 articles address
researcher bias, and 1 article talks about misplaced concepts adopted
from quantitative research (e.g., referring to research participants as
“respondents”).

Qualitative Research | January 2017 www.researchdesignreview.com ©Margaret R. Roller
Table of Contents
Articles pertaining to:
Total Quality Framework
Evaluating Quality Standards in a Qualitative Research Review 1
Reporting Qualitative Research: A Model of Transparency 3
Applying a Quality Framework to the In-depth Interview Method 5
Mode Differences in Focus Group Discussions 6
Applying a Quality Framework to the Focus Group Method 9
Qualitative Data & Analysis
Qualitative Data: Achieving Accuracy in the Absence of “Truth” 10
Chaos & Problem Solving in Qualitative Analysis 12
Words Versus Meanings 14
Pigeonholing Qualitative Data: Why Qualitative Responses Cannot be Quantified 17
Qualitative Analysis: The Biggest Obstacle to Enriching Survey Outcomes 19
Specific Methods – Ethnography
Facilitating Reflexivity in Observational Research: The Observation Guide & Grid 21
Reporting Ethnography: Storytelling & the Roles Participants Play 23
Specific Methods – Case-centered Research
Lighting a Path to Guide Case-centered Research Design: A Six-step Approach 24
Ethical Considerations in Case-centered Qualitative Research 26
Researcher Bias
Paying Attention to Bias in Qualitative Research: A Message to Marketing Researchers (& Clients) 28
Mitigating Researcher-as-instrument Effects 30
Misplaced Quantitative Concepts
Qualitative Research “Participants” Are Not “Respondents” (& Other Misplaced Concepts from
Quantitative Research) 32

1 Qualitative Research | January 2017 www.researchdesignreview.com ©Margaret R. Roller
Article pertaining to: Total Quality Framework
Evaluating Quality Standards in a Qualitative Research
Literature Review
A December 2015 article in Research Design Review discusses “A Quality Approach to the
Qualitative Research Proposal.” The article
outlines the eight sections of a “TQF proposal,”
i.e., a proposal whereby quality design issues –
specifically, related to the four components of the
Total Quality Framework – play a central role
throughout the writing of each proposal
section. This approach enables the researcher to
be mindful of the considerations that go into
developing, implementing, and reporting a
qualitative research study that is built on quality
standards. The TQF proposal can then live on
beyond the proposal phase to inform the
researcher as he/she goes about executing the proposed design.
The second section of the TQF proposal is called “Background and Literature Review” and is
devoted to giving the reader the context in which to situate the relevance of the proposed study as
well as details of the target population and past research efforts with the population segment and/or
research topic. When conducting a literature review for a TQF proposal, it is worthwhile for the
researcher to use a reference table or matrix that helps to evaluate each relevant study according to
the steps that were taken to maximize Credibility (e.g., representativeness of the sample, validity of
the data), Analyzability (i.e., completeness and accuracy of the data processing and verification),
Transparency (i.e., completeness and disclosure of the study details), and Usefulness (i.e., the
ability to do something of value with the outcomes).
This literature review evaluation table is predicated on the idea that not all qualitative research
studies are equally reliable and valid. In addition to keeping track of the relevant research
unearthed in his/her investigation, the literature review table allows the researcher to efficiently
evaluate the quality standards that were employed in these studies, along with their strengths and
limitations from a quality standpoint, and determine which studies to cite in the proposal.
Further, a revised table comprised of just those references actually cited in the proposal is a useful
addition to the proposal itself. This table provides proposal readers with a convenient way to view
cited references in conjunction with the researcher’s comments related to each study’s strengths and
limitations from a TQF perspective.
(continued)

2 Qualitative Research | January 2017 www.researchdesignreview.com ©Margaret R. Roller
An example of a partial Literature Review Reference Summary Evaluation Table for a proposed
study on physician-patient relations is shown below.
Image captured from: https://a2ua.com/quality.html

3 Qualitative Research | January 2017 www.researchdesignreview.com ©Margaret R. Roller
Article pertaining to: Total Quality Framework
Reporting Qualitative Research: A Model of Transparency
A number of articles in Research Design Review have discussed, in one form or another, the Total
Quality Framework (TQF)* approach to qualitative research design. An RDR post last month
pertained to applying the TQF to the in-depth interviewing method; while other articles have
focused on ways to integrate quality
measures – in harmony with the
TQF – into ethnography, mobile
research, and the research
proposal. Separate from
applications per se, an article in
February 2015 discussed the
compatibility of a quality approach
with social constructionism.
One of the four components of the
TQF is Transparency**
which is
specific to the reporting phase of the
research process. In particular,
Transparency has to do with the
researcher’s full disclosure of the research design, fieldwork, and analytical procedures in the final
document. This sounds simple enough yet it is common to read qualitative research reports, papers,
and articles that too quickly jump to research findings and discussion, with relatively scant attention
given to the peculiarities of the design, data gathering, or analysis. This is unfortunate and
misguided because these details are necessary for the user of the research to understand the context
by which interpretations were derived and to judge the applicability of the outcomes to other
situations (i.e., transferability).
There are, of course, exceptions; and, indeed, many researchers are skillful in divulging these all-
important details. One example is Deborah C. Bailey’s article, “Women and Wasta: The Use of
Focus Groups for Understanding Social Capital and Middle Eastern Women.” In it, Bailey provides
a rich background of her involvement with this study, her interest in exploring “how some Islamic
women from the United Arab Emirates (U.A.E.) perceive access and use of the social capital
identified as wasta” (p. 2) and the “bond of trust” she established with women attending Zayed
University which furthered her research objective. The method section goes beyond simply stating
that focus group discussions were conducted but rather gives the reader the researcher’s justification
for choosing focus groups over alternative methods, e.g., “focus groups work well for encouraging
participants to explore topics that have shared social meaning but are seldom discussed” (p. 3),
explaining wasta as a “social phenomenon” and the supportive function focus groups provide.
Bailey goes on to describe how she chose her research team and the reflective exercise she
conducted with the team prior to embarking on the study to “help them understand their own beliefs
(continued)

4 Qualitative Research | January 2017 www.researchdesignreview.com ©Margaret R. Roller
and experience about wasta” (p. 4). Bailey also gives an explanation of how participants were
chosen and the results of the recruiting process, as well as how she developed the discussion guide
and her decision to use translators (allowing participants the option to speak Arabic as well as
English). In the “Focus Group Process” section, Bailey recounts the introductory remarks that were
made at the start of each focus group and explicitly states the seven key questions participants were
asked during discussions.
The author’s reporting of the analysis process and results is equally informative. Here, Bailey
describes how the research team worked separately and together to derive categories and themes
from the data; and, importantly, the inclusion of a reflective assessment among analysts to mitigate
potential bias associated with personal beliefs during the analysis phase. In addition, Bailey
inserted a “Wasta Focus Group Matrix” in the Appendix which provides an informative breakdown
of categories and themes by the three wasta segments (i.e., high wasta, some wasta, and low
wasta). Following analysis, Bailey gives the reader a well-thought out, clear, and useful discussion
of results, enriched by numerous verbatims that support the findings.
Transparency in the reporting of qualitative research using thick description is critical to the
integrity of the research process. Transparency enables users of the research to evaluate the
outcomes within the proper context and determine the transferability of the research to other
compatible situations or environments.
*An in-depth discussion of the Total Quality Framework can be found in Applied Qualitative Research Design: A Total
Quality Framework Approach (Roller & Lavrakas, 2015. New York: Guilford Press.).
**The other three TQF components are: Credibility, Analyzability, and Usefulness. Transparency is discussed throughout
Research Design Review, e.g., see this December 2012 article.
Image captured from: http://thecontextofthings.com/2016/04/18/transparency-in-business/

5 Qualitative Research | January 2017 www.researchdesignreview.com ©Margaret R. Roller
Article pertaining to: Total Quality Framework
Applying a Quality Framework to the In-depth
Interview Method

6 Qualitative Research | January 2017 www.researchdesignreview.com ©Margaret R. Roller
Article pertaining to: Total Quality Framework
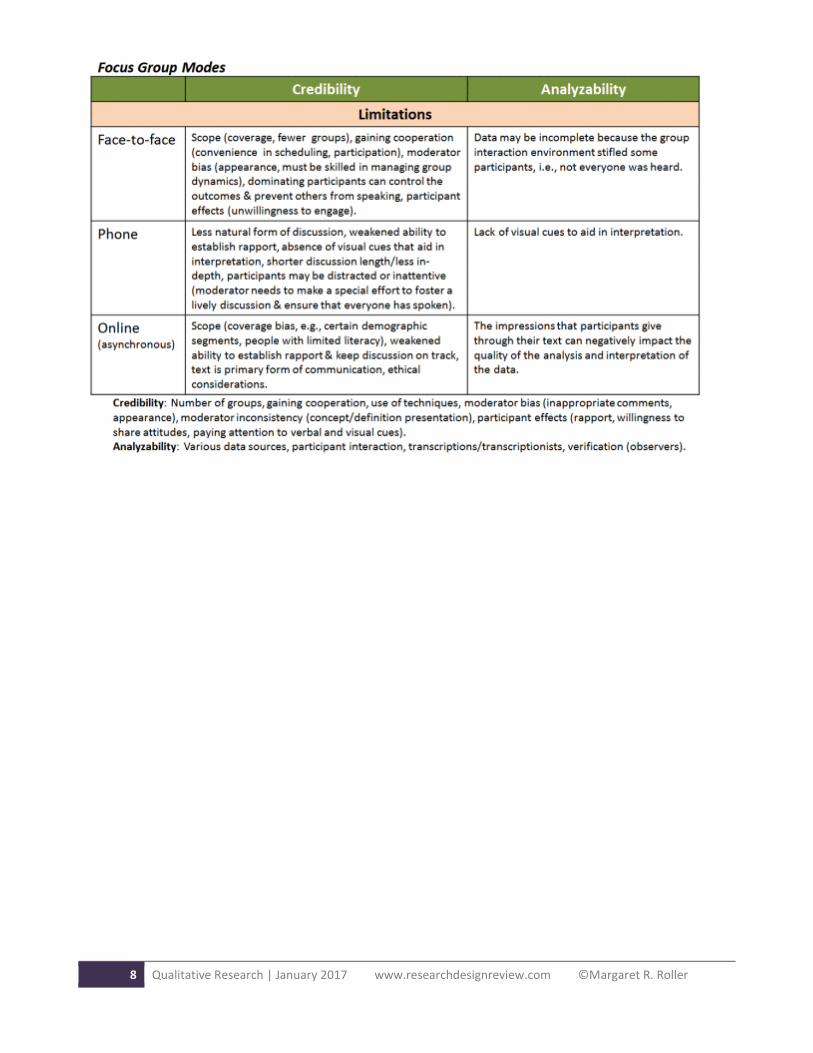
Mode Differences in Focus Group Discussions
There are four components to the Total Quality Framework in qualitative research design. The first
component, Credibility, has to do with data collection; specifically, the completeness and accuracy
of the data collected. There are two critical facets to Credibility – Scope (coverage and
representation) and Data Gathering (bias, nonresponse, and how well [or not] particular constructs
are measured).
The second component is Analyzability. This component is concerned with the completeness and
accuracy of the analyses and interpretations. The Analyzability component is concerned with
Processing (e.g., the use of transcriptions, coding) and Verification (e.g., by way of triangulation,
deviant cases, and/or a reflexive journal).
By looking at just these two components of the TQF, what judgements can we make as to the
strengths and limitations of the various modes we might choose from for any given method? For
example, three of the most common modes for focus group discussions are: face-to-face, phone, and
online (asynchronous). Each of these modes has implications related to data collection and
analysis. The tables (below) present a few of these considerations. With respect to “strengths,” for
(continued)

7 Qualitative Research | January 2017 www.researchdesignreview.com ©Margaret R. Roller
instance, the face-to-face mode has the advantage of facilitating rapport building as well as data
verification by way of observers. The phone mode, on the other hand, extends the coverage (which
can be particularly important in conducting research with hard-to-reach segments); while the
asynchronous online mode typically results in lengthy, detailed responses that are conveniently and
immediately available in transcription form.
There are also certain limitations of these modes related to data collection and analysis. Coverage,
for instance, can be a problem and fewer groups may be possible due to scant resources when
attempting to conduct face-to-face focus groups, and the absence of visual cues (when no photos or
video are used) hamper the analysis of phone and online discussions.
(continued)
8 Qualitative Research | January 2017 www.researchdesignreview.com ©Margaret R. Roller

9 Qualitative Research | January 2017 www.researchdesignreview.com ©Margaret R. Roller
Article pertaining to: Total Quality Framework
Applying a Quality Framework to the Focus Group Method

10 Qualitative Research | January 2017 www.researchdesignreview.com ©Margaret R. Roller
Article pertaining to: Qualitative Data & Analysis
Qualitative Data: Achieving Accuracy in the Absence
of “Truth”
One of the 10 unique attributes of qualitative research is the “absence of truth.” This refers to the
idea that the highly contextual and social constructionist nature of qualitative research renders data
that is, not absolute “truth” but, useful knowledge that is the matter of the researcher’s own
subjective interpretation. For
all these reasons –
contextuality, social
constructionism, and
subjectivity – qualitative
researchers continually
question their data, scrutinize
outliers (negative cases), and
implement other steps
towards verification.
Qualitative researchers also
conduct their research in
such a way as to maximize
the accuracy of the data.
Accuracy should not be confused with “truth.” Accuracy in the data refers to gaining information
that comes as close as possible to what the research participant is thinking or experiencing at any
moment in time. This information may be the product of any number of contextual (situational) and
co-constructed factors – i.e., the absence of “truth” – yet an accurate account of a participant’s
stance on a given issue or topic.
It is accuracy that qualitative researchers strive for when they craft their research designs to mitigate
bias and inconsistency. For example, focus group moderators are trained to give equal attention to
their group participants – allowing everyone an opportunity to communicate their thoughts – rather
than bias the data – i.e., leading to inaccurate information – by favoring more attention on some
participants than on others. A trained moderator is also skilled at listening for inconsistencies or
contradictions throughout a discussion in order to follow up on each participant’s comments, asking
for clarification, and ultimately coming away with an accurate “picture” of that participant in
relationship to the topic as communicated in that particular space and time.
This pursuit of accuracy is no less evident in the in-depth interview (IDI) method. By attending to
the potential for interviewer bias – from question wording, imposing personal beliefs or values into
the conversation, physical appearance in face-to-face IDIs – as well as the seemingly contradictory
(continued)

11 Qualitative Research | January 2017 www.researchdesignreview.com ©Margaret R. Roller
statements made by interviewees, the qualitative researcher is focused on securing an accurate
portrayal of how that participant thinks and behaves in association with the research objective. It is
not uncommon, for instance, for an IDI participant to state one thing at the beginning of an
interview but to make one or more outwardly conflicting statements later in the interview. Why is
that? Which statement is accurate? Do the statements really contradict each other? What more does
the interviewer need to learn about the interviewee? These are the questions the interviewer must
address throughout the IDI in the quest for accurate data.
Achieving accuracy in the data collection process is, like all aspects of qualitative research, a
nuanced and often difficult mission. It is, however, a mission worth pursuing because, unlike
absolute “truth,” it is an obtainable and necessary ingredient to deriving outcomes that enable
consumers of the research to actually do something meaningful with the findings.

12 Qualitative Research | January 2017 www.researchdesignreview.com ©Margaret R. Roller
Article pertaining to: Qualitative Data & Analysis
Chaos & Problem Solving in Qualitative Analysis
In Conceptual Blockbusting: A Guide to Better Ideas, James Adams offers readers a varied and
ingenious collection of approaches to overcoming the barriers to effective problem
solving. Specifically, Adams emphasizes the idea that to solve complex problems, it is necessary to
identify the barriers and then
learn to think differently. As
far as barriers, he discusses
four “blocks” that interfere
with conceptual thinking –
perceptual, emotional, cultural
and environmental, and
intellectual and expressive –
as well as ways to modify
thinking to overcome these
blocks – e.g., a questioning
attitude, looking for the core
problem, list-making, and
soliciting ideas from other
people.
Adams’ chapter on emotional blocks discusses ways that the thinking process builds barriers to
problem solving. One of these is the inability or unwillingness to think through “chaotic
situations.” Adams contends that a path to complex problem solving is bringing order to chaos yet
some people have “an excessive fondness for order in all things” leaving them with an “inability to
tolerate ambiguity.” In other words, they have “no appetite for chaos.” Adams puts it this way –
The solution of a complex problem is a messy process. Rigorous and logical techniques are often
necessary, but not sufficient. You must usually wallow in misleading and ill-fitting data, hazy and
difficult-to-test concepts, opinions, values, and other such untidy quantities. In a sense, problem-
solving is bringing order to chaos. (p. 48)
Problem solving is a “messy process” and no less so when carrying out an analysis of qualitative
data. There are several articles in Research Design Review that touch on the messiness of
qualitative analysis. In particular, “The Messy Inconvenience of Qualitative Analysis” underscores
the idea that
Unlike the structured borders we build into our quantitative designs that facilitate an orderly
analytical process, qualitative research is built on the belief that there are real people beyond
[these borders] and that rich learning comes from meaningful conversations. But the course of a
meaningful conversation is not a straight line. The course of conversation is not typically one
complete coherent stream of thought followed by an equally well-thought-out rejoinder.
(continued)

13 Qualitative Research | January 2017 www.researchdesignreview.com ©Margaret R. Roller
Put differently, qualitative analysts must endure a certain amount of chaos if they are to achieve
their goal of bringing some semblance of “order” (i.e., interpretation) to their in-depth interview,
focus group, ethnographic, narrative, or case study data. It is their ability to embrace the tangled
web of human thought and interaction that allows qualitative researchers to unravel the most
complex problem of all – how people think or do the things they do.
It may also be the reason why qualitative analysis remains such a mystery to quantitative-leaning
researchers and, indeed, the impediment that discourages these researchers from using qualitative
methods, either alone or in mixed-method designs. Qualitative analysis requires a conscious effort
to accept some chaos, to not rush the march to find order in the data, and to feel comfortable in the
notion that this process will lead to meaningful outcomes.
Although bringing some measure of order is a necessary ingredient to the analysis process, “the
ability to tolerate chaos,” as Adams states, “is a must.” In this respect, Adams talks about the
“limited problem-solver” as one who struggles with
The process of bringing widely disparate thoughts together [and who] cannot work too well
because [his] mind is not going to allow widely disparate thoughts to coexist long enough to
combine [them into a meaningful solution]. (p. 48)
Qualitative analysis is not unlike solving complex problems that demand problem-solvers who are
not limited by the need for order but rather embrace the more chaotic and rich world of humans’
lived experiences.
Image captured from: https://www.flickr.com/photos/22537886@N07/4734946701

14 Qualitative Research | January 2017 www.researchdesignreview.com ©Margaret R. Roller
Article pertaining to: Qualitative Data & Analysis
Words Versus Meanings
There is a significant hurdle that researchers face when considering
the addition of qualitative methods to their research designs. This
has to do with the analysis – making sense – of the qualitative
data. One could argue that there are certainly other hurdles that lie
ahead, such as those related to a quality approach to data collection,
but the greatest perceived obstacle seems to reside in how to
efficiently analyze qualitative outcomes. This means that researchers
working in large organizations that hope to conduct many qualitative
studies over the course of a year are looking for a relatively fast and
inexpensive analysis solution compared to the traditionally more
laborious thought-intensive efforts utilized by qualitative researchers.
Among these researchers, efficiency is defined in terms of speed and
cost. And for these reasons they gravitate to text analytic programs
and models powered by underlying algorithms. The core of
modeling solutions – such as word2vec and topic modeling – rests on
“training” text corpora to produce vectors or clusters of co-occurring
words or topics. There are any number of programs that support these types of analytics, including
those that incorporate data visualization functions that enable the researcher to see how words or
topics congregate (or not), producing images such as these
http://dilipad.history.ac.uk/2015/08/05/visualizing-
parliamentary-discourse-with-word2vec-and-gephi/
(continued)

15 Qualitative Research | January 2017 www.researchdesignreview.com ©Margaret R. Roller
https://smirnov.ca/canadian-ai-2014-recap-a8b6058e9de6#.pcne7qf0z
Words are important. Words are how we communicate and convey our thoughts. And the
relationships between words and within phrases can be useful indicators of the topics and ideas we
hope to communicate. Words, on the other hand, do not necessarily express meaning because it is
how we use the words we choose that often defines them. How we use our words provides the
context that shapes what the receiver hears and the perceptions others associate with our
words. Context pertains to apparent as well as unapparent influences that take the meaning of our
words beyond their proximity to other words, their use in recognized terms or phrases, or their
imputed relationship to words from Google News (word2vec).
For example, by the words alone and without a contextual reference, it would be difficult to
understand the meaning of the following comment made by a male focus group participant:
“A woman’s place is in the home.”
Was this participant making a comment on traditional values, or was he expressing intolerance on a
broader scale, or was he emphasizing the importance of home and home life?
Context is also provided by the manner in which the words are spoken. An educator participating in
an in-depth interview, for example, might state,
“I use technology in the classroom when I can!”
While another educator might state,
“I use technology in the classroom, when I can.”
The same words used in the same order but with different intended meanings.

16 Qualitative Research | January 2017 www.researchdesignreview.com ©Margaret R. Roller
So, those who want to incorporate qualitative methods into their research designs still face the
hurdle of finding a “quick” and “low cost” alternative to the painstaking work of qualitative
analysis. But awareness and the thoughtful consideration of the need to go beyond words – and find
actual meaning – will ultimately lead to more accurate and useful outcomes.
Image captured from: https://www.trustedtarot.com/cards/the-sun/

17 Qualitative Research | January 2017 www.researchdesignreview.com ©Margaret R. Roller
Article pertaining to: Qualitative Data & Analysis
Pigeonholing Qualitative Data: Why Qualitative Responses
Cannot Be Quantified
A recent webinar on the ins-and-outs of qualitative research stated that qualitative data could be
quantified by simply counting the codes associated with some aspect of the data content, such as the
number of times a particular brand name is mentioned or a specific sentiment is expressed towards a
topic of interest. The presenter asserted that, by
counting these codes, the researcher has in effect
“converted” qualitative to quantitative data.
This way of thinking is not unlike those who
contend that useful quantitative data can be
calculated with qualitative findings by counting the
number of “votes” for a particular concept or some
aspect of the research subject matter. Let’s say a
moderator asks group participants to rate a new
product idea on a modest four-point scale from
“like very much” to “do not like at all.” Or, an
interviewer conducting qualitative in-depth
interviews (IDIs) asks each of the 30 participants to
rate their agreement with statements pertaining to
the advantages of digital technology on a scale
from “strongly agree” to “strongly disagree.” It is the responses to these types of questions that
some researchers gather up as votes and report as quantitative evidence.
By asserting that codes and votes can be counted and hence transform a portion of qualitative
findings into quantitative data, these researchers are making the case, knowingly or not, that these
codes and votes are discrete items. But, of course, they are not.
Unlike the structured environment of survey research, qualitative data is the product of a host of
variables that influence outcomes in any number of ways. When a survey respondent picks a brand
name from a list or rates a concept on a given scale, he/she is responding to a specifically-worded
question that is: being asked of all respondents in exactly the same way, typically positioned in the
same or similar context in relationship to the other survey questions, and not preceded by
researcher-respondent conversations concerning the topic. Qualitative methods, on the other hand,
do not abide by these standards. By definition, qualitative research embraces flexible question-and-
answer environments where the researcher (interviewer, moderator) is never quite sure what byways
the discussion will take as it journeys to the final destination of the research objective. It is the
multi-faceted context of this environment that steers the course to some degree.
(continued)

18 Qualitative Research | January 2017 www.researchdesignreview.com ©Margaret R. Roller
As a result, there is no telling what influences impinge on a participant’s responses in an IDI or
focus group. Did the discussion leading up to the question familiarize the participant with
otherwise unknown information about the topic at hand? In what way did the
interviewer/moderator modify how questions were asked based on the participant’s responses to
earlier questions? How did the research environment – e.g., the highly talkative “dominator” in a
focus group discussion – alter a participant’s attitude or willingness to answer honestly?
In qualitative research, context is everything. By paying attention to context, qualitative researchers
are able to identify meaningful connections and draw useful – more profound – interpretations
about “what makes people tick” that go beyond survey data. But context also limits how qualitative
data can be used. Just as context precludes a qualitative researcher from generalizing qualitative
outcomes, so too context prevents the researcher from treating the data as discrete, independent
responses to be counted and thereby hoping to pigeonhole qualitative data as something it is not.
Image captured from: http://www.susan-ingram.com/2016/04/divorce-mediation-and-the-pigeonhole-effect/

19 Qualitative Research | January 2017 www.researchdesignreview.com ©Margaret R. Roller
Article pertaining to: Qualitative Data & Analysis
Qualitative Analysis: The Biggest Obstacle to Enriching
Survey Outcomes
Analysis is probably the biggest obstacle to the broader utilization of qualitative research
methods. Other aspects of qualitative research – such as data collection (which is discussed at
length throughout Research Design Review as
it relates to applying quality standards) – may
require a certain degree of resources and
deliberation but are not difficult to
achieve. Obtaining a representative list of
potential participants, for example, or honing
the necessary skills to mitigate interviewer
bias and gain cooperation from participants
demand concentrated efforts on the part of the
qualitative researcher but there are fairly
straightforward, well-documented procedures
to accomplish these goals.
Analysis, however, is difficult and it is the reason why many survey researchers are loath to
incorporate a qualitative component – open-ended questions in a survey questionnaire or a full-
blown qualitative project – in their overall study designs. The idea that analysis presents a
significant hurdle to potential users of qualitative research is revealed in comments made in a group
discussion I conducted on schizophrenia with psychologists concerning their research with
caregivers. When asked why qualitative methods were so rarely (or never) conducted in
conjunction with their survey research, these psychologists told me
“Open-ended questions are okay if there is someone with qualitative data analytic experience to
analyze these data.”
“Open-ended questions provide interesting clinical data but there are real challenges in how best
to code these qualitative data.”
Similarly, a researcher friend who explicitly advises against using open-ended questions in survey
questionnaires, defends this bias asserting that
“[Survey researchers] don’t usually have the time, resources, or patience to actually analyze the
qualitative data [and] you have to have a sophisticated researcher who understands that the
conclusions drawn from qualitative data must be made carefully.”
These comments point to the fundamental obstacle hampering the wider use and acceptance of
qualitative research among survey researchers – that is, qualitative data are typically complex,
(continued)

20 Qualitative Research | January 2017 www.researchdesignreview.com ©Margaret R. Roller
multifaceted, and not easily herded into neat meaningful silos. This makes qualitative analysis
extremely “messy.” A November 2010 RDR article, “The Messy Inconvenience of
Qualitative Analysis,” discusses this messiness, stating in part
“Unlike the structured borders we build into our quantitative designs that facilitate an orderly
analytical process, qualitative research is built on the believe that there are real people beyond
those quantitative borders and that rich learning comes from meaningful conversations…The
course of conversation is not typically one complete coherent stream of thought followed by an
equally well-thought-out rejoinder. These conversations are not rehearsed to ensure consistent,
logical feedback to our research questions; but instead are spontaneous discussions where both
interviewee and interviewer are thinking out loud, continually modifying points of view or ideas as
human beings do.”
By going “beyond those quantitative borders,” qualitative data add significant understanding of how
people think, their motivations, and their lived experiences that help explain certain behavior or
attitudes on a particular issue. Yet, it is these same objectives that produce complex, rich qualitative
data that complicates the analysis process and steers survey researchers away from qualitative
research. Qualitative analysis serves as an unfortunate roadblock to enriching survey outcomes by
way of even the most modest gesture to qualitative, e.g., an open-ended question in a survey
interview.
That is the problem but what is the solution. Like qualitative data, there is no simple
solution. There are, however, ways our research designs could be made more inclusive. To name
the most obvious, survey researchers could
Begin a dialog with qualitative researchers – those working within the organization or outside consultants – by which everyone shares their knowledge and expertise, and gains an understanding of how survey and qualitative researchers can work together in the data collection as well as analysis and reporting phases of a study.
From this dialog, form a quantitative-qualitative collaboration. Create quant-qual teams whereby certain qualitative researchers work with particular survey researchers in a specific category or topic area. The qualitative team members are responsible for designing the appropriate integration of qualitative in the overall study framework, overseeing data collection, conducting the qualitative data analysis, and working with the quantitative researchers in the interpretation and reporting phases.
Explore the possibility of using online quant-qual solutions – such as iModerate (utilizing their ThoughtPath approach), Knowledge Networks (via Quale Probe) – which may facilitate adding qualitative to a survey study, including an efficient option for analysis.
Become familiar with CAQDAS – computer-assisted qualitative data analysis software – and what the various software providers offer in the way of features that can “simplify” the analysis of qualitative data. To be clear, there is no simple solution to the analysis of qualitative data – the analysis requires a great deal of human time and brain power to absorb the material and consider contextual factors – however, CAQDAS does offer the researcher useful supporting functions, e.g., organizing the data and visualizing relationships.
Qualitative data analysis will never be “easy” but there are ways to make it less of an obstacle to
survey research and ultimately produce more insightful outcomes.
Image captured from: http://www.business2community.com/content-marketing/5-common-content-marketing-obstacles-
01348800

21 Qualitative Research | January 2017 www.researchdesignreview.com ©Margaret R. Roller
Article pertaining to: Specific methods – Ethnography
Facilitating Reflexivity in Observational Research: The
Observation Guide & Grid
Observational research is “successful” to the extent that it satisfies the research objectives by
capturing relevant events and participants along with the constructs of interest. Fortunately, there
are two tools – the observation guide and the observation grid – that serve to keep the observer on
track towards these objectives and generally facilitate the ethnographic data gathering process.
Not unlike the outlines interviewers and moderators use to help steer the course of their in-depth
interviews and group discussions, the observation guide serves two important purposes: 1) It
reminds the observer of the key points of observation as well as the topics of interest associated
with each, and 2) It acts as the impetus for a reflexive exercise in which the observer can reflect on
his/her own relationship and contribution to the observed at any moment in time (e.g., how the
observer was affected by the observations). An observation guide is an important tool regardless of
the observer’s role. For each of the five observer roles* – nonparticipant (off-site or on-site) and
participant (passive, participant-observer, or complete) observation – the observation guide helps to
maintain the observer’s focus while also giving the observer leeway to reflect on the particular
context associated with each site.
As an adjunct to the observation guide, it is recommended that ethnographic researchers also utilize
an observation grid. The grid is similar to the guide in that it helps remind the observer of the
(continued)

22 Qualitative Research | January 2017 www.researchdesignreview.com ©Margaret R. Roller
events and issues of most import; however, unlike the guide, the observation grid is a spreadsheet or
log of sorts that enables the observer to actually record (and record his/her own reflections of)
observable events in relationship to the constructs of interest. The grid might show, for instance,
the relevant constructs or research issues as column headings and the specific foci of observation as
rows. In an observational study of train travel, for example, the three key research issues related to
activity at the train station might be: waiting for departures, delays in departures, and boarding; and
the key areas of observation would pertain to behavior, conversations heard, and contextual
information such as the weather and the general mood. Like the guide, the observation grid not
only ensures that the principal issues and components are captured but also encourages the observer
to reflect on each aspect of his/her observations and identify the particular ways the observer is
influencing (or is being influenced by) the recorded observations.
*Roller & Lavrakas, 2015. Applied Qualitative Research Design: A Total Quality Framework
Approach. New York: Guilford Press.
23 Qualitative Research | January 2017 www.researchdesignreview.com ©Margaret R. Roller
Article pertaining to: Specific methods – Ethnography
Reporting Ethnography: Storytelling & the Roles
Participants Play
In Chapter 10 of Sam Ladner’s book Practical Ethnography: A Guide to Doing Ethnography in the
Private Sector, the author discusses a best practice approach to reporting ethnographic research for
a corporate audience. She states that “private-sector ethnographic reports are successful if they are
dramatic and consistent with
the organization’s truth
regime” (p.165). To this end,
Ladner recommends text
reports with “clickable
hyperlinks” throughout and
supplemental material, such
as a PowerPoint presentation,
that acts as the “marketing
campaign” or “movie trailer”
for the text document.
As another “delightful
element” to the ethnography
report, Ladner suggests the
use of personas or archetypes,
each representing a depiction of participants that share a particular characteristic. This is “a useful
way to summarize the voluminous amount of qualitative data” (p. 167); however, Ladner cautions
that personas “are often done badly” and points to Steve Portigal’s article on the subject matter,
“Persona Non Grata.” In it, Portigal advocates for maintaining the “realness” of research
participants rather than manufacturing a “falsehood” (by way of personas) that distances the users
of the research from the people they want to know most about. Portigal encourages researchers to
engage with the “messiness of actual human beings,” emphasizing that “people are too wonderfully
complicated to be reduced to plastic toys [that is, personas].”
Reporting observational research for corporate users can be a challenge. On the one hand, the
researcher is obligated to dig into the messiness of analysis and convey an honest accounting of
what the researcher saw and heard. On the other hand, the final reporting is meaningless if no one
pays attention to it, thereby preventing the research from having the desired effect of bringing new
energy and a new way of thinking to the organization. Ladner and Portigal agree that powerful
storytelling grounded in reality is the best approach, but how do we create a compelling drama
while maintaining the integrity of our data? A combination of formats, as Ladner suggests, is one
tactic. And the use of personas may be another. An open and ongoing discussion among
researchers about personas – if and how the roles we assign the actors in our final story are (or can
be) created while staying true to the study participants – seems like a worthwhile effort.
Image captured from: https://www.thestage.co.uk/features/2015/386081/

24 Qualitative Research | January 2017 www.researchdesignreview.com ©Margaret R. Roller
Article pertaining to: Specific methods – Case-centered Research
Lighting a Path to Guide Case-centered Research Design: A
Six-step Approach
Elliot Mishler coined the term “case-centered research” to refer to the research approach that
preserves the “unity and
coherence” of research
participants through the data
collection and analysis process.
Fundamental to case-centered
research is its focus on complex
social units (or “cases”) in their
entirety as well as the emphasis
on maintaining the cohesiveness
of the social unit(s) throughout
the research process. As
discussed in Research Design
Review back in 2013, two
important examples of case-
centered approaches are case study research and narrative research.
The complexity and need for cohesion in case-centered research present unique design challenges.
Indeed, quality outcomes from case study and narrative research are the result of a well-defined
process that guides the researcher from the initial conceptualization phase to data collecting in the
field. Although the specifics within the process will vary from study to study, there exists an
optimal design flow when implementing the case-centered research approach.
The appropriate path in case-centered designs, leading to data collection, involves the following six
basic phases or steps*:
1. Establishing priorities. By establishing research priorities, the researchers contribute greatly to
the ultimate “success” of the overall process as well as the final outcomes. The research team
should identify priorities by addressing a series of questions such as, Are we only interested in a
specific case or in using the case to say something more broadly about a larger population of cases?
What is the role of theory development and the need for replication in conjunction with the research
objective?
2. Determining the need for and conducting a literature review. A review of the literature can
serve a very important function when the research focus is beyond the case itself, i.e., the goal is to
extend, confirm, or deny existing theory or hypotheses. In this instance, a literature review helps
(continued)

25 Qualitative Research | January 2017 www.researchdesignreview.com ©Margaret R. Roller
form the theoretical framework that will steer design and implementation of the research, e.g.,
helping to identify the specific factors or variables that are closely associated with the research
issue.
3. Selecting a single case or multiple cases. The research team may opt for a single case study, for
example, when the focus of interest is on an isolated issue or entity, e.g., the physician-patient
interaction at one city hospital or the lived experience of a victim of domestic violence. A multiple
case approach, on the other hand, is appropriate when the objective of the research is to extend a
theory or say something about the broader population segment, e.g., life stories from gifted students
to understand the factors that contribute to their and similar students’ drive to succeed.
4. Determining the unit(s) and variable(s) of analysis. There are two levels of specificity that
researchers need to consider related to the data collection process: (1) the unit(s) of analysis
represents the primary aspect of a case that will be the focus of investigation (e.g., gifted students’
life stories) and (2) the variable(s) of analysis are subcategories within the units of analysis that
guide researchers in their examination of the units (e.g., signs of creativity before and after the first
grade in school).
5. Identifying the appropriate methods. Case-centered research utilizes multiple qualitative
methods. Case study research frequently involves on-site observation (i.e., ethnography) and in-
depth interviews (IDIs), while narrative research leans heavily on the unstructured IDI. Both,
however, also incorporate other methods and data sources such as document reviews, imagery
artifacts (e.g., students’ completed exams), and video diaries.
6. Preparing for the field. There are a number of considerations that need to be addressed to
prepare for data collection in the field. These include: developing the appropriate tools (e.g., IDI
guide, observation grid); determining the role of each research team member; determining what, if
any, problems exist in gaining access to the participants; obtaining informed consent; and initiating
preliminary interaction with participants to begin building rapport.
* Adapted from Applied Qualitative Research Design: A Total Quality Framework Approach (Roller & Lavrakas, 2015. New
York: Guilford Press)
Image captured from: https://afremov.com/THE-PATH-TO-VICTORY-PALETTE-KNIFE-Oil-Painting-On-Canvas-By-
Leonid-Afremov-Size-36-X20.html

26 Qualitative Research | January 2017 www.researchdesignreview.com ©Margaret R. Roller
Article pertaining to: Specific methods – Case-centered Research
Ethical Considerations in Case-centered
Qualitative Research
Case-centered qualitative research is discussed elsewhere in this blog (in particular, see “Multi-
method & Case-centered Research: When the Whole is Greater Than the Sum of its Parts”). It is
generally defined as multiple-method research that focuses
on complex social units or entities (or “cases”) in their
entirety, while maintaining the cohesiveness of the entity
throughout the research process rather than reducing the
outcomes to categorical data. Two examples of case-
centered research are: case studies – e.g., an examination of
a city social program – and narrative research – e.g., a study
of chronic illness among sufferers.
Ethical considerations are important in every research
method involving human subjects but they take on added
significance in case-centered research where researchers
often work closely with research participants over a period
of time and frequently in the face-to-face mode (where
researcher-participant relationships play an important role
in the research outcomes). Both case study and narrative research gather a great deal of highly
detailed information on each case, e.g., a case study may collect a detailed account of a particular
social program; or a narrative inquiry may result in long, very personal stories associated with a
chronic illness. In these types of studies, the possibility of inadvertently exposing participants’
identities (without their permission) runs high unless preventive measures are taken.
This is why the use of informed and voluntary consent as well as approval from institutional review
boards (when required) is critical in case-centered research. Consent involves disclosing the
various aspects of the research, emphasizing the voluntary component, promising to keep
participants safe, and paying particular attention to vulnerable population segments (e.g.,
children). Yet these efforts need to go further. Case-centered researchers must also effectively
communicate the confidential nature of the research and take extra precautions to ensure
participants’ right to privacy – which can be particularly challenging when only one case is the
focal point of the research (e.g., a city social program). For this reason, it is not uncommon for case
study and narrative researchers to maintain participants’ anonymity in their final reports by
changing participants’ names as well as the names of the characters and places revealed in the
course of the research.
The path that these ethical considerations – consent and anonymity – take in the research design is
also important. The skilled researcher will think carefully about how and when to incorporate these
(continued)

27 Qualitative Research | January 2017 www.researchdesignreview.com ©Margaret R. Roller
ethical standards while maintaining the quality and integrity of the data. For instance, narrative
researchers are reluctant to reveal “too much” regarding the study objectives at the onset of an
interview in fear of biasing the participant’s narrative. These researchers balance the ethical
obligation of informed consent with the need for quality outcomes by, among other things, gaining
consent twice, i.e., before the interview and again at the completion of the interview, and by
conducting a thoughtful debriefing with each participant.
Case-centered researchers also need to give thoughtful attention to anonymity and its impact on the
final outcomes. Specifically, researchers must address questions such as: How will anonymizing
the data introduce bias or error by way of changing context? and How will de-identifying the data
alter its interpretation? These are important questions because the answers may determine how or if
the data is used.
Ethical considerations revolve around transparency and safety, with safety broadly defined in terms
of both physical and psychological harm, including the potential harm associated with the invasion
of privacy and confidentiality. However, ethical considerations cannot (should not) be
contemplated in a vacuum. Researchers – particularly case-centered researchers – need to carefully
incorporate these ethics while also ensuring the quality of the research results.
Image captured from: http://digiday.com/platforms/anonymity-apps/

28 Qualitative Research | January 2017 www.researchdesignreview.com ©Margaret R. Roller
Article pertaining to: Researcher Bias
Paying Attention to Bias in Qualitative Research: A
Message to Marketing Researchers (& Clients)
Researchers of all ilk care about bias and how it may creep into their research designs resulting in
measurement error. This is true among
quantitative researchers as well as among
qualitative researchers who routinely
demonstrate their sensitivity to potential bias
in their data by way of building interviewer
training, careful recruitment screening, and
appropriate modes into their research
designs. It is these types of measures that
acknowledge qualitative researchers’
concerns about quality data; and yet, there are
many other ways to mitigate bias in
qualitative research that are often overlooked.
Marketing researchers (and marketing clients)
in particular could benefit from thinking more
deeply about bias and measurement error. In
the interest of “faster, cheaper, better”
research solutions, marketing researchers
often lose sight of quality design issues, not the least of which concern bias and measurement error
in the data. If marketing researchers care enough about mitigating bias to train
interviewers/moderators, develop screening questions that effectively target the appropriate
participant, and carefully select the suitable mode for the population segment, then it is sensible to
adopt broader design standards that more fully embrace the collecting of quality data.
An example of a tool that serves to raise the design standard is the reflexive journal. The reflexive
journal has been the subject (in whole or in part) of many articles in Research Design Review, most
notably “Interviewer Bias & Reflexivity in Qualitative Research” and “Reflections from the Field:
Questions to Stimulate Reflexivity Among Qualitative Researchers”. A reflexive journal is simply
a diary of sorts that is utilized by the qualitative interviewer or moderator to think about (reflect on)
how his/her assumptions or beliefs may be affecting the outcomes (i.e., the data). It enables the
researcher to re-assess (if necessary) his/her behavior, attitude, question wording, or other aspects of
data collection for the purpose of mitigating distortions in the data.
The reflexive journal appears to be a particularly vague or foreign concept among qualitative
marketing researchers (and marketing clients) given the absence of discussions concerning this tool
in their research designs. Why is this? Is there a belief that interviewer/moderator training
(continue)

29 Qualitative Research | January 2017 www.researchdesignreview.com ©Margaret R. Roller
sufficiently guards against potential bias? Is there a belief that all qualitative research is biased to
some degree – because, after all, it isn’t survey research – so any attempt at mitigation is futile
(which, of course, begs the question, ‘Why bother with qualitative research at all?’)? Is there a
head-in-the-sand (i.e., not-wanting-to-know) mentality that refuses to think of the
interviewer/moderator as someone with assumptions, beliefs, values, and judgments but rather as a
“super human” who is able to conduct a semi-structured in-depth interview (IDI) or focus group
discussion devoid of these human qualities (i.e., lacking humanness)?
The humanness in all of us is worthy of reflection. And in qualitative research design this reflection
can be put to good use mitigating bias in our data. As the interviewer considers how certain
behavior may have elicited responses that were not true to the participant, or the moderator reflects
on how his/her favoritism and attention towards a few focus group participants over others shifted
the course of conversation and the outcomes of the discussion, these researchers are using their
introspection to improve the research by moving data collection (and data outcomes) to a higher
standard. This is how interviewers learn to adjust the interview guide or consciously alter their
behavior during an IDI to gain more accurate data, or the moderator comes to understand his/her
own prejudices and finds corrective techniques to become a more inclusive moderator and ensure an
even-handed approach to the discussion.
Two important and unique attributes to qualitative research methods are the “researcher as
instrument” component, i.e., the researcher is the data collection tool, and the participant-researcher
relationship. These attributes speak to the humanness that both enriches and complicates the social-
exchange environment of the IDI and focus group discussion. And it is this humanness – embedded
in qualitative research – that should obligate marketing researchers to consider its import in
achieving quality outcomes. If marketers care enough about the integrity of their data to adopt high
standards in training, recruiting, and mode, why not care enough to mitigate bias in data collection
by utilizing tools – such as a reflexive journal – to seriously examine the human factors that
potentially increase inaccuracies and error in the final data?
Image captured from: https://gone-fishin.org/2012/01/31/burying-ones-head-in-the-sand/

30 Qualitative Research | January 2017 www.researchdesignreview.com ©Margaret R. Roller
Article pertaining to: Researcher Bias
Mitigating Researcher-as-instrument Effects
There are 10 unique attributes associated with qualitative research. These were discussed briefly in
an article posted in this blog back in 2013. One of the most fundamental and far-reaching of these
attributes is that the qualitative researcher is the “instrument” by which data are collected. The
data-gathering process in qualitative research is facilitated by interviewer or moderator guides,
observation grids, and the like; however, these are only accessories to the principal data collection
tool, i.e., the researcher or others on the research team.
As the key instrument in gathering qualitative data, the researcher bears a great deal of
responsibility for the outcomes. If for no other reason, this responsibility hinges on the fact that this
one attribute plays a central role in the effects associated with three other unique attributes –
context, meaning, and the participant-researcher relationship. On the one hand, the researcher-as-
instrument reality in qualitative research has the positive effect of enabling the researcher to utilize
context and the participant-researcher relationship to discover substantive meaning; yet, it is this
closeness and intimacy that potentially threatens the integrity of the data gathered. And it is this
compromised data that distorts the meaning, interpretations, and ultimate usefulness researchers
derive from their research studies.
This is why it is important to think carefully about qualitative research design and take steps to
mitigate researcher-as-instrument effects. Researchers do this, for example, when choosing the
mode for any particular study, thinking through the strengths and limitations of each mode given the
target population and research objective. Qualitative researchers also mitigate researcher-as-
instrument effects by how they develop their interview and moderator guides, e.g., their use of the
funnel approach. And, of course, researchers’ skills are clearly essential to circumventing possible
bias during data gathering; skills that focus on building participant-researcher rapport, active
listening, identifying contradictions, and avoiding inconsistency.
(continued)

31 Qualitative Research | January 2017 www.researchdesignreview.com ©Margaret R. Roller
As the all-important tool or instrument in collecting qualitative data, the researcher embodies the
definition of what it means to conduct qualitative research. It is this role that portends the rich,
meaningful information we expect from qualitative research, but also signals unwanted effects that
demand careful attention to research design.

32 Qualitative Research | January 2017 www.researchdesignreview.com ©Margaret R. Roller
Article pertaining to: Misplaced Quantitative Concepts
Qualitative Research “Participants” Are Not
“Respondents” (& Other Misplaced Concepts From
Quantitative Research)
There are many ideas or concepts that a quality approach to qualitative research borrows from
quantitative research design. Representativeness of the target population is one example. Well-
crafted techniques to maximize cooperation among recruited participants in order to minimize
nonresponse effects are another example. And
adequate interviewer/moderator training that
provides the necessary skills to mitigate possible
bias, while also controlling for participant
effects, is yet another example. In fact, there is
any number of lessons that qualitative
researchers can learn from survey research in
terms of sound research principles that positively
impact the usefulness of the outcomes.
But to assume that there is a direct relationship
between qualitative and quantitative research
would be a grave mistake. As discussed in an
article posted in 2013 – “10 Distinctive Qualities
of Qualitative Research” – the design,
implementation, analysis, and interpretation of qualitative research make it unique and uniquely
suited to go beyond survey research to study the complexities and meaning of the human
experience.
And yet, researchers – both qualitative and quantitative – regularly overextend the applicability of
quantitative ideas to qualitative research design. Although survey research informs the researcher of
the basic elements of “good research” – and draws the researcher’s attention to core criteria dealing
with sampling, error, bias, and so on – many quantitative concepts and techniques cannot and
should not be considered in qualitative research. Here are just four examples:
Generalization. It may seem obvious to most researchers that the limited and highly variable nature
of qualitative research makes it a poor predictor of things to come; however, many researchers have
advocated the “generalizability” of qualitative data. Whether to further a budding theory or make
assertions about an entire population segment, the concept of generalization in the context of
qualitative research comes up often. In referring to the case study method, for instance, Earl Babbie,
in his seventh edition of The Basics of Social Research (2016, Wadsworth Publishing), laments “the
limited generalizability of what is observed in a single instance of some phenomenon,” stating
further that “this risk is reduced, however, when more than one case is studied in depth” (p. 312).
(continued)

33 Qualitative Research | January 2017 www.researchdesignreview.com ©Margaret R. Roller
Qualitative research does not need generalization to be valuable but it does need transferability –
i.e., the ability to transfer the qualitative design and/or outcomes to other highly specific contexts.
Transferability is discussed in several Research Design Review articles, including this one posted in
2013.
Percentages & data graphs. Qualitative researchers have been known to use percentages to report
various aspects of their findings, such as Smith (January 2011, The Qualitative Report, 103-125)
who reports on her qualitative study of students’ behavior when searching the Internet for
HIV/AIDS information, stating that “eighty percent of students regardless of race did not know how
to properly search for online health information.”
There is also a tendency to use graphs or charts of some sort to display the data. Illustrations can be
useful to help visualize qualitative data but there is no reason why the researcher needs to fall back
on bar graphs or pie charts. Even when no percentages are used – e.g., the histograms of tagged
content made available by online discussion platforms – the appearance of a quantitative-like data
display not only hints that the researcher believes the qualitative data are quantifiable but also
serves to ignore the whole point of qualitative research – i.e., the analysis of context and personal
meaning – by reducing the data to a graphical configuration.
“Respondent.” The survey respondent is appropriately referred to as a “respondent” because that is
exactly the role he or she is playing in the research process. He or she is responding to the
researcher’s questions which are typically structured and closed-ended in format. Similarly, the
qualitative research participant is suitably labeled “participant” because his or her role goes beyond
simply replying to a series of questions to encompass participation in the research on many levels.
The participant elaborates on the interviewer’s/moderator’s questions, changes the topic if need be
to convey an idea, takes part in a social relationship with the interviewer/moderator, engages with
other participants in a focus group discussion, is willingly observed in an ethnographic study, and,
in some instances, is asked to aid in the analysis. For all of these reasons (and more), it is research
participants that provide qualitative data not respondents.
Rotating or randomizing the order of stimuli. The fourth example of a quantitative concept that
has been improperly attached to qualitative research pertains to the order in which stimuli –
documents, storyboards, images, etc. – are presented to research participants. There is a 2010 RDR
post on this topic – see “Standing the Discussion of Rotation in Qualitative Research on its Head” –
where the rationale for not rotating stimuli in qualitative is spelled out. The key takeaway from that
article is that, unlike quantitative research design which incorporates various control measures,
qualitative research thrives in an uncontrolled environment where the people, geography, and
researcher-participant input change within and across research events (e.g., interviews, focus
groups). This variability is an inevitable component to finding the context and meaning qualitative
researchers are looking for, but it also means that making sense of the data and discerning
meaningful differences across segments of the target population is a very “messy” process.
There is, however, one thing the researcher can control that will aid in finding meaningful
differences. This is the order in which stimuli are presented to participants from interview to
(continued)

34 Qualitative Research | January 2017 www.researchdesignreview.com ©Margaret R. Roller
interview or group to group. By keeping the order the same, the researcher can “see” what and how
variations emerge. To do otherwise – that is, by rotating the order of stimuli – the researcher has
made it impossible to detect meaningful differences across target segments of the population (e.g.,
Do younger people really feel differently about the stimuli compared to older people?) and, unlike
survey research, the qualitative researcher cannot say anything about the rotation effect or the order
bias that was introduced with each new rotation.