qualification opinion of low hippocampal volume (atrophy ... · qualification opinion of low...
TRANSCRIPT

7 Westferry Circus ● Canary Wharf ● London E14 4HB ● United Kingdom Telephone +44 (0)20 7418 8400 Facsimile +44 (0)20 7523 7040 E-mail [email protected] Website www.ema.europa.eu An agency of the European Union
© European Medicines Agency, 2011. Reproduction is authorised provided the source is acknowledged.
17 November 2011 EMA/CHMP/SAWP/809208/2011 Committee for Medicinal Products for Human Use (CHMP)
Qualification opinion of low hippocampal volume (atrophy) by MRI for use in clinical trials for regulatory purpose - in pre-dementia stage of Alzheimer’s disease
Agreed by Scientific Advice Working Party 1 September 2011
Adoption by CHMP for release for consultation 22 September 2011
End of consultation (deadline for comments) 1 November 2011
Adoption by CHMP 17 November 2011
Keywords Qualification opinion, MRI Biomarker, Pre-dementia Alzheimer’s disease

Qualification opinion of low hippocampal volume (atrophy) by MRI for use in clinical trials for regulatory purpose - in pre-dementia stage of Alzheimer’s disease
EMA/CHMP/SAWP/809208/2011 Page 2/49
Introduction
The European Medicines Agency’s (EMA) qualification process is a new, voluntary, scientific pathway
leading to either a CHMP opinion or a Scientific Advice of novel methodologies on innovative methods
or drug development tools. It includes qualification of biomarkers developed by consortia, networks,
public/private partnerships, learned societies or pharmaceutical industry for a specific intended use in
pharmaceutical research and development.
The Qualification team was: Prof. Fernando de Andrés Trelles (coordinator), Prof. Luca Pani (CHMP
member), Dr Bertil Jonsson, Christine Gispen de Wied. The EMA Scientific Administrator for the
procedure was Dr Maria Isaac.
On 23 March 2011 the Applicant C-Path CAMD Biomarker Working Group requested qualification advice
for the Candidate Biomarkers of Alzheimer’s Disease (AD).
The procedure started during the SAWP meeting held on 26 – 28 April 2011.
The discussion meeting with the Applicant took place on 29 June 2011.
During its meeting held on 30 August - 01 September 2011, the SAWP agreed on the advice to be
given to the Applicant. During its meeting held on 19 - 22 September 2011, the CHMP adopted the
advice to be given to the Applicant.
The response given by CHMP is based on the questions and supporting documentation submitted by
the Applicant, considered in the light of the current state-of-the-art in the relevant scientific fields.
Scope
The present opinion addresses the question as to whether the use of baseline measurement of low
hippocampal volume (atrophy) by MRI is qualified in selecting (i.e. to categorize) subjects for trials in
early Alzheimer’s Disease (AD) as having a high probability of being in the prodromal stage of the
disease as defined by the Dubois Criteria (2007).
The vast majority of the data used in CHMP’s evaluation have been submitted by CAMD, the applicant
that requested the qualification. They have been supplemented by further information required by
members of the qualification team.
In April 2011, the EMA published a draft qualification opinion of CSF biomarkers EMA Procedure
EMEA/H/SAB/012/1/QA/2010. The final paragraph of this qualification states:
“The CSF biomarker signature based on a low Aβ1-42 and a high-tau qualifies to identify MCI patients
as close as possible to the prodromal stage of AD, Dubois (2007) who are at risk to evolve into AD-
dementia. Collection, procedures and measurements of all CSF samples should be done in accordance
with Good Laboratory Practices and the specific International standards for these measurements.”
The proposed context of use as described in EMA Procedure EMEA/H/SAB/012/1/QA/2010 is similar to
that being proposed for hippocampal atrophy, with some distinctions. Based on the CAMD consortium
understanding of the presented data, baseline MRI-measured hippocampal atrophy is useful in helping
to determine which subjects are likely to evolve to AD dementia. While the data presented do not
directly compare HC atrophy on MRI to CSF analyte abnormalities in predicting likelihood to evolve to
AD dementia, the data do suggest that the baseline (before any therapeutic intervention is introduced)
MRI-measured HC atrophy assists in selecting the subjects likely to progress within a time frame
Qualification opinion of low hippocampal volume (atrophy) by MRI for use in clinical trials for regulatory purpose - in pre-dementia stage of Alzheimer’s disease
EMA/CHMP/SAWP/809208/2011 Page 3/49
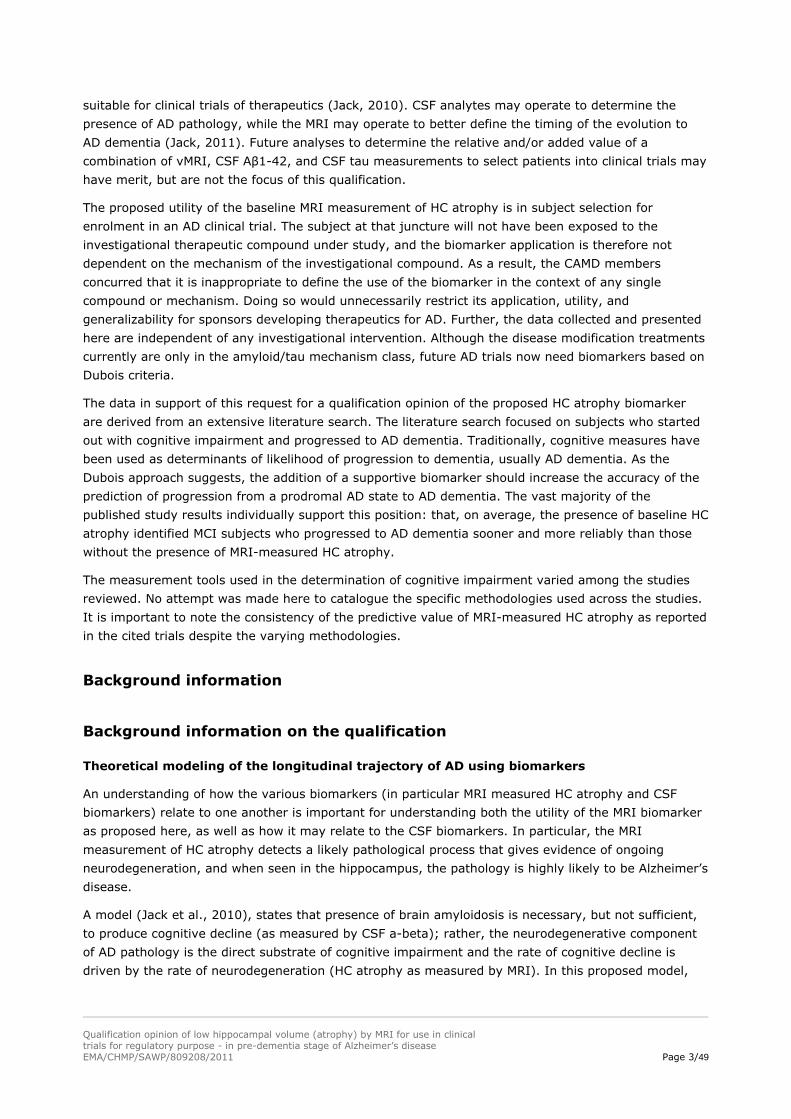
suitable for clinical trials of therapeutics (Jack, 2010). CSF analytes may operate to determine the
presence of AD pathology, while the MRI may operate to better define the timing of the evolution to
AD dementia (Jack, 2011). Future analyses to determine the relative and/or added value of a
combination of vMRI, CSF Aβ1-42, and CSF tau measurements to select patients into clinical trials may
have merit, but are not the focus of this qualification.
The proposed utility of the baseline MRI measurement of HC atrophy is in subject selection for
enrolment in an AD clinical trial. The subject at that juncture will not have been exposed to the
investigational therapeutic compound under study, and the biomarker application is therefore not
dependent on the mechanism of the investigational compound. As a result, the CAMD members
concurred that it is inappropriate to define the use of the biomarker in the context of any single
compound or mechanism. Doing so would unnecessarily restrict its application, utility, and
generalizability for sponsors developing therapeutics for AD. Further, the data collected and presented
here are independent of any investigational intervention. Although the disease modification treatments
currently are only in the amyloid/tau mechanism class, future AD trials now need biomarkers based on
Dubois criteria.
The data in support of this request for a qualification opinion of the proposed HC atrophy biomarker
are derived from an extensive literature search. The literature search focused on subjects who started
out with cognitive impairment and progressed to AD dementia. Traditionally, cognitive measures have
been used as determinants of likelihood of progression to dementia, usually AD dementia. As the
Dubois approach suggests, the addition of a supportive biomarker should increase the accuracy of the
prediction of progression from a prodromal AD state to AD dementia. The vast majority of the
published study results individually support this position: that, on average, the presence of baseline HC
atrophy identified MCI subjects who progressed to AD dementia sooner and more reliably than those
without the presence of MRI-measured HC atrophy.
The measurement tools used in the determination of cognitive impairment varied among the studies
reviewed. No attempt was made here to catalogue the specific methodologies used across the studies.
It is important to note the consistency of the predictive value of MRI-measured HC atrophy as reported
in the cited trials despite the varying methodologies.
Background information
Background information on the qualification
Theoretical modeling of the longitudinal trajectory of AD using biomarkers
An understanding of how the various biomarkers (in particular MRI measured HC atrophy and CSF
biomarkers) relate to one another is important for understanding both the utility of the MRI biomarker
as proposed here, as well as how it may relate to the CSF biomarkers. In particular, the MRI
measurement of HC atrophy detects a likely pathological process that gives evidence of ongoing
neurodegeneration, and when seen in the hippocampus, the pathology is highly likely to be Alzheimer’s
disease.
A model (Jack et al., 2010), states that presence of brain amyloidosis is necessary, but not sufficient,
to produce cognitive decline (as measured by CSF a-beta); rather, the neurodegenerative component
of AD pathology is the direct substrate of cognitive impairment and the rate of cognitive decline is
driven by the rate of neurodegeneration (HC atrophy as measured by MRI). In this proposed model,

amyloid deposition is dynamic early in the disease process (before cognition is impaired) while
neurodegeneration is dynamic in the mid to late stage (as cognition measurably declines).
This disease biomarker model is becoming widely accepted as a framework, incorporating five putative
AD biomarkers (based on several consortium consensus statements and literature reviews) into a
comprehensive sequence of pathological events as patients progress from cognitively normal in middle
age, to dementia in old age. There are presently five well-described biomarkers of AD. Both CSF Aβ1-
42 and amyloid PET imaging are biomarkers of A plaque deposition. CSF tau is an indicator of tau
pathology and associated neuronal injury. FDG PET measures AD mediated neuronal dysfunction while
volumetric MRI measures AD mediated neurodegeneration. This model rests on the assumption that
these five AD biomarkers become abnormal in a defined and sequential manner. The hypothesis states
that amyloid PET imaging and Aβ1-42 become abnormal first, before cognitive symptoms appear, and
do so as much as 20 years before the first clinical symptoms of AD are displayed. CSF tau and FDG
PET become abnormal later; structural MRI is the last of the five major biomarkers to become
abnormal. CSF tau, FDG PET and structural MRI correlate with clinical symptom severity; Aβ1-42 and
amyloid PET imaging may not, but may be a more direct evidence of pathology. The hypothesis posits
that together these five biomarkers of AD stage the complete trajectory, which may span as much as
30 years or more in affected individuals of AD. Figure 1 illustrates this model (Jack et al., 2010).
This model based on the pathological and clinical data leads to the conclusion that established
biomarkers, such as vMRI measurement of hippocampal volume (atrophy), are useful for identifying
those aMCI subjects who will evolve to the AD dementia (i.e., prodromal AD).
Figure 1: Hypothetical progression of pathological and clinical events that lead to Alzheimer’s disease,
as detected by use of different imaging techniques, functional measures, or biomarkers.
Increases in the extent of pathological abnormality are shown for each imaging measure and biomarker. ADL=activities of daily
living; EMCI=early MCI; FDG-PET=18F-fluorodeoxyglucose PET; LMCI=late MCI (Jack et al 2010).
Qualification opinion of low hippocampal volume (atrophy) by MRI for use in clinical trials for regulatory purpose - in pre-dementia stage of Alzheimer’s disease
EMA/CHMP/SAWP/809208/2011 Page 4/49

Qualification opinion of low hippocampal volume (atrophy) by MRI for use in clinical trials for regulatory purpose - in pre-dementia stage of Alzheimer’s disease
EMA/CHMP/SAWP/809208/2011 Page 5/49
Pathophysiological rationale
The topology of brain atrophy in AD mirrors that of neurofibrillary pathology (Braak, 1991; Whitwell,
2008; Whitwell, 2007). Atrophy begins, and is ultimately most severe, in the medial temporal lobe,
particularly the entorhinal cortex and hippocampus. It has been well established histologically that the
hippocampus is affected early in the disease with attendant grossly observable atrophy (Braak and
Braak 1991). The sensitivity of volumetric MRI has reached a stage where it can demonstrate even
mild AD entorhinal cortex and hippocampus volume reductions of 20–25% relative to normal age
matched controls and thereby reflect the observed histopathology of AD (Jack 1997; Juottonen 1999;
Lehericy 1994; Bobinski 2000; Xu 2000). There is evidence that volumetric MRI methods can provide
more sensitive prediction of progression than CSF or cognitive testing alone (Vemuri, 2009).
Postmortem MRI measures of the hippocampal volume correlate with hippocampal cell counts
(Bobinsky, 2000). Ante mortem MRI measures of hippocampal volume are not specific for AD, but do
correlate with AD severity as measured by Braak stage at autopsy (Jack, 2002; Gosche, 2002; Jagust,
2008; Silbert, 2003). Patterns of atrophy on ante mortem MRI map onto Braak stage topography in
subjects who have undergone ante mortem MRI and autopsy (Vemuri, 2008; Whitwell, 2008).
Because other brain regions are also affected by AD pathology, other regions have been examined
including entorhinal cortex, whole brain loss, ventricular volume, cingulate volume and others. The
hippocampal volume has generally been a reliable predictor of the stage of disease as well as
predicting the progression to AD dementia.
Clinical evidence informing selection of HC atrophy as the proposed biomarker
From among the comprehensive literature summarized in Tables 1 and 2, certain papers merit
particular mention because of their precedence setting. Jack (1999) found that over a period of 32.6
months, 27 of 80 MCI patients went on to AD type dementia. Hippocampal atrophy at baseline was
associated with crossover from MCI to AD (relative risk [RR], 0.69, p = 0.015). When hippocampal
volume was entered into bivariate models—using age, postmenopausal estrogen replacement,
standard neuropsychological tests, apolipoprotein E (APOE) genotype, history of ischemic heart
disease, and hypertension—the RRs were not substantially different from that found univariately, and
the associations between HC volume and crossover remained significant. Despite the small sample
size, a significant relationship between baseline HC volume and crossover to AD illustrates both the
strength of the association and the clinical potential of the technique. The W score is the value from a
standard normal distribution corresponding to the observed percentile. For example, for a standard
normal distribution, the 50, 5, and 2.5 percentiles are given by 0, 21.645, and 21.96, respectively.
Thus, a patient with a hippocampal volume (adjusted for age and sex) at the fifth percentile in the
normal value database would receive a W score of 21.645. Similarly, a patient at the 50th percentile
would receive a W score of 0.

Figure 2: Hippocampal W score and crossover.
Kaplan-Meier curves of patients whose hippocampal W score at baseline was >= 0 (n=13), 0> W> -2.5 (n=54) and <= -2.5
(n=13), (Jack, 1999). Note: W-score is the relative score of the measured HC volume corrected for intracranial volume and
compared to age and sex adjusted normals.
In a subsequent study, Jack (2005) examined both single time point MRI and rate of change MRI as
predictors of future conversion from MCI to AD and found that baseline HC atrophy predicted
conversion from MCI to AD dementia. This study supports the premise that cross-sectional HC volume
is an important predictor of time to conversion among MCI subjects. In addition, atrophy rates of
either whole brain or ventricle from serial scans provide predictive information about the hazard of
subsequent conversion from MCI to AD, which is complimentary to that provided by a cross-sectional
hippocampal measure. Among MCI patients, the key MRI predictors of conversion seem to be how
much the hippocampus has atrophied at the baseline time point, suggesting that the brain has been
atrophying for the 1 to 2 years before baseline.
Subjects with MCI who subsequently converted to AD have also been shown to have a lower baseline
hippocampal volume compared with those MCI subjects that do not convert in the same time interval
(Chupin et al. 2009; Devanand et al. 2007; Jack et al. 2000; Risacher et al. 2009; Leung et al. 2010).
Longitudinal studies that have assessed multiple time-points over the course of the disease have
demonstrated that rates of atrophy are not changing at a linear rate over time, but instead tend to
accelerate as the disease progresses. Two earlier studies investigating subjects with familial AD
demonstrated that rates of whole brain and hippocampal atrophy increase over time as the subjects
progress from clinically normal to AD (Ridha et al. 2006). This phenomenon has recently been
investigated and confirmed in two larger cohorts (Jack et al. 2008). Whitwell (2007) described how
cognitive changes before and up to dementia can be categorized as a continuum. This matches the
progression that is observed clinically, which encompasses a long, slow early phase.
vMRI measurement standardization
In submitting this data, CAMD has made no assumptions regarding specific image acquisition or
analytic methodology. That the results are as consistent as they are without uniform standardization of
specific methodology in acquisition and analysis speaks to the robustness of the biomarker. As used in
a clinical trial, a single methodology for acquisition is typically specified to be consistent across each of
the trial sites. In addition, a single core lab is now generally selected based on specific experience and
attention to acquisition quality control and consistent analysis processes. This, in turn, determines the
excellent reliability of the final vMRI numeric endpoint.
There is no single standard normative hippocampal volume or a widely accepted definition of what
constitutes atrophy outside of individual laboratories. Initiatives such as Alzheimer’s Disease Qualification opinion of low hippocampal volume (atrophy) by MRI for use in clinical trials for regulatory purpose - in pre-dementia stage of Alzheimer’s disease
EMA/CHMP/SAWP/809208/2011 Page 6/49

Qualification opinion of low hippocampal volume (atrophy) by MRI for use in clinical trials for regulatory purpose - in pre-dementia stage of Alzheimer’s disease
EMA/CHMP/SAWP/809208/2011 Page 7/49
Neuroimaging Initiative (ADNI) in North America, and their counterparts in Europe, Japan, and
Australia among others, have standardized image acquisition and post-processing methods. These (or
similar) standards have been adopted in most subsequent trials.
However, in a laboratory with experience in applying an analytic technique, the measurement of HC
volumes will be internally consistent and reliable (as illustrated in the submitted papers). This is felt by
the CAMD consortium members to be sufficiently accurate to, on a lab-by-lab basis, determine their
normal values and from that, derive a numeric volume below which the subject will meet criteria for
the categorization as likely to progress to AD dementia. The various means hitherto employed for
these determinations are described in the submitted articles.
An effort to standardize and publish HC volumes is now underway through a cooperative effort of the
European Alzheimer’s Disease Centers (EADC) – ADNI Hippocampal Harmonization Effort (Frisoni
2011, Boccardi 2010). This effort is intended to establish a Reference Standard of hand-drawn
hippocampal volumes that can be distributed to the various core laboratories to compare their
methodologies with this standard.
Even without these published standards, the ability of an individual laboratory to set its own standards
as long as sufficient attention is given to accepted methodology, the accuracy is believed to be
sufficiently advanced and reliable to justify use in multicenter clinical trials for the stated context of
use.
Summary
CAMD has presented data from an extensive literature review in which all but two of the identified
studies found that baseline measurement of low HC volume (atrophy) predicts evolution to AD
dementia. This predictive value is reported in the great majority of studies, despite different analytic
methodologies and statistical approaches. Standardization of hippocampal volume measurement is
being addressed through international efforts to enable cross study comparisons. Single center
centralized reading, however, as utilized in multicenter trials, can demonstrate appropriate internal
reproducibility of volume calculations sufficient for clinical trials use. The data presented here support
the proposed context of use.
In application, subjects with episodic memory deficits (the core diagnostic criteria of Dubois, 2007)
would receive vMRI HC volume evaluation as part of the trial participation selection process. This
evaluation would be expected to improve the patient selection by predicting which subjects would likely
progress to AD dementia within a time range appropriate for a therapeutic clinical trial. This
enrichment strategy will enable enrollment of subjects who are more likely to benefit from a treatment,
and thus will enable a trial sponsor to reduce subject numbers and increase power, all of which should
facilitate a trial with an informative outcome.
Early detection of AD is thought to offer the best opportunity for effective intervention, however this
has been problematic. Retrospective assessment of older clinical trials which enrolled subjects defined
cognitively as having mild cognitive impairment (MCI) (i.e., without assessing biomarkers) and
followed them through to conversion to AD shows that that the rate of conversion was generally not
accurately estimated. Trials had to be amended to increase the sample size and/or increase duration of
the trial, in some cases up to four years. This high cost, in terms of both time and resources, has
delayed beneficial treatments reaching patients in need, and has discouraged clinical development.

Qualification opinion of low hippocampal volume (atrophy) by MRI for use in clinical trials for regulatory purpose - in pre-dementia stage of Alzheimer’s disease
EMA/CHMP/SAWP/809208/2011 Page 8/49
One of the challenges of conducting clinical trials for AD has been the lack of reliable tools for
predicting which subjects with cognitive impairment (but without dementia) will evolve to AD dementia
over the course of the trial.
AD is pathologically characterized by the presence of microscopic extracellular neuritic plaques and
intracellular neurofibrillary tangles. AD tangle pathology progresses from medial temporal lobe
structures, such as the entorhinal cortex and hippocampus, to encompass the whole cortex, whereas
plaque pathology is largely cortical and increases with disease severity.
The lack of widely accepted ante-mortem criteria to identify patients with AD pathology at early
symptomatic stages has handicapped sponsors’ efforts to develop, and regulatory authority’s ability to
evaluate, putative disease-modifying drugs. Previous attempts to develop such criteria have lacked the
desired diagnostic sensitivity and specificity. For example, aMCI (Petersen 2004) describes individuals
with clinical characteristics that are likely to represent a high likelihood of progression to AD. However,
populations defined in this way exhibit marked differences in the severity of clinical symptomatology,
rates of progression to AD dementia, likelihood of progression to AD dementia and level of APO E4
carrier status (Feldman et al., 2007). To know with more certainty which patients with episodic
memory impairment would progress to AD dementia is of benefit for predementa trials.
The topology of brain atrophy in AD mirrors that of neurofibrillary pathology (Braak, 1991; Whitwell,
2008; Whitwell, 2007). Atrophy begins, and is ultimately most severe, in the medial temporal lobe,
particularly the entorhinal cortex and hippocampus. It has been well established histologically that the
hippocampus is affected early in the disease with attendant grossly observable atrophy (Braak and
Braak, 1991). The sensitivity of volumetric MRI has reached a stage where it can demonstrate even
mild AD entorhinal cortex and hippocampus volume reductions of 20–25%, relative to normal age-
matched controls, and thereby reflect the observed histopathology of AD (Jack, 1997; Juottonen,
1999; Lehericy, 1994; Bobinski, 2000; Xu, 2000). There is evidence that volumetric MRI methods can
provide more sensitive prediction of progression than CSF or cognitive testing alone (Vemuri, 2009).
One of the results of AD pathology is cerebral atrophy, which can be visualized using vMRI (Barnes et
al., 2009). Studies show MRI volumetric markers as eligible candidates for predictors of AD from a pre-
dementia phase. Rates of change in several volumetric measures, including whole-brain and HC
atrophy rates, correlate closely with changes in cognitive performance (Frisoni et al., 2010). In a
meta-analysis, medial temporal lobe atrophy is estimated to have 73% sensitivity and 81% specificity
for predicting whether patients with amnestic MCI will convert to dementia (Schmand et al., 2010).
Structural MRI has gained increasing acceptance in clinical settings as a sensitive and powerful marker
of neurodegeneration and cognitive progression (Frisoni et al., 2010).
As volumetric MRI has gained increasing acceptance in clinical settings as a sensitive and powerful
marker of neurodegeneration progression (Frisoni et al., 2010), there arises a need to extensively
examine the precision of volumetric MRI as a predictor of progression to AD dementia. The following
sections of this document tabulate the data, which support the CAMD proposal for HC atrophy as a
qualified biomarker for AD.
Specifically:
It is proposed that baseline measurement of low hippocampal volume (atrophy) by MRI in patients
with episodic memory deficit (Dubois criteria) can be used to predict whether such patients are likely
to evolve to AD type dementia during the course of an AD clinical trial.
The Dubois research criteria for the diagnosis of AD (Dubois et al., 2007) specify a stepwise approach
as follows:

Qualification opinion of low hippocampal volume (atrophy) by MRI for use in clinical trials for regulatory purpose - in pre-dementia stage of Alzheimer’s disease
EMA/CHMP/SAWP/809208/2011 Page 9/49
“In the absence of completely specific biomarkers, the clinical diagnosis of AD can still be only probabilistic, even in the case of typical AD. To meet criteria for probable AD, an affected individual must fulfil criterion A (the core clinical criterion) and at least one or more of the supportive biomarker criteria….”
These supportive features include MRI measures:
“Volume loss of hippocampi, entorhinal cortex, amygdala evidenced on MRI with qualitative ratings using visual scoring (referenced to well characterised population with age norms) or quantitative volumetry of regions of interest (referenced to well characterised population with age norms).”
Furthermore, in naming MRI measures to the supportive features, Dubois et al. state:
“Over the past two decades since the NINCDS–ADRDA criteria were published, great progress has been made in identifying the AD-associated structural and molecular changes in the brain and their biochemical footprints. MRI enables detailed visualisation of MTL structures implicated in the core diagnostic feature of AD.”
Early stage AD by Dubois criteria which include biomarker criteria above, is named prodromal AD,
since the dementia has not appeared. This is the population for this EMA submission’s context of use.
Note that the term atrophy, as described above, specifies that a volume loss be compared to well
characterised norms. The term atrophy corresponds to that seen pathologically and is measured in vivo
by the volumetric MRI techniques.
A large body of published literature supports the measurement of hippocampal atrophy as a tool to
identify patients in the prodromal stage of AD. The analysis of a systematic literature review conducted
by the Coalition Against Major Diseases (CAMD) supporting this use is described herein.
Diagnostic criteria “pre-Dubois” limited the ability to enroll prodromal AD subjects on a rational basis,
i.e., using biomarkers to define and enroll appropriate populations. More reliable and accurate
assessment of the likelihood of AD progression during the course of a clinical trial would allow for
increased statistical power and could decrease unnecessary exposure to study drug for subjects with a
low likelihood of progression.
Baseline measurement of low hippocampal volume (i.e., atrophy) is a supportive indicator of evolution.
CAMD with the help of consortium members conducted a systematic literature review with the specific
goal of identifying longitudinal studies that evaluated MRI-assessed hippocampal atrophy as a
biomarker in predicting conversion to AD dementia from a baseline memory impaired state, either
amnestic MCI or MCI determined by criteria outlined in each article. The details of this review are
discussed below, with stepwise methods utilized in the literature review listed in Study Inclusion
Decision Tree.
Question 1
It is proposed that baseline measurement of low hippocampal volume (atrophy) by MRI in
patients with episodic memory deficit (Dubois criteria) is a useful means of predicting those
likely to evolve to AD dementia during the course of an AD clinical trial.
Does the CHMP agree that the data supports the qualification of HC atrophy, as detected by
vMRI in patients with episodic memory deficit, as a biomarker predictive of evolution to AD
dementia?

Qualification opinion of low hippocampal volume (atrophy) by MRI for use in clinical trials for regulatory purpose - in pre-dementia stage of Alzheimer’s disease
EMA/CHMP/SAWP/809208/2011 Page 10/49
Applicant’s position
Through an extensive review of the published literature, CAMD has concluded that there is substantial
evidence to support the proposed context of use for an HC atrophy biomarker. In support of the
request for qualification of HC atrophy as a biomarker predictive of the evolution to AD dementia,
CAMD submits this comprehensive literature review of the data published from worldwide, peer-
reviewed, English language, clinical studies, according to the analysis plan described herein. The
supporting data are derived from a literature review, encompassing the period from 1 January 1995
through 23 March 2011.
A systematic review was conducted of the published literature of the performance of hippocampal
volume, as measured by vMRI, in predicting progression from a memory impaired status to AD
dementia. The literature search objectives were: to determine if baseline measurement of low
hippocampal volume (atrophy) by MRI in patients with episodic memory deficit (Dubois criteria) or MCI
is a useful means of predicting those patients likely to evolve to AD.
Specifically, we have incorporated here the identified literature that reports on the use of MRI-based
volumetric measures of hippocampal volume as a predictor of conversion from memory impairment
status to AD type dementia.
The specific methodology used to generate the literature review is described in detail under the
Methods heading of this document (following the Results below). Overall, the search processes yielded
27 studies that fit the pre-specified search criteria. These are listed in Table 2.
Results: volumetric MRI in predicting progression to AD
The results of the 27 accepted studies are tabulated in Table 2 below. The focus of the accepted
studies is the baseline hippocampal atrophy in MCI subjects measured using vMRI with the
investigative question regarding the ability of vMRI measurement of HC volume to predict progression
to AD. Most studies were published in the last five years. The follow-up duration of all studies ranged
from 18 months (Fellgiebel et al., 2006) to 108 months (Desikan et al., 2008).
US studies: 17 studies
Study sample size ranged from 21 (Kantarchi et al., 2005) to 335 subjects (Leung et al., 2010)
European studies: 9 studies
Represented countries included Finland (Herukka et al., 2008; Tapiola et al., 2008), Germany
(Fellgiebel et al., 2006), Italy, (Galluzzi et al., 2010), Sweden (Eckerstrom et al., 2008), The
Netherlands (Henneman et al., 2009; Visser et al., 1999, 2002), and the United Kingdom (Galton et
al., 2005). The study sample size ranged from 13 subjects (Fellgiebel et al., 2006; Visser et al., 1999)
to 90 subjects (Galluzzi et al., 2010).
Asian studies: 1 study
The study was conducted in Taiwan and included 58 subjects (Wang et al., 2009).
The same groups of authors wrote several of these papers and, therefore, there is a possibility that
some patients overlap in these studies. The accepted list of studies labels these studies with possible
overlapping subjects as “Population overlap”.
Hippocampal volume measurements were reported with various methods: as a total volume of both
hippocampi, or as separate measurements for left and right hippocampi. These data are presented in
Table 2 without adjustment.
Qualification opinion of low hippocampal volume (atrophy) by MRI for use in clinical trials for regulatory purpose - in pre-dementia stage of Alzheimer’s disease
EMA/CHMP/SAWP/809208/2011 Page 11/49
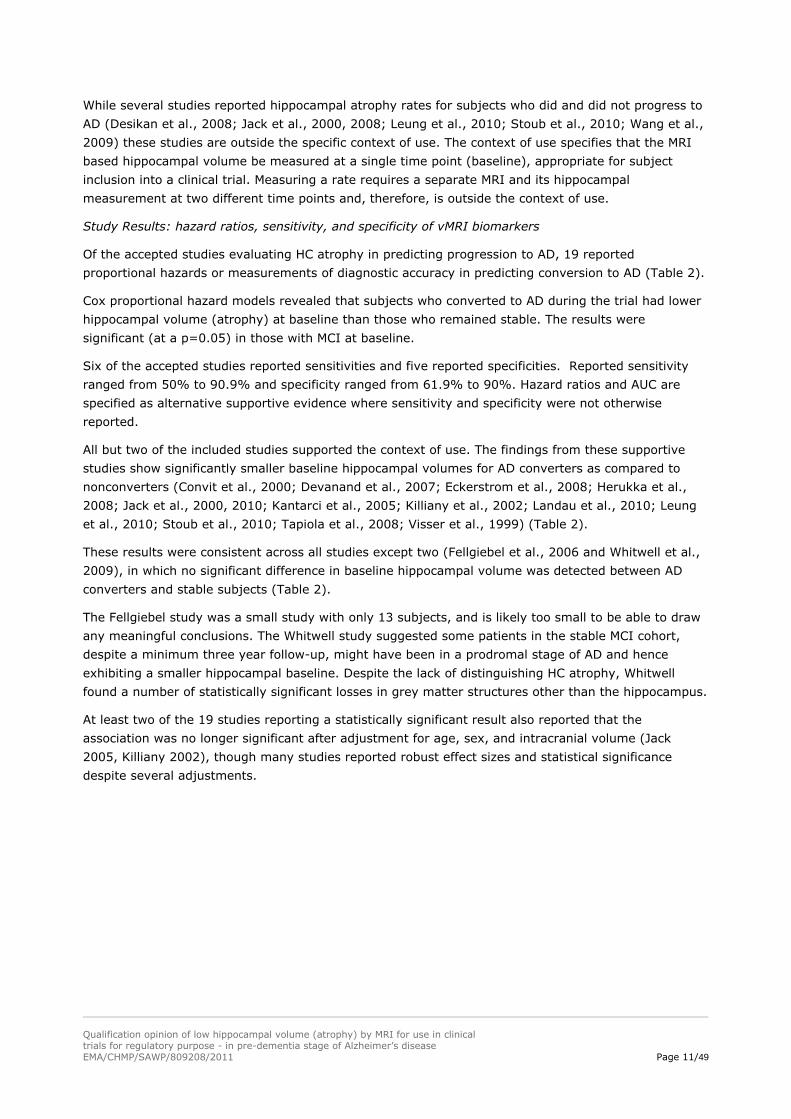
While several studies reported hippocampal atrophy rates for subjects who did and did not progress to
AD (Desikan et al., 2008; Jack et al., 2000, 2008; Leung et al., 2010; Stoub et al., 2010; Wang et al.,
2009) these studies are outside the specific context of use. The context of use specifies that the MRI
based hippocampal volume be measured at a single time point (baseline), appropriate for subject
inclusion into a clinical trial. Measuring a rate requires a separate MRI and its hippocampal
measurement at two different time points and, therefore, is outside the context of use.
Study Results: hazard ratios, sensitivity, and specificity of vMRI biomarkers
Of the accepted studies evaluating HC atrophy in predicting progression to AD, 19 reported
proportional hazards or measurements of diagnostic accuracy in predicting conversion to AD (Table 2).
Cox proportional hazard models revealed that subjects who converted to AD during the trial had lower
hippocampal volume (atrophy) at baseline than those who remained stable. The results were
significant (at a p=0.05) in those with MCI at baseline.
Six of the accepted studies reported sensitivities and five reported specificities. Reported sensitivity
ranged from 50% to 90.9% and specificity ranged from 61.9% to 90%. Hazard ratios and AUC are
specified as alternative supportive evidence where sensitivity and specificity were not otherwise
reported.
All but two of the included studies supported the context of use. The findings from these supportive
studies show significantly smaller baseline hippocampal volumes for AD converters as compared to
nonconverters (Convit et al., 2000; Devanand et al., 2007; Eckerstrom et al., 2008; Herukka et al.,
2008; Jack et al., 2000, 2010; Kantarci et al., 2005; Killiany et al., 2002; Landau et al., 2010; Leung
et al., 2010; Stoub et al., 2010; Tapiola et al., 2008; Visser et al., 1999) (Table 2).
These results were consistent across all studies except two (Fellgiebel et al., 2006 and Whitwell et al.,
2009), in which no significant difference in baseline hippocampal volume was detected between AD
converters and stable subjects (Table 2).
The Fellgiebel study was a small study with only 13 subjects, and is likely too small to be able to draw
any meaningful conclusions. The Whitwell study suggested some patients in the stable MCI cohort,
despite a minimum three year follow-up, might have been in a prodromal stage of AD and hence
exhibiting a smaller hippocampal baseline. Despite the lack of distinguishing HC atrophy, Whitwell
found a number of statistically significant losses in grey matter structures other than the hippocampus.
At least two of the 19 studies reporting a statistically significant result also reported that the
association was no longer significant after adjustment for age, sex, and intracranial volume (Jack
2005, Killiany 2002), though many studies reported robust effect sizes and statistical significance
despite several adjustments.

Qualification opinion of low hippocampal volume (atrophy) by MRI for use in clinical trials for regulatory purpose - in pre-dementia stage of Alzheimer’s disease
EMA/CHMP/SAWP/809208/2011 Page 12/49
Table 1: Longitudinal Studies of Hippocampal Atrophy and Progression to Alzheimer's Disease: HRs, Sensitivity, Specificity, and AUC
study follow-up
(range),
months
type of
subjects
sample
size
N
converting
to AD
N
stable
MCI
comparison HR, OR
(95% CI)
P value sensitivity
(95% CI)
specificity
(95% CI)
AUC
(95% CI)
Bakkour A
2009 32.4
Questionable
AD (QAD,
CDR=0.5)
49 20 29 QAD-AD vs.
QAD 83% 50%
0.65
Convit A
2000 38.4
Normal or
MCI 46 14 32
Desikan RS
2009
60 MCI 129 44 85 MCI-S vs.
MCI-AD
Crude HR:
0.64
(0.47-
0.87)
Adjusted
HR: 0.73
(0.51-
1.04)
0.005
0.08
Desikan RS
2008 108 MCI 47 25 22
Devanand DP
2007
36 MCI 139 31 102 MCI-AD vs.
MCI-S
3.62
(1.93-
6.80) 2.89
(1.52-
5.51)
<0.0001
0.019 61.3% 80% (fixed)
0.77
Eckerstrom C
2008 24 MCI 42 13 21
Fellgiebel A
2006 18 aMCI 13 6 7

Qualification opinion of low hippocampal volume (atrophy) by MRI for use in clinical trials for regulatory purpose - in pre-dementia stage of Alzheimer’s disease
EMA/CHMP/SAWP/809208/2011 Page 13/49
study follow-up
(range),
months
type of
subjects
sample
size
N
converting
to AD
N
stable
MCI
comparison HR, OR
(95% CI)
P value sensitivity
(95% CI)
specificity
(95% CI)
AUC
(95% CI)
Fleisher AS
2008 36 aMCI 129 53 76 MCI-S vs.
MCI-AD
60.4% (52-
68.8)
Galluzzi S
2010 24.0 ± 13.9
(SD) MCI 90 24 51
MCI-NC vs.
MCI-AD
AUC
0.73, 95%
CI 0.57–
0.89
Galton CJ
2005
24
questionable
dementia
(Memory
complaints
yielded CDR
0.5)
31 11 18
Non-
converters vs.
AD-converters
Left HC:
63.6% Right
HC: 90.9%
Left HC:
88.9%
Right HC:
88.9%
Henneman WJP
2009
21.6 MCI 44 23 16 MCI-AD vs.
MCI-S
HC
volume:
7.4 (2.4-
23.0) HC
atrophy
rate: 3.9
(1.6-9.9)
<0.05
Herukka SK
2008 40.6-57.2 MCI 21 8 13
MCI-AD vs.
MCI-S
Right HC:
15.8 (1.4-
174.2)
Left HC:
75%; Right
HC: 87.5%
Left HC:
61.5%;
Right HC:
69%
Jack CR
2010 19 MCI 218 89 129 MCI-S vs.
MCI-AD
HR=2.6
(1.8-3.8)
25% vs.
0.001

Qualification opinion of low hippocampal volume (atrophy) by MRI for use in clinical trials for regulatory purpose - in pre-dementia stage of Alzheimer’s disease
EMA/CHMP/SAWP/809208/2011 Page 14/49
study follow-up
(range),
months
type of
subjects
sample
size
N
converting
to AD
N
stable
MCI
comparison HR, OR
(95% CI)
P value sensitivity
(95% CI)
specificity
(95% CI)
AUC
(95% CI)
75%
Jack CR
2008 36 131 52 79
Jack CR
2005
22.8 aMCI 72 39 33 MCI-AD vs.
MCI-S
HC
volume:
1.51 (1.1-
2.0) HC
APC: 1.13
(0.8-1.5)
0.002
Jack CR
2000 34.8 (24-
48) MCI 43 18 25
Jack CR
1999 32.6 MCI 80 27 53 MCI-S vs.
MCI-AD 0.69 0.015
Kantarci K
2005 36.4 aMCI 21 12 9 MCI-AD vs.
MCI-S
2.5
(1.0-6.2) 0.02
Killiany RJ
2002 36
Questionable
AD
(CDR=0.5)
94 21 73 CDR 0.5-AD
vs. CDR 0.5
1.5
(1.0-2.31) <0.05 NS NS
Landau SM
2010 22.8 MCI 85 28 57 MCI-AD vs.
MCI-S
2.49
(1.02-
5.96)
0.04 79% 82%
Leung KK
2010 22.8 MCI 335 123 204

Qualification opinion of low hippocampal volume (atrophy) by MRI for use in clinical trials for regulatory purpose - in pre-dementia stage of Alzheimer’s disease
EMA/CHMP/SAWP/809208/2011 Page 15/49
study follow-up
(range),
months
type of
subjects
sample
size
N
converting
to AD
N
stable
MCI
comparison HR, OR
(95% CI)
P value sensitivity
(95% CI)
specificity
(95% CI)
AUC
(95% CI)
Stoub TR
2010 60 aMCI 29 11 18
Tapiola T
2008
34 (10-54) MCI 60 9 47 MCI-S vs.
MCI-AD
Left HC:
0.739
(0.55-
1.00)
Right HC:
0.668
(0.49-
0.91)
Total HC:
0.815
(0.69-
0.97)
0.05
<0.01
<0.05
Visser PJ
1999 36 MCI 13 9 4
MCI-S vs.
MCI-AD
HC
OR=0.21
(0.05-
0.99)
0.02
Visser PJ
2002 22.8 (12-
36) MCI 30 7 23 50% 90%
Wang PN
2009 21.9 (10.7-
32.8) aMCI 58 19 39
MCI-AD vs.
MCI-S
Left HC
volume:
HR=0.38
(0.10-
0.88)
0.03 76.2%
Whitwell JL
2008 44 aMCI 63 42 21

Qualification opinion of low hippocampal volume (atrophy) by MRI for use in clinical trials for regulatory purpose - in pre-dementia stage of Alzheimer’s disease
EMA/CHMP/SAWP/809208/2011 Page 16/49
AD = Alzheimer's disease; AUC = area under the curve; CDR = clinical dementia rating; CI = confidence interval; HC = hippocampus; HR = hazard ratio; MCI = mild cognitive
impairment; OR = odds ratio

Qualification opinion of low hippocampal volume (atrophy) by MRI for use in clinical trials for regulatory purpose - in pre-dementia stage of Alzheimer’s disease
EMA/CHMP/SAWP/809208/2011 Page 17/49
Literature search methodology
The plan for the literature search is described herein. Procedures for this review followed established
methods used in the science of systematic review research.
The source of data was limited to studies published in English between 1 January 1995 and through 23
March 2011. The literature search included both electronic and manual components. The electronic
search was performed in MEDLINE (via PubMed) and EMBASE.
The search of MEDLINE was conducted using the following search strategy:
PubMed Search Strategy
Search: ("alzheimer disease"[MeSH Terms] OR "alzheimer disease"[TIAB] OR "alzheimer's
disease"[TIAB] OR "alzheimers disease"[TIAB] OR "predementia" OR "pre-dementia" OR "mild
cognitive"[TIAB] OR "cognitive impairment"[TIAB] or "cognitive decline"[tiab] OR "age associated
memory impairment"[TIAB])
Magnetic resonance imaging [MeSH] and ("volume" or "temporal" or "temporal lobe"[mesh] or
hippocam* OR "hippocampus"[mesh] OR "limbic" OR "whole brain")
Clinical Trial [Publication Type] OR Comparative Study [Publication type] OR "Epidemiologic
studies"[mesh] OR "clinical trial" OR "longitudinal study" OR "cohort study" OR "retrospective study"
OR "observational study"
Editorial[ptyp] OR Letter[ptyp] OR Addresses[ptyp] OR Bibliography[ptyp] OR Biography[ptyp] OR
Comment[ptyp] OR Dictionary[ptyp] OR Directory[ptyp] OR Duplicate Publication[ptyp] OR
Festschrift[ptyp] OR Interview[ptyp] OR In Vitro[ptyp] OR Legal Cases[ptyp] OR Legislation[ptyp] OR
News[ptyp] OR Newspaper Article[ptyp] OR Overall[ptyp] OR Patient Education Handout[ptyp] OR
Periodical Index[ptyp] OR review[ptyp] OR case reports[ptyp]
PubMed Search Limits: Humans, English, Publication Date from 1 Jan 1995 to 23 March 2011
The same search strategy was used to search EMBASE.
EMBASE Search Strategy:
Search: 'Alzheimer disease'/exp OR 'alzheimer disease' OR 'alzheimers disease' OR 'predementia' OR
'pre-dementia' OR 'preclinical alzheimers disease' OR 'mild cognitive' OR 'cognitive impairment' or
'cognitive decline' OR 'age associated memory impairment' OR 'cognitive impairment no dementia'
'Nuclear magnetic resonance imaging'/exp OR 'magnetic resonance imaging' and ('volume' or
'temporal' or 'temporal cortex'/exp or 'temporal lobe'/exp or 'limbic' OR hippocam* or 'hippocampus' or
'whole brain' or 'brain size'/exp)
'Clinical study'/exp OR 'controlled study'/exp OR 'clinical trial' OR 'longitudinal study' OR 'retrospective
study' OR 'cohort study' OR 'observational study'/exp OR 'observational study'
([cochrane review]/lim OR [meta analysis]/lim OR [systematic review]/lim OR [conference
abstract]/lim OR [conference paper]/lim OR [conference review]/lim OR [editorial]/lim OR
[erratum]/lim OR [letter]/lim OR [note]/lim OR [review]/lim OR [short survey]/lim) OR 'case
report'/exp OR 'case study'/exp
#1 and #2 and #3 not #4
#5 AND [humans]/lim AND [english]/lim AND [1995-2010]/py AND [embase]/lim NOT [medline]/lim

Qualification opinion of low hippocampal volume (atrophy) by MRI for use in clinical trials for regulatory purpose - in pre-dementia stage of Alzheimer’s disease
EMA/CHMP/SAWP/809208/2011 Page 18/49
In addition to searching MEDLINE and EMBASE, a manual search of the reference lists of all accepted
studies, as well as the reference lists of recent reviews and meta-analyses, supplemented the above
electronic searches to ensure optimal literature identification and retrieval.
Study selection
Initial study eligibility was determined by 2 reviewers. Abstracts of publications were primarily used,
however if needed, full papers were examined. Any study with a definite exclusion criterion was
rejected.
Exclusion Criteria
Publications prior to January 1995
Studies published only in abstract form
Case reports, letters, comments, reviews, editorials, meta-analyses
Non-clinical studies
Studies that do not report follow-up data of interest
Follow-up duration less than 18 months
Cross-sectional studies
Studies reporting data of interest on brain volumes other than hippocampus
Studies evaluating other types of dementia, but not AD or outcomes for AD cohort are not
separable
Studies not reporting outcomes of interest
Studies of exclusively cognitively normal patient populations
Hippocampal volume was not specifically measured (e.g., whole brain measures only)
If no definite exclusion criterion was identified, then the full paper was retrieved for a full review. If
none of the exclusion criteria and all of the pre-specified inclusion criteria were present, the studies
were included.
Inclusion Criteria
Longitudinal study with at least 18 months follow-up
Study must be conducted in elderly subjects with pre-dementia conditions or MCI.
Study must report 1) baseline quantitative data on hippocampal volume for subjects who
progressed to AD and those who remained stable; or 2) diagnostic measures (sensitivity,
specificity, AUC, etc.) for vMRI volumes in predicting progression from MCI to AD; or 3) HR, OR for
MRI hippocampal volume in predicting conversion from MCI to AD.
All studies accepted or rejected at screening required the consensus of two independent reviewers.
Data extraction and evidence tables
During screening and extraction, population overlap was identified among certain accepted studies.
Population overlap studies were those in which the same patient population, in part or in total, was
Qualification opinion of low hippocampal volume (atrophy) by MRI for use in clinical trials for regulatory purpose - in pre-dementia stage of Alzheimer’s disease
EMA/CHMP/SAWP/809208/2011 Page 19/49
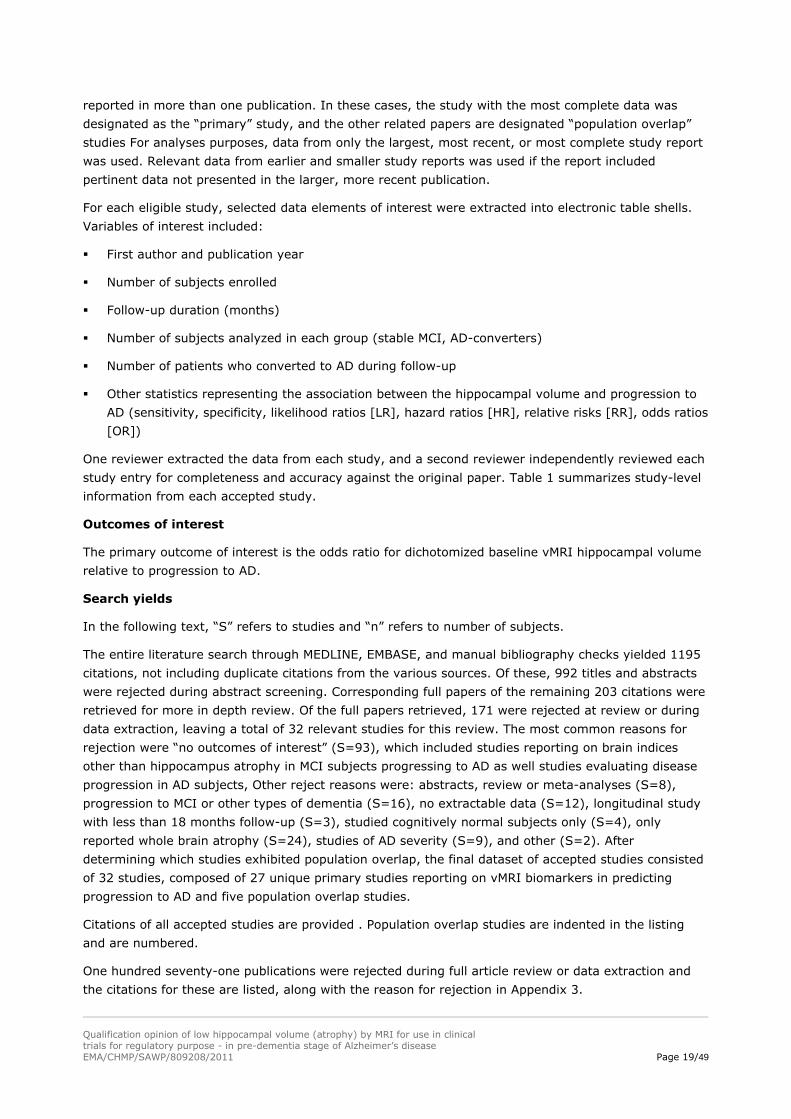
reported in more than one publication. In these cases, the study with the most complete data was
designated as the “primary” study, and the other related papers are designated “population overlap”
studies For analyses purposes, data from only the largest, most recent, or most complete study report
was used. Relevant data from earlier and smaller study reports was used if the report included
pertinent data not presented in the larger, more recent publication.
For each eligible study, selected data elements of interest were extracted into electronic table shells.
Variables of interest included:
First author and publication year
Number of subjects enrolled
Follow-up duration (months)
Number of subjects analyzed in each group (stable MCI, AD-converters)
Number of patients who converted to AD during follow-up
Other statistics representing the association between the hippocampal volume and progression to
AD (sensitivity, specificity, likelihood ratios [LR], hazard ratios [HR], relative risks [RR], odds ratios
[OR])
One reviewer extracted the data from each study, and a second reviewer independently reviewed each
study entry for completeness and accuracy against the original paper. Table 1 summarizes study-level
information from each accepted study.
Outcomes of interest
The primary outcome of interest is the odds ratio for dichotomized baseline vMRI hippocampal volume
relative to progression to AD.
Search yields
In the following text, “S” refers to studies and “n” refers to number of subjects.
The entire literature search through MEDLINE, EMBASE, and manual bibliography checks yielded 1195
citations, not including duplicate citations from the various sources. Of these, 992 titles and abstracts
were rejected during abstract screening. Corresponding full papers of the remaining 203 citations were
retrieved for more in depth review. Of the full papers retrieved, 171 were rejected at review or during
data extraction, leaving a total of 32 relevant studies for this review. The most common reasons for
rejection were “no outcomes of interest” (S=93), which included studies reporting on brain indices
other than hippocampus atrophy in MCI subjects progressing to AD as well studies evaluating disease
progression in AD subjects, Other reject reasons were: abstracts, review or meta-analyses (S=8),
progression to MCI or other types of dementia (S=16), no extractable data (S=12), longitudinal study
with less than 18 months follow-up (S=3), studied cognitively normal subjects only (S=4), only
reported whole brain atrophy (S=24), studies of AD severity (S=9), and other (S=2). After
determining which studies exhibited population overlap, the final dataset of accepted studies consisted
of 32 studies, composed of 27 unique primary studies reporting on vMRI biomarkers in predicting
progression to AD and five population overlap studies.
Citations of all accepted studies are provided . Population overlap studies are indented in the listing
and are numbered.
One hundred seventy-one publications were rejected during full article review or data extraction and
the citations for these are listed, along with the reason for rejection in Appendix 3.
Qualification opinion of low hippocampal volume (atrophy) by MRI for use in clinical trials for regulatory purpose - in pre-dementia stage of Alzheimer’s disease
EMA/CHMP/SAWP/809208/2011 Page 20/49
Preliminary analysis
The accepted studies reported a variety of statistical methods for reaching their conclusions. As
discussed below, the more common outcomes (sensitivity, specificity, hazard ratios, odd ratios, and
area under the curve) were not universally presented in the publications. This diversity makes a formal
comparison between the studies using meta-analytic techniques impractical.
Six of the accepted studies reported sensitivities and five reported specificities. Reported sensitivity
ranged from 50% to 90.9% and specificity ranged from 61.9% to 90%. Hazard ratios (HR) and area
under the curve (AUC) are specified as alternative supportive evidence where sensitivity and specificity
were not reported. All but two of the included studies (Fellgiebel et al., 2006 and Whitwell et al. 2009)
support the context of use.
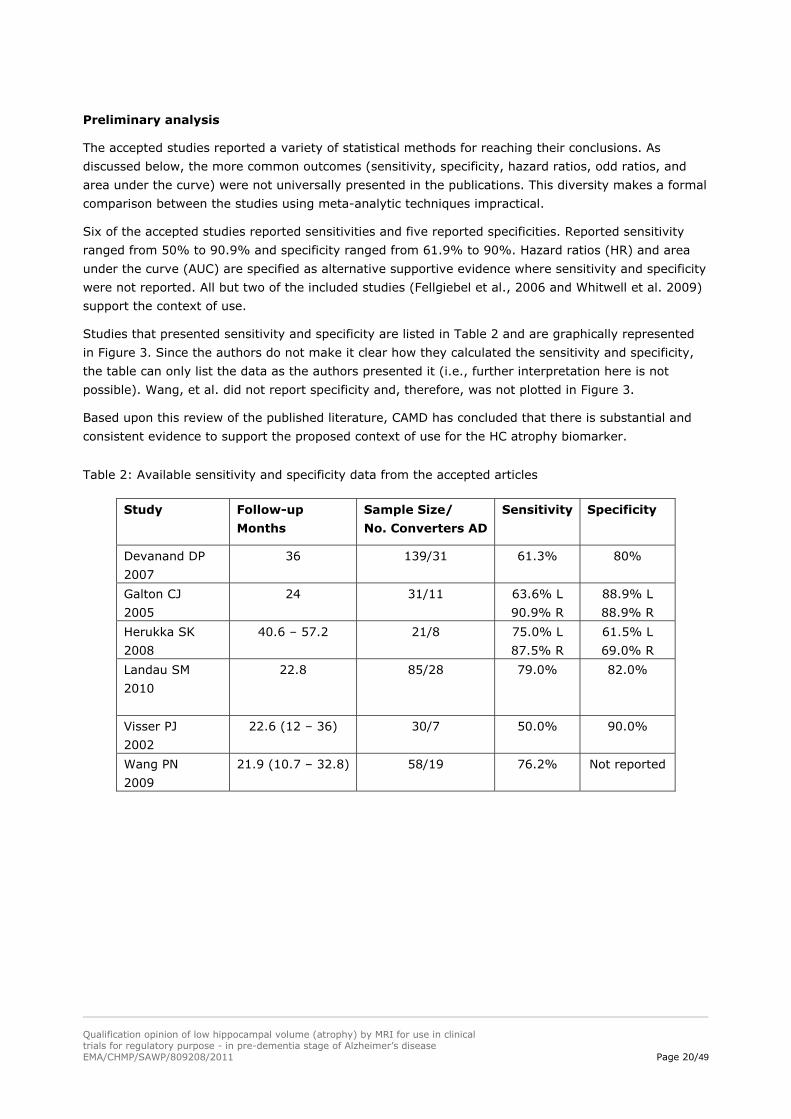
Studies that presented sensitivity and specificity are listed in Table 2 and are graphically represented
in Figure 3. Since the authors do not make it clear how they calculated the sensitivity and specificity,
the table can only list the data as the authors presented it (i.e., further interpretation here is not
possible). Wang, et al. did not report specificity and, therefore, was not plotted in Figure 3.
Based upon this review of the published literature, CAMD has concluded that there is substantial and
consistent evidence to support the proposed context of use for the HC atrophy biomarker.
Table 2: Available sensitivity and specificity data from the accepted articles
Study Follow-up
Months
Sample Size/
No. Converters AD
Sensitivity Specificity
Devanand DP
2007
36 139/31 61.3% 80%
Galton CJ
2005
24 31/11 63.6% L
90.9% R
88.9% L
88.9% R
Herukka SK
2008
40.6 – 57.2 21/8 75.0% L
87.5% R
61.5% L
69.0% R
Landau SM
2010
22.8 85/28 79.0% 82.0%
Visser PJ
2002
22.6 (12 – 36) 30/7 50.0% 90.0%
Wang PN
2009
21.9 (10.7 – 32.8) 58/19 76.2% Not reported

Figure 3: Graphic representation of sensitivity and specificity from studies of hippocampal volume.
(Bubble size is proportional to the study sample size.)Question and CAMD Consortium Position
Based on the coordinators' reports the CHMP gave the following answer:
CHMP/SAWP Scientific discussion
Context of use: Qualification opinion of low hippocampal volume (atrophy) by MRI for use in regulatory clinical trials - in pre-dementia stage of Alzheimer’s disease
The purpose of this “qualification” procedure is to assess whether low hippocampal volume as
measured by MRI and considered as a dichotomized variable (low volume or not) can be considered a
marker (a risk/ prognostic factor) of progression to dementia in subjects with cognitive deficit
compatible with early Alzheimer’s disease (ideally, without previous or concomitant pharmacological
treatment for it).
The potential value of the proposed marker in other settings (e.g. in subjects without cognitive deficit
or unlikely to have early AD for other reasons) or for other purposes (e.g. as a criterion for the
diagnosis of a condition/disease -namely Alzheimer’s disease- in a particular subject or the usefulness
of repeated measurements to assess the effect of therapeutic interventions -as a marker of efficacy-)
are not considered here.
Qualification opinion of low hippocampal volume (atrophy) by MRI for use in clinical trials for regulatory purpose - in pre-dementia stage of Alzheimer’s disease
EMA/CHMP/SAWP/809208/2011 Page 21/49

Qualification opinion of low hippocampal volume (atrophy) by MRI for use in clinical trials for regulatory purpose - in pre-dementia stage of Alzheimer’s disease
EMA/CHMP/SAWP/809208/2011 Page 22/49
Identifying subjects at higher risk of developing AD dementia (as intended in this procedure) may
serve useful purposes even in the absence of effective treatments for the disease.
The one contemplated in this procedure is to “enrich” recruitment into clinical trials aimed at studying
drugs potentially slowing the progress/conversion to (AD) dementia of the included patients. Enrolling
“non-enriched” samples (basing inclusion only on the cognitive deficit) could mean that few subjects
would convert during the duration of the trial. Impractically large numbers of subjects and/or duration
of follow-up would be required and the trials would be unfeasible or inefficient. Other biomarkers to
“enrich” recruitment into this type of clinical trials are known (e.g. some CSF analytes) but their
relative value to low hippocampal volume (to accurately predict rate of conversion within the recruited
population) is only theoretically discussed (rather than with data) in the narrative of the Sponsor.
Accepting the value of the biomarker to “enrich” recruitment is, probably, less demanding than
assessing its value in other potential uses as less accuracy in the prediction is required than e.g. to
include a particular individual into a diagnostic category. It has to be considered that, in the end, the
rate of patients spontaneously converting in the control arm of the trial (whether accurately predicted
or not) will be known at the end of the trial so that the consequences of some out of target prediction
would not be as crucial as the same inaccuracy would be to establish a relevant diagnosis in an
individual subject.
The data on which the Sponsor base their request for the biomarker to be accepted as qualified derive
from a systematic review they have conducted after searching the literature for longitudinal studies
evaluating MRI-assessed hippocampal “atrophy” (controversially used by the Sponsor as synonymous
to low hippocampal volume) in predicting conversion to AD dementia from a baseline memory impaired
state.
The conclusions are mainly obtained via a “voting” procedure (the majority of studies report that……)
but although it can be accepted that a true meta-analysis would, probably, have been unfeasible given
the heterogeneity of the studies, further attempts to obtaining global estimates may well be justified.
Some discussion with the Sponsor was needed, both to clarify some aspects of the systematic review
and its internal and external validity and to explore whether a more in depth analysis of the retrieved
data could justify a more precise statement than simply accepting the vague view that using low
hippocampal volume as a biomarker would “somewhat” enrich recruitment into clinical trials within the
considered context.
Based on the co-ordinators' report the Scientific Advice Working Party determined that the Applicant should discuss the following points, before advice can be provided:
CHMP/SAWP Question 1
Accuracy data (figure 3) should be represented in a classical ROC space and the sponsor
should try to formally summarise the information provided (sROC model or average
operating point along with critical discussion about its representativeness).

Qualification opinion of low hippocampal volume (atrophy) by MRI for use in clinical trials for regulatory purpose - in pre-dementia stage of Alzheimer’s disease
EMA/CHMP/SAWP/809208/2011 Page 23/49
Applicant’s response
We agree that the ROC analysis is a key evaluation parameter in evaluating the prediction data. As
before noted, the data included in the reported studies was insufficient to perform an AUC analysis on
even a subset of the studies. In its stead, we performed a de novo analysis on hippocampal volume
interpretation of MRI images generated from the ADNI study. The objective of this analysis was to
determine whether hippocampal volume quantification method significantly impacts the prediction of
conversion. The results of our review across the literature suggest that the hippocampal volume
quantification method (the one heterogeneous variable across the studies analyzed here de novo) does
not likely impact interpretation of biomarker results.
To further address this query from the SAWP, CAMD presents the results of this de novo analysis. It is
based on the ADNI study data with well-standardized aMCI patient data. We obtained data from four
distinct hippocampal volume analysis methodologies. The variable is the volume reconstruction and
interpretation. The subject definition and image acquisition methods were standardized as described in
the ADNI protocol. Note that the ADNI image acquisition methodology is being copied in studies in
Europe, Australia, Japan, and Korea. Using a statistical approach described below, we performed the
de novo analysis and present the results in ROC format. Below is a summary of the statistical
approach employed to evaluate the use of baseline MRI of the hippocampus in subjects diagnosed with
cognitive impairment to predict conversion to Alzheimer’s dementia, followed by a summary of the key
findings of that analysis. The details of the analysis are located at the end of this document in a
supplemental analysis section.
Statistical approach: For these analyses, ADNI data were used. A sub-dataset that included all the
MCI patients was prepared utilizing demographic information, conversion records, cognitive test
scores, APOE status, and baseline volumetric MRI data. These data were analyzed with results from
four different automated hippocampal volume measuring techniques: FreeSurfer (Fischl, et al., 2002),
NeuroQuant™ (Holland, 2009, Brewer, 2009), Learning Embedding for Atlas Propagation (LEAP) (Wolz,
2010), and HMAP (Leung, et al., 2010).
Acquisition of the scans was done using the MPRAGE protocol specified by ADNI. MPRAGE
(Magnetization Prepared RApid Gradient Echo) is designed for rapid acquisition with T1 weighted
dominance. Fast gradient echoes are characterized by their rapid sampling time, high signal intensity
and image contrast while approaching steady state (the echo is collected during the time when tissues
are experiencing T1 relaxation). The rapid speed of the acquisition makes it an excellent alternative to
earlier techniques. Hippocampal volumes were corrected using intracranial volumes to control for head
size variability.
One important statistical quality measure prospectively set up as subjects enrolled in the ADNI study
are randomized to training and test data set defined by the ADNI core team. This technique allows for
cross-validation. The models here are built only on the training dataset and tested on the testing
dataset. Summary statistics were calculated for dynamic range, mean, median, minimum, and
maximum in the MCI population. Cox regression models of hippocampal volume were built using the
training set with covariates, including age, gender, race, APOE, education, and the cognitive test
scores. Time to conversion was measured from baseline using visit code (6, 12, 18, 24, 36 months)
instead of exact time elapsed. Statistical significance for inclusion of the variables in the model was
determined as a two-sided p-value < 0.05. The model was then applied to the test set to predict time
to conversion, and the accuracy reported using mean square errors. A logistic regression model was
similarly developed with the training set, and then applied to the test set. Subjects that converted to
AD in two years were counted as converters, and subjects that did not convert in two years were
considered non-converters. Receiver operating characteristic (ROC) curve analysis was performed to

Qualification opinion of low hippocampal volume (atrophy) by MRI for use in clinical trials for regulatory purpose - in pre-dementia stage of Alzheimer’s disease
EMA/CHMP/SAWP/809208/2011 Page 24/49
evaluate the best discrimination of the biomarkers for conversion to AD. The area under the ROC
curve (AUC) was used as a measure of the overall performance of the ROC curve.
Findings: In the figure 5 below, ROC curves of hippocampal volume predicting conversion to AD for the
four different quantitative methodologies are shown superimposed on the literature reported
sensitivities/specificities Figure 4. They are not significantly different, with AUC ranging from 0.694-
0.74 for the test set. MRI acquisition, while similar in the literature presented in Table 2, is identical in
ADNI protocol. The image interpretation in ADNI however uses various methods. CAMD analysis of the
ADNI MCI cohort using these four different measurement techniques standardized using the same
intracranial volume measurement, and cross-validated using a predetermined test set. This de novo
analysis strongly supports the proposed context of use. It also suggests that different volumetric
measures performed on a standard dataset can be compared.
Representativeness: The SAWP further requested comments on the representativeness of the data.
To this end, we present four different analytic techniques on images obtained using current state of the
art image acquisition techniques, two of which were developed in Europe (LEAP HMAP), and two in
North America (Freesurfer and Neuroquant).
Figure 4 illustrates sensitivity and specificity point data from the literature studies that reported that
data, then Figure 5 contains the same point data superimposed on de novo ADNI ROC curve data. Note
that the ADNI data (color lines in Figure 5) are only slightly lower than literature results published by
other groups (color dots in Figure 4). In addition, the original submission lists four studies that
reported ROC AUC figures as follows: Bakkour (0.65), Devenand (0.77), Fleischer (0.604), and
Galluzzi (0.73) (See table 3, below). These reported ROC values are very similar to the de novo
analysis.
The literature figures (color dots) are not substantially different than the ones presented in the de novo
ADNI (color lines) analysis (Figure 5), and this similarity lends support to the consistency of the
acquisition and reconstruction technique conducted in different centers.
The highlighted literature articles that reported sensitivity and specificity are all similar to or better
than the CAMD analysis of the ADNI data, though some of these studies are of a small number of
subjects with the consequential greater variability. There may be other bias present as noted in the
answer to CHMP/SAWP Question 4 below.
Regarding the hippocampal border delineation technique, the Fleischer article used a manual tracing
method on early results of the ADNI data and had similar results to the more automated methods.
The Galluzzi paper also reported using manual tracing. Bakkour used an automated approach. Based
on the diversity of acquisition and analytic techniques yielding comparable results, the Sponsor
believes the results reported here are representative.
Figure 4: Literature studies alone

Figure 5: Literature studies (points) combined with ADNI four analyses (ROC curves)
Qualification opinion of low hippocampal volume (atrophy) by MRI for use in clinical trials for regulatory purpose - in pre-dementia stage of Alzheimer’s disease
EMA/CHMP/SAWP/809208/2011 Page 25/49

Qualification opinion of low hippocampal volume (atrophy) by MRI for use in clinical trials for regulatory purpose - in pre-dementia stage of Alzheimer’s disease
EMA/CHMP/SAWP/809208/2011 Page 26/49
Table 3: Comparison between published and de novo ADNI analysis
Study N ROC
LEAP 176 0.7178
NeuroQuant 176 0.7358
FreeSurfer 159 0.7318 De Novo ADNI data
HMAP 161 0.694
Bakkour 49 0.65
Devenand 139 0.77
Fleisher 129 0.604
Reported AUC from published
literature
Galluzzi 90 0.73
CHMP/SAWP Question 2
Please discuss the inclusion as favourable of studies even with a sensitivity of 50%.
Applicant’s response
CAMD queried the author (Pieter Visser) regarding the study cited in the question (Visser, 2002). His
response is as follows:
“You probably used data of hippocampal volume from Table 3. These are results from a
multivariate model including age, memory, and hippocampal volume. The table demonstrates
the added value of hippocampal volume over age and cognition, not the predictive accuracy of
hippocampal volume alone.”
“You may alternatively use data from Table 2. For subjects with a hippocampal volume in the
lowest tertile, the sensitivity to predict AD is 86% (6/7) and the specificity 77% (17/22).”
From this response, the result is actually considerably better than the reported sensitivity data
analysis, which CAMD originally submitted. For technical reasons, however, this was one of the articles
that were identified as having fallen below the minimum 18-month follow-up for all subjects and,
therefore, is here considered only as supportive.
The SAWP has raised valid considerations in response to the Sponsor’s application, particularly
concerning systematic bias, reporting bias, and publication bias, as well as heterogeneity concerns. It
is hoped that the responses detailed above, with the supplemental data presented, have adequately
addressed these issues.

Supplemental data on ROC analysis
Key findings:
FreeSurfer Methodology: Cox regression analysis on the ADNI training data set using FreeSurfer with
ICV from UCSD shows significant effects of cognitive tests, hippocampal volume, and age in the model
(below).
Parameter
Parameter
Estimate
Standard
Error
Chi-
Square
Pr >
ChiSq
Hazard
Ratio Label
TOTALMOD 0.08955 0.02701 10.9889 0.0009 1.094 ADAS-Cog (total 85)
Ucsf_hippoc_avg -1.80652 0.43970 16.8800 <.0001 0.164 Average Volume of
Hippocampus
(Ucsffsl,unit=cm^3)
age -0.07298 0.02775 6.9159 0.0085 0.930
gender -0.61660 0.40784 2.2858 0.1306 0.540 1=male 2=female
edu 0.02185 0.05605 0.1520 0.6967 1.022 Education (0-20)
race -0.38638 1.02520 0.1420 0.7063 0.680 Racial Categories:1=
American Indian or Alaskan
Native 2=Asian 4=Black
5=White 2
race 0.54426 0.78340 0.4827 0.4872 1.723
apoe -0.22659 0.31806 0.5076 0.4762 0.797 0=none e4; 1=1 or 2 e4 0
ICV_UCSD 3.92897E-7 1.36991E-6 0.0823 0.7743 1.000 Intracranial Volume
The model was then applied to the ADNI test dataset. Survival probability and true conversion record
at two years were compared to generate the ROC curve. The AUC is 0.7318 (graph below). The
number of observations used was 159.
Qualification opinion of low hippocampal volume (atrophy) by MRI for use in clinical trials for regulatory purpose - in pre-dementia stage of Alzheimer’s disease
EMA/CHMP/SAWP/809208/2011 Page 27/49

NeuroQuant methodology: When the same model was run using ICV data from NeuroQuant, the
results were similar, but yielded a slightly higher AUC of 0.7358.
Cox regression analysis on the ADNI training data set using hippocampal volume measurements by
NeuroQuant methodology and ICV measurements from UCSD shows significant effects of cognitive
tests, hippocampal volume, and age in the model (below).
Parameter
Parameter
Estimate
Standard
Error
Chi-
Square
Pr >
ChiSq
Hazard
Ratio Label
TOTALMOD 0.09434 0.02657 12.6026 0.0004 1.099 ADAS-Cog (total 85)
NQ_hippoc_avg -1.54063 0.40275 14.6324 0.0001 0.214 Average Volume of
Hippocampus
(NQ,unit=cm^3)
age -0.06313 0.02620 5.8075 0.0160 0.939
gender -0.51099 0.40349 1.6038 0.2054 0.600 1=male 2=female
edu 0.04260 0.05317 0.6419 0.4230 1.044 Education (0-20)
race -11.36328 961.31398 0.0001 0.9906 0.000 Racial Categories:1=
American Indian or Alaskan
Native 2=Asian 4=Black
5=White 1
race -0.48087 1.02597 0.2197 0.6393 0.618
race 0.61633 0.78711 0.6131 0.4336 1.852
apoe -0.31960 0.31389 1.0367 0.3086 0.726 0=none e4; 1=1 or 2 e4 0
ICV_UCSD 5.12948E-8 1.33867E-6 0.0015 0.9694 1.000 Intracranial Volume
This model was then applied to the ADNI test data set. Survival probability and true conversion record
a two years were compared to generate the ROC curve. The AUC is 0.7290 (below). Number of
Observations Used is 175. When NeuroQuant ICV measurements were used in the Cox and logistic
models, the results were similar, but yielded a very slightly higher AUC of 0.7295.
Qualification opinion of low hippocampal volume (atrophy) by MRI for use in clinical trials for regulatory purpose - in pre-dementia stage of Alzheimer’s disease
EMA/CHMP/SAWP/809208/2011 Page 28/49

LEAP methodology: Cox regression analysis on the ADNI training data set using hippocampal volume
measurements by LEAP methodology and ICV measurements from NeuroQuant shows significant
effects of cognitive tests, and is marginally significant for hippocampal volume. Age is not significant
in this model (below).
Parameter
Parameter
Estimate
Standard
Error
Chi-
Square
Pr > Chi
Sq
Hazard
Ratio Label
TOTALMOD 0.11659 0.02655 19.2892 <.0001 1.124 ADAS-Cog (total 85)
leap_hippoc_avg -1.16436 0.64906 3.2181 0.0728 0.312 Average Volume of
Hippocampus (Leap,
unit=cm^3)
age -0.03322 0.02357 1.9868 0.1587 0.967
gender -0.21963 0.38702 0.3221 0.5704 0.803 1=male 2=female
edu 0.06217 0.05069 1.5042 0.2200 1.064 Education (0-20)
race -11.49301 953.46912 0.0001 0.9904 0.000 Racial Categories:1=
American Indian or Alaskan
Native 2=Asian 4=Black
5=White
race -0.37528 1.03295 0.1320 0.7164 0.687
race -0.15017 0.75263 0.0398 0.8419 0.861
apoe -0.49176 0.30824 2.5452 0.1106 0.612 0=none e4; 1=1 or 2 e4
NQ_ICV_all -0.0004429 0.00138 0.1027 0.7486 1.000 Intracranial Volume (NQ,
Left+ Right)
This model was then applied on the testing data. Survival probability and true conversion record at
two years were compared to generate the ROC curve. The AUC is 0.7178. Number of Observations
Used is 176.
Qualification opinion of low hippocampal volume (atrophy) by MRI for use in clinical trials for regulatory purpose - in pre-dementia stage of Alzheimer’s disease
EMA/CHMP/SAWP/809208/2011 Page 29/49

HMAP methodology: Cox regression analysis on the ADNI training data set using hippocampal volume
measurements by HMAPs methodology and ICV measurements from HMAP shows significant effects of
cognitive tests, hippocampal volume, age, and APOE status
Parameter
Parameter
Estimate
Standard
Error
Chi-
Square
Pr >
ChiSq
Hazard
Ratio Label
TOTALMOD 0.07826 0.02611 8.9830 0.0027 1.081 ADAS-Cog (total 85)
HMAPS_hippoc_
avg
-2.35702 0.53046 19.7432 <.0001 0.095 Average Volume of
Hippocampus
(HMAPS,unit=cm^3)
age -0.07945 0.02646 9.0194 0.0027 0.924
gender -0.57911 0.41700 1.9286 0.1649 0.560 1=male 2=female
edu -0.0006536 0.05397 0.0001 0.9903 0.999 Education (0-20)
race -0.24979 1.02904 0.0589 0.8082 0.779 Racial Categories:1=
American Indian or Alaskan
Native 2=Asian 4=Black
5=White
race 0.11752 0.77125 0.0232 0.8789 1.125
apoe -0.67855 0.32512 4.3558 0.0369 0.507 0=none e4; 1=1 or 2 e4
ICV_HMAPS 0.0008012 0.00142 0.3175 0.5731 1.001 Intracranial Volume, HMAPS
When the model was applied to the ADNI test set, the survival probability and true conversion record
at two years were compared to generate the ROC curve. The AUC is 0.694. Number of Observations
Used is 161.
Qualification opinion of low hippocampal volume (atrophy) by MRI for use in clinical trials for regulatory purpose - in pre-dementia stage of Alzheimer’s disease
EMA/CHMP/SAWP/809208/2011 Page 30/49

Qualification opinion of low hippocampal volume (atrophy) by MRI for use in clinical trials for regulatory purpose - in pre-dementia stage of Alzheimer’s disease
EMA/CHMP/SAWP/809208/2011 Page 31/49
There was a strong correlation among ICV measurements reported by UCSD and NeuroQuant. The
measurements of hippocampal volume adjusted for ICV by each of these techniques produced results
that were not significantly different.
There was a strong correlation among hippocampal volumes for all methods reported here.

Qualification opinion of low hippocampal volume (atrophy) by MRI for use in clinical trials for regulatory purpose - in pre-dementia stage of Alzheimer’s disease
EMA/CHMP/SAWP/809208/2011 Page 32/49
Table 4: Summary of cognitive and MRI parameters
Study Subject Handling Total
MCI n
qualifying
Cog test
outcome
measure Image Acquisition
Image Reconstruction/Analysis
Manual/semi-Automatic/automatic
Bakkour
2009
49 MCI subjects
followed with 29 no
change; 20 converted.
Followed for 3 years
49 CDR 0.5 CDR 1
Multiple (three or four) structural T1-weighted
magnetization- prepared rapid gradient echo
images were acquired on a 1.5 T Siemens
Vision scanner (Siemens Medical Systems,
Erlangen, Germany) using the following
parameters: repetition time/echo
time/inversion time/delay: 9.7/4/20/200
msec, flip angle: 10 °, matrix: 256 × 256 (1
mm × 1 mm in-plane resolution), 128 sagittal
(1.25 mm slices without gaps). These images
were motion- corrected and averaged
together during processing.
Automated tissue segmentation and
surface reconstruction and alignment of
participants. These methods have been
previously described in detail, including
the surface-based cortical thickness
processing and spherical registration to
align subjects’ cortical surfaces.12, 17-22
The methods are summarized in appendix
e-1 on the Neurology® Web site at
www.neurology.org.
Convit
2000
Individuals received an
MRI at baseline and a
clinical and cognitive
evaluation at baseline
and follow-up. 26
normal elderly (NL) and
20 individuals with mild
cognitive impairment
(MCI). Fourteen
individuals (12 from the
MCI group and two from
the NL group) declined
to DAT within the 3.2-
year follow-up interval.
20 GDS 3 GDS 4
Eighteen coronal T1-weighted spin echo
(630/20/1; TR/TE/excitations) MR images (4
mm– thick with a 10% gap) were acquired to
include the entire temporal lobe. The field of
view was 23 cm and the acquisition matrix
256 by 256 pixels.
With the Multimodal Image Data Analysis
System (MIDAS) [41] we drew regions of
interest on 3-fold enlarged images. All the
image analyses were performed blind to
group membership. With a mouse-driven
cursor we out- lined the temporal lobe
structures and then excluded the pixels
that fell within a visually determined
threshold for cerebrospinal fluid (CSF).
The volumes of the temporal lobe
structures were estimated from the pixel
counts over the slices that were chosen
for these measurements.

Qualification opinion of low hippocampal volume (atrophy) by MRI for use in clinical trials for regulatory purpose - in pre-dementia stage of Alzheimer’s disease
EMA/CHMP/SAWP/809208/2011 Page 33/49
Study Subject Handling Total
MCI n
qualifying
Cog test
outcome
measure Image Acquisition
Image Reconstruction/Analysis
Manual/semi-Automatic/automatic
Desikan
2009
129 subjects recruited
through print media,
tested and followed.
Typical inclusion criteria
employed.
129 CDR 0.5 Consensus
DX of AD
T1-weighted 3D spoiled gradient-recalled
echo (SPGR) scans were acquired by using
the following sequence: 1 coronal acquisition,
TR: 35 ms, TE: 5 ms, FOV :220 mm, flip
angle: 45°, section thickness: 1.5 mm, matrix
size: 256 × 256, NEX: 1.
FreeSurfer with manual ROI confirmation
Desikan
2008
The subjects were
chosen from the larger
population of 339
subjects as being the
only ones who met the
clinical criteria for this
study and had two MRI
scans that were
acquired on a 1.5T GE
scanner, obtained with
an SPGR sequence.
47 CDR 0.5 Consensus
DX of AD
MRI scans were acquired on a 1.5-T scanner
(GE, Milwaukee, WI). T1-weighted three-
dimensional spoiled gradient echo (SPGR)
scans were acquired using the following
sequence: coronal acquisition, repetition time
35 msec, echo time 5 msec, field of view 220
mm, flip angle 45°, slice thickness 1.5 mm,
matrix size 256x256 NEX 1
FreeSurfer with manual ROI confirmation

Qualification opinion of low hippocampal volume (atrophy) by MRI for use in clinical trials for regulatory purpose - in pre-dementia stage of Alzheimer’s disease
EMA/CHMP/SAWP/809208/2011 Page 34/49
Study Subject Handling Total
MCI n
qualifying
Cog test
outcome
measure Image Acquisition
Image Reconstruction/Analysis
Manual/semi-Automatic/automatic
Devanand
2007
Enrolled a broad sample
of cognitively impaired
outpatients who
presented with memory
complaints and were
found to have cognitive
impairment without
dementia based on
comprehensive
evaluation, but without
a specific diagnosable
cause for the cognitive
impairment. Typical
inclusion criteria
employed.
139
Folstein
MMSE recall :
2 out of 3
objects at 5
minutes, or a
Selective
Reminding
Test (SRT)
delayed
recall score :
1 SD below
norms, or a
Wechsler
Adult
Intelligence
Scale–
Revised
(WAIS-R)
performance
IQ score : 10
points below
the WAIS-R
verbal IQ
score
Consensus
DX of AD
DSM IV or
NINCDS
T1-weighted axial images parallel to the
temporal horns using a spin echo sequence
with TR: 550, TE: 11, 5-mm slice thickness
without gap, matrix: 256x 192, 1 NEX, and
24-cm FOV; 3) proton density and T2-
weighted fast spin echo coronal images,
perpendicular to the temporal horns, acquired
with a dual echo sequence with an 8-echo
train, TR: 4,000, TE: 17 and 102, 5-mm slice
thickness without gap, matrix: 256x 192, 1
NEX, and 20 cm FOV; 4) three-dimensional
coronal volume spoiled gradient recalled echo
(SPGR) sequence, perpendicular to the
temporal horns, with TR: 34, TE: 13, flip
angle 45 degrees, 2-mm-thick contiguous
slices, matrix 256x 256, 1 NEX, and a
rectangular FOV of 24 x 18 cm.
A dedicated software package (MIDAS)
for image segmentation and
coregistration.18 To evaluate
hippocampus, parahippocampal gyrus,
and entorhinal cortex volumes, images
from the coronal SPGR sequence were
realigned to a standard orientation and
reformatted using sinc interpolation to a
2-mm slice thickness in the coronal plane.

Qualification opinion of low hippocampal volume (atrophy) by MRI for use in clinical trials for regulatory purpose - in pre-dementia stage of Alzheimer’s disease
EMA/CHMP/SAWP/809208/2011 Page 35/49
Study Subject Handling Total
MCI n
qualifying
Cog test
outcome
measure Image Acquisition
Image Reconstruction/Analysis
Manual/semi-Automatic/automatic
Eckerstrom
2008
The Go teborg MCI study
[2] is a clinically based
longitudinal project that
aims at identifying
neurodegenerative,
vascular and stress-
related disorders prior
to the development of
dementia. At baseline
patients and controls
undergo investigations
including neurological,
psychiatric, cognitive
screening,
neuropsychological
testing, MRI, SPECT,
EEG, sampling of blood
and CSF. At biannual
follow-ups, most of
these investigations are
repeated. MRI is done
at the first (two-year)
and the third (six-year)
follow-up.
42
Informant
verification of
a progressive
cognitive
impairment
>6 months.
Plus: positive
outcome on
STEP, I-Flex,
MMSE, or
CDR.
Subjects with
>2 positive
outcomes on
STEP or a
score <25 on
the MMSE,
equaled
dementia and
were
excluded
GDS+4
and ICD-
10 + AD:
NINCDS;
Sub-cort
Vascular
Dementia:
Erkinjuntti
criteria;
FTD: Lund
and
Mancheste
r criteria
Philips NT5 0.5T scanner: 3 sequences: 1 and
2: 3D T1 FFE, coronal and axial with a slice
thickness 1.5mm; Repetition time 30ms;
Echo 10ms; flip angle 40 degrees, FOV 220;
Acquisition Voxel size 0.86mm, reconstructed
voxel 0.86. Sequence 3: T2 TSE slice
thickness 4mm; Repetition time 46820ms;
Echo 120ms; flip angle 90 degrees, FOV 230;
Acquisition Voxel size 0.9/1.13mm,
reconstructed voxel 0.45/0.45.
Manual in the Hipposegm routine — a
software which includes Bayesian noise
reduction and image intensity
normalization. The segmentation process
consisted of two steps: 1. Point- wise
landmark setting was done in the sagittal
view of the reformatted coronal image
where the demarcation in the original
coronal image is indiscernible or difficult
to interpret [47, 48]. 2. Segmentation of
the hippocampus in the coronal images
was done by continuous pen drawing. The
Hipposegm program samples pointwise
from the pen drawing. By means of the
landmark setting, and intensity and noise
preprocessing, the whole hippocampus
including the tail could be segmented
without ad hoc determination of the most
anterior and the most posterior slice

Qualification opinion of low hippocampal volume (atrophy) by MRI for use in clinical trials for regulatory purpose - in pre-dementia stage of Alzheimer’s disease
EMA/CHMP/SAWP/809208/2011 Page 36/49
Study Subject Handling Total
MCI n
qualifying
Cog test
outcome
measure Image Acquisition
Image Reconstruction/Analysis
Manual/semi-Automatic/automatic
Fellgiebel
2006
We enrolled 18 MCI
patients who consulted
the University memory
clinic for diagnostic
evaluation of memory
complaints. MCI was
defined according to the
criteria of Petersen and
a Clinical Dementia
Rating (CDR) of 0.5
13 CDR 0.5 CDR>1 +
DSM IV
To place rectangular regions of interest
(ROIs) and to determine regional index
values, Image-J software was used (NIH,
Bethesda, MD, USA). Individual ROIs
were manually placed bilaterally in the
hippocampal region (Fellgiebel et al.,
2004; Muller et al., 2005). To minimize
susceptibility artifacts, we applied the
largest ROI size. Segmentation and
whole-brain-volume calculation were
carried out with VoxelQ software (Marconi
Systems, Cleveland, OH, USA)
Fleisher
2008
ADNI
ADNI report. Analysis
was only performed on
participants who met
criteria for AD within 36
months, or who
completed a 36-month
visit.
129
CDR 0.5;
MMSE 24-30;
1.5-2.0 SD
below age
adjusted
norms on LM
II
NINCDS;
loss of
function
based on
GDS or
SDCS-ADL
1) A sagittal T1-weighted scan with
contiguous 5-mm slices, 2) a three-
dimensional volumetric spoiled gradient
recalled echo (SPGR or equivalent) scan
obtained in the coronal plane with minimum
full echo-time, minimum repetition time, 124
partitions, 25 degree flip angle, and 1.6 mm
partition thickness. The range in repetition
time was 9.7 msec to 33 msec and the range
in echo time was 3 to 11 msec.
Hippocampal and ERC measurements
were performed by manual tracing. Scans
were interpolated in-plane to the
equivalent of a 512 x 512 matrix and
magnified times two. Anatomic criteria
used to define the boundaries of the
hippocampus and ERC have been
published.

Qualification opinion of low hippocampal volume (atrophy) by MRI for use in clinical trials for regulatory purpose - in pre-dementia stage of Alzheimer’s disease
EMA/CHMP/SAWP/809208/2011 Page 37/49
Study Subject Handling Total
MCI n
qualifying
Cog test
outcome
measure Image Acquisition
Image Reconstruction/Analysis
Manual/semi-Automatic/automatic
Galluzzi
2010
108 subjects
consecutively enrolled
over 24 months with 90
completers
90
Multiple
tests, cutoff:
bottom 5%
NINCDS
MR images (axial T2 weighted proton density,
fluid attenuated inversion recovery, and
gradient echo 3D images) 1.0-T Philips
Gyroscan. TR: 20 ms, TE 5 ms, flip angle 30 ,
field of view 220 mm, acquisition matrix 256
9 256, slice thickness 1.3 mm.
Manually traced ROI. Hippocampal
volume (the smallest between the left
and right side) below the fifth percentile
of the volume distribution (1,970 MicroL)
in a population of 125 normal subjects 60
years and older taken from a study on the
structural features of Normal aging
Galton
2005
Patients recruited from
the Memory Clinic in
Addenbrooke’s Hospital,
Cambridge, for a
longitudinal project, 24
who had undergone
suitable MRI imaging at
entry (V1 = first visit).
31 QD =CDR 0.5 NINCDS three-dimensional spoiled gradient-recalled
T1-weighted sequence NA
Henneman
2009
Memory clinic patients:
64 AD, 44 MCI, 34
controls: 26 patients
with subjective
complaints, 8 healthy
control
44 CDR 0.5 NINCDS
1.0-T scanner. Coronal, three- dimensional,
heavily T1-weighted single slab volume
sequence (magnetization-prepared, rapid
acquisition gradient echo sequence);
rectangular 250 mm field of view with a 256
× 256 matrix; 1.5 mm slice thickness; 168
slices; 1 x 1 mm in plane resolution;
repetition time: 15 msec; echo time 7 msec;
inversion time, 300 msec; flip angle 15o.
Manually delineated using the soft- ware
package Show_Images 3.7.0. L&R HC
volumes were averaged

Qualification opinion of low hippocampal volume (atrophy) by MRI for use in clinical trials for regulatory purpose - in pre-dementia stage of Alzheimer’s disease
EMA/CHMP/SAWP/809208/2011 Page 38/49
Study Subject Handling Total
MCI n
qualifying
Cog test
outcome
measure Image Acquisition
Image Reconstruction/Analysis
Manual/semi-Automatic/automatic
Herukka
2008
21 MCI subjects
followed for average 4.1
years.
21
cdr 0.5 plus
1.5SD below
N on other
cog test
NINCDS
1.5 Tesla Vision, rapid acquisition gradient
echo sequence (for the 1998/1999 patients:
TR = 9.7 ms, TE = 4 ms, matrix 256 × 256, 1
acquisition and in plane resolution = 0.98
mm. For 1999/2000/2001 patients: TR =
13.5, TE = 7, matrix 256x256, 1 acquisition
and in plane resolution = 0.94 mm.
Manual tracing.
Jack
2010
ADNI
218 MCI follow up 1.7
ys 218
CDR 0.5;
MMSE 24-30;
1.5-2.0 SD
below age
norms on LM
II ADAS-cog
11
DSM IIIR
+ NINCDS 1.5 T 3D MPRAGE.
FreeSurfer. Correction gradient non-
linarity, B1 non-uniformity.
Jack
2008
Vitamin E and donepezil
treatment in 769 aMCI
follow up 36 months.
131
Peterson
criteria + LM
II
NINCDS
1.5 T, 24 scanners from GE, Siemens, Philips.
3D T1 coronal SPGR: TR/TE = 9.7-33/3-11
mse. Filp angle: 25 °. 124 continuous
partitions.
Central data analysis at Mayo Clinic in
Rochester, MN. Manual tracing.
Jack
2005
91 controls, 72 MCI,
follow up 1-2 ys. 72
Peterson
criteria Unk 1.5 T GE: 3D T1 SPGR.
Spatial registration of scan 2 to scan 1.
Manually trace hippocampus.
Jack
2000
58 control, 43 MCI, 28
AD. Follow up 3 ys. 43
Peterson
criteria +
CDR 0.5
DSM IIIR
+ NINCDS
1.5 T GE: 3D T1 SPGR, 124 continuous
partitions, 1.6 mm slice thickness, FOV: 22 ×
16.5 cm, 192 views, and 45 ° flip angel.
Manual tracing. Imaging data interpolated
inplane equivalent to matrix 512 × 512
and magnified 2X. Volume converts to W
score.
Jack
1999
80 MCI follow up 32.6
month 80
Peterson
criteria incl.
1.5 SD below
on cog test +
CDR 0.5
CRR0.5
1.5 T GE: 3D T1 SPGR, 124 continuous
partitions, 1.6 mm slice thickness, FOV: 22 ×
16.5 cm, 192 views, and 45 ° flip angel.
Manual tracing. Imaging data interpolated
inplane equivalent to matrix 512 × 512
and magnified 2X. Volume converts to W
score.

Qualification opinion of low hippocampal volume (atrophy) by MRI for use in clinical trials for regulatory purpose - in pre-dementia stage of Alzheimer’s disease
EMA/CHMP/SAWP/809208/2011 Page 39/49
Study Subject Handling Total
MCI n
qualifying
Cog test
outcome
measure Image Acquisition
Image Reconstruction/Analysis
Manual/semi-Automatic/automatic
Kantarci
2005
54 normal, 21 aMCI.
Follow up 36-42 months 21
aMCI meet
criteria of
Peterson.
DSM IIIR
+ NINCDS 1.5 T GE: 3D T1 SPGR.
Manual tracing. Volumes convert to W
scores
Killany
2002
18 control, 94
questionable AD, 16 AD. 94 CDR 0.5
CDR1 +
NINCDS
1.5 T GE T1 2D coronal: TR/TE = 35/5 mse.
Filp angel: 45 °, FOV: 22 cm, matrix 256 ×
256, slice thickness: 1.5 mm.
Hippocampus was manually drawn after
normalization process in standard coronal
plane.
Landau
2010
ADNI
193 AD, 229 normal, 28
MCI converter, and 57
MCI nonconverters.
Follow up to 36 months.
85
CDR 0.5;
MMSE 24-30;
1.5-2.0 SD
below age
adjusted
norms on LM
IIADAS-cog
11
NINCDS
Consensus
1.5 T multiple ADNI site with standardized
MRI protocol
FreeSurfer software. More info in
appendix e1 on neurology
Leung
2010
ADNI
200 control, 335 MCI,
147 AD. Follow up 12
months.
335
CDR 0.5;
MMSE 24-30;
1.5-2.0 SD
below age
adjusted
norms on LM
II
NINCDS;
loss of
function
based on
GDS or
SDCS-ADL
1.5 T GE, Philips, Siemens: T1 weighted
TR/TE/TI: 2400/3.5/1000 mse, flip angle =
8°. 160 or 180 sagittal, slice thickness 1.2
mm. matrix 192 × 192 or 256 × 256 with
voxel resolution 1.25 × 1.25 × 1.2 mm, or
0.95 × 0.95 × 1.2 mm.
ADNI MR imaging protocol:
postacquization correction of gradient
warping, B1 non-uniformity correction
depending on the scanner and coil type,
intensity non-uniformity correction and
phantom based scaling correction - the
geometric phantom scan have been
acquired with each patient scan.
Stoub
2010
35 normal controls, 33
aMCI, 14 probable AD.
All follow up to 5ys.
33 LM II NINCDS
1.5 T GE Signa scanner: 3D SPGR 124
contiguous 1.5 mm slice thickness in coronal
plane (TR/TE: 33.3/7 mse). FOV: 22 cm,
matrix: 256 × 192. Flip angle = 35°, signal
average = 1.
Analyze software package (Mayo Clinic
Foundation, Rochester, MN). Manual
volumetry.

Qualification opinion of low hippocampal volume (atrophy) by MRI for use in clinical trials for regulatory purpose - in pre-dementia stage of Alzheimer’s disease
EMA/CHMP/SAWP/809208/2011 Page 40/49
Study Subject Handling Total
MCI n
qualifying
Cog test
outcome
measure Image Acquisition
Image Reconstruction/Analysis
Manual/semi-Automatic/automatic
Tapiola
2008 excluded
Visser
1999
20 normal, 18 minimal
dementia, 7 demented.
All follow up to 3 ys.
18
Not meet
DSM IIIR for
dementia but
with
cognitive
deficits.
NINCDS
0.6 T Teslacon II: 2D T1 coronal (TR/TE:
300/22 mse) in-plane resolution 0.8 × 1.0
mm. 6 coronal slices, 5 mm slice thickness
with 1.0 mm gap.
Manual with 0.5mm slice thickness and
1mm between slices. Volumetry
quantified via SUN workstation with
software developed in house
Visser
2002 excluded
Wang
2009 excluded
Whitwell
2008
21 aMCI-S (monitor >
18 months), 42 aMCI-P
(monitor > 3 ys).
63
1-1.5SD
below norms
on at least
one: LM II,
AVLT, FCSRT,
NINCDS
No scanner info: 3D T1 coronal volumetric
SPGR, 124 contiguous 1.6 mm thickness.
FOV: 22 × 16.5 or 24 × 18.5 cm. flip angel:
25 °.
VBM using SPM2
(http://www.hip.ion.ucl.ac.uk/spm)

Qualification opinion of low hippocampal volume (atrophy) by MRI for use in clinical trials for regulatory purpose - in pre-dementia stage of Alzheimer’s disease
EMA/CHMP/SAWP/809208/2011
Page 41/49
CHMP/SAWP question 3
Which studies in particular have used the Dubois's criteria as evidence for the qualification?
Applicant’s response
Dubois et al., (Research criteria for the diagnosis of Alzheimer's disease: revising the NINCDS-ADRDA
criteria. Lancet Neurol. 2007 Aug; 6(8):734-46) specified new research criteria for AD (Alzheimer’s
disease) to define early onset patients that now are termed “prodromal AD”. The recent attention to
prodromal AD in the AD research community is aimed at facilitating clinical trials in patients at a stage
when interventions will have the best chance of success. Such definitions continue to evolve, yet the
working definition of the Dubois criteria is that patients have some cognitive level of impairment that
does not yet impair their daily activities, in addition to showing at least one or more of the supportive
biomarker signatures consistent with the pathology of AD. More specifically, the clinical definition
includes a core diagnostic criteria consisting of three items: subjective memory complaint lasting in
excess of six months, an episodic memory abnormality, preferably on a delayed recall measure, and
lastly, the presence or absence of other cognitive domain abnormalities. Patients fulfilling these criteria
would be classified as having probable AD in the prodromal stage (pre-dementia).
Table 5 below specifies the published studies that satisfy the criteria of patients with cognitive
impairment in addition to testing positive for at least one AD biomarker, in this case structural MRI, to
assess medial temporal lobe atrophy. Such studies have been indicated under the column heading,
“Episodic Memory Deficit and Biomarker” with an “X”.
Table 5: studies that satisfy the criteria of patients with cognitive impairment in addition to
testing positive for at least one AD biomarker (MRI)
Study Episodic Memory Deficit and
Biomarker
Used other Criteria (specify which
criteria used)
Bakkour A 2009 CDR* 0.5
Convit, A 2000 X
Desikan RS 2009 X
Desikan RS 2008 X
Devanand DP 2007 X
Eckerstrom C 2008 X
Fellgiebel A 2006 X
Fleisher AS 2008 X
Galluzzi S 2010 X
Galton CJ 2005 CDR* 0.5
Henneman WJP 2009 X
Herukka SK 2008 X
Jack CR 2010 X
Jack CR 2008 X
Jack CR 2005 X
Jack CR 2000 X
Jack CR 1999 X
Kantarci K 2005 X
Killiany RJ 2002 CDR* 0.5

Qualification opinion of low hippocampal volume (atrophy) by MRI for use in clinical trials for regulatory purpose - in pre-dementia stage of Alzheimer’s disease
EMA/CHMP/SAWP/809208/2011 Page 42/49
Landau SM 2010 X
Leung KK 2010 X
Stoub TR 2010 X
Tapiola T 2008 X
Visser PJ 1999 X
Visser PJ 2002 X
Wang PN 2009 X
Whitwell JL 2008 X *Clinical Dementia Rating scale
CAMD thus posits that the majority (24 of 27 total) of the submitted articles selected their patients on
a basis that is similar, if not identical, to the Dubois criteria. Note that the Dubois paper was published
in 2007, after the majority of the studies had begun; therefore, it was not necessarily possible for most
of the authors to specify that they were adhering to the as yet unpublished Dubois criteria. On an
examination of the submitted research papers, most subjects were included on the basis of an
objective cognitive loss, i.e., episodic memory impairment plus hippocampal volume as the biomarker.
The remaining three citations refer to the use of CDR (Clinical Dementia Rating scale) as the clinical
diagnostic approach. The CDR scale does measure memory, including delayed memory, however the
results are not typically calibrated to a standard deviation below the mean as suggested by Dubois;
therefore, these studies are noted separately in the table as “CDR 0.5”. In summary, CAMD’s
understanding of the presented studies is that the majority of the citations included in the submission
dossier are in line with Dubois’ published criteria for diagnosis as prodromal AD.
CHMP/SAWP Question 4 In published cohorts in which other biomarkers were involved, what was the predictive
value of the different biomarkers for an indication and population similar to those intended
in this submission, and particularly the positive and negative predictive value of the MRI
hippocampal volume in comparison to others more easily to standardize (eg. CSF
biomarkers) or likely related (MRI volume of entorhinal cortex and amygdala) or in a
combination approach?
Which was the time to conversion to probable AD, percentage of converters in a particular
timing?
Which was the expected rate of conversion to AD in those groups studied by the biomarkers
in comparison with a population not fulfilling such criteria?
Applicant’s response
There are several biomarkers that are currently being used for the purpose of enrichment of clinical
trials in early AD subjects, including biochemical assessment of CSF Aβ42, tau and p-tau levels, PET
imaging of amyloid, metabolic activity (FDGPET), cerebral perfusion (SPECT) and structural
neuroimaging. Each biomarker has advantages and disadvantages in terms of ease of use, cost and
invasiveness to patients. Relative to the other biomarkers, vMRI (volumetric magnetic resonance
imaging) has the advantage of being noninvasive and has widespread applicability. In comparing vMRI
to other biomarkers, the hippocampal volume is a well-established biomarker for predicting conversion
from prodromal AD to AD dementia and the only known biomarker that correlates with cognitive
decline during the course of disease progression. While the research field has expressed interest in the

Qualification opinion of low hippocampal volume (atrophy) by MRI for use in clinical trials for regulatory purpose - in pre-dementia stage of Alzheimer’s disease
EMA/CHMP/SAWP/809208/2011 Page 43/49
application of amyloid PET imaging as another tool to assist with patient selection in early AD trials, the
requirement for radiotracer administration, challenges with quantification, and the lack of change of
amyloid signal with disease progression and conversion makes this approach less appealing. At
present, the field is not yet at a stage to employ combinatorial imaging biomarker measurements
beyond research purposes as highlighted in a recent webinar focused on early AD biomarkers
(http://www.alzforum.org/res/for/journal/detail.asp?liveID=192).
Quantitative measures of the hippocampus are the most relevant as compared to other brain regions in
AD brain. The hippocampus plays an important role in the consolidation of information from short-term
memory to long-term memory. Indeed, human subjects with lesions of the hippocampus show
anterograde amnesia. While other brain regions do exhibit volumetric reductions in AD patients as a
result of widespread neuronal loss, these regions, such as the amygdala, do not subserve memory
functions and neuronal loss and atrophy occurs later in the course of the disease. Furthermore, regions
such as the amygdala and entorhinal cortex are more challenging to measure in standard MRI acquired
images, show greater inter-subject variability and are far less standardized than hippocampal
measurements. In summary, at a comparative level, standardization and harmonization of vMRI
hippocampal measurements are further advanced than is currently possible with CSF (cerebrospinal
fluid) or other biomarkers.
In addition to providing an extensive literature review in support of our proposed context of use, CAMD
performed a de novo analysis of the performance of hippocampal volume from publically available data
from the Alzheimer’s Disease Neuroimaging Initiative (ADNI).The US National Institutes of Health’s
(NIH) largest public-private partnership on brain research, ADNI tracks normal, “mildly cognitively
impaired” (MCI), and Alzheimer’s disease brain changes to measure disease progression. ADNI
contributing members include the NIH, 20 pharmaceutical companies and two non-profit organizations.
ADNI is using MRI and PET imaging, as well as laboratory and cognitive testing, of 821 normal, mildly
cognitively impaired, and Alzheimer’s disease patients. Among the goals of the study is to provide
better tools for carrying out effective clinical trials and identifying biomarkers that can predict clinical
outcome. ADNI has been extended to now include similar efforts in Europe (Pilot E-ADNI) and other
sites worldwide (Japan, Australia). In 2010, the ADNI study was provided continued support to focus
on participants with very early stages of memory loss (ADNI Go). Because of the large sample size,
scientific rigor with which the data were collected, public availability, and inclusive use of biomarkers,
CAMD members selected this dataset as the dataset upon which to base our biomarker analysis and
comparison to literature described in the submission dossier.
At present, there are four published image analysis quantification methodologies (LEAP, NeuroQuant,
FreeSurfer, and HMAPs) suitable for assessing hippocampal volume in standardly acquired MRI images.
Table 6, below (data presented to the SAWP on 25 August 2011), represents a comparison of the de
novo analysis of ADNI baseline vMRI of the hippocampus showing the ROC (Receiver Operating
Characteristic) results {as AUC (Area Under the Curve) value} from the four methodologies, with the
published literature accepted for the review for which AUC data are available. The four different
methodologies yield very similar (not significantly different) results and, taken together, are also
similar to the published literature, with regard to patient populations, study length, vMRI acquisition,
and reported AUC.

Table 6: Comparison between published and de novo ADNI analysis.
Study
N
training/testing
ROC
AUC
LEAP 149/173 0.7565
NeuroQuant 149/173 0.7516
FreeSurfer 148/171 0.7536 De Novo ADNI data
HMAP 128/161 0.7290
Bakkour 49 0.65
Devanand 139 0.77
Fleisher 129 0.604
Reported AUC from published
literature
Galluzzi 90 0.73
Differences in number of subjects (N) in training and testing subsets across the four ADNI studies are due to the specifics of the
methodology requirements for these four analyses (i.e., LEAP, NeuroQuant, FreeSurfer, HMAP).
The SAWP requested further information comparing the performance of CSF and hippocampal volume
in predicting conversion to AD. For this comparison, as originally presented to the SAWP on 29 June
2011, CAMD performed an additional analysis of the ADNI dataset and reported the results of
progression at the two year time point (Figure 6, below). Comparison of the AUC values of baseline
vMRI of hippocampus and CSF analytes (Aβ; Phospho-τ; Total τ; single and combined) indicate that
vMRI in this dataset is as good as, or slightly better at, predicting conversion to AD than CSF analytes;
specifically, a greater ROC AUC was observed for MRI than CSF biomarkers in this comparison.
Figure 6: Comparison of AUC values of baseline vMRI data predicting conversion to AD to AUC values
of CSF analytes predicting conversion to AD in 2 years.
The MRI range= 0.69—0.73 and CSF range= 0.63—0.67 {Aβ =0.67; Phospho-τ= 0.66; Total τ =0.63; All (linear comb.) = 0.63}.
Qualification opinion of low hippocampal volume (atrophy) by MRI for use in clinical trials for regulatory purpose - in pre-dementia stage of Alzheimer’s disease
EMA/CHMP/SAWP/809208/2011 Page 44/49

Qualification opinion of low hippocampal volume (atrophy) by MRI for use in clinical trials for regulatory purpose - in pre-dementia stage of Alzheimer’s disease
EMA/CHMP/SAWP/809208/2011 Page 45/49
CHMP discussion
The relative value of this biomarker as compared to other potential biomarkers (e.g. CSF analytes) or
compared to other patients’ characteristics associated to the rate of conversion to AD (e.g. age and
cognitive tests) is still not fully established.
The de-novo analyses performed by the Sponsor on the ADNI dataset shows a statistically significant
association of MRI hippocampal volume with conversion to AD. The association appears strong enough
so as to accept its qualification for the intended purpose. It would have been desirable to be able to
assess the independent value of this MRI biomarker in terms of predictive value as a single
dichotomized marker (low vs normal volume), assessing it independently of the value of other
determinants of conversion such as age and cognitive tests (ADAS-cog) which have been considered
simultaneously in the prognostic model. However, this is difficult with the data currently available.
To facilitate the design of the intended “enriched” clinical trials, it would have been useful to
characterize the conversion free survival functions according to the studied MRI biomarker, describing
the probability of conversion for different time points for those with MRI low hippocampal volume and
those with normal MRI images but, again, this is difficult with the available datasets.
CHMP Qualification opinion
Low hippocampal volume, as measured by MRI and considered as a dichotomized variable (low volume
or not), appears to help enriching recruitment into clinical trials aimed at studying drugs potentially
slowing the progress/conversion to AD dementia of the included subjects. Low hippocampal volume
might be considered a marker of progression to dementia in subjects with cognitive deficit compatible
with predementia stage of AD (Dubois 2007), for the purposes of enriching a clinical trial population.
However, neither the actual value of low hippocampal volume to accurately predict rate of such
progression to dementia in the referred subjects nor the relative value of other biomarkers have been
reported.
As currently planned in the current opinion subjects might be included in the studies based on clinical
criteria and low hippocampal volume biomarker (if positive). The CHMP has given a previous positive
opinion in the predementia stage of Alzheimer’s disease: cerebro - spinal fluid related biomarkers for
drugs affecting amyloid burden. This may lead first to a heterogeneous population and, moreover, it
will not be possible to explore the relationship among them.
The concurrent assessment of other qualified biomarkers in predementia AD would be highly desirable
and of greatest value.
Collection, handling and measurements of Low hippocampal volume, as measured by MRI should be
performed according to Good Clinical Practice and to the specific highest international standards for
these measurements.
Low hippocampal volume, as measured by MRI is not qualified as diagnostic tool or outcome or
longitudinal measure.

Qualification opinion of low hippocampal volume (atrophy) by MRI for use in clinical trials for regulatory purpose - in pre-dementia stage of Alzheimer’s disease
EMA/CHMP/SAWP/809208/2011 Page 46/49
References
Brewer, J. (2009). Fully-automated volumetric MRI with normative ranges: translation to clinical
practice. Behavioural Neurology, 21(1), 21-28.
Fischl, B., Salat, D., Busa, E., Albert, M., Dieterich, M., Haselgrove, C., et al. (2002, January 31).
Whole brain segmentation: automated labeling of neuroanatomical structures in the human brain.
Neuron, 33(3), 341-355.
Higgins, J., & Green, S. (2011, March). Cochrane Handbook for Systematic Reviews of Interventions
Version 5.1.0. Retrieved June 9, 2011, from The Cochrane Collaboration: http://www.mrc-
bsu.cam.ac.uk/cochrane/handbook/.
Holland, D., Brewer, J., Hagler, D., Fennema-Notestine, C., Dale, A., & Alzheimer’s Disease
Neuroimaging Initiative. (2009, December 8). Subregional neuroanatomical change as a biomarker for
Alzheimer’s disease. Proc Natl Acad Sci, 106(49), 20954-20959.
Leung, K., Barnes, J., Ridgway, G., Bartlett, J., Clarkson, M., Macdonald, K., et al. (2010, July 15).
Automated cross-sectional and longitudinal hippocampal volume measurement in mild cognitive
impairment and Alzheimer's disease. Neuroimage, 51(4), 1345-1359.
Wolz, R., Aljabar, P., Hajnal, J., Hammers, A., Rueckert, D., & Alzheimer's Disease Neuroimaging
Initiative. (2010, January 15). LEAP: learning embeddings for atlas propagation. Neuroimage, 49(2),
1316-1325.
Bibliographic listing of all accepted studies
“Population Overlap” studies are included here but not in the submitted Table 2.
Bakkour A, Morris JC, Dickerson BC. The cortical signature of prodromal AD: regional thinning predicts
mild AD dementia. Neurology. 2009;72(12):1048-1055.
Convit A, de Asis J, de Leon MJ, Tarshish CY, De Santi S, Rusinek H. Atrophy of the medial
occipitotemporal, inferior, and middle temporal gyri in non-demented elderly predict decline to
Alzheimer's disease. Neurobiol Aging. 2000;21(1):19-26.
Desikan RS, Cabral HJ, Fischl B, et al. Temporoparietal MR imaging measures of atrophy in subjects
with mild cognitive impairment that predict subsequent diagnosis of Alzheimer disease. AJNR Am J
Neuroradiol. 2009;30(3):532-538.
Desikan RS, Fischl B, Cabral HJ, et al. MRI measures of temporoparietal regions show differential rates
of atrophy during prodromal AD. Neurology. 2008;71(11):819-825.
Devanand DP, Pradhaban G, Liu X, et al. Hippocampal and entorhinal atrophy in mild cognitive
impairment: prediction of Alzheimer disease. Neurology. 2007;68(11):828-836.
Population Overlap Eckerstrom C, Andreasson U, Olsson E, et al. Combination of hippocampal volume
and cerebrospinal fluid biomarkers improves predictive value in mild cognitive impairment. Dementia
and Geriatric Cognitive Disorders. 2010;29(4):294-300.
Eckerstrom C, Olsson E, Borga M, et al. Small baseline volume of left hippocampus is associated with
subsequent conversion of MCI into dementia: the Goteborg MCI study. J Neurol Sci. 2008;272(1-
2):48-59.

Qualification opinion of low hippocampal volume (atrophy) by MRI for use in clinical trials for regulatory purpose - in pre-dementia stage of Alzheimer’s disease
EMA/CHMP/SAWP/809208/2011 Page 47/49
Fellgiebel A, Dellani PR, Greverus D, Scheurich A, Stoeter P, Muller MJ. Predicting conversion to
dementia in mild cognitive impairment by volumetric and diffusivity measurements of the
hippocampus. Psychiatry Res. 2006;146(3):283-287.
Fleisher AS, Sun S, Taylor C, et al. Volumetric MRI vs clinical predictors of Alzheimer disease in mild
cognitive impairment. Neurology. 2008;70(3):191-199.
Population Overlap Apostolova LG, Thompson PM, Green AE, et al. 3D comparison of low, intermediate,
and advanced hippocampal atrophy in MCI. Human Brain Mapping. 2010;May;31(5):786-797.
Galluzzi S, Geroldi C, Ghidoni R, Paghera B, Amicucci G, Bonetti M, Zanetti O, Cotelli M, Gennarelli, M,
Frisoni GB and the Translational Outpatient Memory Clinic Working Group. The new Alzheimer’s criteria
in a naturalistic series of patients with mild cognitive impairment. J Neurol. 2010;257:2004–2014.
Galton CJ, Erzinclioglu S, Sahakian BJ, Antoun N, Hodges JR. A comparison of the Addenbrooke's
Cognitive Examination (ACE), conventional neuropsychological assessment, and simple MRI-based
medial temporal lobe evaluation in the early diagnosis of Alzheimer's disease. Cogn Behav Neurol.
2005;18(3):144-150.
Henneman WJ, Sluimer JD, Barnes J, et al. Hippocampal atrophy rates in Alzheimer disease: added
value over whole brain volume measures. Neurology. 2009;72(11):999-1007.
Herukka SK, Pennanen C, Soininen H, Pirttila T. CSF A(beta)42, tau and phosphorylated tau correlate
with medial temporal lobe atrophy. Journal of Alzheimer's Disease. 2008;14(1):51-57.
Jack CR, Jr, Petersen RC, et al. Longitudinal MRI findings from the vitamin E and donepezil treatment
study for MCI. Neurobiol Aging. 2008;29(9):1285-1295.
Jack CR, Jr, Petersen RC, et al. Rates of hippocampal atrophy correlate with change in clinical status in
aging and AD. Neurology. 2000;55(4):484-489.
Jack CR, Jr, Petersen RC, et al. Prediction of AD with MRI-based hippocampal volume in mild cognitive
impairment. Neurology. 1999;52(7):1397-1403.
Jack CR, Jr, Shiung MM, et al. Brain atrophy rates predict subsequent clinical conversion in normal
elderly and amnestic MCI. Neurology. 2005;65(8):1227-1231.
Population Overlap Jack CR, Jr, Shiung MM, et al. Comparison of different MRI brain atrophy rate
measures with clinical disease progression in AD. Neurology. 2004;62(4):591-600.
Jack CR, Heather J, Wiste HJ, Vemuri P, Weigand SD, Senjem ML, Zeng G, Bernstein MA, Gunter JL,
Pankratz VS, Aisen PS, Weiner MJ, Petersen RC, Shaw LM, Trojanowski JQ, Knopman DS, and the
Alzheimer’s Disease Neuroimaging Initiative. Brain beta-amyloid measures and magnetic resonance
imaging atrophy both predict time-to-progression from mild cognitive impairment to Alzheimer’s
disease. Brain. 2010;133:3336–3348.
Kantarci K, Petersen RC, Boeve BF, et al. DWI predicts future progression to Alzheimer disease in
amnestic mild cognitive impairment. Neurology. 2005;64(5):902-904.
Killiany RJ, Hyman BT, Gomez-Isla T, et al. MRI measures of entorhinal cortex vs. hippocampus in
preclinical AD. Neurology. 2002;58(8):1188-1196.
Landau SM, Harvey D, Madison CM, et al. Comparing predictors of conversion and decline in mild
cognitive impairment. Neurology. 2010;Jul 20;75(3):230-238.
Qualification opinion of low hippocampal volume (atrophy) by MRI for use in clinical trials for regulatory purpose - in pre-dementia stage of Alzheimer’s disease
EMA/CHMP/SAWP/809208/2011 Page 48/49
Leung KK, Barnes J, Ridgway GR, et al. Automated cross-sectional and longitudinal hippocampal
volume measurement in mild cognitive impairment and Alzheimer's disease. NeuroImage.
2010;51(4):1345-1359.
Population Overlap Lorenzi M, Donohue M, Paternico D, et al. Enrichment through biomarkers in clinical
trials of Alzheimer's drugs in patients with mild cognitive impairment. Neurobiology of Aging.
2010;31(8):1443-1451.e1441.
Stoub TR, Rogalski EJ, Leurgans S, Bennett DA, deToledo-Morrell L. Rate of entorhinal and
hippocampal atrophy in incipient and mild AD: Relation to memory function. Neurobiology of Aging.
2010;31(7):1089-1098.
Tapiola T, Pennanen C, Tapiola M, et al. MRI of hippocampus and entorhinal cortex in mild cognitive
impairment: a follow-up study. Neurobiol Aging. 2008;29(1):31-38.
Visser PJ, Scheltens P, Verhey FR, et al. Medial temporal lobe atrophy and memory dysfunction as
predictors for dementia in subjects with mild cognitive impairment. J Neurol. 1999;246(6):477-485.
Visser PJ, Verhey FR, Hofman PA, Scheltens P, Jolles J. Medial temporal lobe atrophy predicts
Alzheimer's disease in patients with minor cognitive impairment. J Neurol Neurosurg Psychiatry.
2002;72(4):491-497.
Wang PN, Liu HC, Lirng JF, Lin KN, Wu ZA. Accelerated hippocampal atrophy rates in stable and
progressive amnestic mild cognitive impairment. Psychiatry Res. 2009;171(3):221-231.
Population Overlap Wang PN, Lirng JF, Lin KN, Chang FC, Liu HC. Prediction of Alzheimer's disease in
mild cognitive impairment: A prospective study in Taiwan. Neurobiology of Aging. 2006;27(12):1797-
1806.
Whitwell JL, Shiung MM, Przybelski SA, et al. MRI patterns of atrophy associated with progression to
AD in amnestic mild cognitive impairment. Neurology. 2008;70(7):512-520.

Qualification opinion of low hippocampal volume (atrophy) by MRI for use in clinical trials for regulatory purpose - in pre-dementia stage of Alzheimer’s disease
EMA/CHMP/SAWP/809208/2011 Page 49/49
LIST OF ABBREVIATIONS
CSF Cerebrospinal fluid
MCI Mild Cognitive Impairment
HC HippoCampus
vMRI Volumetric MRI
aMCI Amnestic Mild Cognitive Impairment
RRs
Relative Risks