hippocampal atrophy inrecurrent major depression - pnas.org · 3910 medical sciences: sheline et...
TRANSCRIPT

Proc. Natl. Acad. Sci. USAVol. 93, pp. 3908-3913, April 1996Medical Sciences
Hippocampal atrophy in recurrent major depressionYVETTE I. SHELINE*tS, PO W. WANG*§, MOKHTAR H. GADOtS, JOHN G. CSERNANSKY*,AND MICHAEL W. VANNIERttDepartments of *Psychiatry and tRadiology, and tMallinckrodt Institute of Radiology, Washington University School of Medicine, St. Louis, MO 63110
Communicated by Erminio Costa, University of Illinois, Chicago, IL, December 27, 1995 (received for review October 10, 1995)
ABSTRACT Hippocampal volumes of subjects with ahistory of major depressive episodes but currently in remis-sion and with no known medical comorbidity were comparedto matched normal controls by using volumetric magneticresonance images. Subjects with a history ofmajor depressionhad significantly smaller left and right hippocampal volumeswith no differences in total cerebral volumes. The degree ofhippocampal volume reduction correlated with total duration ofmajor depression. In addition, large (diameter 2 4.5 mm)-hippocampal low signal foci (LSF) were found within the hip-pocampus, and their number also correlated with the totalnumber of days depressed. These results suggest that depressionis associated with hippocampal atrophy, perhaps due to aprogressive process mediated by glucocorticoid neurotoxicity.
Dysregulation of the hypothalamic-pituitary-adrenal axis re-sulting in hypercortisolemia has been studied for many yearsas a biological characteristic of acute major depression (1).Young et al. (2) have shown that depression is accompanied bydysregulation in the fast-feedback control of cortisol secretion,possibly at the level of the hippocampus. Work in experimentalsystems suggests that this disinhibition can be induced bychronic corticosteroid exposure or by stress alone (3, 4).The precise mechanisms by which stress or depression
disturb hippocampal regulation of cortisol function are un-known, but recent studies have raised the possibility thatneurotoxic tissue damage is involved. The work of Sapolsky etal. (3, 5, 6) has demonstrated that rats injected repeatedly withglucocorticoids develop hippocampal neuronal loss, perhapsdue to enhanced neuronal vulnerability to glutamate neuro-toxicity (7). Rats exposed to stress (8) or exposed relativelybriefly to glucocorticoids (daily injection for 3 weeks) (9) haveshortening and atrophy of hippocampal dendritic processes.These experimental studies raise the possibility that humans
experiencing recurrent depressive episodes and elevated levelsof glucocorticoids might also sustain neurotoxic damage tohippocampal neurons. While adequate pathological studieshave not been conducted to test this hypothesis in affectivedisorders (10), a radiologic hallmark of such neurotoxic dam-age might be hippocampal volume loss. Supporting this idea,a recent volumetric magnetic resonance image (MRI) studyhas demonstrated right-sided hippocampal volume decrease incombat-related posttraumatic stress disorder (11). To date,however, no evidence of hippocampal volume loss has beenfound in association with major depression (12), although MRIabnormalities in hippocampal spin-lattice relaxation time (T1)characteristics have been reported (13).The present study evaluated hippocampal volume in older
women with recurrent major depression by using high-resolution MRI and stereological measurement. Based on theglucocorticoid hypothesis described above, we hypothesizedthat hippocampal volume loss related to depression would beage- and duration-dependent. To reduce the influence of
The publication costs of this article were defrayed in part by page chargepayment. This article must therefore be hereby marked "advertisement" inaccordance with 18 U.S.C. §1734 solely to indicate this fact.
extraneous factors that may affect brain volume, subjects werescreened to exclude medical disorders other than depression.
METHODSSubject Selection. Subjects were recruited from the Memory
and Aging Project of the Alzheimer's Disease Research Centerand the outpatient psychiatry service at the WashingtonUniversity School of Medicine. Subjects, ranging in age from51 to 86 years old (mean = 68; median = 68), were all femaleand right-handed. The choice was made to select all womenbecause it eliminated brain differences due to gender (14, 15),decreased the possibility of hypertension and occult cardio-vascular disease, and increased the ability to obtain subjects,although at the cost of generalizability. Each depressed subjectwas matched using a case-control design for age and educa-tional level, and the groups were matched overall for height,since this variable is a predictor of overall brain size (16).Potential subjects were screened by questionnaire, medicalhistory, review of medical records, and physical exam toexclude those with medical problems potentially affecting thecentral nervous system, such as a current or past neurologicaldisorder, head trauma, hypertension, myocardial infarction orischemia, diabetes, Cushings disease, steroid use, or drug/alcohol abuse. These exclusionary criteria were consistent withroutine Alzheimer's Disease Research Center screening cri-teria (17). In addition, subjects who had received more thanthree courses of electroconvulsive therapy (ECT) were ex-cluded. Three subjects included in the study had received ECTpreviously during the course of their treatment, and the timeelapsed since last ECT treatment was 34, 30, and 14 years. Allsubjects gave informed consent.
All subjects were assessed clinically by a psychiatrist (Y.I.S.)experienced in the use of the diagnostic interview for geneticstudies (DIGS), a structured interview with high reliability(18). The DIGS was used to make the diagnosis of recurrentmajor depression by American Psychiatric Association's Di-agnostic and Statistical Manual of Mental Disorders, 4thEdition (DSM-IV) criteria and to exclude other psychiatricdiagnoses. Only depressive episodes that met full criteria formajor depression were included. Time elapsed (months) sincelast depressed was determined. One subject with a singleepisode of major depression was included. In addition, theDIGS was used to score each depressive episode for duration(in days) and number of symptoms, which were identical tothose used to make the diagnosis of major depression byDSM-IV criteria. The average number of depressive symptomsover the course of the total depressive episodes was deter-mined. This was determined by averaging the number ofsymptoms occurring in each depressive episode (a minimum offive symptoms was required to qualify for the diagnosis ofmajor depression and the maximum number of symptoms wasnine). Subjects with current acute depression were excludedfrom the study to eliminate potential confounds related to
Abbreviations: MRI, magnetic resonance image; LSF, low signal foci;DIGS, diagnostic interview for genetic studies; ECT, electroconvulsivetherapy; CE, coefficient of error; HRSD, Hamilton rating scale fordepression.§Present address: Department of Psychiatry and Behavioral Sciences,Stanford University, Palo Alto, CA.
3908

Proc. Natl. Acad. Sci. USA 93 (1996) 3909
state-dependent changes (e.g., hypercortisolemia) in MRIvolumetric measurements, and none of the subjects had beenacutely depressed within the past 6 months. Eight of the 10depressed subjects were receiving antidepressants: selectiveserotonin reuptake inhibitors in three cases, tricyclic antide-pressants in three cases, and maprotiline and trazodone in onecase each. Antidepressant status and doseage in milligramswere determined. Two patients had previously been treatedwith neuroleptics, one with chlorpromazine and one withhaloperidol. In both cases the duration of treatment was brief,and neither patient was psychotic at the time of treatment.Patients and controls were also assessed using the Hamiltonrating scale for depression (HRSD) (19) to determine thepresence and severity of any current symptoms.
Cortisol Measurement. Blood samples were obtained tomeasure cortisol concentrations at 8:00 a.m. on the day before(baseline) and the day following oral administration of 1 mgdexamethasone at 11:00 p.m. (dexamethasone suppressiontest). Plasma was obtained within 1 hr of obtaining eachsample by centrifuging the sample at -1000 x g for 15 min. Allplasma samples were stored at -20°C before assay by using acommercially available kit (ICN).Magnetic Resonance Scan Parameters. MRI scans were
obtained using a Magnetom SP-4000 1.5T imaging system(Siemens, Iselin, NJ) and a standard Siemens 30-cm circularlypolarized rf head coil. Anatomic images, consisting of 128contiguous 1.25-mm thick sagittal slices, were acquired usingmagnetization prepared rapid gradient echo (MPRAGE), afast gradient echo magnetic resonance acquisition. No seda-tion was used during scanning. Specific MPRAGE scanningparameters were TR = 10 ms, TE = 4 ms, inversion time = 300ms, flip angle = 8, matrix = 256 x 256 pixels, voxel size = 1x 1 x 1.25 mm, and slice thickness = 1.25 mm.Preprocessing of Images. Image processing was done on a
graphics workstation (Sun Sparcstation 20; Sun Microsystems,Mountain View, CA) using ANALYZE software (BiomedicalImaging Resource, Mayo Foundation) (20). First, images wereinterpolated from 1.25-mm sections to 0.5-mm sections. Next,images were reoriented to the anterior commissure-posteriorcommissure plane (21) for standard alignment. To minimizeinter-scan variations, MRIs underwent gray scale normaliza-tion as described (22). Gray scale histograms of cylindricalregions-of-interest subvolumes inclusive of the hippocampuswere generated to aid in tissue classification. These subvol-umes were analyzed using PEAKFIT software (Jandel Scientific,San Rafael, CA) by the Marquardt-Levenberg algorithm fornonlinear curve fitting (23, 24) as described (22). Trilinear scalingof magnetic resonance data to 8-bit gray scale resolution wasperformed using these calculated thresholds to generate data setswith high contrast between gray and white matter. To save imageloading time and memory and to increase the regions-of-interestvolume occupied by the hippocampus, left and right medialtemporal lobe cubical subvolumes were interactively defined byan expert observer (Fig. la).
Stereologic Method and Reliability. Two raters (Y.I.S. andP.W.W.) measured unilateral hippocampal gray matter vol-umes after extensive training and assessment standardizationwith a neuroradiologist expert in hippocampal anatomy(M.G.). Volume determination was based on stereologic es-timation methods, which have been used with precision inmicroscopy and magnetic resonance volumetry (25, 26). Fromthree-dimensional MRI cubical subvolumes composed of 0.5x 0.5 x 0.5-mm voxels, coronal slices were sampled every 1.5mm from a randomly chosen start slice. A 7 X 7-mm2 rigid gridof points, with random starting position and angle of deviationfrom horizontal, was then superimposed on the images. Gridpoints falling within the hippocampal gray matter (see defi-nition of hippocampus below) were counted. The ANALYZEprogram allows viewing of grid points simultaneously in threeorthogonal perspectives: sagittal, axial, and coronal (Fig. lb).
a
b::f
.:A
::: ;.B'
FIG. 1. (a) Coronal section through the hippocampus. Cubicvolumes containing the hippocampus were sectioned out from thetotal brain volume. (bI) A randomly placed 7 x 7-mm2 grid overlyingthe hippocampus. Horizontal (II), sagittal (III), and coronal (IV) viewssimultaneously showing bolded crosshair in I. F, fimbria; V.D., verticaldigitation of the hippocampus; Amyg., amygdala; Hip., hippocampus(tail, body, head); Al., alveus; P.G., parahippocampal gyrus.
This provided greater clarity of anatomic localization. Basedon the number of selected grid points, a volume estimate wasextrapolated by ANALYZE. Raters were blind to subject identityand clinical characteristics. Raters measured left and righthippocampi separately. Mean volumes were determined fromthe average of four measurements of each volume, two mea-surements each by two independent raters. The Spearman-Brown prediction formula was used to determine intra-raterand inter-rater reliability (27). Intra-rater correlation coeffi-cients were calculated for left (0.96 and 0.95) and right (0.89and 0.95) hippocampal gray matter volumes volumes. Theoverall coefficient of error (CE) was 0.02. Inter-rater corre-
Medical Sciences: Sheline et al.

3910 Medical Sciences: Sheline et al.
lation coefficients were calculated for left (0.94) and right(0.95) hippocampal volumes based on 17 of 20 measurements.
Rationale for Stereologic Parameters. The coronal orien-tation was chosen as the primary orientation because priorresearch suggested that optimal efficiency is achieved withslices oriented perpendicular to the long axis of the structureof interest (28). However, orthogonal slices could be inspectedas needed (see above). A voxel size of 0.5 mm3 was chosen toachieve maximal resolution while maintaining a workable dataset size. Inter-slice distance and grid size were chosen to yielda CE in the 0.02-0.04 range. Selecting the optimal numbers ofslices and grid sizes are essential for assessing structurallycomplex objects whose profiles change significantly from sliceto slice. Based on prior studies (22), an inter-slice distance of1.5 mm, or every third slice, and a 7 x 7-mm2 grid size resultedin volumes with CEs in the desired range.Anatomic Definition ofthe Hippocampus. Specific rules (29,
30) were used to define anatomical boundaries as follows. (i)Every third coronal slice was assessed, beginning randomlyfrom one of the first three slices at the posterior end of thevolume. Orthogonal views were consulted in cases of anatomicuncertainty, though the coronal view retained priority. (ii)Posteriorly, the tail of the hippocampus continues as theindusium griseum, a thin strip of gray matter overlying thesurface of the corpus callosum. For purposes of measurement,the posterior-most slice for volumetry was defined as the slicewhere the hippocampus first appeared adjacent to the trigoneof the lateral ventricle. (iii) Volumetrically included tissueswere an elongated gray matter complex bordered superiorly bythe fornix-fimbria white matter junction, inferiorly by para-hippocampal gyrus white matter, medially by the subarachnoidspaces of various cisterns (e.g., ambient cistern), and laterallyby the cerebrospinal fluid-filled lateral ventricle. The graymatter complex included the cornu ammonis, dentate gyrus,and subiculum (i.e., the head and body of the hippocampuswere included). The vertical digitation of the head of thehippocampus, which curves up and medial to the amygdala incoronal sections was included. (iv) Volumetrically excludedtissues were the fornix-fimbria white matter complex; thealveus (the intraventricular white matter covering of thehippocampus); the white matter of the parahippocampal gy-rus; various fluid-filled spaces including ventricles, subarach-noid spaces, and sporadic fluid-density spaces in the hip-pocampus complex; and the amygdala proper and the whitematter border with it (a thin white matter line, discernible in0.5-mm3 MRIs, which separated the hippocampus from theamygdala). When necessary, we used an arbitrary line con-
necting the sulcus semiannularis and the inferior horn of thelateral ventricle to define this separation (31).The subiculum is a long stretch of tissue, extending medially
from the cornu ammonis-. The superior component of the cornuammonis does not extend medially far enough to aid in demar-cating the border of the hippocampus, and the inferior compo-nent of the cornu ammonis is in direct continuity with thesubiculum. Therefore, no clear gross anatomic separation existsamong the hippocampus, subiculum, presubiculum, or parasu-biculum. For practical purposes, we adopted a precedence toinclude the subiculum in the measured volume called "hippocam-pus" (30).
Total Cerebral Volume. Total cerebral volume, defined asall brain tissue of the cerebral hemispheres (both gray andwhite matter), included the midbrain superior to the pons. Thesuperior border of the pons was chosen as the point ofdemarcation because it is easily recognizable. This volumemeasurement was also made by using stereological methods asdescribed above. The intra-rater correlation coefficients werecalculated and were 0.96 and 0.96 for rater 1 and rater 2,respectively. The inter-rater correlation coefficient was 0.90,based on 17 out of 20 measurements. The overall CE was 0.01.
Estimation of Total Time Depressed. Using the DIGS asdescribed above, the number of symptoms and duration (days) ofeach episode were determined (see above). Only the portion ofa depressive episode which met full DSM-IV criteria (32) formajor depression was included in this determination. For exam-
ple, if a subject had symptoms that qualified for a diagnosis ofdysthymia, or residual depression during some number of thedays, that portion of the episode was not included. The totalcumulative duration of major depression was then calculated,summing over all episodes (Table 1). Hippocampal gray mattervolumes were obtained as described above. Then for each de-pressed subject the hippocampal gray matter volume was re-
gressed against total days depressed. A limitation of the presentstudy is the use of retrospective data to identify past episodes ofdepression. Rigorous diagnostic criteria were used to establisheach episode, and, whenever possible, corroborating informationwas obtained from family members or treating psychiatrists. Indepressed populations, self-reporting may underestimate theduration of earlier episodes, but this has been shown to be nomore likely in older than in younger subjects (33). Furthermore,patients with more severe histories of depression, such as those inthe current study, have been previously shown to have greaterstability of diagnosis (34).Hippocampal Low Signal Foci (LSF). During stereological
volumetric measurements LSF were found within the hip-pocampal formation. Areas of low signal appear dark on
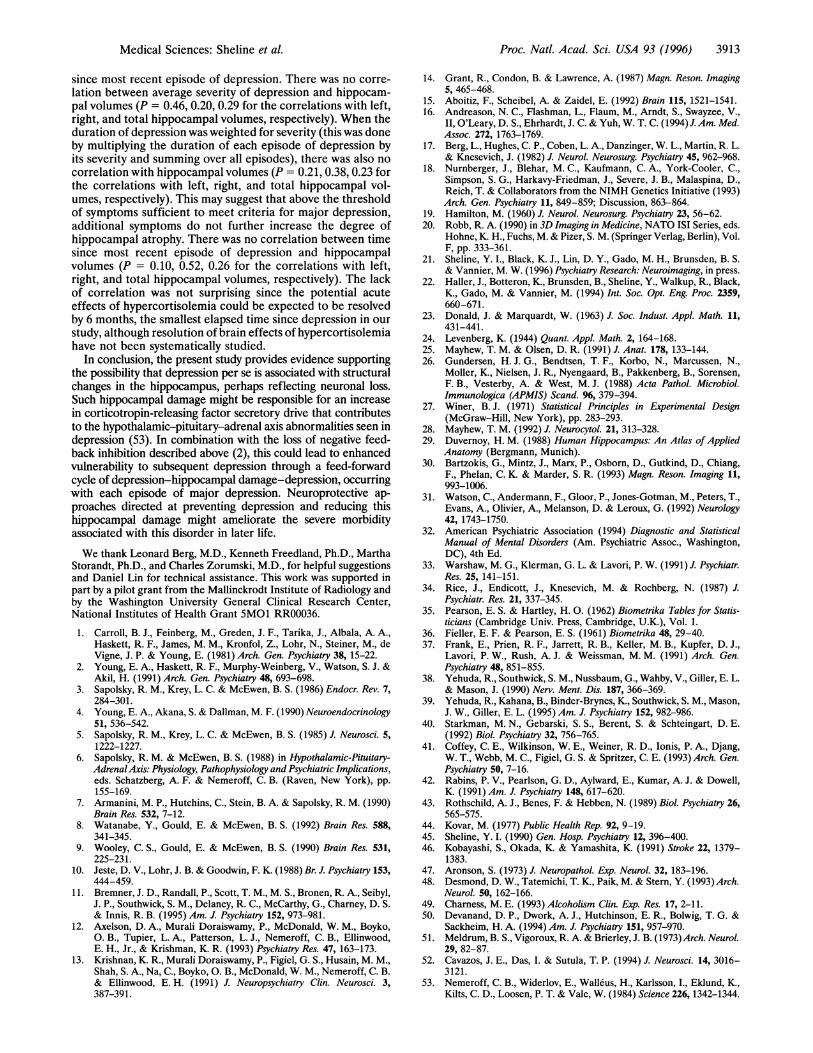
Tl-weighted images and appeared to be indistinguishable fromcerebrospinal fluid spaces in these scans. Gray scale valueswere sampled for these areas and were found to be similar toneighboring cerebrospinal fluid spaces. The number and sizeof these LSF in the hippocampus were measured by defininga threshold value determined by sampling gray scale values ofthe LSF in all scans. The mean gray scale value was 155 + 22.This thresholding algorithm was then applied to all scans. Theresulting scans had LSF ranging in size from <0.1 mm to "10mm in diameter. LSF were counted in each scan and classifiedas "large" LSF if they were -4.5 mm in diameter (see Fig. 4).Data Analysis. Two-tailed paired t tests were used to
compare depressed and control subjects on all demographicand MRI measures. With the exception of correlations involv-ing LSF, the Pearson correlation (35) was used to determine
Table 1. Comparison of depressed subjects and matched controls
Depressed Matchedsubjects controls Paired t
(n = 10) (n = 10) test
Variable Mean SD Mean SD t p
Age, yr 68.5 10.4 68.0 9.5 0.7 0.52Education, yr 14.3 2.9 13.6 2.9 1.1 0.31Height, cm 161.2 5.6 162.1 6.1 0.5 0.73Cortisol, ,/g/liter
Baseline 20.8 10.2 23.8 9.5 0.6 0.55DST 2.7 1.2 2.0 0.9 0.8 0.44
HRSD 6.0 5.4 1.9 1.7 2.8 0.02Days depressed 1293 1067Race, no.White 9 (90%) 10 (100%)Black 1 (10%) 0 (0%)
Hippocampal gray matter volume, mm3Left 2159 301 2544 333 4.1 0.003Right 2283 324 2577 259 2.8 0.02
Total cerebral volume, mm3 x 1031167 133 1159 104 0.2 0.83
Number of LSF in hippocampusLeft large* LSF 22 14 6 7 3.3 0.01Right large* LSF 23 16 9 9 2.4 0.04
LSF, low signal foci; DST, dexamethasone suppression test (see text).*Large defined as >4.5 mm diameter.
Proc. Natl. Acad. Sci. USA 93 (1996)

Proc. Natl. Acad. Sci. USA 93 (1996) 3911
Table 2. Clinical data and hippocampal volumes for depressed subjectsLeft Right Timehipp. hipp. since ECT Current
volume, volume, Days depressed, status, antidepressant, Dep.No. mm3 mm3 dep. months days (daily dose in mg) severityS-02 2049 2233 252 10 12 Amitriptyline (100) 5.00S-03 2237 2637 196 24 0 Trazodone (50) 5.00S-04 1690 1851 2065 8 20 Maprotiline (200) 8.00S-09 1897 2109 3752 10 0 Fluoxetine (20) 7.75S-10 1842 1977 3276 36 0 Amitriptyline (100) 9.00S-11 2081 2021 210 6 0 Doxepin (100) 5.25S-13 2265 2269 2160 6 9 Sertraline (100) 8.50S-14 2485 2301 21 524 0 None 8.00S-15 2407 2536 980 36 0 None 7.67S-18 2632 2894 119 168 0 Paroxetine (20) 5.50
hipp., Hippocampus; dep., depression.
the significance of correlations among MRI measures, andbetween MRI measures and total cumulative duration ofdepression. The data on numbers of LSF were not normallydistributed; therefore, a Spearman rank correlation (36) wasused for correlations involving these data.
RESULTSDemographics. Table 1 summarizes demographic and other
characteristics for depressed subjects and normal controls. Thelack of hypercortisolemia, either baseline or after administra-tion of dexamethasone, and HRSD scores are consistent withthe absence of acute current depression. While the groupsdiffer in HRSD score, a score of -7 would indicate that asubject was asymptomatic (37). Depressed subjects had a meanof 4.5 lifetime episodes of major depression (range, 1-18),accounting for a lifetime mean of 1303 days depressed (range,21-3752; median, 616). Table 2 displays data on individualdepressed subjects, including duration of depression, timesince last depressed, ECT status (number of days of ECTtreatment), current daily antidepressant dose in milligrams,average number of depressive symptoms over all depressiveepisodes, and left and right hippocampal volumes.Neuromorphometric Measures. Table 1 and Fig. 2 show that
left and right hippocampal gray matter volumes were smallerand the number of large LSF in left and right hippocampuswere larger in depressed subjects than in normal controls.Mean total cerebral volumes did not differ. Correlationsbetween number of large LSF and hippocampal gray mattervolumes were determined. For left hippocampal gray mattervolumes, the correlation with left large LSF was p = -0.56 (P= 0.01). The correlation between right hippocampal graymatter volumes and large LSF was p = -0.53 (P = 0.02).
Correlations Between Hippocampal Gray MatterVolumes andTotal Time Depressed. There was a significant correlation be-tween total days depressed and left hippocampal gray mattervolume (r = -0.65; P = 0.04) (Fig. 3). There was also a trend
03
EE
a
0
I
3200
2800
2400
2000
1ibtJI '
* Depressed" "Control
Left RightFIG. 2. Left and right hippocampal volumes for each subject pair
of depressed subject and the age, gender, education, and height-matched case control; the mean and SD for each group are also shown.
toward a relationship between right hippocampal gray mattervolume and total days depressed (r = -0.59; P = 0.10). Inaddition, the correlation between hippocampal LSF and totaldays depressed was determined (Fig. 4). The number of large LSFin left (p = 0.76, P = 0.02) and right (p = 0.66, P = 0.05)hippocampus were significantly correlated with total number ofdays depressed.
DISCUSSIONThe major finding of the present study is that patients with ahistory of recurrent major depression, but with no currentdepression or history of medical comorbidity, had smallerhippocampal gray matter volumes than a group of pair-wisematched normal controls. This reduction was not a result ofoverall brain atrophy; total cerebral volumes did not differbetween the groups. In examining the left and right hippocam-pus individually, both differed significantly between depressedpatients and controls.
Present data contrast with those obtained by a previousstudy that found no hippocampal volume differences betweendepressed patients and controls (12). This discrepancy may beexplained by methodological differences. We achieved higherspatial resolution examining 0.5-mm slices rather than the5-mm slices used by Axelson et al. (12), and we isolatedhippocampal gray matter volume rather than assessing com-bined gray and white matter volume of the combined hip-pocampus-amygdala complex. These technical differences mayhave enhanced our ability to detect small differences specificto hippocampal gray matter volume.An important aspect of this study design is that the de-
pressed individuals were not currently suffering from depres-sion. Therefore, the results reported are not likely due to theacute effects of corticosteroids, but rather appear to be a con-
29700fEE
E 2400-0
E 2100-coa0Q.: 1800-
-J
0
0
0
0 ....
500 1000 1500 2000 2500 3000 3500 4000Time depressed, days
FIG. 3. Correlation between left hippocampal gray matter volumesand total days of major depression.
" ................................. ...........
I
M~edical Sciences: Sheline et al.
II

3912 Medical Sciences: Sheline et al.
sequence of the cumulative depression history. This study islimited by its retrospective nature, and we were unable tocorrelate hypercortisolism with hippocampal atrophy. However,it is interesting to note that both combat and depression arestressors, and both appear to be associated with hippocampalatrophy (11), even in the absence of hypercortisolism (38) afterthe acute stress has resolved. In fact, posttraumatic stress disorderis associated with decreased urinary cortisol excretion which cancontinue for decades after the initial trauma (39). Evidence forthe neurotoxic effects of corticosteroids in humans is also pro-vided by the finding that patients with Cushings syndrome haveselective hippocampal atrophy, which is correlated with plasmacortisol levels (40) and memory dysfunction.Our finding that MRI cerebral volumes in depressed patients
and controls were not significantly different is consistent withsome previous reports (41), but different from that of Rabins etal. (42), who found widespread cortical and subcortical atrophyin geriatric patients with major depression, and Rothschild et al.(43), who found larger ventricle-to-brain ratios indicative ofcortical atrophy in depressed patients with abnormal dexameth-asone suppression tests. To our knowledge, however, the presentstudy is the first to study only subjects without medical orneurological comorbidities capable of affecting brain volume. Itis critical to know whether patients with changes in brain structurevolumes had concurrent physical illnesses, especially with age-related increases in incidence of medical conditions potentiallyaffecting the brain (44, 45). Before concluding that specificregional volume decrements are associated with depression, thispossibility must be excluded. While previous studies have in-cluded a physical exam to exclude significant neurological illness,common medical conditions, such as hypertension, diabetes, andhistory of myocardial infarct, have not been specifically excluded.In the present study, we selected only subjects with no currentmedical or neurological condition and made special effort toexclude subjects with cerebrovascular disease risk factors thatcould increase the incidence of subclinical infarcts. An increasedincidence of microinfarction has been linked to both chronichypertension (46) and diabetes (47, 48). We also excluded pa-tients with any history of substance abuse or dependence, sincealcohol dependence can cause cerebral atrophy (49).
Further study will be needed to determine the exact nature ofthe observed association between recurrent depression and the
Proc. Natl. Acad. Sci. USA 93 (1996)
hippocampal volume reduction. We cannot exclude the possibilitythat the loss of hippocampal volume preceded the developmentof depression, or that this volume reduction is a signature of somebrain abnormality that predisposes to depression. However, wefavor the alternative possibility that the recurrent episodes ofdepression actually caused hippocampal neuronal loss, perhapsthrough the mechanism of glucocorticoid-induced neurotoxicity(7). Favoring this possibility, the extent of left hippocampalvolume loss in depressed subjects correlated with total lifetimecumulative duration of depression. Furthermore, large (diameter- 4.5 mm) hippocampal LSF were found, and their number alsocorrelated with the total number of days depressed. To ourknowledge, this is the first report of such lesions in the hippocam-pus and we attribute them to atrophy.One confound in this and other studies to date is ECT
therapy. While direct evidence to date demonstrating ECT-induced structural brain changes has been lacking (50), animalstudies suggest that sustained seizures can produce neuronalloss and gliosis in the hippocampus (51), and more recent study(52) has suggested that even brief kindled seizures may alsoinduce some selective hippocampal neuronal loss. It wasimpractical to exclude patients who had received any ECT,since to do so would exclude the patients with the most severehistories of depression. However, we did exclude from thestudy any patient with more than three courses of ECTtreatment or anyone with a history ofECT within the past year.Even if the three subjects who received ECT were excluded ina post hoc analysis, however, there were still significantdifferences in left (P = 0.007) and right (P = 0.05) hippocam-pal gray matter volumes between depressed subjects andnormal controls. In addition, there was still a significantcorrelation between total days depressed and left hippocampalgray matter volume (P = 0.03). Another confound was med-ication treatment. While there is no known evidence forreductions in brain structure volumes associated with neuro-leptics or antidepressants, this possibility cannot be excluded.The relationship between hippocampal gray matter volumewith duration of depression appears to be fairly specificbecause no relationship was found between hippocampalvolumes and other clinical variables in post hoc analyses. Thevariables examined were average number of depressive symp-toms, duration of depression weighted by severity, and time
FIG. 4. Sagittal view of the hip-pocampus displaying small (<4.5mm) LSF and four large (>4.5mm) LSF marked by arrows. (Scalebar, 4.5 mm.)
Proc. Natl. Acad. Sci. USA 93 (1996) 3913
since most recent episode of depression. There was no corre-lation between average severity of depression and hippocam-pal volumes (P = 0.46, 0.20, 0.29 for the correlations with left,right, and total hippocampal volumes, respectively). When theduration of depression was weighted for severity (this was doneby multiplying the duration of each episode of depression byits severity and summing over all episodes), there was also nocorrelation with hippocampal volumes (P = 0.21, 0.38, 0.23 forthe correlations with left, right, and total hippocampal vol-umes, respectively). This may suggest that above the thresholdof symptoms sufficient to meet criteria for major depression,additional symptoms do not further increase the degree ofhippocampal atrophy. There was no correlation between timesince most recent episode of depression and hippocampalvolumes (P = 0.10, 0.52, 0.26 for the correlations with left,right, and total hippocampal volumes, respectively). The lackof correlation was not surprising since the potential acuteeffects of hypercortisolemia could be expected to be resolvedby 6 months, the smallest elapsed time since depression in ourstudy, although resolution of brain effects of hypercortisolemiahave not been systematically studied.
In conclusion, the present study provides evidence supportingthe possibility that depression per se is associated with structuralchanges in the hippocampus, perhaps reflecting neuronal loss.Such hippocampal damage might be responsible for an increasein corticotropin-releasing factor secretory drive that contributesto the hypothalamic-pituitary-adrenal axis abnormalities seen indepression (53). In combination with the loss of negative feed-back inhibition described above (2), this could lead to enhancedvulnerability to subsequent depression through a feed-forwardcycle of depression-hippocampal damage-depression, occurringwith each episode of major depression. Neuroprotective ap-proaches directed at preventing depression and reducing thishippocampal damage might ameliorate the severe morbidityassociated with this disorder in later life.
We thank Leonard Berg, M.D., Kenneth Freedland, Ph.D., MarthaStorandt, Ph.D., and Charles Zorumski, M.D., for helpful suggestionsand Daniel Lin for technical assistance. This work was supported inpart by a pilot grant from the Mallinckrodt Institute of Radiology andby the Washington University General Clinical Research Center,National Institutes of Health Grant 5MO1 RR00036.
1. Carroll, B. J., Feinberg, M., Greden, J. F., Tarika, J., Albala, A. A.,Haskett, R. F., James, M. M., Kronfol, Z., Lohr, N., Steiner, M., deVigne, J. P. & Young, E. (1981) Arch. Gen. Psychiatry 38, 15-22.
2. Young, E. A., Haskett, R. F., Murphy-Weinberg, V., Watson, S. J. &Akil, H. (1991) Arch. Gen. Psychiatry 48, 693-698.
3. Sapolsky, R. M., Krey, L. C. & McEwen, B. S. (1986) Endocr. Rev. 7,284-301.
4. Young, E. A., Akana, S. & Dallman, M. F. (1990) Neuroendocrinology51, 536-542.
5. Sapolsky, R. M., Krey, L. C. & McEwen, B. S. (1985) J. Neurosci. 5,1222-1227.
6. Sapolsky, R. M. & McEwen, B. S. (1988) in Hypothalamic-Pituitary-AdrenalAxis: Physiology, Pathophysiology and Psychiatric Implications,eds. Schatzberg, A. F. & Nemeroff, C. B. (Raven, New York), pp.155-169.
7. Armanini, M. P., Hutchins, C., Stein, B. A. & Sapolsky, R. M. (1990)Brain Res. 532, 7-12.
8. Watanabe, Y., Gould, E. & McEwen, B. S. (1992) Brain Res. 588,341-345.
9. Wooley, C. S., Gould, E. & McEwen, B. S. (1990) Brain Res. 531,225-231.
10. Jeste, D. V., Lohr, J. B. & Goodwin, F. K. (1988) Br. J. Psychiatry 153,444-459.
11. Bremner, J. D., Randall, P., Scott, T. M., M. S., Bronen, R. A., Seibyl,J. P., Southwick, S. M., Delaney, R. C., McCarthy, G., Charney, D. S.& Innis, R. B. (1995) Am. J. Psychiatry 152, 973-981.
12. Axelson, D. A., Murali Doraiswamy, P., McDonald, W. M., Boyko,O. B., Tupier, L. A., Patterson, L. J., Nemeroff, C. B., Ellinwood,E. H., Jr., & Krishman, K. R. (1993) Psychiatry Res. 47, 163-173.
13. Krishnan, K. R., Murali Doraiswamy, P., Figiel, G. S., Husain, M. M.,Shah, S. A., Na, C., Boyko, O. B., McDonald, W. M., Nemeroff, C. B.& Ellinwood, E. H. (1991) J. Neuropsychiatry Clin. Neurosci. 3,387-391.
14. Grant, R., Condon, B. & Lawrence, A. (1987) Magn. Reson. Imaging5, 465-468.
15. Aboitiz, F., Scheibel, A. & Zaidel, E. (1992) Brain 115, 1521-1541.16. Andreason, N. C., Flashman, L., Flaum, M., Arndt, S., Swayzee, V.,
II, O'Leary, D. S., Ehrhardt, J. C. & Yuh, W. T. C. (1994) J. Am. Med.Assoc. 272, 1763-1769.
17. Berg, L., Hughes, C. P., Coben, L. A., Danzinger, W. L., Martin, R. L.& Knesevich, J. (1982) J. Neurol. Neurosurg. Psychiatry 45, 962-968.
18. Nurnberger, J., Blehar, M. C., Kaufmann, C. A., York-Cooler, C.,Simpson, S. G., Harkavy-Friedman, J., Severe, J. B., Malaspina, D.,Reich, T. & Collaborators from the NIMH Genetics Initiative (1993)Arch. Gen. Psychiatry 11, 849-859; Discussion, 863-864.
19. Hamilton, M. (1960) J. Neurol. Neurosurg. Psychiatry 23, 56-62.20. Robb, R. A. (1990) in 3D Imaging in Medicine, NATO ISI Series, eds.
Hohne, K. H., Fuchs, M. & Pizer, S. M. (Springer Verlag, Berlin), Vol.F, pp. 333-361.
21. Sheline, Y. I., Black, K. J., Lin, D. Y., Gado, M. H., Brunsden, B. S.& Vannier, M. W. (1996) Psychiatry Research: Neuroimaging, in press.
22. Haller, J., Botteron, K., Brunsden, B., Sheline, Y., Walkup, R., Black,K., Gado, M. & Vannier, M. (1994) Int. Soc. Opt. Eng. Proc. 2359,660-671.
23. Donald, J. & Marquardt, W. (1963) J. Soc. Indust. Appl. Math. 11,431-441.
24. Levenberg, K. (1944) Quant. Appl. Math. 2, 164-168.25. Mayhew, T. M. & Olsen, D. R. (1991) J. Anat. 178, 133-144.26. Gundersen, H. J. G., Bendtsen, T. F., Korbo, N., Marcussen, N.,
Moller, K., Nielsen, J. R., Nyengaard, B., Pakkenberg, B., Sorensen,F. B., Vesterby, A. & West, M. J. (1988) Acta Pathol. Microbiol.Immunologica (APMIS) Scand. 96, 379-394.
27. Winer, B. J. (1971) Statistical Principles in Experimental Design(McGraw-Hill, New York), pp. 283-293.
28. Mayhew, T. M. (1992) J. Neurocytol. 21, 313-328.29. Duvernoy, H. M. (1988) Human Hippocampus: An Atlas of Applied
Anatomy (Bergmann, Munich).30. Bartzokis, G., Mintz, J., Marx, P., Osborn, D., Gutkind, D., Chiang,
F., Phelan, C. K. & Marder, S. R. (1993) Magn. Reson. Imaging 11,993-1006.
31. Watson, C., Andermann, F., Gloor, P., Jones-Gotman, M., Peters, T.,Evans, A., Olivier, A., Melanson, D. & Leroux, G. (1992) Neurology42, 1743-1750.
32. American Psychiatric Association (1994) Diagnostic and StatisticalManual of Mental Disorders (Am. Psychiatric Assoc., Washington,DC), 4th Ed.
33. Warshaw, M. G., Klerman, G. L. & Lavori, P. W. (1991) J. Psychiatr.Res. 25, 141-151.
34. Rice, J., Endicott, J., Knesevich, M. & Rochberg, N. (1987) J.Psychiatr. Res. 21, 337-345.
35. Pearson, E. S. & Hartley, H. 0. (1962) Biometrika Tables for Statis-ticians (Cambridge Univ. Press, Cambridge, U.K.), Vol. 1.
36. Fieller, E. F. & Pearson, E. S. (1961) Biometrika 48, 29-40.37. Frank, E., Prien, R. F., Jarrett, R. B., Keller, M. B., Kupfer, D. J.,
Lavori, P. W., Rush, A. J. & Weissman, M. M. (1991) Arch. Gen.Psychiatry 48, 851-855.
38. Yehuda, R., Southwick, S. M., Nussbaum, G., Wahby, V., Giller, E. L.& Mason, J. (1990) Nerv. Ment. Dis. 187, 366-369.
39. Yehuda, R., Kahana, B., Binder-Brynes, K., Southwick, S. M., Mason,J. W., Giller, E. L. (1995) Am. J. Psychiatry 152, 982-986.
40. Starkman, M. N., Gebarski, S. S., Berent, S. & Schteingart, D. E.(1992) Biol. Psychiatry 32, 756-765.
41. Coffey, C. E., Wilkinson, W. E., Weiner, R. D., Ionis, P. A., Djang,W. T., Webb, M. C., Figiel, G. S. & Spritzer, C. E. (1993) Arch. Gen.Psychiatry 50, 7-16.
42. Rabins, P. V., Pearlson, G. D., Aylward, E., Kumar, A. J. & Dowell,K. (1991) Am. J. Psychiatry 148, 617-620.
43. Rothschild, A. J., Benes, F. & Hebben, N. (1989) Biol. Psychiatry 26,565-575.
44. Kovar, M. (1977) Public Health Rep. 92, 9-19.45. Sheline, Y. I. (1990) Gen. Hosp. Psychiatry 12, 396-400.46. Kobayashi, S., Okada, K. & Yamashita, K. (1991) Stroke 22, 1379-
1383.47. Aronson, S. (1973) J. Neuropathol. Exp. Neurol. 32, 183-196.48. Desmond, D. W., Tatemichi, T. K., Paik, M. & Stern, Y. (1993) Arch.
Neurol. 50, 162-166.49. Charness, M. E. (1993) Alcoholism Clin. Exp. Res. 17, 2-11.50. Devanand, D. P., Dwork, A. J., Hutchinson, E. R., Bolwig, T. G. &
Sackheim, H. A. (1994) Am. J. Psychiatry 151, 957-970.51. Meldrum, B. S., Vigoroux, R. A. & Brierley, J. B. (1973)Arch. Neurol.
29, 82-87.52. Cavazos, J. E., Das, I. & Sutula, T. P. (1994) J. Neurosci. 14, 3016-
3121.53. Nemeroff, C. B., Widerlov, E., Walleus, H., Karlsson, I., Eklund, K.,
Kilts, C. D., Loosen, P. T. & Vale, W. (1984) Science 226, 1342-1344.
Mvedical Sciences: Sheline et al.