quadratic functions and equations student packet 1: … · 2013-03-04 · the graph of a quadratic...
TRANSCRIPT
Introduction to Quadratic Functions
Quadratic Functions and Equations Unit (Student Pages) QUAD1 – SP0
QUAD1.1 Functions Revisited • Define the domain and range of a function. • Learn some function notation
1
QUAD1.2 Modeling with Quadratic Functions 1 • Create mathematical models of an event. • Determine the degree of accuracy appropriate for a given
situation. • Graph different data sets that result in lines or parabolas. • Use technology to display and analyze data. • Understand some basic properties of a parabola.
6
QUAD1.3 Creating Parabolas from Lines • Graph linear and quadratic functions • Explore some basic properties of a quadratic function.
12
QUAD1.4 Vocabulary, Skill Builders, and Review 17
QUADRATIC FUNCTIONS AND EQUATIONS Student Packet 1: Introduction to Quadratic Functions
QUAD1 STUDENT PACKET
Sample
: Do N
ot Rep
roduc
e
Introduction to Quadratic Functions
Quadratic Functions and Equations Unit (Student Pages) QUAD1 – SP0
WORD BANK (QUAD1)
Word or Phrase Definition or Explanation Example or Picture
function
domain of a function
linear function
parabola
vertex of a parabola
quadratic function
range of a function Sam
ple: D
o Not
Reprod
uce
Introduction to Quadratic Functions 1.1 Functions Revisited
Quadratic Functions and Equations Unit (Student Pages) QUAD1 – SP1
FUNCTIONS REVISITED
Ready (Summary) We will revisit the concept of function and graph of a function. We will define the domain and range of a function, and learn some function notation.
Set (Goals) • Define the domain and range of a
function. • Learn some function notation
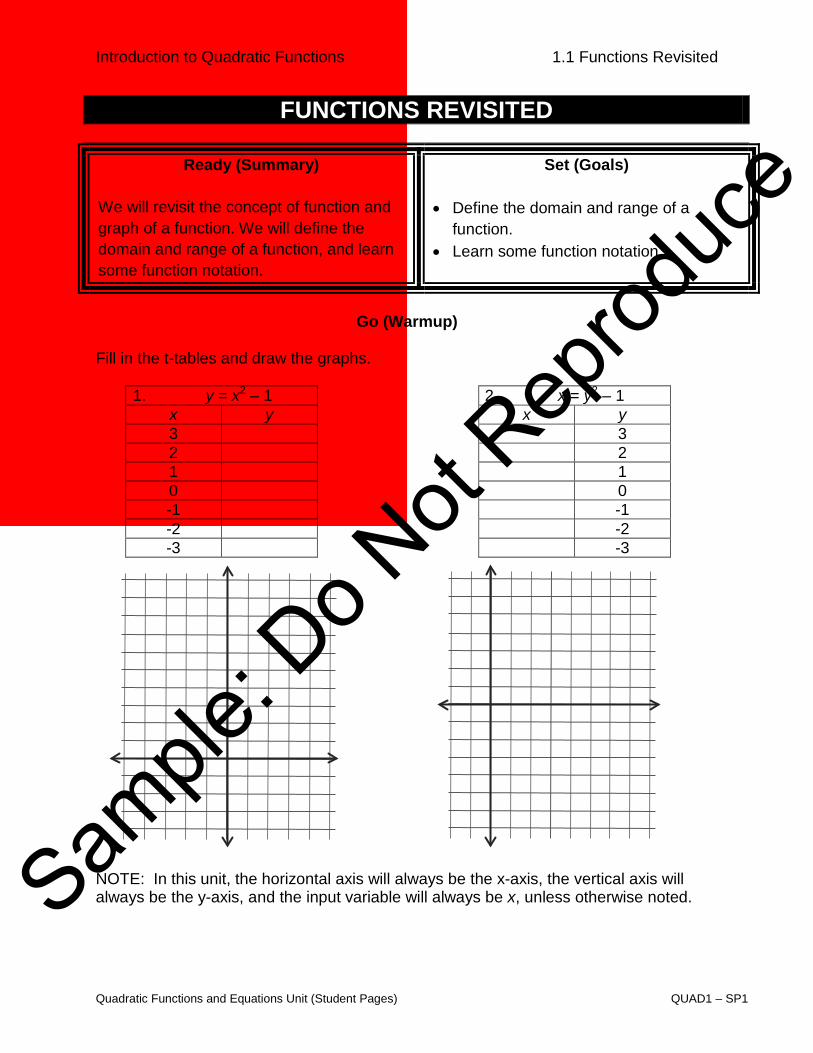
Go (Warmup)
Fill in the t-tables and draw the graphs.
1. y = x2 – 1 2. x = y2 – 1 x y x y 3 3 2 2 1 1 0 0 -1 -1 -2 -2 -3 -3
NOTE: In this unit, the horizontal axis will always be the x-axis, the vertical axis will always be the y-axis, and the input variable will always be x, unless otherwise noted. Sam
ple: D
o Not
Reprod
uce

Introduction to Quadratic Functions 1.1 Functions Revisited
Quadratic Functions and Equations Unit (Student Pages) QUAD1 – SP2
A REVISIT TO FUNCTIONS AND THEIR GRAPHS A function is a rule in which each input value is assigned to exactly one output value. The graph of a function is the set of ordered pairs, each consisting of an input and its corresponding output. If the inputs and outputs are real numbers, then we can represent the graph of a function as points on the coordinate plane. The vertical line test refers to a visual way to determine whether a set of ordered pairs in the usual xy-plane is the graph of a function. The vertical line test simply states that if a vertical line intersects a graph in more than one point, then it is a NOT a function. 1. Consider the equation and its graph in problem 1 of the warmup.
Why does it represent a function of x based upon: a. the definition of function?
b. the vertical line test?
c. the equation? 2. Consider the equation and it’s graph in problem 2 of the warmup.
Why does it not represent a function of x based upon: a. the definition of function?
b. the vertical line test?
c. the equation?
Sample
: Do N
ot Rep
roduc
e
Introduction to Quadratic Functions 1.1 Functions Revisited
Quadratic Functions and Equations Unit (Student Pages) QUAD1 – SP3
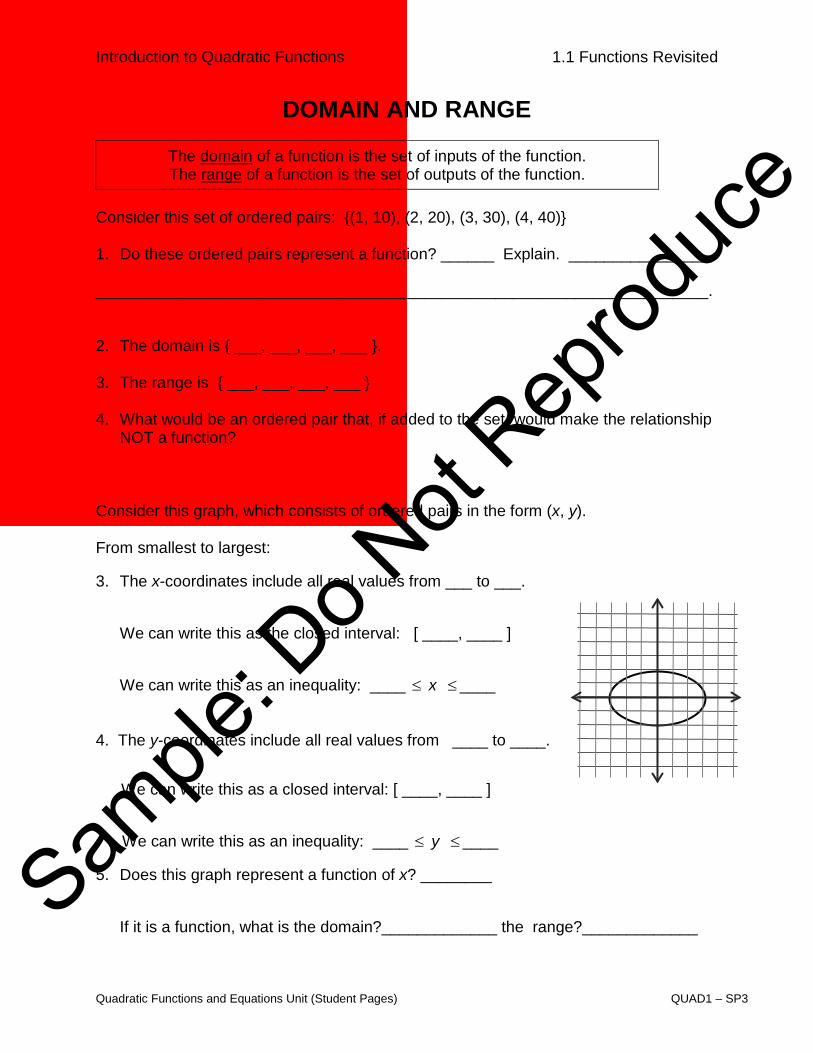
DOMAIN AND RANGE
The domain of a function is the set of inputs of the function. The range of a function is the set of outputs of the function.
Consider this set of ordered pairs: {(1, 10), (2, 20), (3, 30), (4, 40)} 1. Do these ordered pairs represent a function? ______ Explain. ________________ _____________________________________________________________________. 2. The domain is { ___, ___, ___, ___ }.
3. The range is { ___, ___, ___, ___ } 4. What would be an ordered pair that, if added to the set, would make the relationship
NOT a function? Consider this graph, which consists of ordered pairs in the form (x, y). From smallest to largest: 3. The x-coordinates include all real values from ___ to ___.
We can write this as the closed interval: [ ____, ____ ]
We can write this as an inequality: ____ ≤ x ≤____
4. The y-coordinates include all real values from ____ to ____. We can write this as a closed interval: [ ____, ____ ] We can write this as an inequality: ____ ≤ y ≤____ 5. Does this graph represent a function of x? ________
If it is a function, what is the domain?_____________ the range?_____________
Sample
: Do N
ot Rep
roduc
e
Introduction to Quadratic Functions 1.1 Functions Revisited
Quadratic Functions and Equations Unit (Student Pages) QUAD1 – SP4
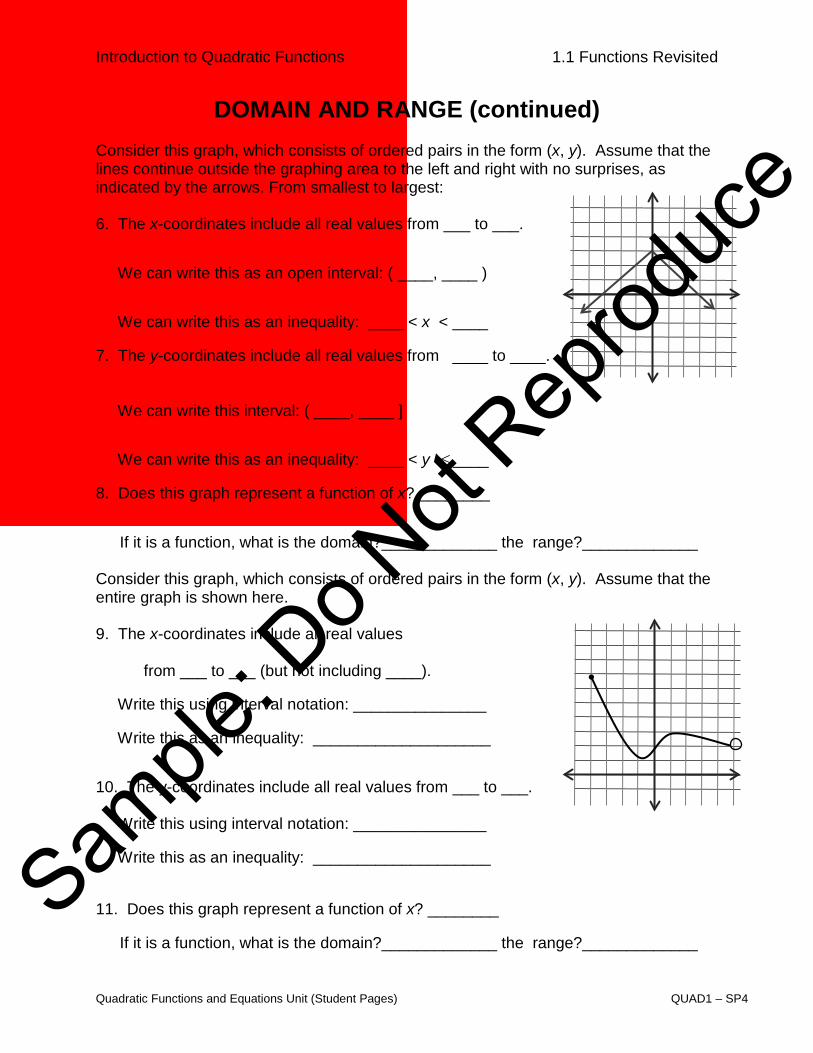
DOMAIN AND RANGE (continued) Consider this graph, which consists of ordered pairs in the form (x, y). Assume that the lines continue outside the graphing area to the left and right with no surprises, as indicated by the arrows. From smallest to largest: 6. The x-coordinates include all real values from ___ to ___. We can write this as an open interval: ( ____, ____ ) We can write this as an inequality: ____ < x < ____ 7. The y-coordinates include all real values from ____ to ____. We can write this interval: ( ____, ____ ] We can write this as an inequality: ____ < y ≤____ 8. Does this graph represent a function of x? ________
If it is a function, what is the domain?_____________ the range?_____________
Consider this graph, which consists of ordered pairs in the form (x, y). Assume that the entire graph is shown here. 9. The x-coordinates include all real values
from ___ to ___ (but not including ____).
Write this using interval notation: _______________ Write this as an inequality: ____________________ 10. The y-coordinates include all real values from ___ to ___. Write this using interval notation: _______________ Write this as an inequality: ____________________ 11. Does this graph represent a function of x? ________
If it is a function, what is the domain?_____________ the range?_____________
Sample
: Do N
ot Rep
roduc
e
Introduction to Quadratic Functions 1.1 Functions Revisited
Quadratic Functions and Equations Unit (Student Pages) QUAD1 – SP5
FUNCTION NOTATION
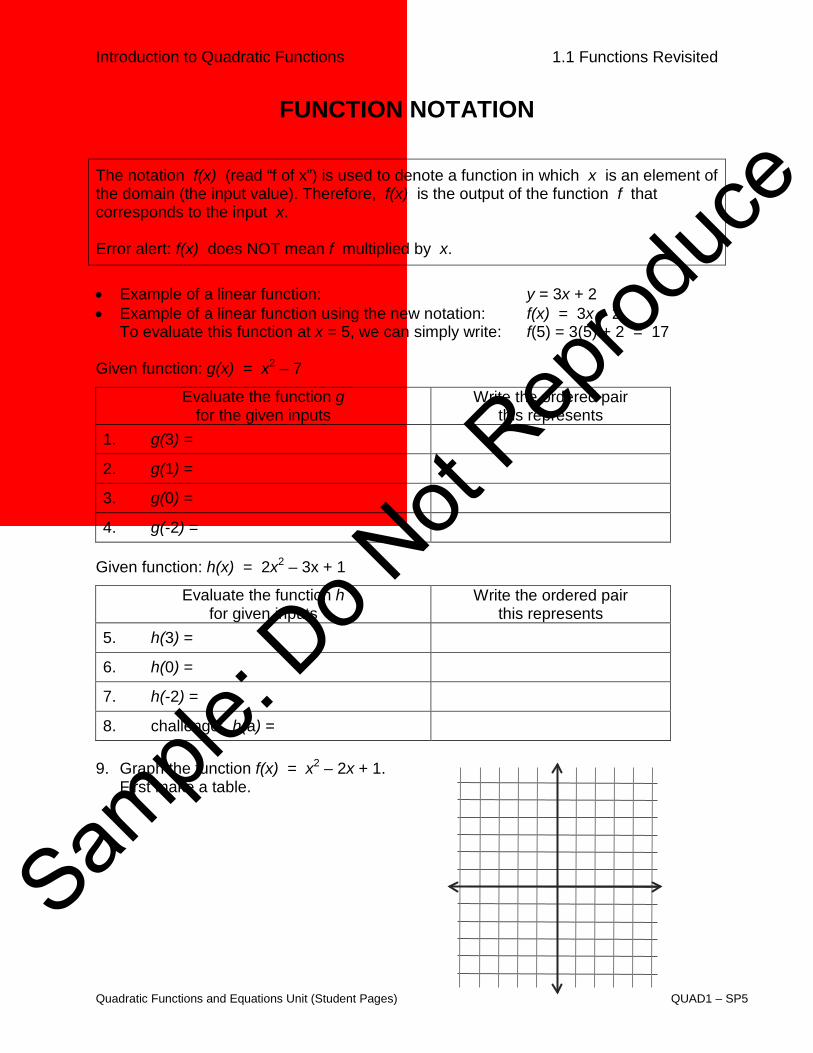
The notation f(x) (read “f of x”) is used to denote a function in which x is an element of the domain (the input value). Therefore, f(x) is the output of the function f that corresponds to the input x. Error alert: f(x) does NOT mean f multiplied by x.
• Example of a linear function: y = 3x + 2 • Example of a linear function using the new notation: f(x) = 3x + 2.
To evaluate this function at x = 5, we can simply write: f(5) = 3(5) + 2 = 17 Given function: g(x) = x2 – 7
Evaluate the function g for the given inputs
Write the ordered pair this represents
1. g(3) =
2. g(1) =
3. g(0) =
4. g(-2) =
Given function: h(x) = 2x2 – 3x + 1
Evaluate the function h for given inputs
Write the ordered pair this represents
5. h(3) =
6. h(0) =
7. h(-2) =
8. challenge: h(a) = 9. Graph the function f(x) = x2 – 2x + 1.
First make a table.
Sam
ple: D
o Not
Reprod
uce
Introduction to Quadratic Functions 1.2 Modeling with Quadratic Functions 1
Quadratic Functions and Equations Unit (Student Pages) QUAD1 – SP6
MODELING WITH QUADRATIC FUNCTIONS 1
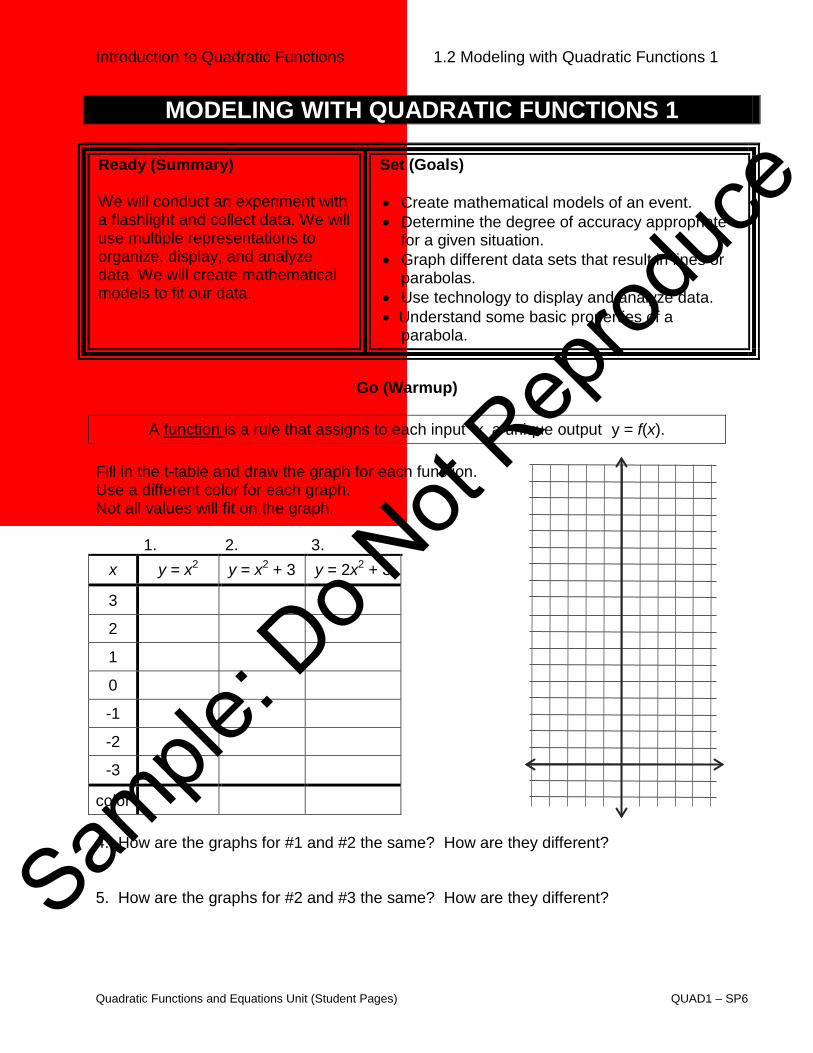
Ready (Summary) We will conduct an experiment with a flashlight and collect data. We will use multiple representations to organize, display, and analyze data. We will create mathematical models to fit our data.
Set (Goals) • Create mathematical models of an event. • Determine the degree of accuracy appropriate
for a given situation. • Graph different data sets that result in lines or
parabolas. • Use technology to display and analyze data. • Understand some basic properties of a
parabola.
Go (Warmup)
A function is a rule that assigns to each input x a unique output y = f(x).
Fill in the t-table and draw the graph for each function. Use a different color for each graph. Not all values will fit on the graph.
1. 2. 3. x y = x2 y = x2 + 3 y = 2x2 + 3
3
2
1
0
-1
-2
-3
color 4. How are the graphs for #1 and #2 the same? How are they different? 5. How are the graphs for #2 and #3 the same? How are they different?
Sample
: Do N
ot Rep
roduc
e
Introduction to Quadratic Functions 1.2 Modeling with Quadratic Functions 1
Quadratic Functions and Equations Unit (Student Pages) QUAD1 – SP7
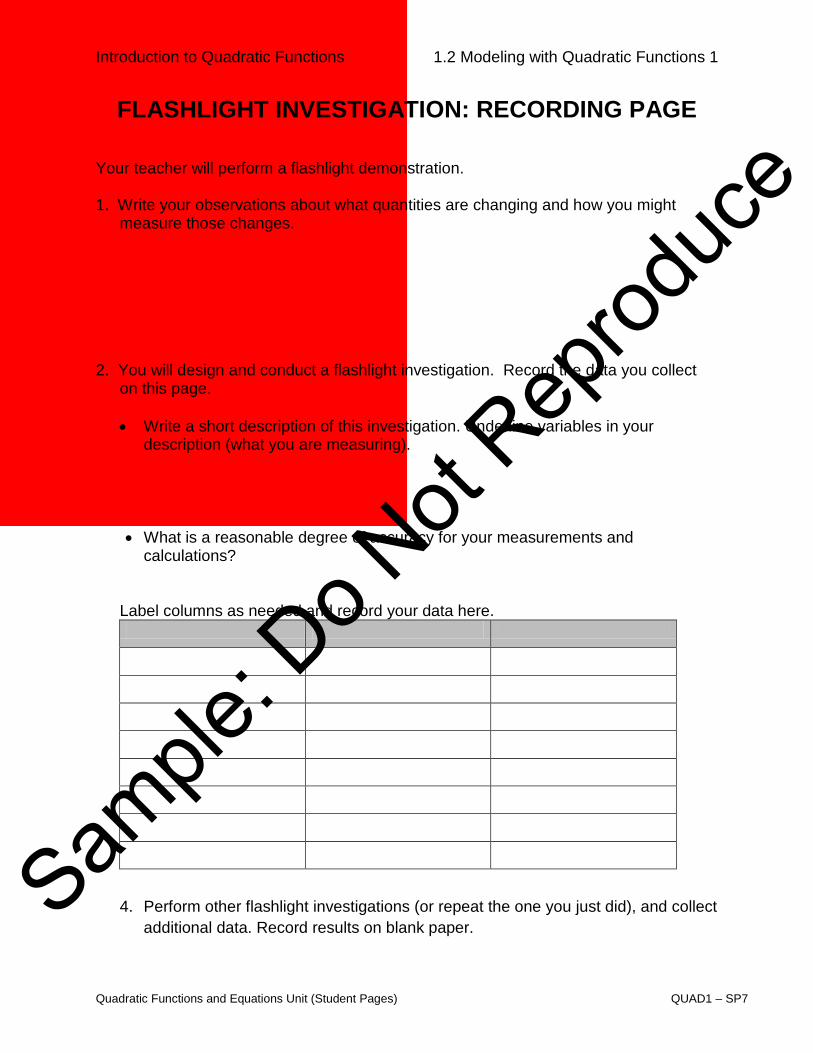
FLASHLIGHT INVESTIGATION: RECORDING PAGE Your teacher will perform a flashlight demonstration. 1. Write your observations about what quantities are changing and how you might
measure those changes. 2. You will design and conduct a flashlight investigation. Record the data you collect
on this page.
• Write a short description of this investigation. Underline variables in your description (what you are measuring).
• What is a reasonable degree of accuracy for your measurements and calculations?
Label columns as needed and record your data here.
4. Perform other flashlight investigations (or repeat the one you just did), and collect
additional data. Record results on blank paper. Sam
ple: D
o Not
Reprod
uce
Introduction to Quadratic Functions 1.2 Modeling with Quadratic Functions 1
Quadratic Functions and Equations Unit (Student Pages) QUAD1 – SP8
FLASHLIGHT INVESTIGATION:
A LINEAR FUNCTION
Compare two variables from your experiment that you think will result in a linear function. Record your data in the table, or use data provided by your teacher. 1. Briefly describe the experiment that
was performed to gather the data.
2. What variables are being compared? 3. What will go on the horizontal axis?
How will you scale it? 4. What will go on the vertical axis? How
will you scale it?
5. What is a good title for your graph? 6. What does the y-intercept on your
graph represent? 7. Estimate a “line of best fit” for your
graph
Sample
: Do N
ot Rep
roduc
e
Introduction to Quadratic Functions 1.2 Modeling with Quadratic Functions 1
Quadratic Functions and Equations Unit (Student Pages) QUAD1 – SP9
FLASHLIGHT INVESTIGATION:
A QUADRATIC FUNCTION Compare a variable that represents a length measurement to a variable that represents an area measurement. Record your data in the table, or use data provided by your teacher. 1. Briefly describe the experiment that
was performed to gather the data.
2. What variables are being compared? 3. What will go on the horizontal axis?
How will you scale it?
4. What will go on the vertical axis? How will you scale it?
5. What is a good title for your graph? 6. What does the y-intercept on your
graph represent? 7. What is the shape of your graph?
Sample
: Do N
ot Rep
roduc
e
Introduction to Quadratic Functions 1.2 Modeling with Quadratic Functions 1
Quadratic Functions and Equations Unit (Student Pages) QUAD1 – SP10
FINDING AN EQUATION FOR THE DATA The graph of a quadratic function is a curve called a parabola. Functions whose graphs are parabolas may open upward or downward and vary in "width" or "steepness", but they all have the same basic "U" shape. Parabolas that have symmetry about the y-axis have the form:
y = ax2 + k This parabola has its vertex at (0, k). The value of a determines its “steepness”. We will estimate a quadratic function to fit the data on the previous page. 1. Estimate a value for k. The minimum point on the graph is (0, ____). This
coordinate is called the vertex of the parabola. Use this as a value for k.
y = ax2 + _____ 2. Substitute (x, y) coordinates from the graph on the previous page to calculate some possible values for a.
For ( ____, ____ ) For ( ____, ____ ) For ( ____, ____ )
y = ax2 + k
_____ = (a)(____)2 + _____
a = _______
y = ax2 + k
_____ = (a)(____)2 + _____
y = ax2 + k
For ( ____, ____ ) For ( ____, ____ ) For ( ____, ____ )
Sample
: Do N
ot Rep
roduc
e
Introduction to Quadratic Functions 1.2 Modeling with Quadratic Functions 1
Quadratic Functions and Equations Unit (Student Pages) QUAD1 – SP11
FINDING AN EQUATION FOR THE DATA (continued) 3. Describe a strategy for estimating a value for a. 4. Use your strategy to estimate a value for a. 5. Using your calculations and estimations, write a quadratic function to fit your data
y = ax2 + k
y = ____x2 + _____
7. Locate a program on the internet, or use a graphing calculator that finds a quadratic
function to best fits a set of data. Find the equation of a parabola that best fits your data.
8. Compare your estimated quadratic function to the one generated by technology.
Discuss discrepancies.
9. Locate a program on the internet or use a graphing calculator that finds a linear
function to best fit a set of data. Find the equation of a line that best fits the linear function you created from flashlight investigation data.
10. Compare your estimated linear function to the one generated by technology.
Discuss discrepancies.
Sam
ple: D
o Not
Reprod
uce
Introduction to Quadratic Functions 1.3 Creating Parabolas from Lines
Quadratic Functions and Equations Unit (Student Pages) QUAD1 – SP12
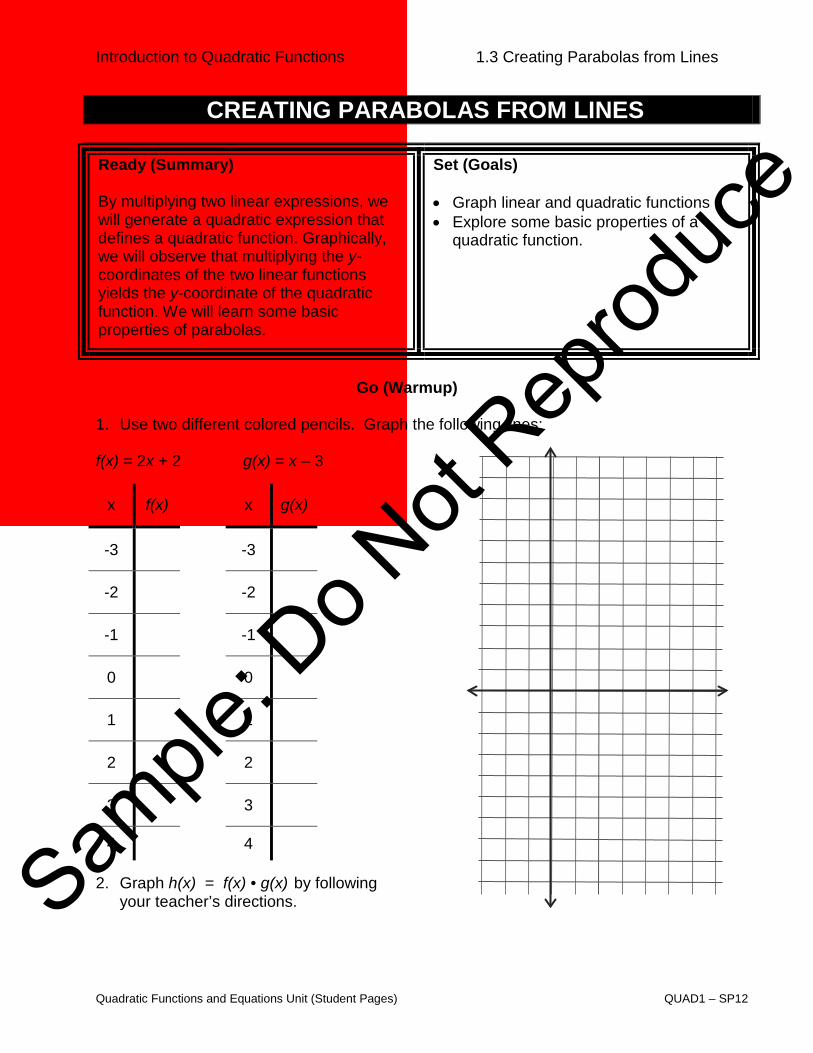
CREATING PARABOLAS FROM LINES
Ready (Summary) By multiplying two linear expressions, we will generate a quadratic expression that defines a quadratic function. Graphically, we will observe that multiplying the y-coordinates of the two linear functions yields the y-coordinate of the quadratic function. We will learn some basic properties of parabolas.
Set (Goals) • Graph linear and quadratic functions • Explore some basic properties of a
quadratic function.
Go (Warmup)
1. Use two different colored pencils. Graph the following lines: f(x) = 2x + 2 g(x) = x – 3
2. Graph h(x) = f(x) • g(x) by following your teacher’s directions.
x f(x) x g(x)
-3 -3
-2 -2
-1 -1
0 0
1 1
2 2
3 3
4 4
Sample
: Do N
ot Rep
roduc
e
Introduction to Quadratic Functions 1.3 Creating Parabolas from Lines
Quadratic Functions and Equations Unit (Student Pages) QUAD1 – SP13
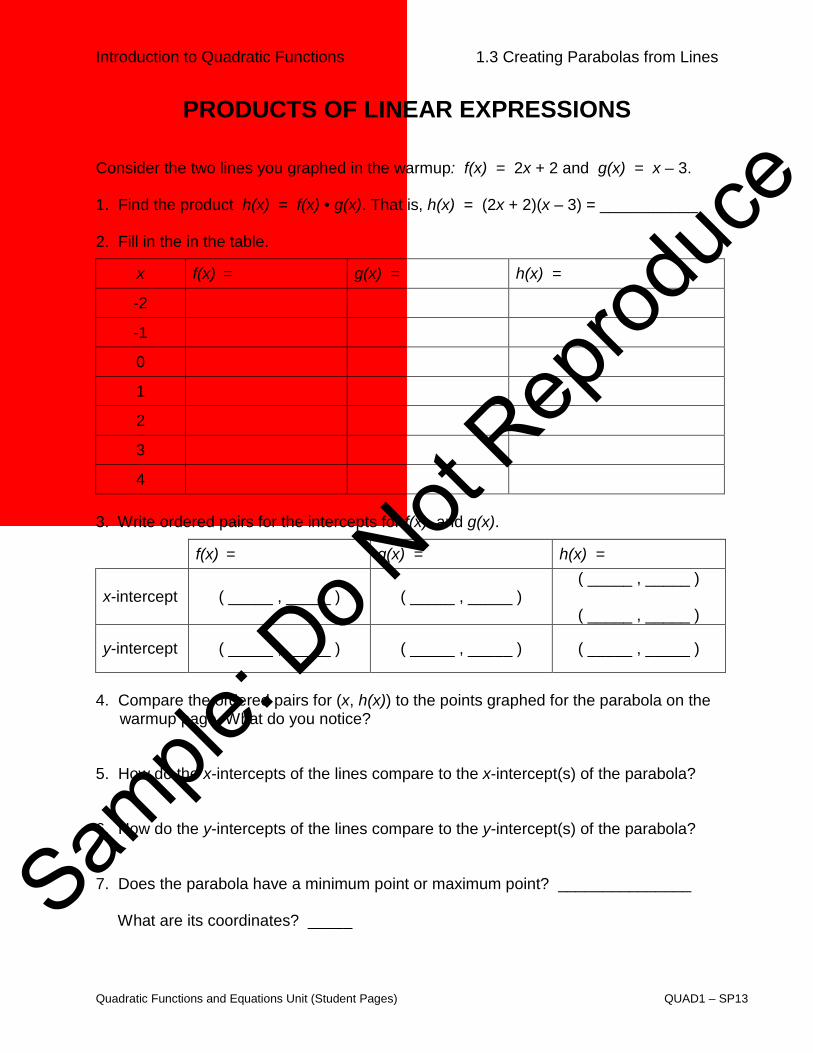
PRODUCTS OF LINEAR EXPRESSIONS Consider the two lines you graphed in the warmup: f(x) = 2x + 2 and g(x) = x – 3. 1. Find the product h(x) = f(x) • g(x). That is, h(x) = (2x + 2)(x – 3) = ___________ 2. Fill in the in the table.
x f(x) = g(x) = h(x) =
-2
-1
0
1
2
3
4
3. Write ordered pairs for the intercepts for f(x) and g(x).
f(x) = g(x) = h(x) =
x-intercept ( _____ , _____ ) ( _____ , _____ ) ( _____ , _____ )
( _____ , _____ )
y-intercept ( _____ , _____ ) ( _____ , _____ ) ( _____ , _____ )
4. Compare the ordered pairs for (x, h(x)) to the points graphed for the parabola on the
warmup page. What do you notice? 5. How do the x-intercepts of the lines compare to the x-intercept(s) of the parabola?
6. How do the y-intercepts of the lines compare to the y-intercept(s) of the parabola? 7. Does the parabola have a minimum point or maximum point? _______________ What are its coordinates? _____ Sam
ple: D
o Not
Reprod
uce
Introduction to Quadratic Functions 1.3 Creating Parabolas from Lines
Quadratic Functions and Equations Unit (Student Pages) QUAD1 – SP14
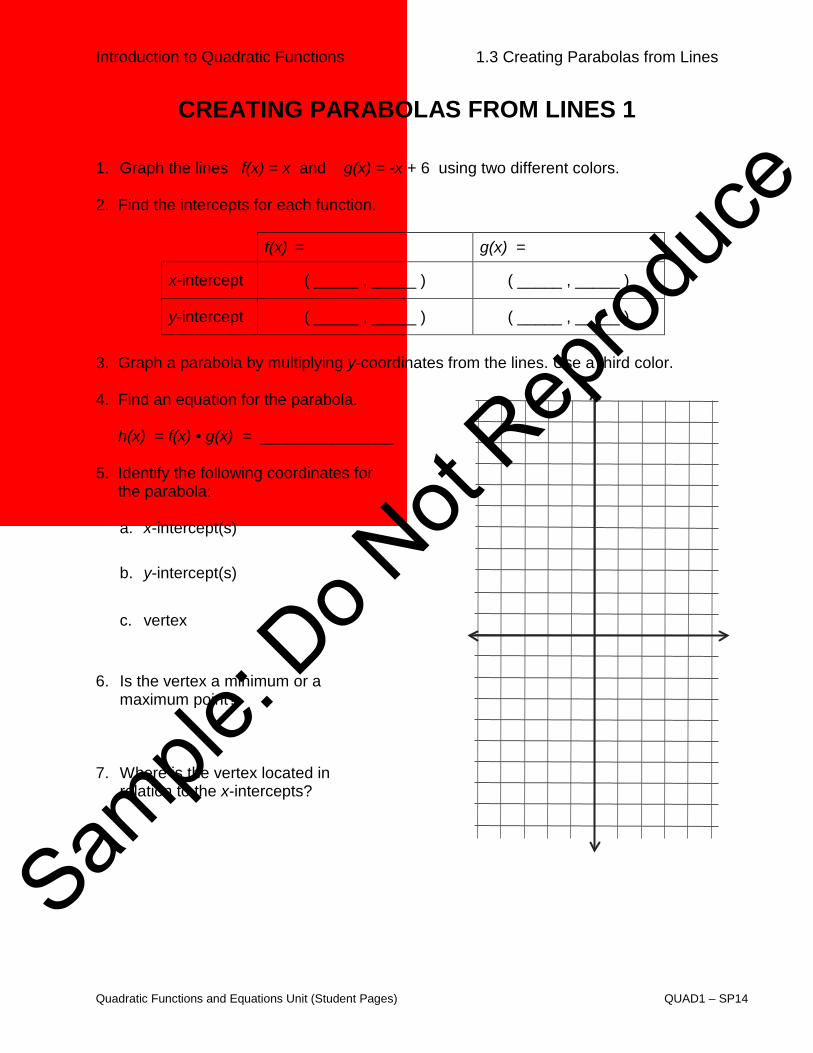
CREATING PARABOLAS FROM LINES 1 1. Graph the lines f(x) = x and g(x) = -x + 6 using two different colors. 2. Find the intercepts for each function.
f(x) = g(x) =
x-intercept ( _____ , _____ ) ( _____ , _____ )
y-intercept ( _____ , _____ ) ( _____ , _____ )
3. Graph a parabola by multiplying y-coordinates from the lines. Use a third color. 4. Find an equation for the parabola. h(x) = f(x) • g(x) = _______________
5. Identify the following coordinates for the parabola:
a. x-intercept(s)
b. y-intercept(s)
c. vertex
6. Is the vertex a minimum or a maximum point?
7. Where is the vertex located in relation to the x-intercepts?
Sam
ple: D
o Not
Reprod
uce
Introduction to Quadratic Functions 1.3 Creating Parabolas from Lines
Quadratic Functions and Equations Unit (Student Pages) QUAD1 – SP15
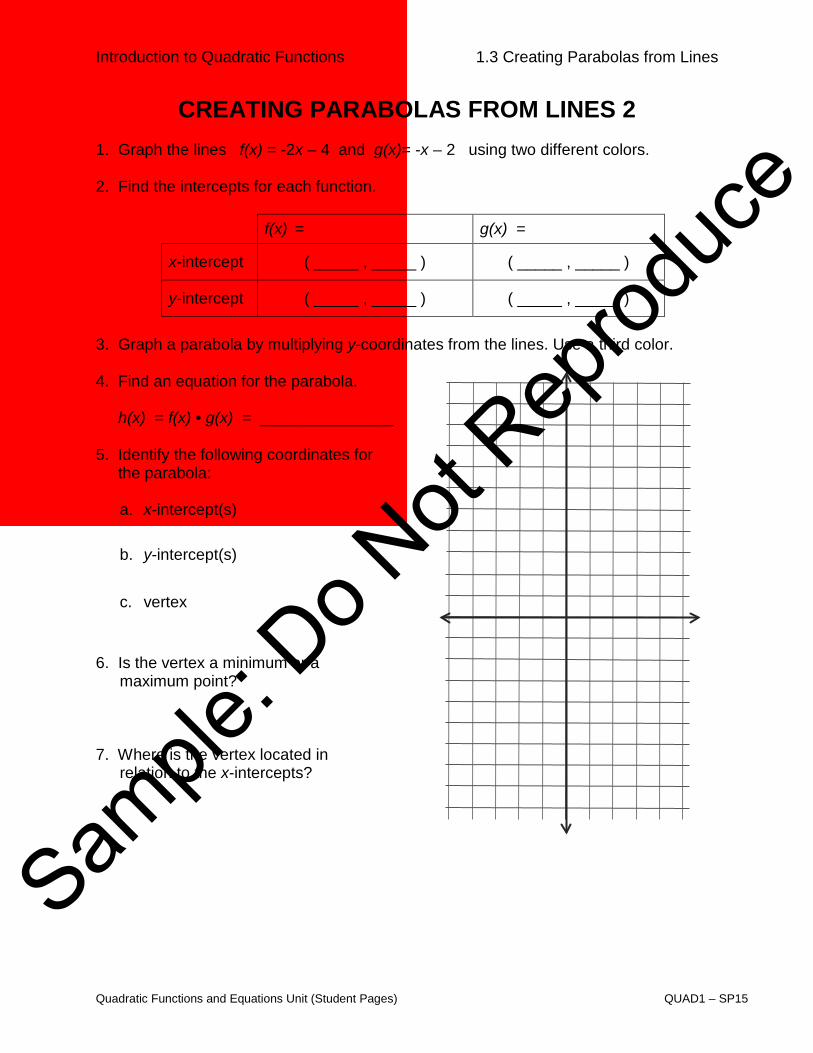
CREATING PARABOLAS FROM LINES 2 1. Graph the lines f(x) = -2x – 4 and g(x)= -x – 2 using two different colors. 2. Find the intercepts for each function.
f(x) = g(x) =
x-intercept ( _____ , _____ ) ( _____ , _____ )
y-intercept ( _____ , _____ ) ( _____ , _____ )
3. Graph a parabola by multiplying y-coordinates from the lines. Use a third color. 4. Find an equation for the parabola. h(x) = f(x) • g(x) = _______________
5. Identify the following coordinates for the parabola:
a. x-intercept(s)
b. y-intercept(s)
c. vertex
6. Is the vertex a minimum or a maximum point?
7. Where is the vertex located in
relation to the x-intercepts?
Sample
: Do N
ot Rep
roduc
e
Introduction to Quadratic Functions 1.3 Creating Parabolas from Lines
Quadratic Functions and Equations Unit (Student Pages) QUAD1 – SP16
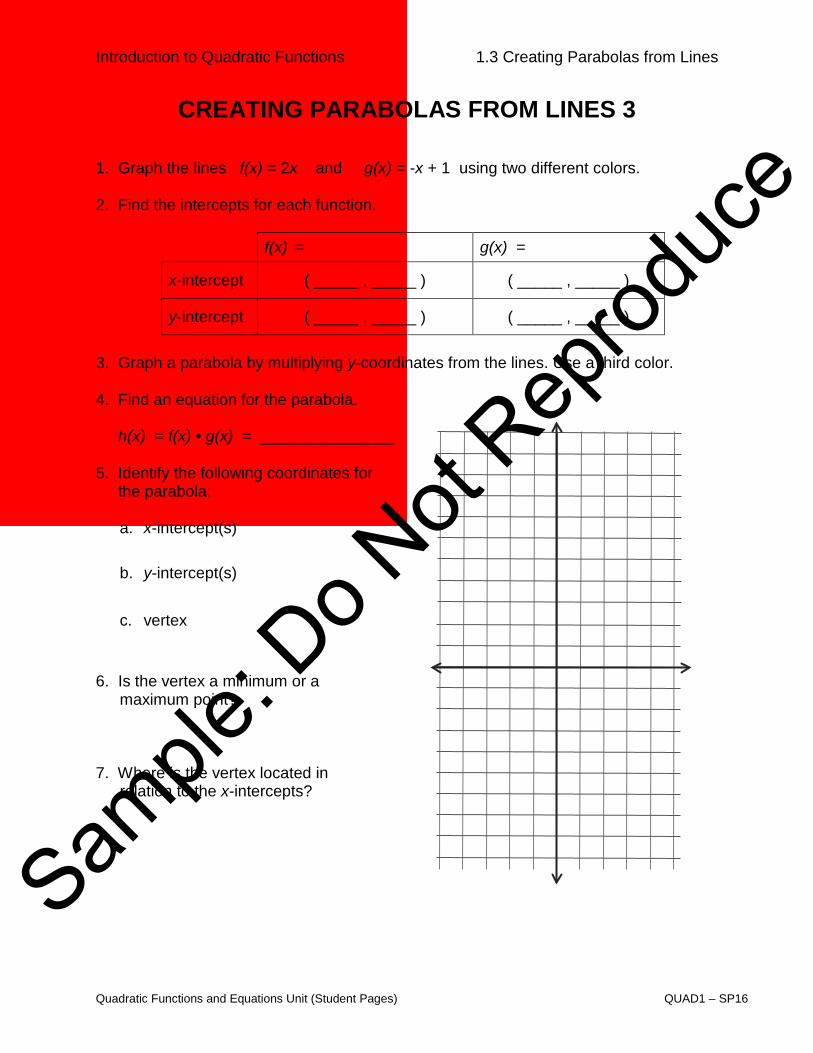
CREATING PARABOLAS FROM LINES 3 1. Graph the lines f(x) = 2x and g(x) = -x + 1 using two different colors. 2. Find the intercepts for each function.
f(x) = g(x) =
x-intercept ( _____ , _____ ) ( _____ , _____ )
y-intercept ( _____ , _____ ) ( _____ , _____ )
3. Graph a parabola by multiplying y-coordinates from the lines. Use a third color. 4. Find an equation for the parabola. h(x) = f(x) • g(x) = _______________
5. Identify the following coordinates for the parabola:
a. x-intercept(s)
b. y-intercept(s)
c. vertex
6. Is the vertex a minimum or a maximum point?
7. Where is the vertex located in
relation to the x-intercepts?
Sample
: Do N
ot Rep
roduc
e
Introduction to Quadratic Functions 1.4 Vocabulary, Skill builders, and Review 1.3
Quadratic Functions and Equations Unit (Student Pages) QUAD1 – SP17
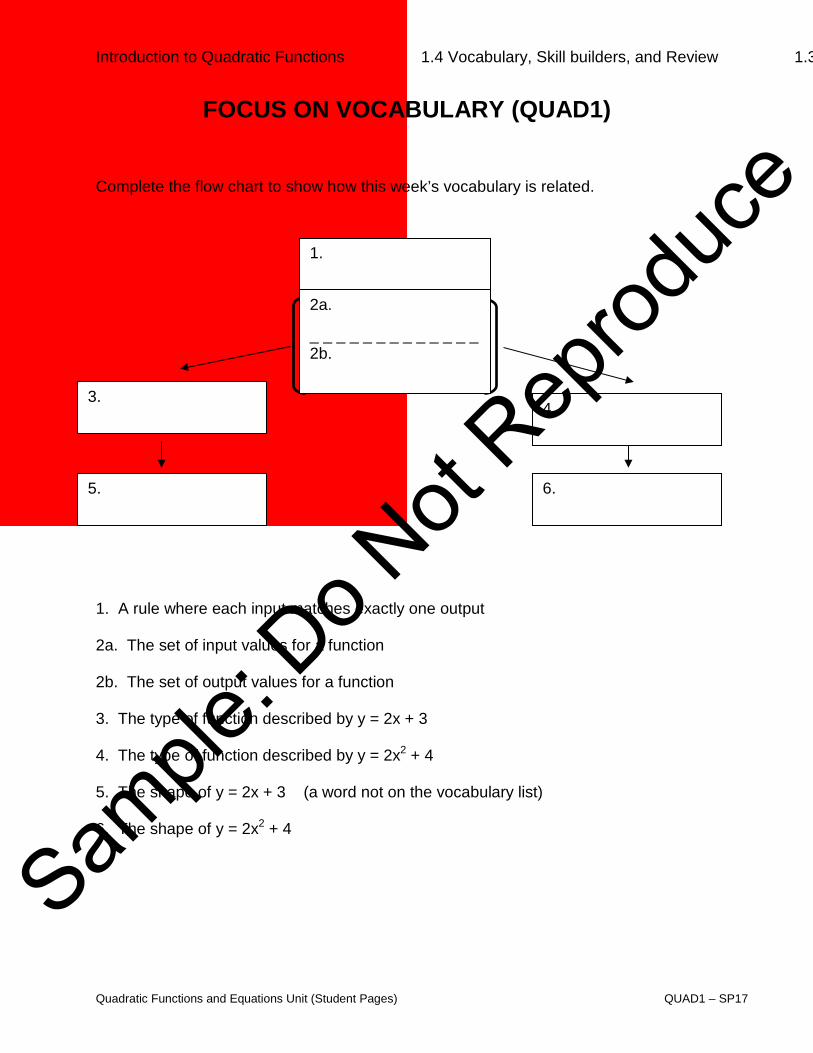
FOCUS ON VOCABULARY (QUAD1) Complete the flow chart to show how this week’s vocabulary is related.
1. A rule where each input matches exactly one output 2a. The set of input values for a function 2b. The set of output values for a function 3. The type of function described by y = 2x + 3 4. The type of function described by y = 2x2 + 4 5. The shape of y = 2x + 3 (a word not on the vocabulary list) 6. The shape of y = 2x2 + 4
1.
2a. _ _ _ _ _ _ _ _ _ _ _ _ _ 2b.
6. 5.
4. 3.
Sample
: Do N
ot Rep
roduc
e
Introduction to Quadratic Functions 1.4 Vocabulary, Skill builders, and Review 1.3
Quadratic Functions and Equations Unit (Student Pages) QUAD1 – SP18
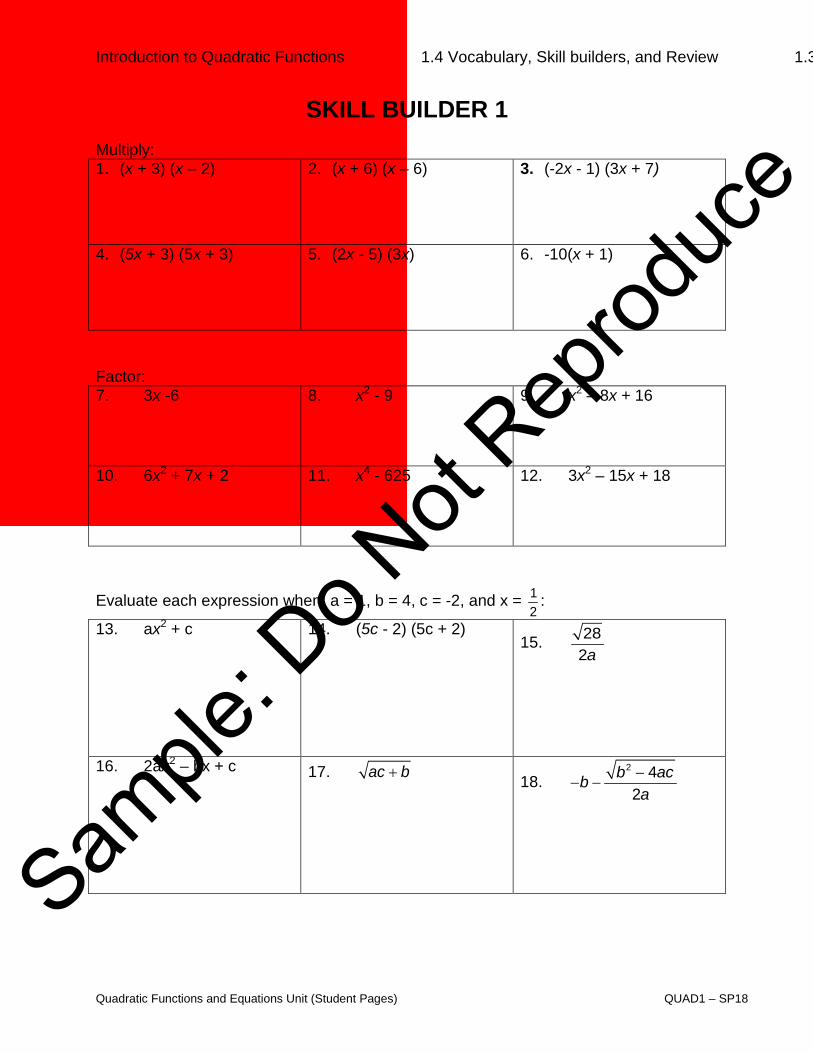
SKILL BUILDER 1 Multiply: 1. (x + 3) (x – 2) 2. (x + 6) (x – 6) 3. (-2x - 1) (3x + 7)
4. (5x + 3) (5x + 3) 5. (2x - 5) (3x) 6. -10(x + 1)
Factor: 7. 3x -6 8. x2 - 9 9. x2 – 8x + 16
10. 6x2 + 7x + 2 11. x4 - 625 12. 3x2 – 15x + 18
Evaluate each expression when a = 1, b = 4, c = -2, and x = 1
2:
13. ax2 + c 14. (5c - 2) (5c + 2) 15. 28
2a
16. 2ax2 – bx + c 17. ac b+ 18. 2 42
b acba−
− −
Sample
: Do N
ot Rep
roduc
e
Introduction to Quadratic Functions 1.4 Vocabulary, Skill builders, and Review 1.3
Quadratic Functions and Equations Unit (Student Pages) QUAD1 – SP19
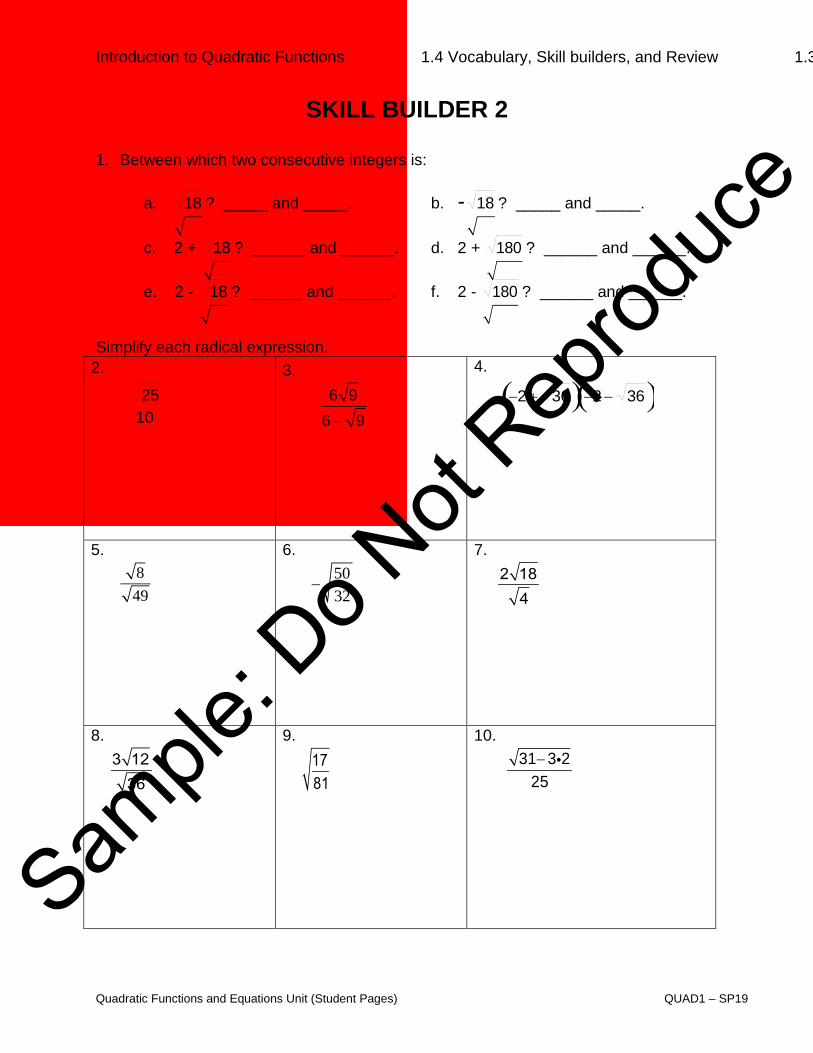
SKILL BUILDER 2
1. Between which two consecutive integers is:
a. 18 ? _____ and _____. b. - 18 ? _____ and _____.
c. 2 + 18 ? ______ and ______. d. 2 + 180 ? ______ and ______.
e. 2 - 18 ? ______ and ______. f. 2 - 180 ? ______ and ______. Simplify each radical expression.
2. 3. 4.
25
10
6 96 − 9
−2+ 36( )−2− 36( )
5. 6. 7.
849
−5032
2 184
8. 9. 10.
3 1236
1781
−31 3 225
Sample
: Do N
ot Rep
roduc
e
Introduction to Quadratic Functions 1.4 Vocabulary, Skill builders, and Review 1.3
Quadratic Functions and Equations Unit (Student Pages) QUAD1 – SP20
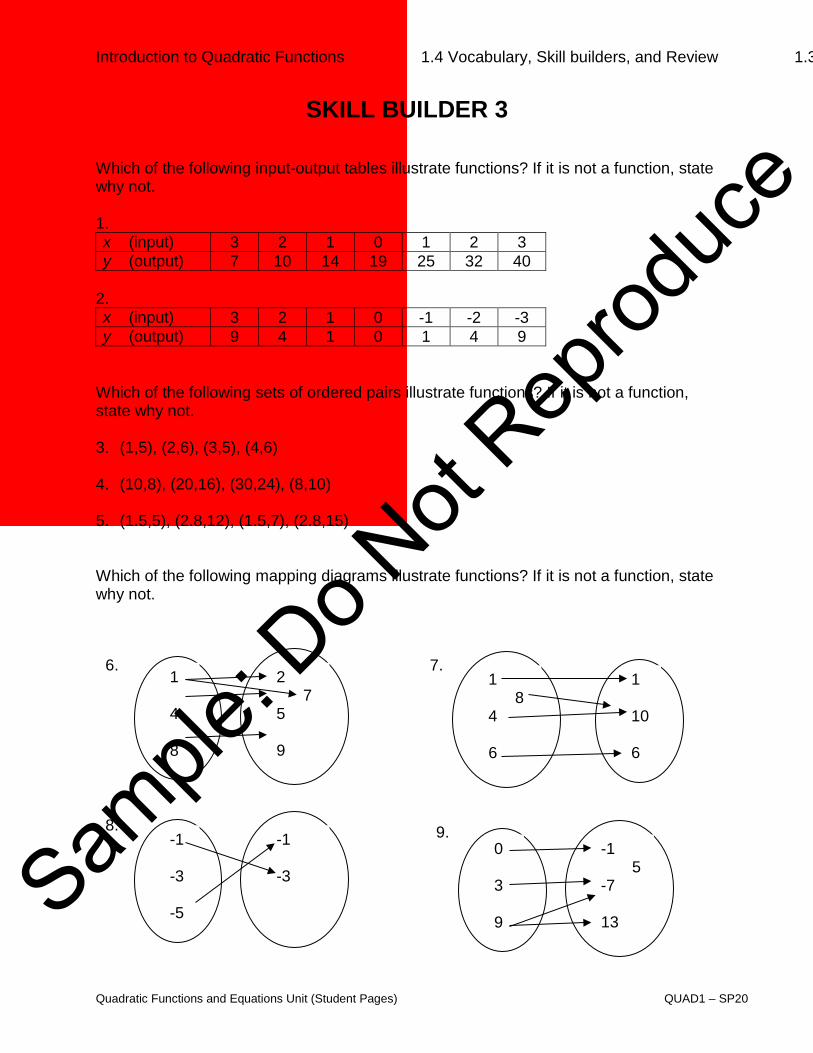
SKILL BUILDER 3 Which of the following input-output tables illustrate functions? If it is not a function, state why not. 1. x (input) 3 2 1 0 1 2 3 y (output) 7 10 14 19 25 32 40
2. x (input) 3 2 1 0 -1 -2 -3 y (output) 9 4 1 0 1 4 9
Which of the following sets of ordered pairs illustrate functions? If it is not a function, state why not. 3. (1,5), (2,6), (3,5), (4,6)
4. (10,8), (20,16), (30,24), (8,10) 5. (1.5,5), (2.8,12), (1.5,7), (2.8,15) Which of the following mapping diagrams illustrate functions? If it is not a function, state why not.
1 8 4 6
1 10 6
0 3 9
-1 5 -7 13
6. 7.
8. 9.
1 4 8
2 7 5 9
-1 -3 -5
-1 -3
Sample
: Do N
ot Rep
roduc
e
Introduction to Quadratic Functions 1.4 Vocabulary, Skill builders, and Review 1.3
Quadratic Functions and Equations Unit (Student Pages) QUAD1 – SP21
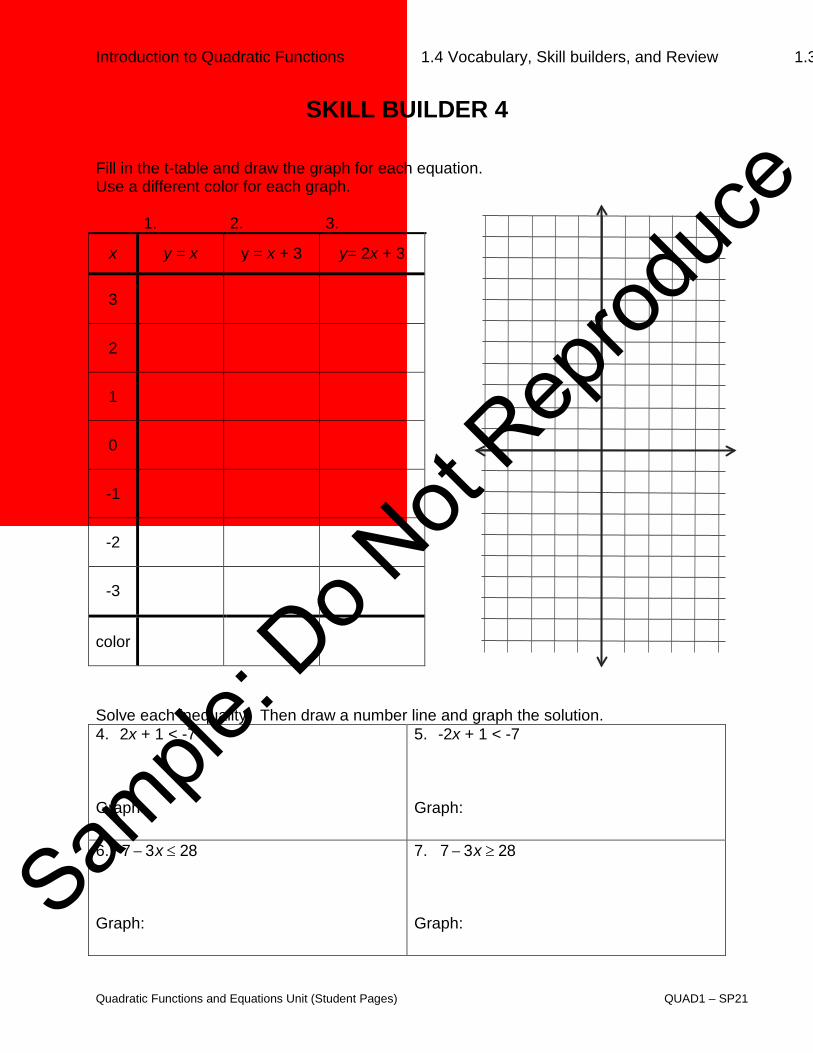
SKILL BUILDER 4 Fill in the t-table and draw the graph for each equation. Use a different color for each graph. 1. 2. 3.
x y = x y = x + 3 y= 2x + 3
3
2
1
0
-1
-2
-3
color
Solve each inequality. Then draw a number line and graph the solution. 4. 2x + 1 < -7
Graph:
5. -2x + 1 < -7
Graph:
6. 7 − 3x ≤ 28 Graph:
7. 7 − 3x ≥ 28 Graph: Sam
ple: D
o Not
Reprod
uce
Introduction to Quadratic Functions 1.4 Vocabulary, Skill builders, and Review 1.3
Quadratic Functions and Equations Unit (Student Pages) QUAD1 – SP22
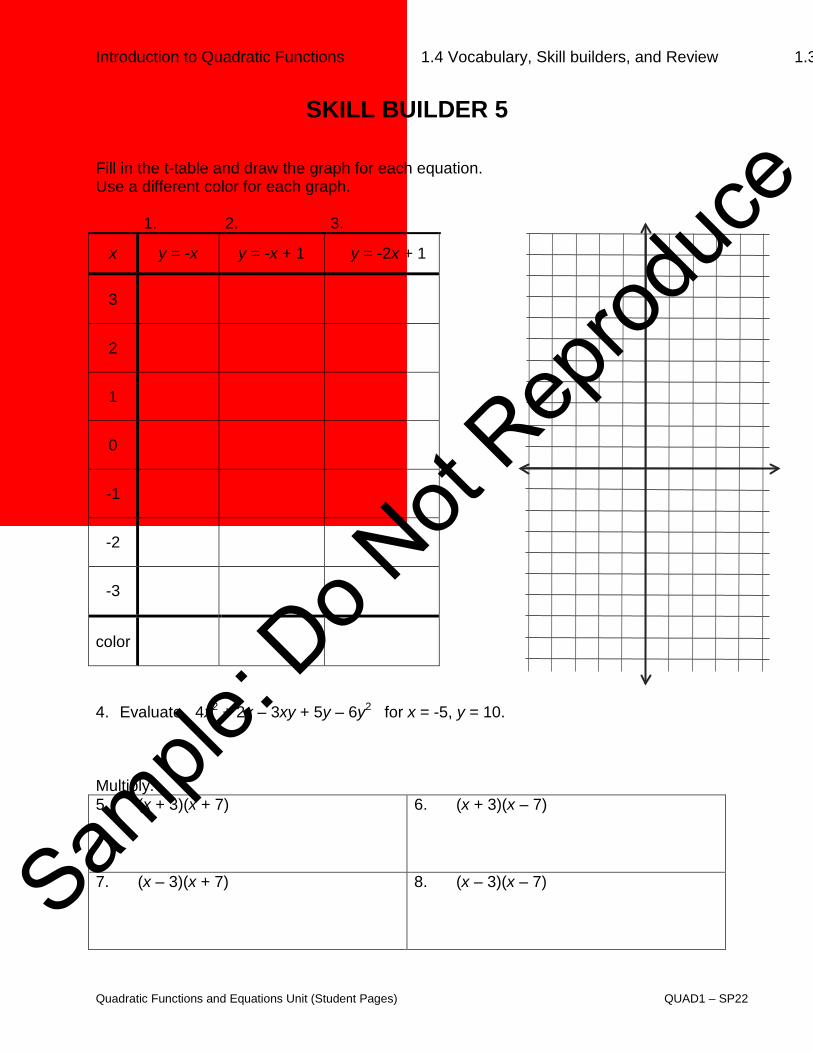
SKILL BUILDER 5 Fill in the t-table and draw the graph for each equation. Use a different color for each graph.
1. 2. 3.
x y = -x y = -x + 1 y = -2x + 1
3
2
1
0
-1
-2
-3
color
4. Evaluate 4x2 + 2x – 3xy + 5y – 6y2 for x = -5, y = 10. Multiply. 5. (x + 3)(x + 7) 6. (x + 3)(x – 7)
7. (x – 3)(x + 7) 8. (x – 3)(x – 7) Sample
: Do N
ot Rep
roduc
e
Introduction to Quadratic Functions 1.4 Vocabulary, Skill builders, and Review 1.3
Quadratic Functions and Equations Unit (Student Pages) QUAD1 – SP23
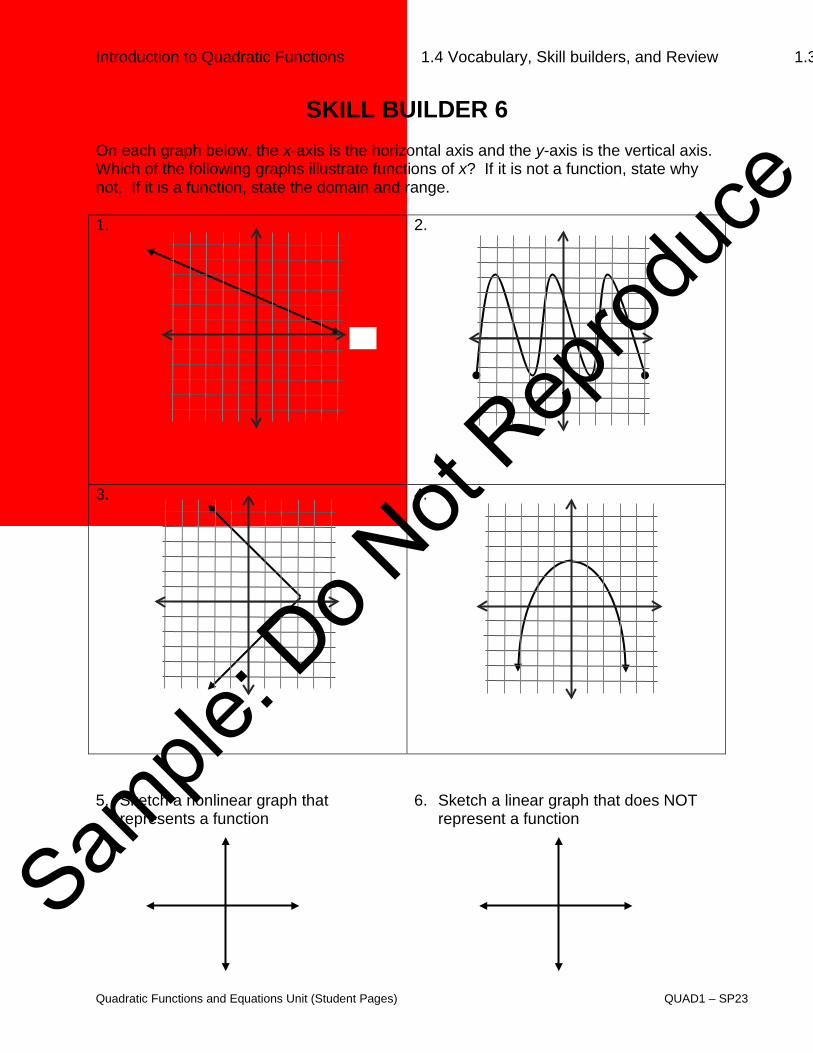
SKILL BUILDER 6
On each graph below, the x-axis is the horizontal axis and the y-axis is the vertical axis. Which of the following graphs illustrate functions of x? If it is not a function, state why not. If it is a function, state the domain and range. 1. 2.
3. 4.
5. Sketch a nonlinear graph that
represents a function 6. Sketch a linear graph that does NOT
represent a function
Sample
: Do N
ot Rep
roduc
e
Introduction to Quadratic Functions 1.4 Vocabulary, Skill builders, and Review 1.3
Quadratic Functions and Equations Unit (Student Pages) QUAD1 – SP24
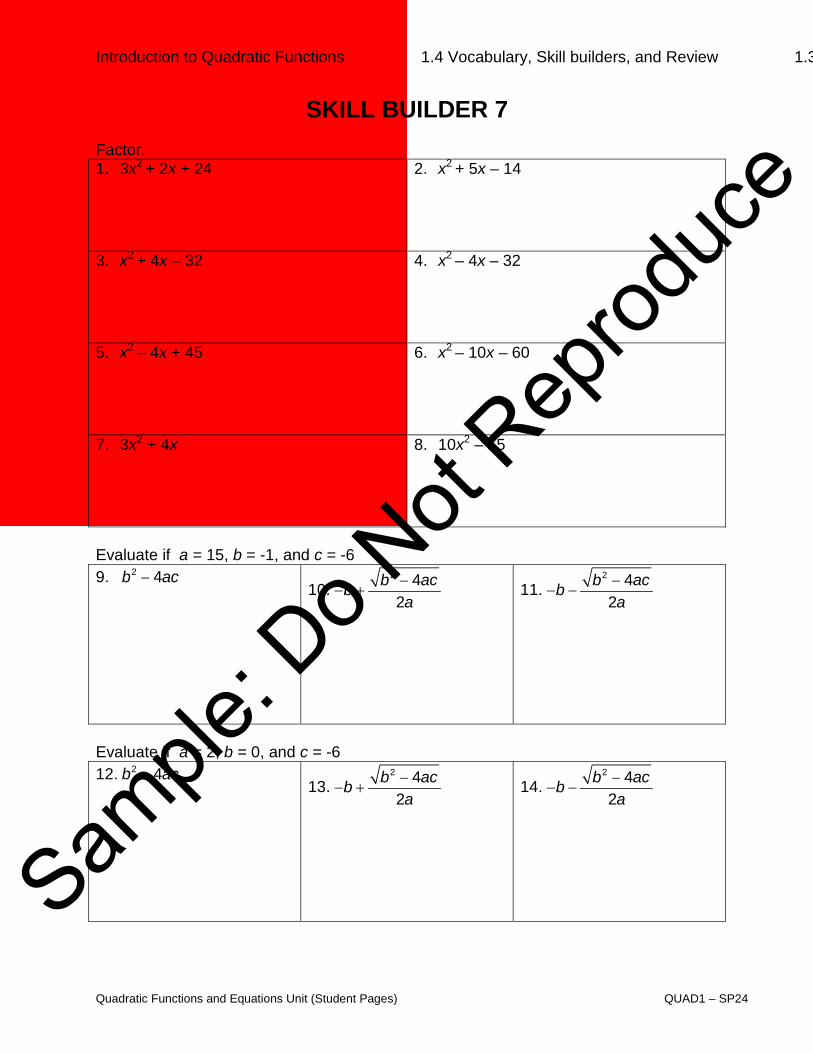
SKILL BUILDER 7 Factor. 1. 3x2 + 2x + 24 2. x2 + 5x – 14
3. x2 + 4x – 32 4. x2 – 4x – 32
5. x2 – 4x + 45 6. x2 – 10x – 60
7. 3x2 + 4x 8. 10x2 – 15
Evaluate if a = 15, b = -1, and c = -6 9. 2 4b ac−
10. 2 42
b acba−
− + 11. 2 42
b acba−
− −
Evaluate if a = 2, b = 0, and c = -6 12. 2 4b ac−
13. 2 42
b acba−
− + 14. 2 42
b acba−
− −
Sample
: Do N
ot Rep
roduc
e
Introduction to Quadratic Functions 1.4 Vocabulary, Skill builders, and Review 1.3
Quadratic Functions and Equations Unit (Student Pages) QUAD1 – SP25
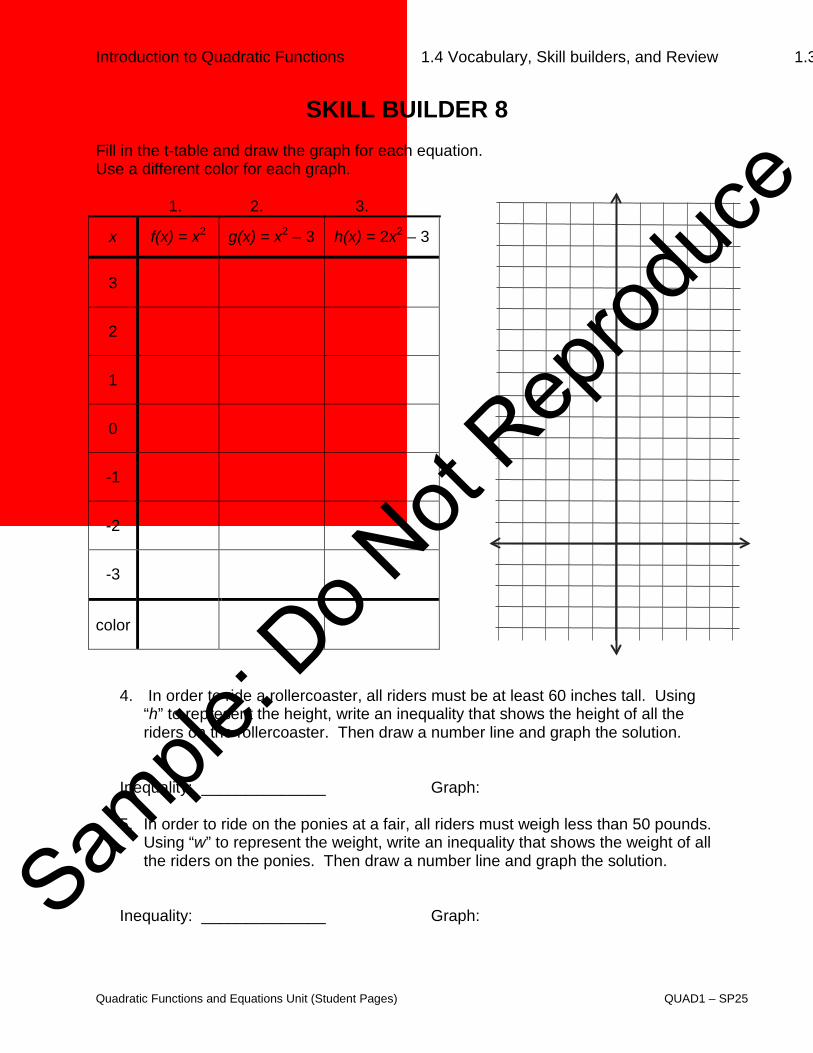
SKILL BUILDER 8 Fill in the t-table and draw the graph for each equation. Use a different color for each graph.
1. 2. 3.
x f(x) = x2 g(x) = x2 – 3 h(x) = 2x2 – 3
3
2
1
0
-1
-2
-3
color
4. In order to ride a rollercoaster, all riders must be at least 60 inches tall. Using “h” to represent the height, write an inequality that shows the height of all the riders on the rollercoaster. Then draw a number line and graph the solution.
Inequality: ______________ Graph: 5. In order to ride on the ponies at a fair, all riders must weigh less than 50 pounds.
Using “w” to represent the weight, write an inequality that shows the weight of all the riders on the ponies. Then draw a number line and graph the solution.
Inequality: ______________ Graph:
Sample
: Do N
ot Rep
roduc
e
Introduction to Quadratic Functions 1.4 Vocabulary, Skill builders, and Review 1.3
Quadratic Functions and Equations Unit (Student Pages) QUAD1 – SP26
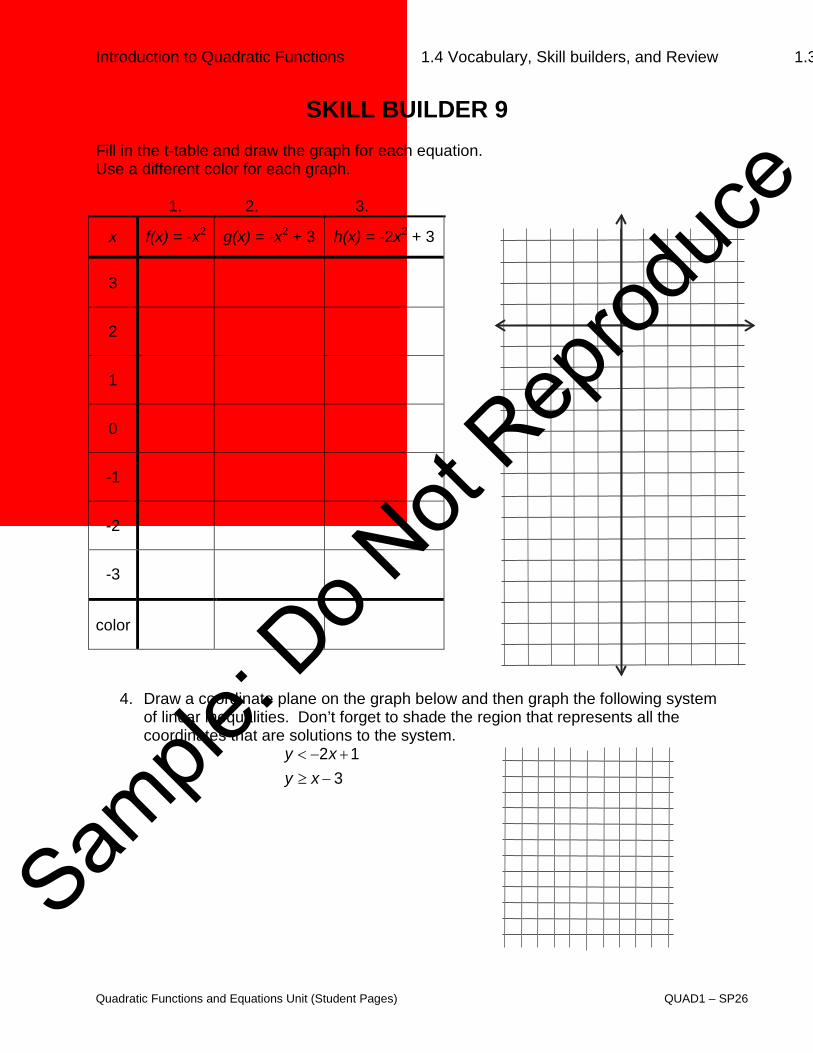
SKILL BUILDER 9 Fill in the t-table and draw the graph for each equation. Use a different color for each graph.
1. 2. 3.
x f(x) = -x2 g(x) = -x2 + 3 h(x) = -2x2 + 3
3
2
1
0
-1
-2
-3
color
4. Draw a coordinate plane on the graph below and then graph the following system of linear inequalities. Don’t forget to shade the region that represents all the coordinates that are solutions to the system.
y < −2x +1y ≥ x − 3
Sample
: Do N
ot Rep
roduc
e

Introduction to Quadratic Functions 1.4 Vocabulary, Skill builders, and Review 1.3
Quadratic Functions and Equations Unit (Student Pages) QUAD1 – SP27
SKILL BUILDER 10 1. Graph the lines f(x) = 1
2x + 3 and g(x) = 1
2x – 3 using two different colors.
2. Find the intercepts for each function.
f(x) = g(x) =
x-intercept ( _____ , _____ ) ( _____ , _____ )
y-intercept ( _____ , _____ ) ( _____ , _____ )
3. Graph a parabola by multiplying y-coordinates from the lines. Use a third color. 4. Find an equation for the parabola. h(x) = f(x) • g(x) = _______________
5. Identify the following coordinates for the parabola:
a. x-intercept(s)
b. y-intercept(s)
c. vertex
8. Is the vertex a minimum or a maximum point?
9. Where is the vertex located in relation to the x-intercepts?
Sample
: Do N
ot Rep
roduc
e
Introduction to Quadratic Functions 1.4 Vocabulary, Skill builders, and Review 1.3
Quadratic Functions and Equations Unit (Student Pages) QUAD1 – SP28
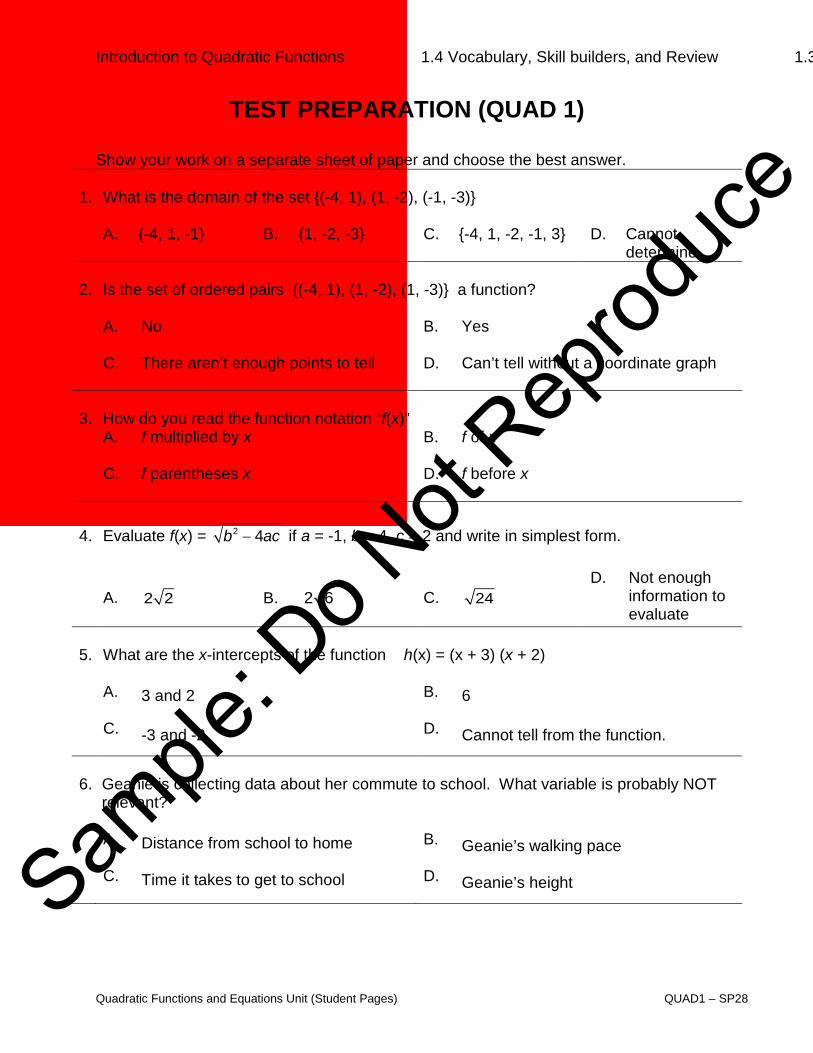
TEST PREPARATION (QUAD 1)
Show your work on a separate sheet of paper and choose the best answer. 1. What is the domain of the set {(-4, 1), (1, -2), (-1, -3)}
A. {-4, 1, -1} B. {1, -2, -3} C. {-4, 1, -2, -1, 3} D. Cannot determine
2. Is the set of ordered pairs {(-4, 1), (1, -2), (1, -3)} a function?
A. No B. Yes
C. There aren’t enough points to tell D. Can’t tell without a coordinate graph
3. How do you read the function notation “f(x)”
A. f multiplied by x B. f of x
C. f parentheses x D. f before x
4. Evaluate f(x) = 2 4b ac− if a = -1, b = 4, c = 2 and write in simplest form. A. 2 2 B. 2 6 C. 24
D. Not enough information to evaluate
5. What are the x-intercepts of the function h(x) = (x + 3) (x + 2)
A. 3 and 2 B. 6
C. -3 and -2 D. Cannot tell from the function.
6. Geanie is collecting data about her commute to school. What variable is probably NOT
relevant?
A. Distance from school to home B. Geanie’s walking pace
C. Time it takes to get to school D. Geanie’s height
Sample
: Do N
ot Rep
roduc
e
Introduction to Quadratic Functions 1.4 Vocabulary, Skill builders, and Review 1.3
Quadratic Functions and Equations Unit (Student Pages) QUAD1 – SP29
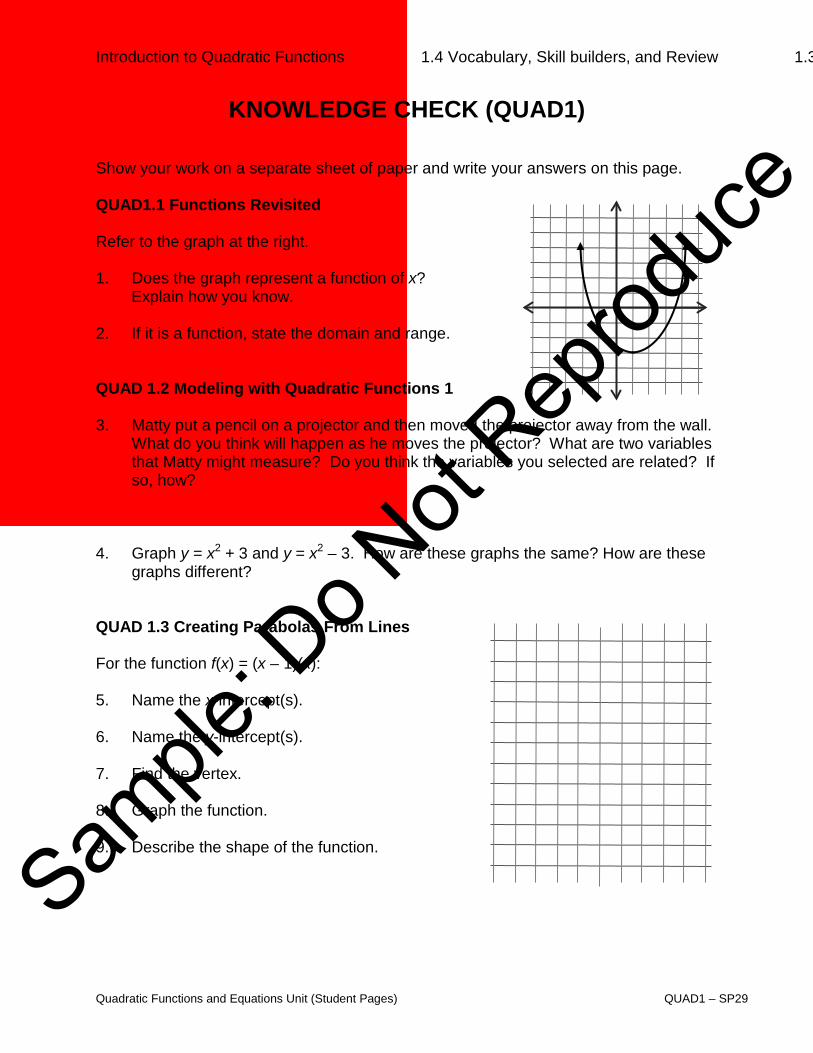
KNOWLEDGE CHECK (QUAD1)
Show your work on a separate sheet of paper and write your answers on this page. QUAD1.1 Functions Revisited Refer to the graph at the right.
1. Does the graph represent a function of x? Explain how you know. 2. If it is a function, state the domain and range.
QUAD 1.2 Modeling with Quadratic Functions 1 3. Matty put a pencil on a projector and then moved the projector away from the wall.
What do you think will happen as he moves the projector? What are two variables that Matty might measure? Do you think the variables you selected are related? If so, how?
4. Graph y = x2 + 3 and y = x2 – 3. How are these graphs the same? How are these graphs different?
QUAD 1.3 Creating Parabolas From Lines For the function f(x) = (x – 1)(x): 5. Name the x-intercept(s).
6. Name the y-intercept(s). 7. Find the vertex. 8. Graph the function. 9. Describe the shape of the function.
Sample
: Do N
ot Rep
roduc
e
Introduction to Quadratic Functions 1.4 Vocabulary, Skill builders, and Review 1.3
Quadratic Functions and Equations Unit (Student Pages) QUAD1 – SP30
This page is left blank intentionally.
Sample
: Do N
ot Rep
roduc
e

Introduction to Quadratic Functions 1.4 Vocabulary, Skill builders, and Review 1.3
Quadratic Functions and Equations Unit (Student Pages) QUAD1 – SP31
This page is left blank intentionally.
Sample
: Do N
ot Rep
roduc
e

Introduction to Quadratic Functions 1.4 Vocabulary, Skill builders, and Review 1.3
Quadratic Functions and Equations Unit (Student Pages) QUAD1 – SP32
This page is left blank intentionally.
Sample
: Do N
ot Rep
roduc
e
Introduction to Quadratic Functions
Quadratic Functions and Equations Unit (Student Pages) QUAD1 – SP33
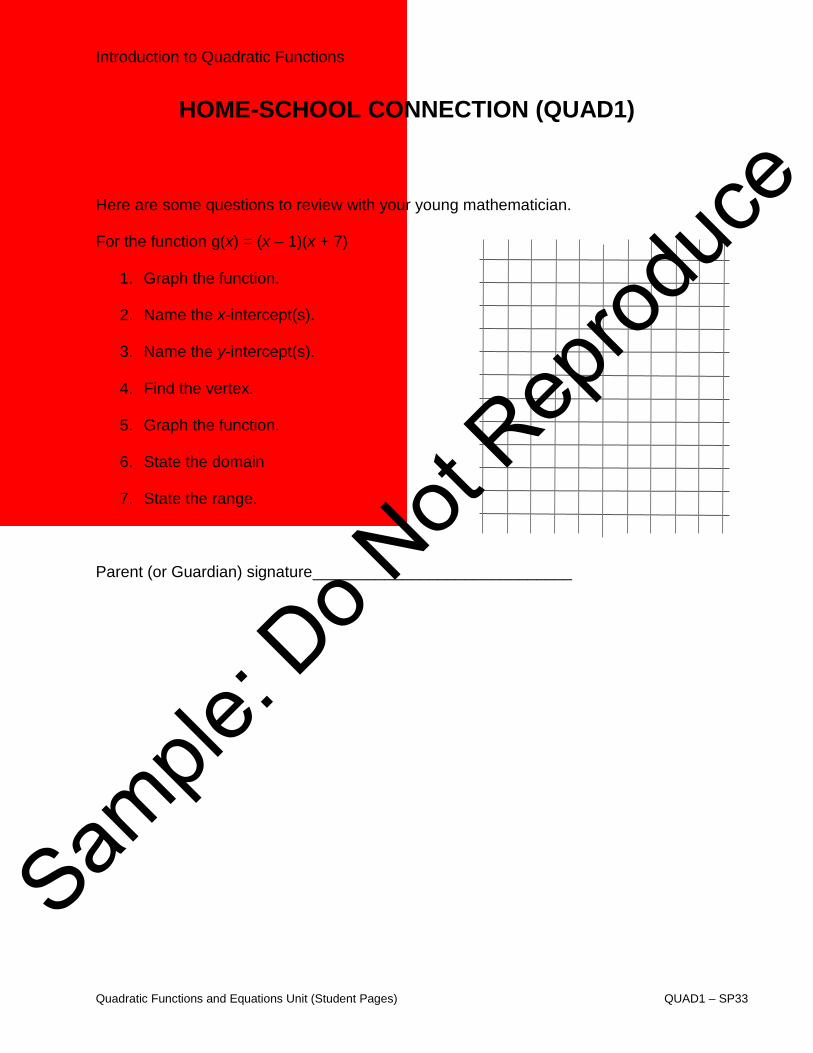
HOME-SCHOOL CONNECTION (QUAD1) Here are some questions to review with your young mathematician. For the function g(x) = (x – 1)(x + 7)
1. Graph the function.
2. Name the x-intercept(s). 3. Name the y-intercept(s).
4. Find the vertex.
5. Graph the function.
6. State the domain
7. State the range.
Parent (or Guardian) signature _____________________________
Sample
: Do N
ot Rep
roduc
e
Introduction to Quadratic Functions
Quadratic Functions and Equations Unit (Student Pages) QUAD1 – SP34
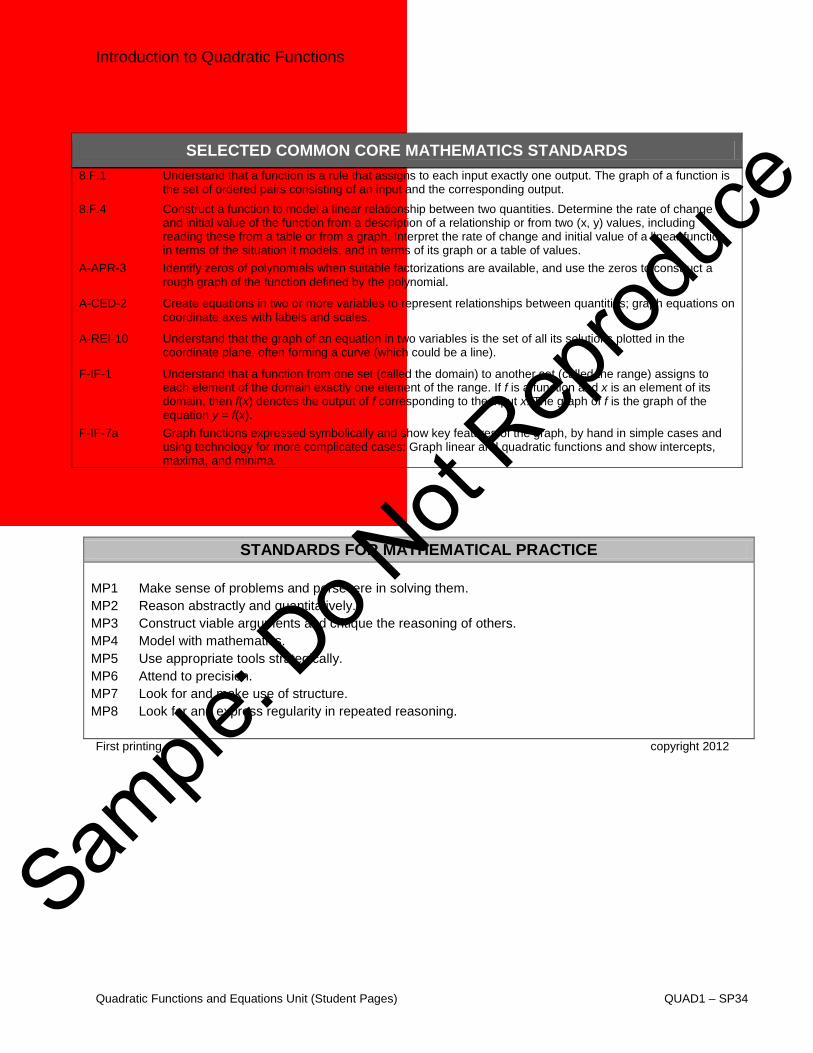
8.F.1 Understand that a function is a rule that assigns to each input exactly one output. The graph of a function is the set of ordered pairs consisting of an input and the corresponding output.
8.F.4 Construct a function to model a linear relationship between two quantities. Determine the rate of change and initial value of the function from a description of a relationship or from two (x, y) values, including reading these from a table or from a graph. Interpret the rate of change and initial value of a linear function in terms of the situation it models, and in terms of its graph or a table of values.
A-APR-3 Identify zeros of polynomials when suitable factorizations are available, and use the zeros to construct a rough graph of the function defined by the polynomial.
A-CED-2 Create equations in two or more variables to represent relationships between quantities; graph equations on coordinate axes with labels and scales.
A-REI-10 Understand that the graph of an equation in two variables is the set of all its solutions plotted in the coordinate plane, often forming a curve (which could be a line).
F-IF-1 Understand that a function from one set (called the domain) to another set (called the range) assigns to each element of the domain exactly one element of the range. If f is a function and x is an element of its domain, then f(x) denotes the output of f corresponding to the input x. The graph of f is the graph of the equation y = f(x).
F-IF-7a Graph functions expressed symbolically and show key features of the graph, by hand in simple cases and using technology for more complicated cases: Graph linear and quadratic functions and show intercepts, maxima, and minima.
STANDARDS FOR MATHEMATICAL PRACTICE MP1 Make sense of problems and persevere in solving them. MP2 Reason abstractly and quantitatively. MP3 Construct viable arguments and critique the reasoning of others. MP4 Model with mathematics. MP5 Use appropriate tools strategically. MP6 Attend to precision. MP7 Look for and make use of structure. MP8 Look for and express regularity in repeated reasoning. First printing copyright 2012
SELECTED COMMON CORE MATHEMATICS STANDARDS
Sample
: Do N
ot Rep
roduc
e