q4 16 earnings-presslides_final
TRANSCRIPT

Supplemental Slides to Q4 2016 Earnings Call – February 22, 2017

DISCLAIMER
1
The statements contained in this presentation include certain forward-looking statements that are based largely on the current expectations of tronc, Inc. and reflect various estimates and assumptions by us. Forward-looking statements are subject to certain risks, trends and uncertainties that could cause actual results and achievements to differ materially from those expressed in such forward-looking statements. Such risks, trends and uncertainties, which in some instances are beyond our control, are described under the heading “Risk Factors” in tronc’s filings with the Securities and Exchange Commission, and include, without limitation:
The words “may,” “believe,” “anticipate,” “expect,” “project,” “intend”, “plan,” “projections,” “will,” “continue,” “business outlook,” “outlook,” “estimate” and similar expressions generally identify forward-looking statements. Whether or not any such forward-looking statements are in fact achieved will depend on future events, some of which are beyond our control. You are cautioned not to place undue reliance on such forward-looking statements, which are being made as of the date of this presentation. We undertake no obligation to update any forward-looking statements, whether as a result of new information, future events or otherwise, except as required by law.
changes in advertising demand, circulation levels and audience shares;
competition and other economic conditions;
our ability to develop and grow our online businesses;
changes in newsprint price;
our ability to establish and maintain effective internal control over financial reporting;
concentration of stock ownership among our existing directors and principal stockholders whose interests may differ from those of other stockholders; and
other events beyond our control that may result in unexpected adverse operating results.

2
Creating a billion dollar online media network

3
We are a premium content company
committed to delivering innovative experiences across all platforms that
engage, inform, and inspire audiences through our iconic
and trusted brands. We provide solutions that drive results for
our customers.

STRONG MARKET POSITION IN LARGE AND DIVERSE REGIONS
Notes *1 Average Circulation: Q4, 2016 AAM Sunday *2 Unique Visitors: comScore Q4, 2016 Monthly Average Unique Visitors (unduplicated) *3 Chicago Tribune paid print circulation also includes Chicago Suburban *4 The Baltimore Sun paid print circulation also includes Capital Gazette and Carroll County Times *5 The Morning Call focuses on the Lehigh Valley region within the 4th largest DMA (Philadelphia) 4
tronc Q4 Average Circulation – 2.9M*1
Q4 Unique Visitors – 56.7M*2
3
5
1
2 5 4
6
7
8
9 3
1 Average Circulation – 828k Unique Visitors – 35.5M #2 DMA
2 Average Circulation – 217k Unique Visitors – 0.9M #28 DMA
5 Average Circulation – 191k Unique Visitors – 4.2M #18 DMA
4 Average Circulation – 184k Unique Visitors – 3.0M #16 DMA
6 Average Circulation – 82k Unique Visitors – 0.6M #42 DMA
7 Average Circulation – 287k Unique Visitors – 3.8M #26 DMA
8 Average Circulation – 114k Unique Visitors – 1.2M #4 (#55) DMA
9 Average Circulation – 159k Unique Visitors – 1.4M #30 DMA
3 Average Circulation – 797k Unique Visitors – 17.9M #3 DMA
*3
*5
*4

5
DIGITAL STRATEGY AND TRENDS
1 Unique Visitors: comScore Q4, 2016 Monthly Average (unduplicated) 5
UNIQUE VISITORS (M)1
DIGITAL ONLY SUBSCRIBERS (000’S)
Focus Areas
Market to our Audience
Leverage our legacy distribution
Build, buy and syndicate content
Other Highlights
Video creation
Launch of data intelligence tool
Transition to new Recruitment
Advertising Platform with RealMatch
Solidify the sales infrastructure
Technology infrastructure
enhancements
Back office enhancements
Key Highlights

6 6
Total Consolidated Revenue was down 6.9% in
the 4th Quarter 2016 vs. 2015 (and down 4.0%
Full Year 2016 vs. 2015)
GAAP Net Income was up in the quarter and the
Full Year (FY) versus last year
Adjusted EBITDA (AEBITDA)1 was down slightly in
Q4 2016 vs. 2015 by $1.7M
AEBITDA was up $23.5M FY 2016 vs. 2015
(↑15.0%)
AEBITDA1 margins have improved 70 basis points
(BP) comparing Q4 of 2016 vs. 2015
AEBITDA1 margins are up 180 BP FY 2016 vs. 2015
REVE
NU
E
Highlights
1Adjusted EBITDA (AEBITDA) is a non-GAAP measure. Please refer to the definition of Adjusted EBITDA and the Reconciliation of GAAP to Non-GAAP in the appendix
CONSOLIDATED FINANCIALS ($’S IN MILLIONS)
NO
N-G
AAP
Ad
j EBI
TDA1
GAA
P
NET
INCO
ME
Q4 FULL YEAR

7
BALANCE SHEET ($’S IN MILLIONS)
7
Highlights Strengthened Balance Sheet
Largest Cash Balance since the spin in 2014
$158M Cash increase since 2015
Ongoing Debt and Pension Reductions
$26M↓ since end of 2015
Substantial reduction in Net Debt [Debt – Cash]
0.95x Net Debt to LTM AEBITDA
Flexibility to execute key strategies
Working Capital
Net Debt1 (Total Debt – Cash)
1Net Debt is a non-GAAP measure and is defined as Debt ($371M in Q4, 2016 and $390M in Q4, 2015) less Cash ($198M in Q4, 2016 and $41M in Q4, 2015). Please refer to the discussion of Net Debt in the appendix.
S-T
port
ion
L-
T D
ebt
L-T
Deb
t
Cash Debt Pension and post-retirement benefits payable
$371
$390
8 8
REVE
NU
E N
ON
-GAA
P
Adj E
BITD
A1
Q4 FULL YEAR Q4 FULL YEAR
1Adjusted EBITDA (AEBITDA) is a non-GAAP measure. Please refer to the definition of Adjusted EBITDA and the Reconciliation of GAAP to Non-GAAP in the appendix
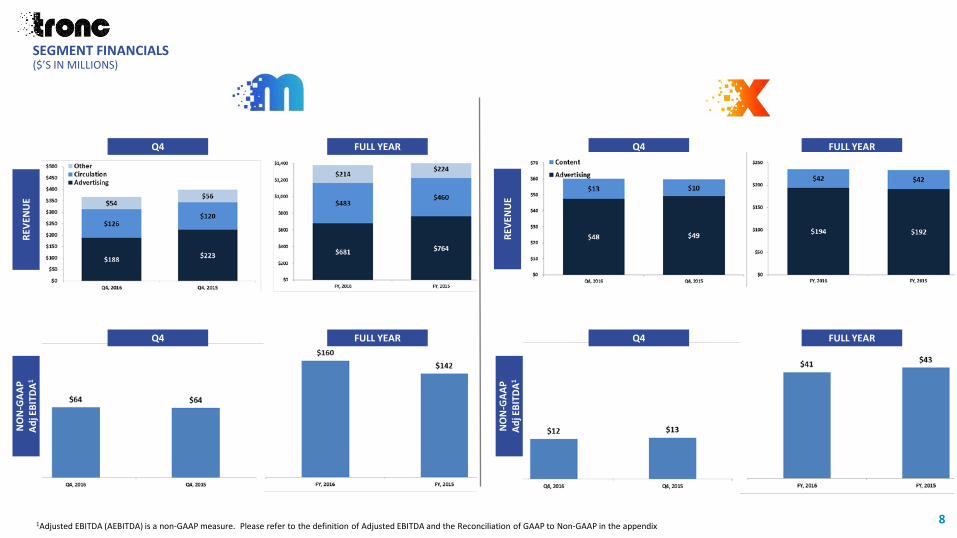
SEGMENT FINANCIALS ($’S IN MILLIONS)
Q4 FULL YEAR Q4 FULL YEAR
NO
N-G
AAP
Ad
j EBI
TDA1
REVE
NU
E

9 9
Revenue Guidance Adjusted EBITDA Guidance
FULL YEAR 2017 GUIDANCE ($’S IN MILLIONS)
$1,570 – 1,600M
$1,606M
$185 – 195M
$180.5M
10
APPENDIX
Supplemental Slides to Q2 2016 Earnings Call – August 3, 2016

This presentation includes references to Adjusted EBITDA (also referred to as “Adj EBITDA” or “AEBITDA”), Adjusted EBITDA margin, Net Debt and Adjusted Operating Expenses. These measures are not presented in accordance with generally accepted accounting principles in the United States (US GAAP), and tronc’s use of these terms may vary from that of others in the Company’s industry. These measures should not be considered as an alternative to net income (loss), income from operations, net income (loss) per diluted share, revenues or any other performance measures derived in accordance with US GAAP as measures of operating performance or liquidity. Adjusted EBITDA (AEBITDA) and AEBITDA margin
Adjusted EBITDA is defined as net income before equity in earnings of unconsolidated affiliates, income taxes, interest expense, other (expense) income, realized gain (loss) on investments, reorganization items, depreciation and amortization, and other items that the Company does not consider in the evaluation of ongoing operating performance. These items include stock-based compensation expense, restructuring charges, transaction expenses, and certain other charges and gains that the Company does not believe reflects the underlying business performance (including spin-related costs). AEBITDA margin is defined as Adjusted EBTIDA divided by Revenue. Management believes that because Adjusted EBITDA excludes (i) certain non-cash expenses (such as depreciation, amortization, stock-based compensation, and gain/loss on equity investments) and (ii) expenses that are not reflective of the Company’s core operating results over time (such as restructuring costs, including the employee voluntary separation program and gain/losses on employee benefit plan terminations, litigation or dispute settlement charges or gains, and transaction-related costs), this measure provides investors with additional useful information to measure the Company’s financial performance, particularly with respect to changes in performance from period to period. The Company's management uses Adjusted EBITDA and Adjusted EBITDA margin (a) as a measure of operating performance; (b) for planning and forecasting in future periods; and (c) in communications with the Company’s Board of Directors concerning the Company’s financial performance. In addition, Adjusted EBITDA, or a similarly calculated measure, is used as the basis for certain financial maintenance covenants that the Company is subject to in connection with certain credit facilities. Since not all companies use identical calculations, the Company's presentation of Adjusted EBITDA and AEBITDA margin may not be comparable to other similarly titled measures of other companies and should not be used by investors as a substitute or alternative to net income or any measure of financial performance calculated and presented in accordance with GAAP. Instead, management believes Adjusted EBITDA and AEBITDA margin should be used to supplement the Company’s financial measures derived in accordance with GAAP to provide a more complete understanding of the trends affecting the business.
Although Adjusted EBITDA is frequently used by investors and securities analysts in their evaluations of companies, Adjusted EBITDA has limitations as an analytical tool, and investors should not consider it in isolation or as a substitute for, or more meaningful than, amounts determined in accordance with GAAP. Some of the limitations to using non-GAAP measures as an analytical tool are: they do not reflect the Company’s interest income and expense, or the requirements necessary to service interest or principal payments on the Company’s debt; they do not reflect future requirements for capital expenditures or contractual commitments; and although depreciation and amortization charges are non-cash charges, the assets being depreciated and amortized will often have to be replaced in the future, and non-GAAP measures do not reflect any cash requirements for such replacements.
The Company does not provide a reconciliation of Adjusted EBITDA guidance for fiscal 2017 due to the inherent difficulty in forecasting and quantifying certain amounts that are necessary for such reconciliation, including adjustments that could be made for restructuring and transaction costs, stock-based compensation amounts and other charges reflected in the Company’s reconciliation of historic numbers, the amount of which, based on historical experience, could be significant.
Net Debt
Net Debt is defined as Total Debt less Cash. The Company’s management believes that the presentation of Net Debt provides useful information to investors as management reviews Net Debt as part of its management of our overall liquidity, financial flexibility, capital structure and leverage.
Adjusted Total Operating Expenses
Adjusted total operating expenses consist of total operating expenses per the income statement, adjusted to exclude the impact of items listed in the Adjusted EBITDA non-GAAP reconciliation and expenses relating to The San Diego Union-Tribune. Management believes that Adjusted total operating expenses is informative to investors as it enhances the investors' overall understanding of the financial performance of the Company's business as they analyze current results compared to prior periods.
Supplemental Slides to Q2 2016 Earnings Call – August 3, 2016 11
APPENDIX: NON-GAAP

12
RECONCILIATION OF NET INCOME (LOSS) TO ADJUSTED EBITDA (AEBITDA) ($’S IN 000’S)
(1) - Restructuring and transaction costs include costs related to tronc’s internal restructuring, such as severance and IT outsourcing efforts, charges associated with the vacated space and costs related to completed and potential acquisitions. (2) - Adjustments to litigation settlement reserve.

13
RECONCILIATION OF NET INCOME (LOSS) TO ADJUSTED EBITDA (AEBITDA) ($’S IN 000’S)
(1) - Restructuring and transaction costs include costs related to tronc’s internal restructuring, such as severance and IT outsourcing efforts, charges associated with the vacated space and costs related to completed and potential acquisitions.
Three months endedMarch 27, 2016 June 26, 2016 September 25, 2016 December 25, 2016 LTM 2016
Net Income (6,463)$ 4,056$ (10,472)$ 19,416$ 6,537$
Income tax expense (benefit) (4,409) 3,360 4,352 15,621 18,924 Loss on equity investments, net 129 168 190 203 690 Interest (expense), net 6,744 6,699 6,673 6,587 26,703 Reorganization items, net 94 49 93 23 259
Income from Operations (3,905) 14,332 836 41,850 53,113 Depreciation and amoritization 14,124 14,300 14,375 14,700 57,499 Restructuring and transaction costs (1) 13,986 9,114 17,020 5,796 45,916 Stock-based compensation 1,619 2,200 2,181 2,424 8,424 Employee voluntary separation plan 7,804 3,564 2,172 2,049 15,589
Adjusted EBITDA 33,628$ 43,510$ 36,584$ 66,819$ 180,541$

14
RECONCILIATION OF TOTAL OPERATING EXPENSES TO ADJUSTED TOTAL OPERATING EXPENSES(1) ($’S IN 000’S)

15 15
SEGMENT RESULTS –Q4 / YTD ($’S IN 000’S)

16 16
SEGMENT RESULTS ($’S IN MILLION’S)
tronc M tronc X$'s in millions $'s in millions
2016 2015 % Change 2016 2015 % Change
Advertising 681$ 764$ -11% Advertising 194$ 192$ 1%Circulation 483 460 5% Content 42 42 1%Other 214 224 -5%Total Revenue 1,378 1,448 -5% Total Revenue 236 234 1%
Operating Expenses 1,257 1,346 -7% Operating Expenses 211 195 8%
Income from operations 121 103 18% Income from operations 26 39 -34%
D&A 24 21 11% D&A 12 2 396%Adjustments 15 18 -16% Adjustments 4 2 125%
Adjusted EBITDA 160$ 142$ 12% Adjusted EBITDA 41$ 43$ -4%
Notes:Fiscal, 2016 ended December 25, 2016Fiscal, 2015 ended December 27, 2015
Twelve months ended Twelve months ended

Supplemental Slides to Q4 2016 Earnings Call – February 22, 2017