q4 & fy21 earnings update
TRANSCRIPT
Q4 & FY21 – Earnings update
May 28, 2021
Disclaimer
This presentation contains certain “forward looking statements” including, but without limitation, statements relating to the implementation of strategic initiatives,
and other statements relating to Max Healthcare Institute Limited’s (“MHIL” / “MHC”) future business developments and economic performance. While these
forward-looking statements indicate our assessment and future expectations concerning the development of our business, a number of risks, uncertainties and other
unknown factors could cause actual developments and results to differ materially from our expectations. These factors include, but are not limited to, general market
conditions, macro-economic, governmental and regulatory trends, movements in currency exchange and interest rates, competitive pressures, technological
developments, changes in the financial conditions of third parties dealing with us, regulatory developments, and other key factors beyond the control of MHIL, such
as Covid-19, lockdowns etc. that could adversely affect our business and financial performance. MHIL undertakes no obligation to publicly revise any forward looking
statements to reflect future / likely events or circumstances.
In addition, this presentation is for general information purposes only, without regard to any specific objectives, financial situations or informational needs
of any particular person. The financial information outlined in this presentation is different from that of the financials of MHIL since the financial information of the
Partner Healthcare Facilities is included in this presentation and hence might not meet statutory, regulatory or other audit or similar stipulated requirements. Further
the financial information contained in this presentation is based on the audited financials of the Company, its subsidiaries, managed facilities along with the audited
financial information (prepared under IGAAP) of the Partner Healthcare Facilities as received from such partners and updated for intra-network eliminations and IND
AS related adjustments. These audited financial information relating to Partner Healthcare Facilities post IND AS adjustments, have neither been verified by the
Company nor by its Subsidiaries or its auditors. Accordingly, to that extent, limited reliance should be placed on the financial information of such Partner Healthcare
Facilities included in this presentation. MHIL may alter, modify or otherwise change in any manner the content of this presentation, without obligation to notify any
person of such change or changes. This presentation should not be copied or disseminated in any manner.
The information contained in this presentation is for information purposes only and does not constitute an offer or invitation to sell or recommendation or
solicitation of an offer to subscribe to securities for or invitation to purchase any securities of MHIL. This presentation should not, nor should anything contained in it,
form the basis of, or be relied upon in any connection with any contract or commitment whatsoever. This presentation is not intended to be a prospectus (as defined
under the Companies Act, 2013, as amended) or an offer document under the Securities and Exchange Board of India (Issue of Capital and Disclosure Requirements)
Regulations, 2018, as amended.
2
Notes to Network Consolidated Financials
3
1. Healthcare undertaking of Radiant Life Care Private Limited (“Radiant”) and residual business of erstwhile Max India Limited have merged into Max HealthcareInstitute Limited (“MHIL” or “the Company”) through a NCLT approved Composite Scheme of Amalgamation and Arrangement on June 1, 2020
2. Earlier, Radiant had acquired 49.7%* stake of MHIL from Life Healthcare at ~ INR 2,136 Cr @ INR 80 per share in June, 2019
3. Upon merger of the healthcare undertaking** of Radiant with MHIL, the Radiant shareholders have been issued 635,042,075 shares by MHIL (merged entity)based on approved swap ratio (9,074 shares of MHIL for 10 shares held in Radiant) and its pre-acquisition stake of 49.7%* stands cancelled. The merger resultsinto Radiant promoters controlling the merged MHIL
4. The transaction results into a business combination under Ind AS 103 “Business Combinations” and further applying the criteria laid in the accounting standard,the merger is being accounted for as follows:
a) Radiant has been identified as the accounting acquirer and thus the merger qualifies as a “reverse acquisition”
b) MHIL financials are considered to be the continuation of Radiant’s healthcare undertaking financials (accounting acquirer) and thus all assets & liabilities of MHILhave been fair valued as per principles laid down in Ind AS 103. Demerged undertaking of Radiant is being accounted for at its carrying amounts
c) Further, since the business combination and control of Radiant over MHIL is achieved in stages, Radiant’s previously held stake of 49.7%* (in pre-merger MHIL) isfair valued as on June 1, 2020 and the resulting loss, has been recognized in profit or loss
5. Strictly applying the principles of Ind AS 103, the financial result of MHIL (merged) for year ended March 31, 2021 consist 12 months of operations of Radiant and10 months of operations of MHIL (merged).
6. However, in view of the significant network bed capacity at partner healthcare facilities and note 5 above, it is considered appropriate to disclose the financialperformance of the Network Hospitals for the year ended March 31, 2021 by way of a management consolidated of 12 months operations of MHIL, itssubsidiaries, managed facilities and partner healthcare facilities.
7. The financial information contained in this presentation is thus different from that of MHIL Group since the financial information of partner healthcare facilities isalso included. It is drawn up based on management consolidation of the audited financials of the Company, its subsidiaries, managed facilities along and theaudited financials (prepared under IGAAP) of the partner healthcare facilities as received from such partners, duly updated for intra-network eliminations and INDAS related adjustments. The financial information post IND AS adjustments, has been certified by an independent firm of chartered accountants
8. The Company, while accounting for the Business Combination has carried out a fair valuation exercise earlier in the year, whereby the assets and liabilities of theacquired entity & its subsidiaries (i.e. MHIL) and effects thereof have been captured in the financials. The fair valuation has led to increase in the tangible andintangible assets of the Network by INR 3,662 Cr, which, includes INR 252 Cr towards the partner healthcare facilities
9. The Abridged Profit and Loss account thus, takes into account line by line consolidation of the financials in an investor friendly format of the Network HealthcareFacilities. Further, In order to better explain the financial results, the items which don’t truly represent the operating income/expenditure have been identified andreported separately to reflect the Operating EBITDA
* % are with respect to the issued share capital at that point of time ** Mainly consisting of O & M arrangements with Dr. Balabhai Nanavati Hospital, Mumbai and Dr. B. L. Kapur Memorial Hospital, New Delhi
Content
4
Q4 FY21 Highlights
FY21 Highlights
Covid-19 Update
About the Company
05
15
23
26
Q4 FY21 Highlights
5
Executive Summary (1/2)
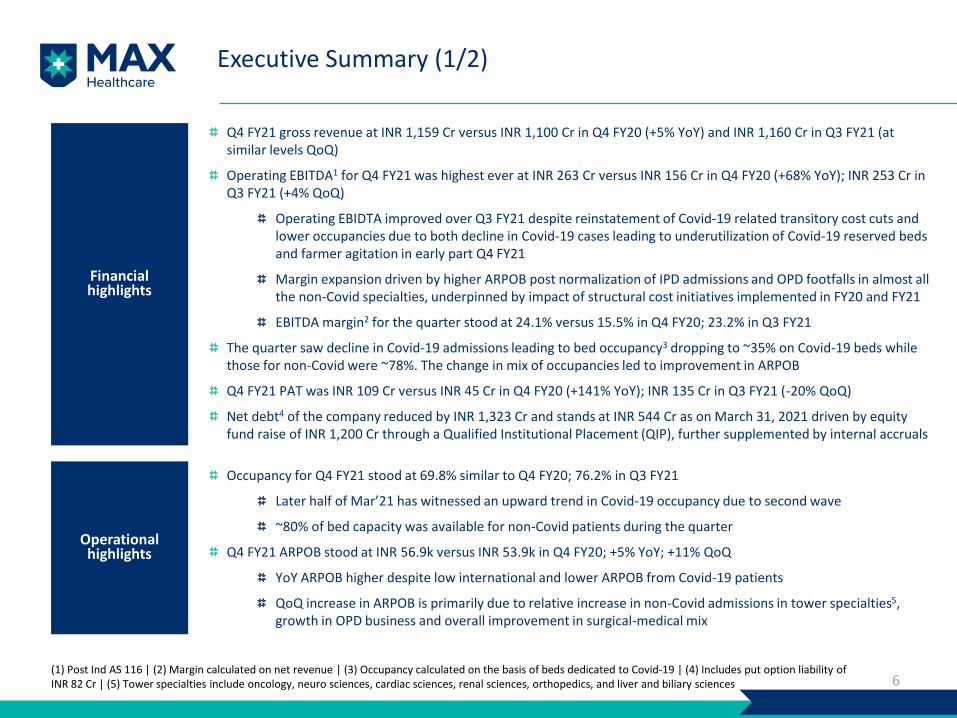
Q4 FY21 gross revenue at INR 1,159 Cr versus INR 1,100 Cr in Q4 FY20 (+5% YoY) and INR 1,160 Cr in Q3 FY21 (at similar levels QoQ)
Operating EBITDA1 for Q4 FY21 was highest ever at INR 263 Cr versus INR 156 Cr in Q4 FY20 (+68% YoY); INR 253 Cr in Q3 FY21 (+4% QoQ)
Operating EBIDTA improved over Q3 FY21 despite reinstatement of Covid-19 related transitory cost cuts and lower occupancies due to both decline in Covid-19 cases leading to underutilization of Covid-19 reserved beds and farmer agitation in early part Q4 FY21
Margin expansion driven by higher ARPOB post normalization of IPD admissions and OPD footfalls in almost all the non-Covid specialties, underpinned by impact of structural cost initiatives implemented in FY20 and FY21
EBITDA margin2 for the quarter stood at 24.1% versus 15.5% in Q4 FY20; 23.2% in Q3 FY21
The quarter saw decline in Covid-19 admissions leading to bed occupancy3 dropping to ~35% on Covid-19 beds while those for non-Covid were ~78%. The change in mix of occupancies led to improvement in ARPOB
Q4 FY21 PAT was INR 109 Cr versus INR 45 Cr in Q4 FY20 (+141% YoY); INR 135 Cr in Q3 FY21 (-20% QoQ)
Net debt4 of the company reduced by INR 1,323 Cr and stands at INR 544 Cr as on March 31, 2021 driven by equity fund raise of INR 1,200 Cr through a Qualified Institutional Placement (QIP), further supplemented by internal accruals
Operationalhighlights
6
Financialhighlights
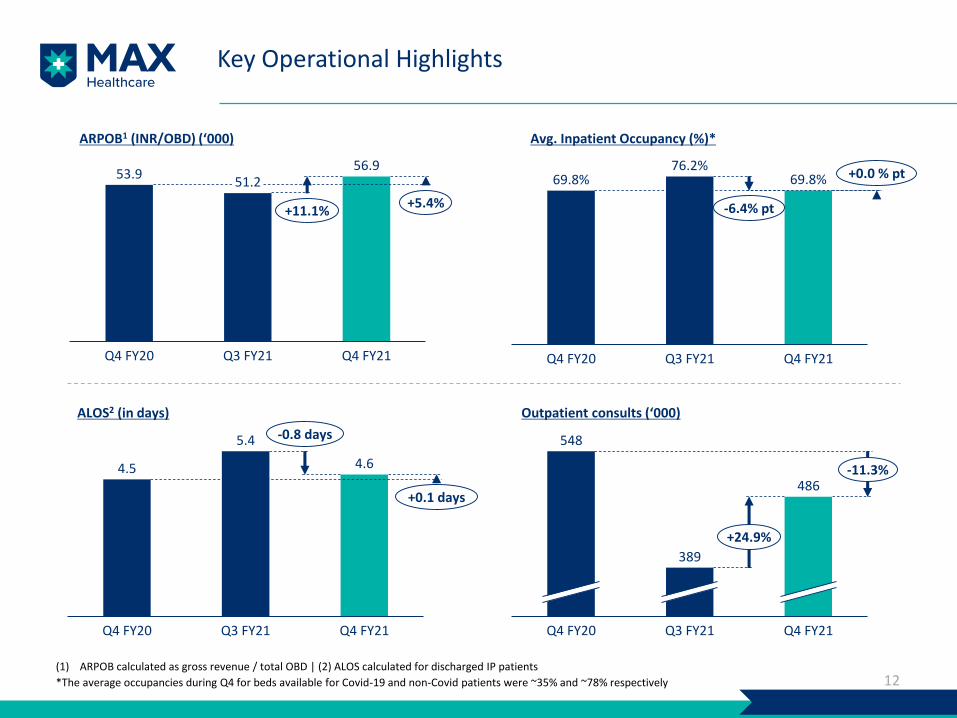
Occupancy for Q4 FY21 stood at 69.8% similar to Q4 FY20; 76.2% in Q3 FY21
Later half of Mar’21 has witnessed an upward trend in Covid-19 occupancy due to second wave
~80% of bed capacity was available for non-Covid patients during the quarter
Q4 FY21 ARPOB stood at INR 56.9k versus INR 53.9k in Q4 FY20; +5% YoY; +11% QoQ
YoY ARPOB higher despite low international and lower ARPOB from Covid-19 patients
QoQ increase in ARPOB is primarily due to relative increase in non-Covid admissions in tower specialties5, growth in OPD business and overall improvement in surgical-medical mix
(1) Post Ind AS 116 | (2) Margin calculated on net revenue | (3) Occupancy calculated on the basis of beds dedicated to Covid-19 | (4) Includes put option liability of INR 82 Cr | (5) Tower specialties include oncology, neuro sciences, cardiac sciences, renal sciences, orthopedics, and liver and biliary sciences

Executive Summary (2/2)
7
Clinicalhighlights
Clinical update:
Treated ~31,000 Covid-19 patients at hospitals and ~3,500 patients at home/extended care facilities as of May 15, 2021
~5.4L RT-PCR tests done and ~1.4L Covid-19 vaccination doses administered as of May 15, 2021
Successfully implanted bluetooth enabled MRI computability AICD to prevent sudden cardiac death
Treated a 6 Month old Infant with Intracranial Extradural Hematoma successfully
Saved a young man’s life suffering from a fulminating case of Fournier’s Gangrene
Successful Video Assisted Anal Fistula Treatment (VAAFT) in a 36 years old patient with a complex perianal fistula
Research and academics:
116 national and international publications in Q4 FY21; 81 clinical trials and 13 grants ongoing across MHC
~400 allied health internship, 15 observorship and 15 fellowship students joined
Total numbers of candidates trained in American Heart Association(AHA) certified BLS/ACLS/PALS provider courses –608, in Max Emergency life support – 910, MECP trainings – 33, Bespoke – 121
DNB accreditation approval in 35 specialties across network; total strength of DNB residents across Max network at 433 currently
Masters in Emergency Medicine International course extended to BLK and Nanavati Hospitals
ALOS was 4.6 days in Q4 FY21 versus 4.5 days in Q4 FY20; better than 5.4 days in Q3 FY21
OP consults stood at 4.9L in Q4 FY21 (+25% QoQ). Video consults during the quarter exceeded 17.5k
~39,300 OPD and ~990 IPD patients from economically weaker section treated free of charge
Maxlab - captive retail pathology business handled ~4.5 lacs samples, thus serving ~2.1 lacs patients
Max@home - homecare business recorded 20% volume growth over Q3 FY21 backed by revival of non-Covid demand and extension of services to Mumbai
OperationalHighlights
(contd..)
Key Financial Highlights
8
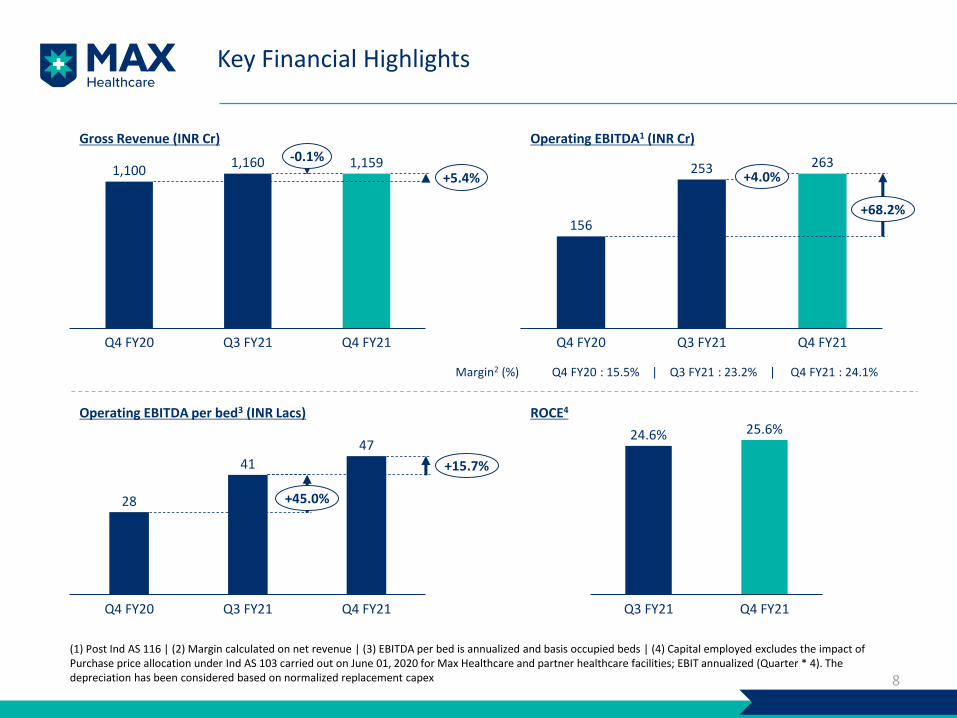
Gross Revenue (INR Cr) Operating EBITDA1 (INR Cr)
Operating EBITDA per bed3 (INR Lacs)
Margin2 (%) Q4 FY20 : 15.5% | Q3 FY21 : 23.2% | Q4 FY21 : 24.1%
(1) Post Ind AS 116 | (2) Margin calculated on net revenue | (3) EBITDA per bed is annualized and basis occupied beds | (4) Capital employed excludes the impact of Purchase price allocation under Ind AS 103 carried out on June 01, 2020 for Max Healthcare and partner healthcare facilities; EBIT annualized (Quarter * 4). The depreciation has been considered based on normalized replacement capex
1,1001,160 1,159
Q4 FY20 Q4 FY21Q3 FY21
-0.1%
+5.4%
156
253 263
Q4 FY20 Q3 FY21 Q4 FY21
+68.2%
+4.0%
28
41
47
Q4 FY20 Q3 FY21 Q4 FY21
+15.7%
+45.0%
ROCE4
24.6% 25.6%
Q3 FY21 Q4 FY21

Specialty Profile
9
Q4 FY21Q4 FY20
9.7%
8.8%9.2%
4.4%
6.7%
LTP
13.7%
20.4%
Oncology*
Renalsciences^ Orthopedics
Cardiacsciences
Neurosciences
3.1%
10.6%Internalmedicine
OBGY and pediatrics
5.0%
MAS andgeneral surgery
Pulmonology8.3%
Others
20.2%
10.6%
9.6%
9.4%
8.0%
6.2%
4.8%
4.2%
Renalsciences^
Oncology*
Orthopedics
14.9% Cardiacsciences
Others
Internalmedicine
Neurosciences
3.1%LTP
OBGY and pediatrics
MAS andgeneral surgery
Pulmonology 8.9%
Gross IP revenueINR 909 Cr
Gross IP revenueINR 840 Cr
Note: Excludes OP and day care revenue, revenue from SBUs and other operating income* Includes chemotherapy and radiotherapy^ Includes Dialysis

Payor Profile
10
39.5%
30.8%
6.0%
23.7%
InstitutionalSelf pay TPA & corporates International
41.2%
25.8%
10.7%
22.4%
Note: Excludes revenue from SBUs and other operating income
Q4 FY21Q4 FY20
P&L Statement: Q4 FY21
11
Q4 FY20 Q3 FY21 Q4 FY21
Amount % NR Amount % NR Amount % NR
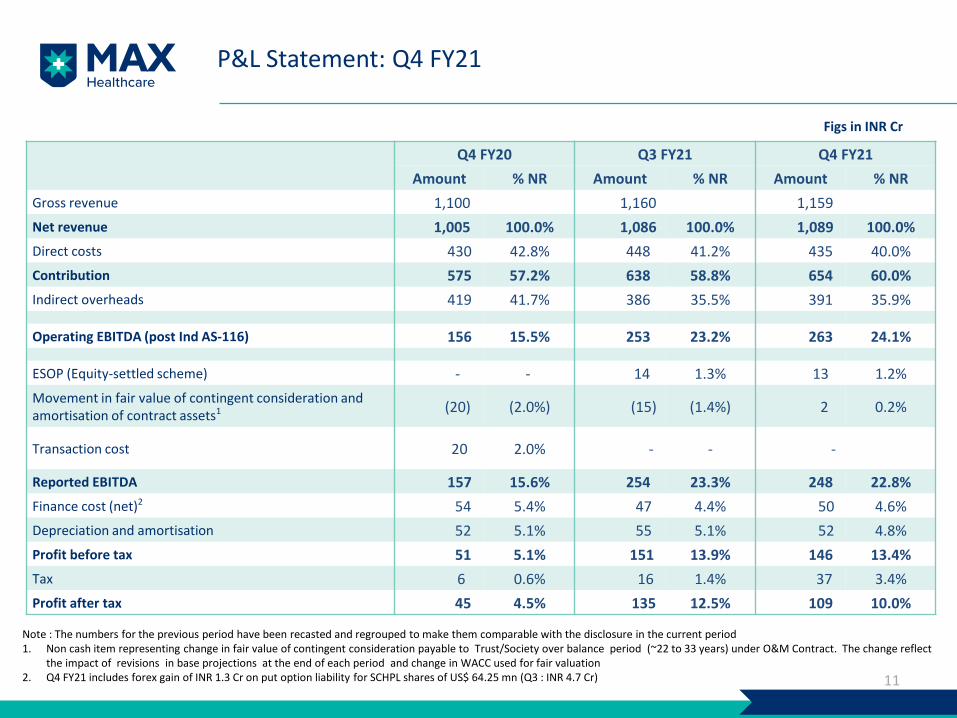
Gross revenue 1,100 1,160 1,159
Net revenue 1,005 100.0% 1,086 100.0% 1,089 100.0%
Direct costs 430 42.8% 448 41.2% 435 40.0%
Contribution 575 57.2% 638 58.8% 654 60.0%
Indirect overheads 419 41.7% 386 35.5% 391 35.9%
Operating EBITDA (post Ind AS-116) 156 15.5% 253 23.2% 263 24.1%
ESOP (Equity-settled scheme) - - 14 1.3% 13 1.2%
Movement in fair value of contingent consideration andamortisation of contract assets1 (20) (2.0%) (15) (1.4%) 2 0.2%
Transaction cost 20 2.0% - - -
Reported EBITDA 157 15.6% 254 23.3% 248 22.8%
Finance cost (net)2 54 5.4% 47 4.4% 50 4.6%
Depreciation and amortisation 52 5.1% 55 5.1% 52 4.8%
Profit before tax 51 5.1% 151 13.9% 146 13.4%
Tax 6 0.6% 16 1.4% 37 3.4%
Profit after tax 45 4.5% 135 12.5% 109 10.0%
Figs in INR Cr
Note : The numbers for the previous period have been recasted and regrouped to make them comparable with the disclosure in the current period1. Non cash item representing change in fair value of contingent consideration payable to Trust/Society over balance period (~22 to 33 years) under O&M Contract. The change reflect
the impact of revisions in base projections at the end of each period and change in WACC used for fair valuation2. Q4 FY21 includes forex gain of INR 1.3 Cr on put option liability for SCHPL shares of US$ 64.25 mn (Q3 : INR 4.7 Cr)
Key Operational Highlights
12
ARPOB1 (INR/OBD) (‘000) Avg. Inpatient Occupancy (%)*
ALOS2 (in days)
(1) ARPOB calculated as gross revenue / total OBD | (2) ALOS calculated for discharged IP patients
*The average occupancies during Q4 for beds available for Covid-19 and non-Covid patients were ~35% and ~78% respectively
53.951.2
56.9
Q4 FY20 Q4 FY21Q3 FY21
+5.4%+11.1%
Q4 FY20 Q4 FY21Q3 FY21
69.8%76.2%
69.8%
-6.4% pt
+0.0 % pt
4.5
5.4
4.6
Q4 FY20 Q3 FY21 Q4 FY21
-0.8 days
+0.1 days
Outpatient consults (‘000)
Q4 FY20 Q3 FY21 Q4 FY21
486
548
389
-11.3%
+24.9%
Clinical Update
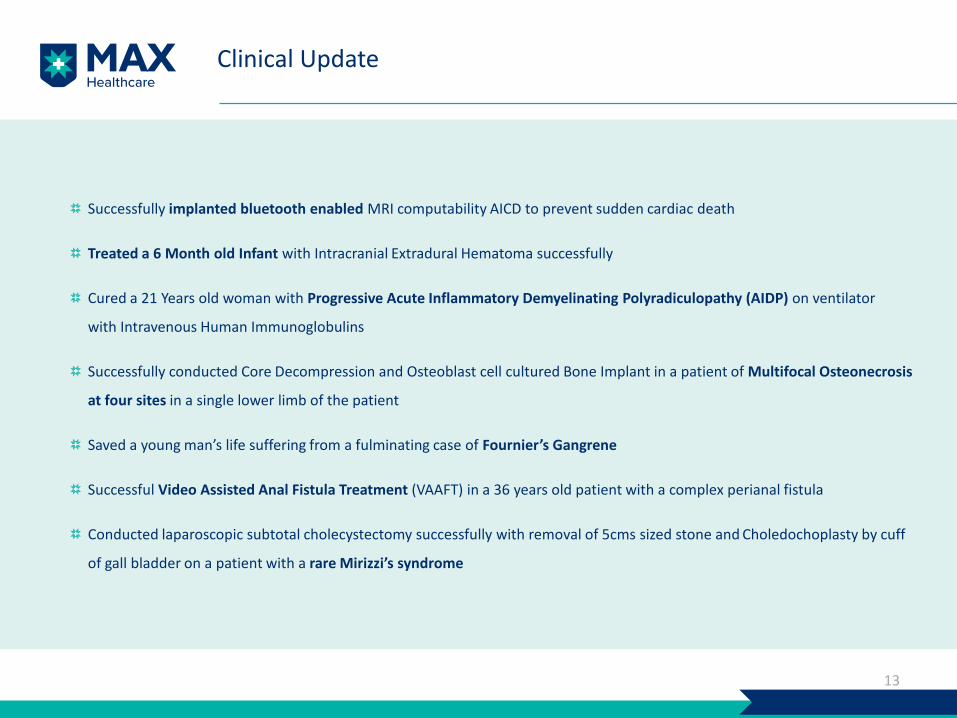
Successfully implanted bluetooth enabled MRI computability AICD to prevent sudden cardiac death
Treated a 6 Month old Infant with Intracranial Extradural Hematoma successfully
Cured a 21 Years old woman with Progressive Acute Inflammatory Demyelinating Polyradiculopathy (AIDP) on ventilator
with Intravenous Human Immunoglobulins
Successfully conducted Core Decompression and Osteoblast cell cultured Bone Implant in a patient of Multifocal Osteonecrosis
at four sites in a single lower limb of the patient
Saved a young man’s life suffering from a fulminating case of Fournier’s Gangrene
Successful Video Assisted Anal Fistula Treatment (VAAFT) in a 36 years old patient with a complex perianal fistula
Conducted laparoscopic subtotal cholecystectomy successfully with removal of 5cms sized stone and Choledochoplasty by cuff
of gall bladder on a patient with a rare Mirizzi’s syndrome
13
Research and Academics Update
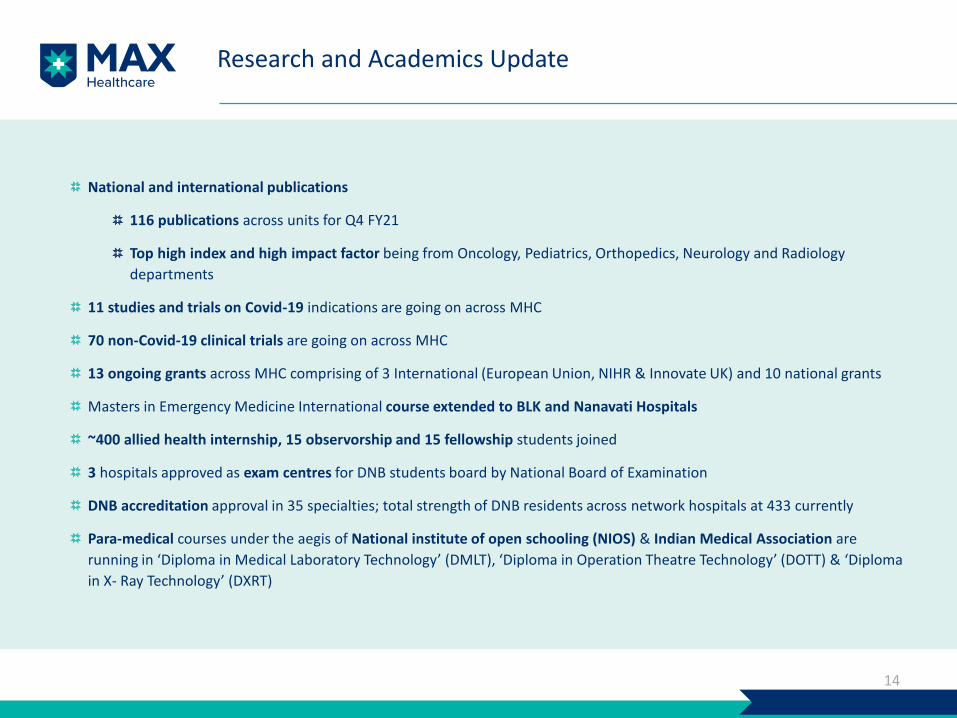
National and international publications
116 publications across units for Q4 FY21
Top high index and high impact factor being from Oncology, Pediatrics, Orthopedics, Neurology and Radiology
departments
11 studies and trials on Covid-19 indications are going on across MHC
70 non-Covid-19 clinical trials are going on across MHC
13 ongoing grants across MHC comprising of 3 International (European Union, NIHR & Innovate UK) and 10 national grants
Masters in Emergency Medicine International course extended to BLK and Nanavati Hospitals
~400 allied health internship, 15 observorship and 15 fellowship students joined
3 hospitals approved as exam centres for DNB students board by National Board of Examination
DNB accreditation approval in 35 specialties; total strength of DNB residents across network hospitals at 433 currently
Para-medical courses under the aegis of National institute of open schooling (NIOS) & Indian Medical Association are
running in ‘Diploma in Medical Laboratory Technology’ (DMLT), ‘Diploma in Operation Theatre Technology’ (DOTT) & ‘Diploma
in X- Ray Technology’ (DXRT)
14
FY21 Highlights
15

Key Financial Highlights
16
Gross Revenue (INR Cr) Operating EBITDA1 (INR Cr)
Operating EBITDA per bed3 (INR Lacs)
Margin2 (%) FY20: 14.7% | FY21: 17.5%
(1) Numbers are post IND AS 116 | (2) Margin calculated on net revenue | (3) EBITDA per bed is annualized and basis occupied beds
4,3713,861
FY20 FY21
-11.7%590
636
FY21FY20
+7.9%
25
31
FY20 FY21
+21.3%
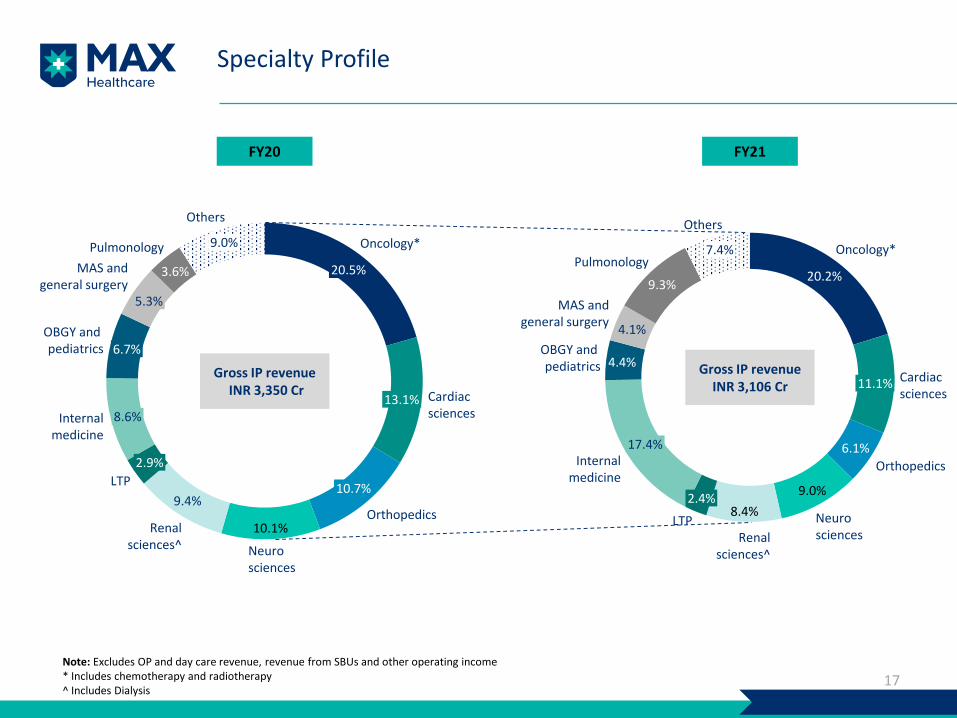
Specialty Profile
17
FY21FY20
Note: Excludes OP and day care revenue, revenue from SBUs and other operating income* Includes chemotherapy and radiotherapy^ Includes Dialysis
10.1%
9.4%
3.6%
Renalsciences^
Orthopedics
20.5%
Oncology*
Cardiacsciences
13.1%
LTP10.7%
Neurosciences
2.9%
8.6%Internalmedicine
6.7%OBGY and pediatrics
5.3%
MAS andgeneral surgery
Pulmonology 9.0%
Others
20.2%
6.1%
9.0%
8.4%
4.4%
4.1%
9.3%
Oncology*
11.1%
17.4%
Neurosciences
Cardiacsciences
Others
Orthopedics
2.4%
Renalsciences^
OBGY and pediatrics
LTP
Internalmedicine
MAS andgeneral surgery
7.4%Pulmonology
Gross IP revenueINR 3,106 Cr
Gross IP revenueINR 3,350 Cr
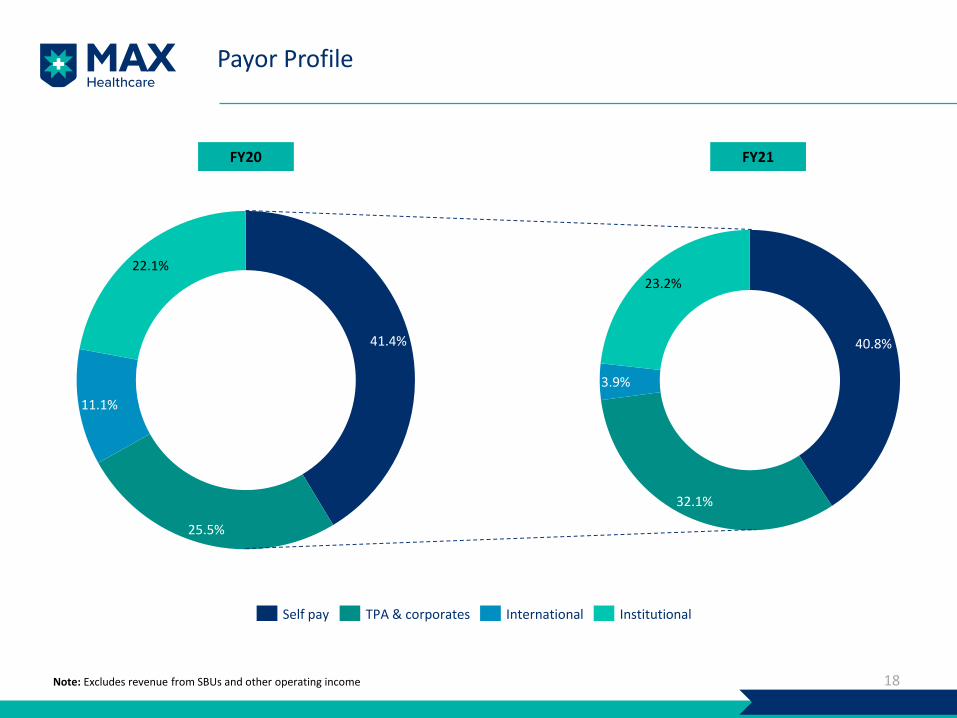
Payor Profile
18
41.4%
25.5%
11.1%
22.1%
Self pay TPA & corporates International Institutional
40.8%
32.1%
3.9%
23.2%
FY21FY20
Note: Excludes revenue from SBUs and other operating income

P&L Statement: FY21
19
FY19 FY20 FY21 Changeover LYAmount % NR Amount % NR Amount % NR
Gross revenue 3,920 4,371 3,861 (11.7%)
Net revenue 3,599 100.0% 4,023 100.0% 3,629 100.0% (9.8%)
Direct costs 1,566 43.5% 1,715 42.6% 1,508 41.6% (12.0%)
Contribution 2,033 56.5% 2,308 57.4% 2,121 58.4% (8.1%)
Indirect overheads 1,685 46.8% 1,719 42.7% 1,485 40.9% (13.6%)
Operating EBITDA (post Ind AS-116) 348 9.7% 590 14.7% 636 17.5% 7.9%
Loss on fair valuation of pre-merger holding of Radiant under IND AS 103
- - - - 196 5.4%
Transaction cost 30 0.8% 43 1.1% 48 1.3% 10.8%
ESOP (Equity - settled scheme) - - - - 27 0.7 %
One time policy harmonization impact - - - - 5 0.1%
Movement in fair value of contingent consideration and amortisation of contract assets
19 0.5% (3) (0.1%) 1 0.0%
Reported EBITDA 299 8.3% 549 13.6% 359 9.9% (34.7%)
Finance cost (net) 155 4.3% 215 5.3% 187 5.2% (12.9%)
Depreciation and amortisation 186 5.2% 208 5.2% 216 6.0% 3.6%
Profit before tax (42) (1.2%) 126 3.1% (45) (1.2%)
Tax 18 0.5% (3) (0.1%) 50 1.4%
Profit after tax (60) (1.7%) 129 3.2% (95) (2.6%)
Figs in INR Cr
Note: 1. The numbers for the previous period have been recasted and regrouped to match with the disclosure in the current period2. FY19 financials are pre-IND AS -116 unaudited numbers based on arithmetic total of line items appearing in the pre-merger P&L of Max Healthcare and Radiant Lifecare3. Operating EBITDA (pre Ind AS-116) stood at INR 548 Cr in FY20 and INR 601 Cr in FY21

Key Operational Highlights
20
ARPOB1 (INR/OBD) (‘000) Avg. Inpatient Occupancy (%)
ALOS2 (in days)
(1) ARPOB calculated as gross revenue / total OBD | (2) ALOS calculated for discharged IP patients only
51.1 50.8
FY20 FY21
-0.7%
FY20
72.5%64.9%
FY21
-7.6% pt
4.3
5.2
FY21FY20
+0.9 days
Outpatient consults (‘000)
2,424
1,414
FY21FY20
-41.7%
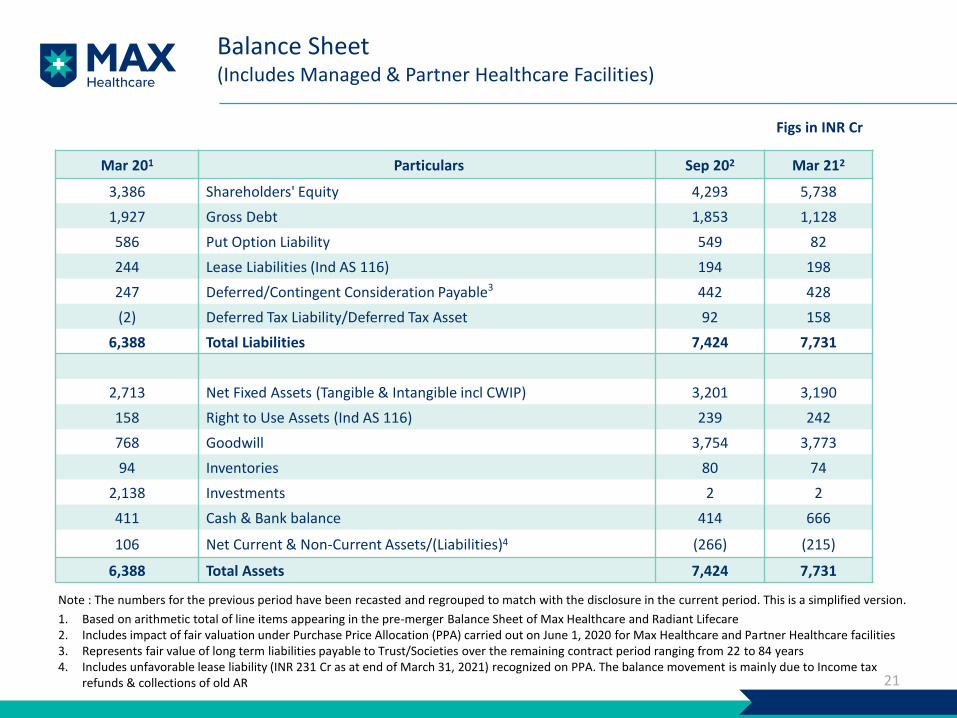
Balance Sheet(Includes Managed & Partner Healthcare Facilities)
21
Mar 201 Particulars Sep 202 Mar 212
3,386 Shareholders' Equity 4,293 5,738
1,927 Gross Debt 1,853 1,128
586 Put Option Liability 549 82
244 Lease Liabilities (Ind AS 116) 194 198
247 Deferred/Contingent Consideration Payable3 442 428
(2) Deferred Tax Liability/Deferred Tax Asset 92 158
6,388 Total Liabilities 7,424 7,731
2,713 Net Fixed Assets (Tangible & Intangible incl CWIP) 3,201 3,190
158 Right to Use Assets (Ind AS 116) 239 242
768 Goodwill 3,754 3,773
94 Inventories 80 74
2,138 Investments 2 2
411 Cash & Bank balance 414 666
106 Net Current & Non-Current Assets/(Liabilities)4 (266) (215)
6,388 Total Assets 7,424 7,731
Figs in INR Cr
Note : The numbers for the previous period have been recasted and regrouped to match with the disclosure in the current period. This is a simplified version.
1. Based on arithmetic total of line items appearing in the pre-merger Balance Sheet of Max Healthcare and Radiant Lifecare2. Includes impact of fair valuation under Purchase Price Allocation (PPA) carried out on June 1, 2020 for Max Healthcare and Partner Healthcare facilities3. Represents fair value of long term liabilities payable to Trust/Societies over the remaining contract period ranging from 22 to 84 years4. Includes unfavorable lease liability (INR 231 Cr as at end of March 31, 2021) recognized on PPA. The balance movement is mainly due to Income tax
refunds & collections of old AR
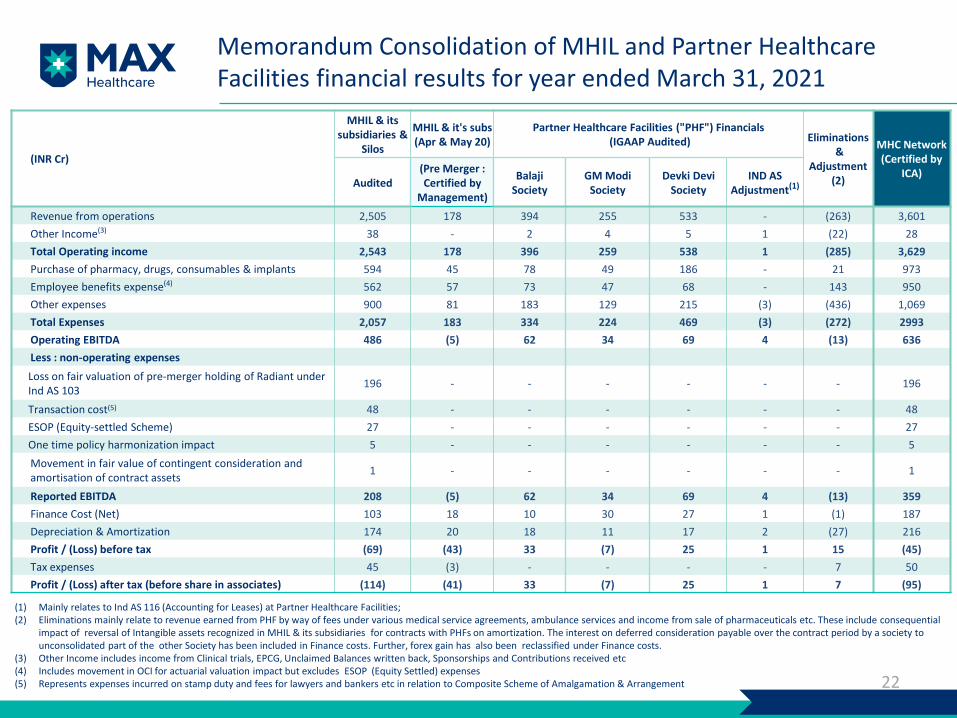
Memorandum Consolidation of MHIL and Partner Healthcare Facilities financial results for year ended March 31, 2021
22
(INR Cr)
MHIL & its subsidiaries &
Silos
MHIL & it's subs(Apr & May 20)
Partner Healthcare Facilities ("PHF") Financials(IGAAP Audited) Eliminations
& Adjustment
(2)
MHC Network (Certified by
ICA)Audited
(Pre Merger : Certified by
Management)
BalajiSociety
GM ModiSociety
Devki Devi Society
IND AS Adjustment(1)
Revenue from operations 2,505 178 394 255 533 - (263) 3,601
Other Income(3) 38 - 2 4 5 1 (22) 28
Total Operating income 2,543 178 396 259 538 1 (285) 3,629
Purchase of pharmacy, drugs, consumables & implants 594 45 78 49 186 - 21 973
Employee benefits expense(4) 562 57 73 47 68 - 143 950
Other expenses 900 81 183 129 215 (3) (436) 1,069
Total Expenses 2,057 183 334 224 469 (3) (272) 2993
Operating EBITDA 486 (5) 62 34 69 4 (13) 636
Less : non-operating expenses
Loss on fair valuation of pre-merger holding of Radiant under Ind AS 103
196 - - - - - - 196
Transaction cost(5) 48 - - - - - - 48
ESOP (Equity-settled Scheme) 27 - - - - - - 27
One time policy harmonization impact 5 - - - - - - 5
Movement in fair value of contingent consideration andamortisation of contract assets
1 - - - - - - 1
Reported EBITDA 208 (5) 62 34 69 4 (13) 359
Finance Cost (Net) 103 18 10 30 27 1 (1) 187
Depreciation & Amortization 174 20 18 11 17 2 (27) 216
Profit / (Loss) before tax (69) (43) 33 (7) 25 1 15 (45)
Tax expenses 45 (3) - - - - 7 50
Profit / (Loss) after tax (before share in associates) (114) (41) 33 (7) 25 1 7 (95)
(1) Mainly relates to Ind AS 116 (Accounting for Leases) at Partner Healthcare Facilities; (2) Eliminations mainly relate to revenue earned from PHF by way of fees under various medical service agreements, ambulance services and income from sale of pharmaceuticals etc. These include consequential
impact of reversal of Intangible assets recognized in MHIL & its subsidiaries for contracts with PHFs on amortization. The interest on deferred consideration payable over the contract period by a society to unconsolidated part of the other Society has been included in Finance costs. Further, forex gain has also been reclassified under Finance costs.
(3) Other Income includes income from Clinical trials, EPCG, Unclaimed Balances written back, Sponsorships and Contributions received etc(4) Includes movement in OCI for actuarial valuation impact but excludes ESOP (Equity Settled) expenses(5) Represents expenses incurred on stamp duty and fees for lawyers and bankers etc in relation to Composite Scheme of Amalgamation & Arrangement
Covid-19 Update
23
Covid-19 Update (1/2)
24
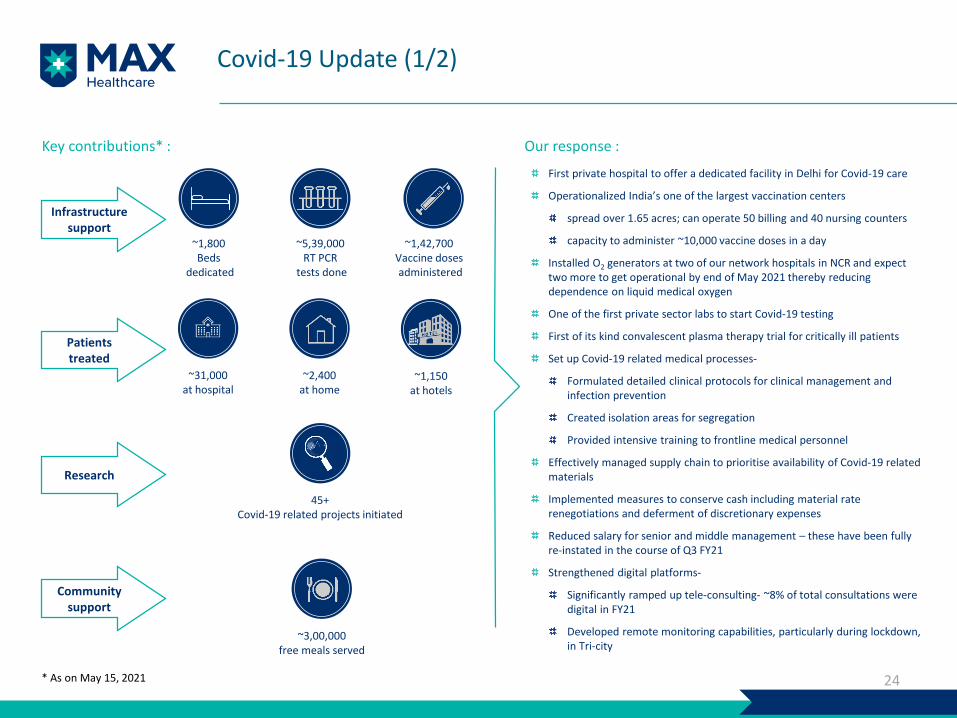
Our response :
First private hospital to offer a dedicated facility in Delhi for Covid-19 care
Operationalized India’s one of the largest vaccination centers
spread over 1.65 acres; can operate 50 billing and 40 nursing counters
capacity to administer ~10,000 vaccine doses in a day
Installed O2 generators at two of our network hospitals in NCR and expect two more to get operational by end of May 2021 thereby reducing dependence on liquid medical oxygen
One of the first private sector labs to start Covid-19 testing
First of its kind convalescent plasma therapy trial for critically ill patients
Set up Covid-19 related medical processes-
Formulated detailed clinical protocols for clinical management and infection prevention
Created isolation areas for segregation
Provided intensive training to frontline medical personnel
Effectively managed supply chain to prioritise availability of Covid-19 related materials
Implemented measures to conserve cash including material rate renegotiations and deferment of discretionary expenses
Reduced salary for senior and middle management – these have been fully re-instated in the course of Q3 FY21
Strengthened digital platforms-
Significantly ramped up tele-consulting- ~8% of total consultations were digital in FY21
Developed remote monitoring capabilities, particularly during lockdown, in Tri-city
Key contributions* :
Infrastructure support
~1,800Beds
dedicated
~5,39,000RT PCR
tests done
Patients treated
~31,000at hospital
~1,150at hotels
~2,400at home
Community support
~3,00,000free meals served
Research
45+Covid-19 related projects initiated
* As on May 15, 2021
~1,42,700Vaccine dosesadministered
72 75 71 76 70 72 7661
3343
59 61 6677 79 79
71 66 69 7587 90
Q1
FY2
0
Q2
FY2
0
Oct
-19
No
v-1
9
Dec
-19
Jan
-20
Feb
-20
Mar
-20
Ap
r-2
0
May
-20
Jun
-20
Jul-
20
Au
g-2
0
Sep
-20
Oct
-20
No
v-2
0
Dec
-20
Jan
-21
Feb
-21
Mar
-21
Ap
r-2
1
*May
-21
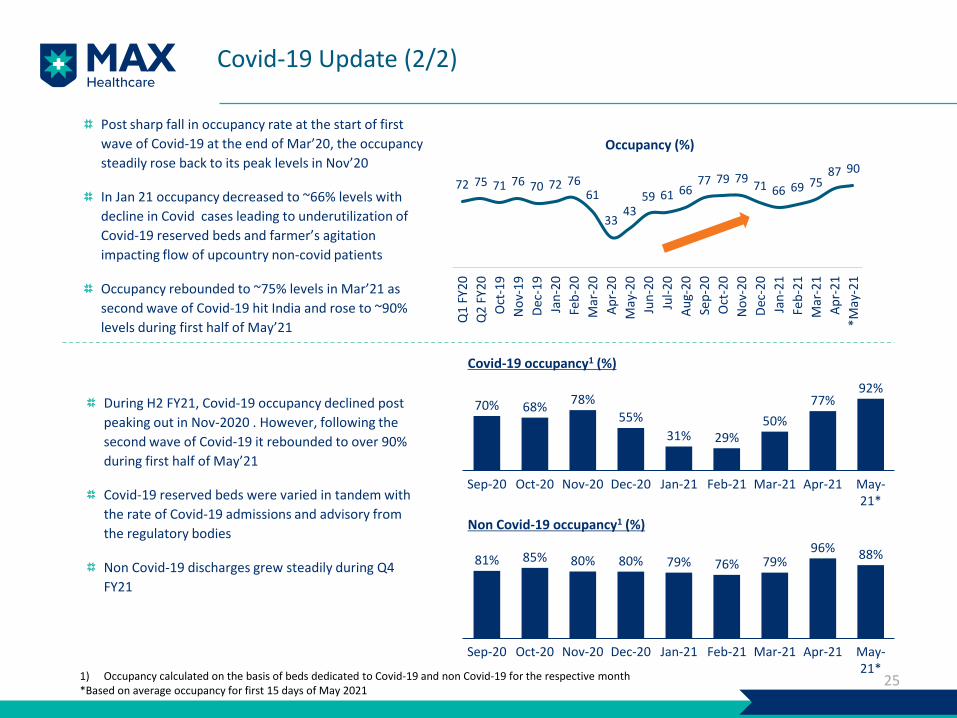
Occupancy (%)
Covid-19 Update (2/2)
25
70% 68%78%
55%
31% 29%50%
77%92%
Feb-21Sep-20 Jan-21Nov-20Oct-20 Apr-21Dec-20 Mar-21 May-21*
81% 85% 80% 80% 79% 76% 79%96% 88%
Apr-21Oct-20 Jan-21 Mar-21Sep-20 Nov-20 Dec-20 Feb-21 May-21*
Covid-19 occupancy1 (%)
Non Covid-19 occupancy1 (%)
Post sharp fall in occupancy rate at the start of first
wave of Covid-19 at the end of Mar’20, the occupancy
steadily rose back to its peak levels in Nov’20
In Jan 21 occupancy decreased to ~66% levels with
decline in Covid cases leading to underutilization of
Covid-19 reserved beds and farmer’s agitation
impacting flow of upcountry non-covid patients
Occupancy rebounded to ~75% levels in Mar’21 as
second wave of Covid-19 hit India and rose to ~90%
levels during first half of May’21
During H2 FY21, Covid-19 occupancy declined post
peaking out in Nov-2020 . However, following the
second wave of Covid-19 it rebounded to over 90%
during first half of May’21
Covid-19 reserved beds were varied in tandem with
the rate of Covid-19 admissions and advisory from
the regulatory bodies
Non Covid-19 discharges grew steadily during Q4
FY21
1) Occupancy calculated on the basis of beds dedicated to Covid-19 and non Covid-19 for the respective month*Based on average occupancy for first 15 days of May 2021

About the Company
26
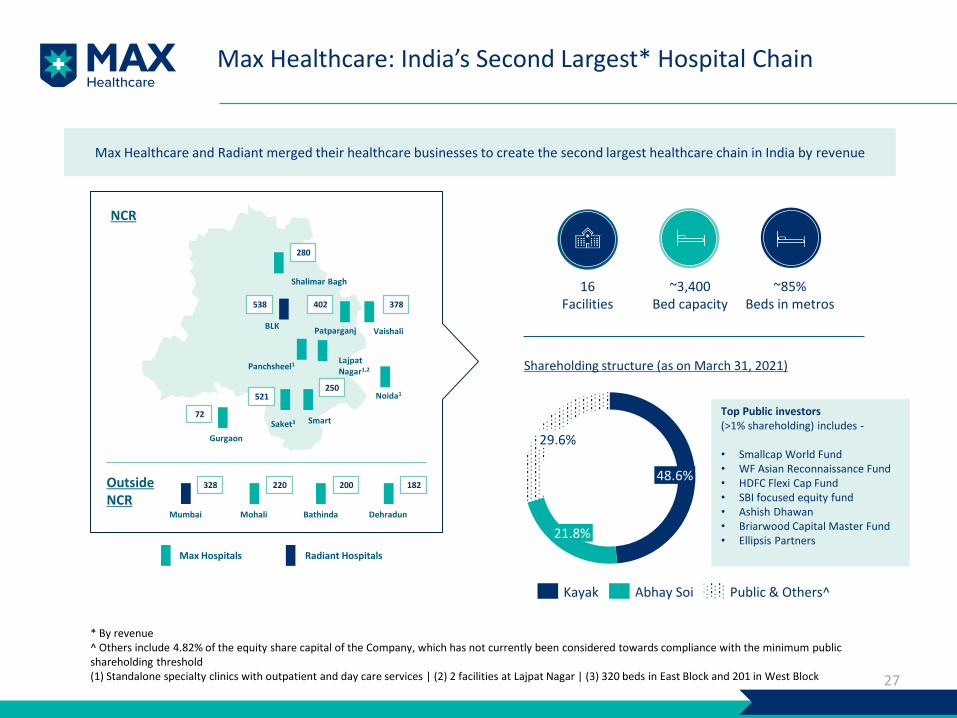
Max Healthcare: India’s Second Largest* Hospital Chain
27
NCR
Outside NCR
Shalimar Bagh
BLKPatparganj Vaishali
Panchsheel1LajpatNagar1,2
SmartSaket3
Gurgaon
Noida1
280
402538 378
250
72
521
328 220 200 182
Mumbai Mohali Bathinda Dehradun
Max Hospitals Radiant Hospitals
~3,400Bed capacity
16Facilities
Max Healthcare and Radiant merged their healthcare businesses to create the second largest healthcare chain in India by revenue
~85%Beds in metros
48.6%
21.8%
29.6%
Kayak Abhay Soi Public & Others^
Shareholding structure (as on March 31, 2021)
* By revenue^ Others include 4.82% of the equity share capital of the Company, which has not currently been considered towards compliance with the minimum public shareholding threshold(1) Standalone specialty clinics with outpatient and day care services | (2) 2 facilities at Lajpat Nagar | (3) 320 beds in East Block and 201 in West Block
Top Public investors (>1% shareholding) includes -
• Smallcap World Fund• WF Asian Reconnaissance Fund• HDFC Flexi Cap Fund• SBI focused equity fund• Ashish Dhawan• Briarwood Capital Master Fund• Ellipsis Partners

Vision: To be the Most Well Regarded Healthcare Provider in India
28
To be the most well regarded healthcare provider in India committed to the highest standards of clinical excellence and
patient care supported by latest technology and cutting edge research
Patients Clinicians
Employees Investors
BEING “WELL REGARDED”
MEANS…
World class infrastructure
State-of-the-art technology
Well defined clinical protocols
Focus on research and academics
Quaternary care facilities
Best-in-class clinical outcomes
Patient centric approach
Global best practices
Rewarded by growth
Constant pursuit to strengthen management
Collaborative approach
Strong governance
Profitable growth
Healthy balance sheet
Efficient operations
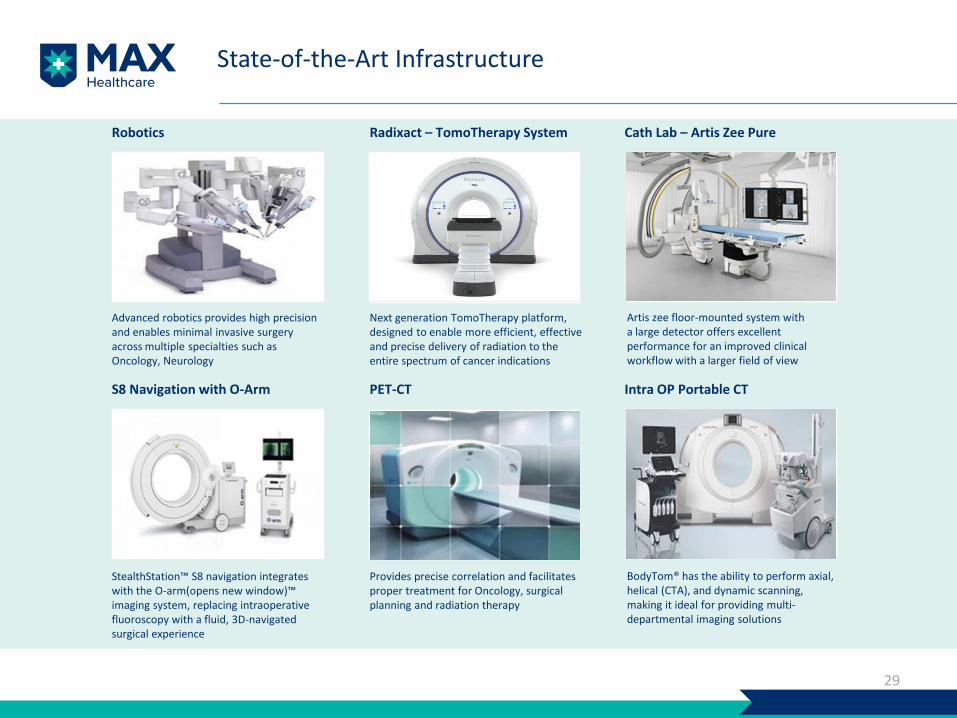
State-of-the-Art Infrastructure
29
Robotics
Advanced robotics provides high precision and enables minimal invasive surgery across multiple specialties such as Oncology, Neurology
Artis zee floor-mounted system with a large detector offers excellent performance for an improved clinical workflow with a larger field of view
StealthStation™ S8 navigation integrates with the O-arm(opens new window)™ imaging system, replacing intraoperative fluoroscopy with a fluid, 3D-navigated surgical experience
Provides precise correlation and facilitates proper treatment for Oncology, surgical planning and radiation therapy
BodyTom® has the ability to perform axial,helical (CTA), and dynamic scanning,making it ideal for providing multi-departmental imaging solutions
Radixact – TomoTherapy System Cath Lab – Artis Zee Pure
PET-CT Intra OP Portable CT S8 Navigation with O-Arm
Next generation TomoTherapy platform, designed to enable more efficient, effective and precise delivery of radiation to the entire spectrum of cancer indications
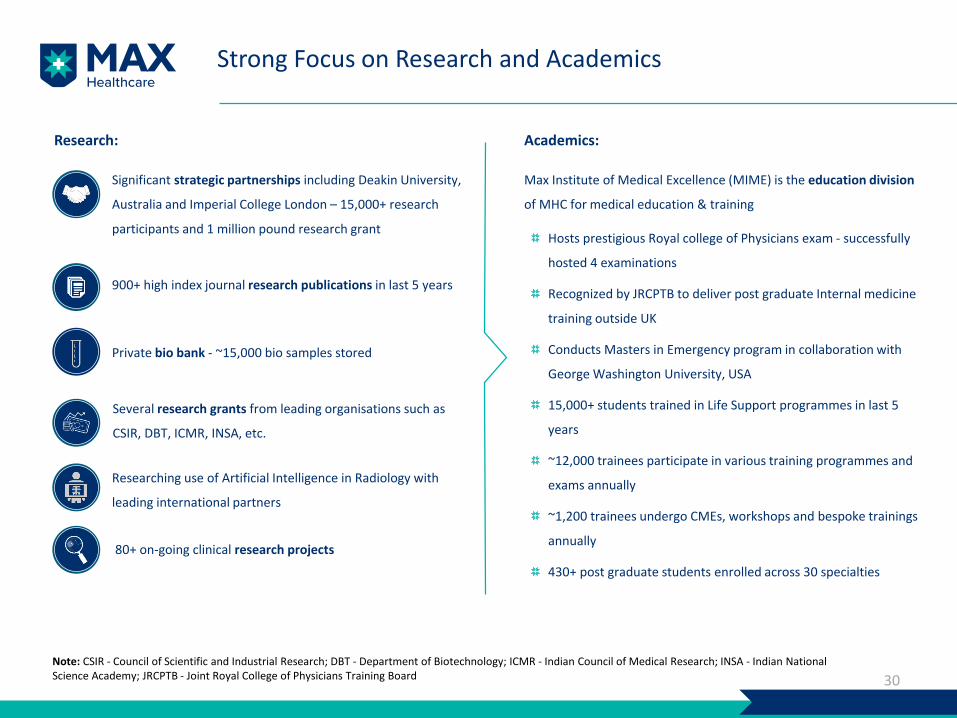
Strong Focus on Research and Academics
30
900+ high index journal research publications in last 5 years
Significant strategic partnerships including Deakin University,
Australia and Imperial College London – 15,000+ research
participants and 1 million pound research grant
Private bio bank - ~15,000 bio samples stored
Several research grants from leading organisations such as
CSIR, DBT, ICMR, INSA, etc.
Research: Academics:
Hosts prestigious Royal college of Physicians exam - successfully
hosted 4 examinations
Recognized by JRCPTB to deliver post graduate Internal medicine
training outside UK
Conducts Masters in Emergency program in collaboration with
George Washington University, USA
15,000+ students trained in Life Support programmes in last 5
years
~12,000 trainees participate in various training programmes and
exams annually
~1,200 trainees undergo CMEs, workshops and bespoke trainings
annually
430+ post graduate students enrolled across 30 specialties
Max Institute of Medical Excellence (MIME) is the education division
of MHC for medical education & training
80+ on-going clinical research projects
Researching use of Artificial Intelligence in Radiology with
leading international partners
Note: CSIR - Council of Scientific and Industrial Research; DBT - Department of Biotechnology; ICMR - Indian Council of Medical Research; INSA - Indian National Science Academy; JRCPTB - Joint Royal College of Physicians Training Board

Awards and Accolades
31
Patient Safety Award by FICCI
Diamond Award for Stroke Ready Centre by the World Stroke Organization
Times Healthcare Achievers Award
Clinical Safety
Best use of six sigma in Healthcare
FICCI Excellence Awards for ‘Operational Excellence’
Best green hospital (reducing carbon foot print of tertiary care hospital)
Best hi-tech hospital at ET Healthcare awards 2020
OperationalExcellence
Best customer service in Healthcare
Bronze award for ‘Life savers’ project (Max Bike responder) at ‘American Society for Quality’
BPM Asia Star 2017 by CII Institute of Quality
D.L. Shah National Award for ‘Economics of Quality’ by QCI
Service Quality
ET Best Healthcarebrand
HIMSS-Elsevier Digital Healthcare Award 2019
Best organization for staff/employee engagement for patients by the CRM Academy of Asia
Gold award from Hospital Management Asia
Others
Nursing Excellence Award at AHPI Healthcare Excellence Awards 2020

Network Structure
32
Max Shalimar BaghMax DehradunMax PanchsheelImmigration centreMax Saket (West)SBUs (MaxLab, Max@Home)
MHIL
Balaji Society (Max Patparganj)
Valid till 2065
Devki Devi Society(Max Saket East,
Onco day care center)
Valid till 2064
HBPL (Max Bathinda)(Max Mohali)
ALPS Hospital Ltd.
(Max Gurgaon)
CRL*(Max Vaishali)(Max Noida)
Saket City Hospitals Ltd.
Medical Services contain specificspecialties & Pathology/Radiology
services, as may be the case
100.0% 100.0% 98.16% 100%
Medical Service Agreement with Society
Gujarmal Modi Society(Max Smart)
Valid till 2105
Medical Service Agreement
BLK Hospital
Valid till 2054
NanavatiHospital
Valid till 2043
Partner facilities
Managed facilities
Owned
Corporate structure as on May 20, 2021 Validity includes extensions available under the contractApplication for merger of ALPS with SCHL was filed on April 9, 2021 with NCLT, MumbaiMHIL – Max Healthcare Institute Limited; CRL – Crosslay Remedies Limited; HBPL – Hometrail Buildtech Private Limited
O&M agreement
Radiant Life Care Mumbai Pvt. Ltd.
99.99%
O&M agreement
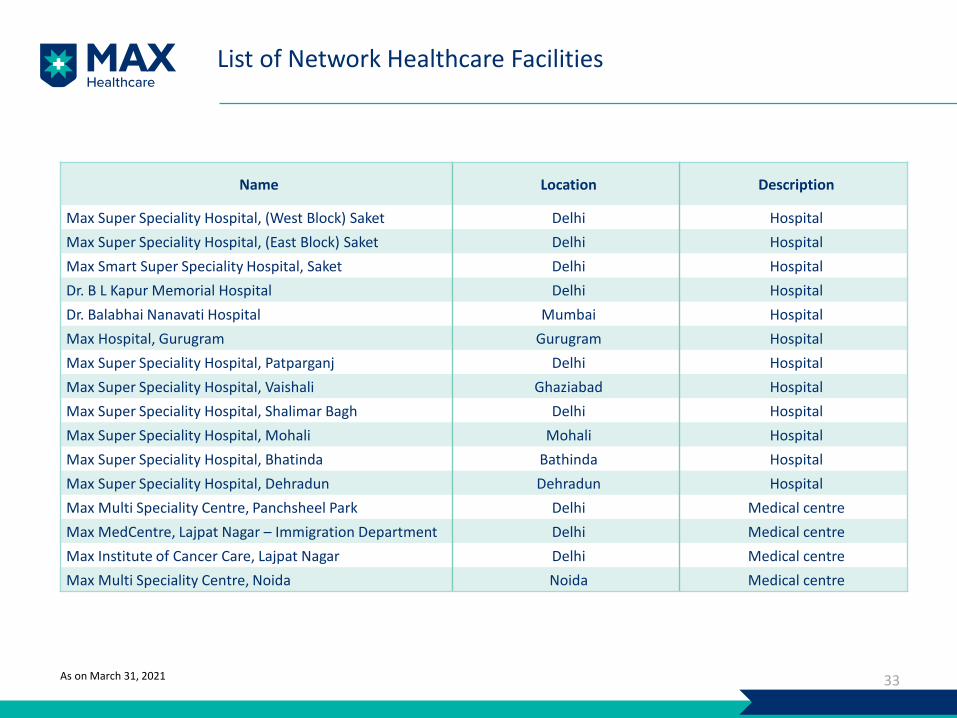
List of Network Healthcare Facilities
33
Name Location Description
Max Super Speciality Hospital, (West Block) Saket Delhi Hospital
Max Super Speciality Hospital, (East Block) Saket Delhi Hospital
Max Smart Super Speciality Hospital, Saket Delhi Hospital
Dr. B L Kapur Memorial Hospital Delhi Hospital
Dr. Balabhai Nanavati Hospital Mumbai Hospital
Max Hospital, Gurugram Gurugram Hospital
Max Super Speciality Hospital, Patparganj Delhi Hospital
Max Super Speciality Hospital, Vaishali Ghaziabad Hospital
Max Super Speciality Hospital, Shalimar Bagh Delhi Hospital
Max Super Speciality Hospital, Mohali Mohali Hospital
Max Super Speciality Hospital, Bhatinda Bathinda Hospital
Max Super Speciality Hospital, Dehradun Dehradun Hospital
Max Multi Speciality Centre, Panchsheel Park Delhi Medical centre
Max MedCentre, Lajpat Nagar – Immigration Department Delhi Medical centre
Max Institute of Cancer Care, Lajpat Nagar Delhi Medical centre
Max Multi Speciality Centre, Noida Noida Medical centre
As on March 31, 2021

About Us
34
Max Healthcare Institute Limited (MHIL) is India’s leading provider of healthcare services.
It is committed to the highest standards of medical and service excellence, patient care,
scientific and medical education.
MHIL has major concentration in north India consisting of a network of 16 healthcare
facilities. Out of the total network, eight hospitals and four medical centres are located in
Delhi and the NCR and the others are located in the cities of Mumbai, Mohali, Bathinda
and Dehradun. The Max network includes all the hospitals and medical centres owned,
operated and managed by the Company and its subsidiaries, and partner healthcare
facilities. These include state-of-the-art tertiary and quaternary care hospitals at Saket,
Patparganj, Vaishali, Rajendra Place, and Shalimar Bagh in NCR Delhi and one each in
Mumbai, Mohali, Bathinda and Dehradun, secondary care hospital in Gurgaon and Day
Care Centres at Noida, Lajpat Nagar and Panchsheel Park in NCR Delhi. The hospitals in
Mohali and Bathinda are under PPP arrangement with the Government of Punjab.
In addition to its core hospital business, MHIL has two SBUs - Max@Home and MaxLab.
Max@Home is a platform that provides health and wellness services at home and
MaxLab offers diagnostic services to patients outside its network.
For further information,
please contact:
For more information, visit
www.maxhealthcare.in
Dilip Bidani
Max Healthcare Institute Ltd.
Tel: +91 98107 05107
Email: [email protected]
Anoop Poojari / Suraj Digawalekar
CDR India
Tel: +91 98330 90434 / 98211 94418
Email: [email protected], suraj@cdr-
india.com