q3 | 2016 download the report
TRANSCRIPT

Quarterly Economic ReportQ3 | 2016November 2016Deloitte Thailand


Message from the Country Managing Partner 04
Executive Summary 05
Global & Asian Economic Review 09
AEC Economic Review 12
Thailand Economic Review 2
Transforming towards the Value-Based Economy
27
Thailand Reform Review 33
Industry Sector Update 41
Contents
Automotive 43
Finance & Banking
Food & Beverage 51
Energy: Electricity 55
Telecommunications 59
47
Upcoming Report Highlights 62

Quarterly Economic Report : Q3 | 20164
Subhasakdi KrishnamraCountry Managing Partner
Dear Our Valued Clients,
We are very pleased to release Quarterly Economic Report Q3|2016 to you. It is a part of our constant endeavors to provide valuable insights to our clients. This high level update and summary
to understand the business environment so as to support you in your decision making process and further development of your business strategies.
The global economy remains on a slow-growth path. A combination of continued uncertainties and challenges including prolonged
uncertainties in Russia, and the aftermath of Brexit will pose potential threats to the world economy whilst expansionary monetary policies that have been used by some countries are reaching their limit. Hence, it is forecasted that global real GDP in 2016 will modestly grow at 3.1%. Not only are western economies
region is currently experiencing a slowdown of economic expansion and growth in 2016 is projected at 5.3% with a growing
the rest of world. Meanwhile, ASEAN will represent a below-potential performance in 2016 as some ASEAN countries are struggling with global headwinds. The Thai economy is slightly showing signs of economic recovery with an expected growth of 3.0% this year, thanks to a competitive tourism sector, improved political environment and more investments from both the private and public sectors.
On behalf of Deloitte Thailand, we very much look forward to supporting you in the dynamic and changing business environment. If you have any questions or inputs, please do not hesitate to contact us at Deloitte.
Best Regards,

Quarterly Economic Report : Q3 | 2016 5
Executive Summary

Quarterly Economic Report : Q3 | 20166
Executive Summary
A combination of continued uncertainties and challenges
pose potential threats to the world economy while the expansionary policy is reaching the limit.
Global and major economies’ GDP growth in 2016
Asia 1/
5.3%
World3.1%
UnitedState1.6% Euro
Area1.6%
China6.6%
Japan0.4%
ASEAN4.3%
India7.3%
Sources: ADB, EIU, European Economic forecast, & IMFRemark : 1/ Asia’s GDP growth excl. Japan

Quarterly Economic Report : Q3 | 2016 7
A steady pace of economic expansion is likely as theregion is encountering potential external and domestic risks to sustain its growth momentum.
ASEAN’s GDP growth in 2016
Myanmar
7.8%Philippines
6.3%
Indonesia
5.2%
Viet Nam
6.0%
Malaysia
4.3%Singapore
1.8%
Thailand
3.0%
Lao PDR
7.4%
Cambodia
6.8%
Brunei
0.5%
ASEAN4.3%
Sources: ADB,EIU, & IMF

Quarterly Economic Report : Q3 | 20168
Global growth is still set to remain in a slow-growth path. Delayed structural
in Russia, prolonged period of subdued global trade, demographic transition in developed countries such as the US and Japan, as well as the threat of Brexit will play out gradually over time while the expansionary policy is reaching the limit.
Asia will experience a slight slowdown of economic expansion and growth in 2016 is projected to slow to 5.3%. Healthy domestic consumption, together with government spending on infrastructure will continue to boost India’s economy. While Japan is struggling to boost its economy through ultra-loose policy, China remains a drag on Asia’s growth prospects.
Headwinds from the west and China are likely to weigh on ASEAN economy. Meanwhil, a still-wide economic disparity, protectionism, barriers to labour mobility and government intervention will hinder the full integration of regional trade and investment.
Thai economy is forecasted to modestly grow at 3.0% this year driven by growth in private consumption and strongly competitive tourism industry. Meanwhile, the majority vote in favour of the referendum on the charter draft is likely to create political stability and help encourage foreign-investor
and stronger consumer spending will help support the US’s economy. Meanwhile, the question about the future of the euro area is still debatable. The vote of the UK to leave the EU will dampen consumer and business sentiment in the euro area and will potentially add downward pressure to the world economy.
World Economy
United States
Euro Area Asia Japan China India ASEAN Thailand
2014 3.3 2.4 1.0 5.6 (0.1) 7.4 7.2 4.5 0.8
2015 3.2 2.6 1.6 5.4 0.6 6.9 7.5 4.4 2.8
2016F 3.1 1.6 1.6 5.3 0.4 6.6 7.3 4.3 3.0
2017F-2020F 3.2 2.0 1.6 4.6 0.3 4.8 7.5 4.6 3.1
-1.0 0.0 1.0 2.0 3.0 4.0 5.0 6.0 7.0 8.0
Trend
Sources: Compiled from various research houses & agencies (e.g. IMF, ADB, EIU, NESDB) & DTTJ AnalysisRemark : Asia’s GDP growth excl Japan

Quarterly Economic Report : Q3 | 2016 9
Global & Asian Economic Review
Quarterly Economic Report : Q3 | 201610
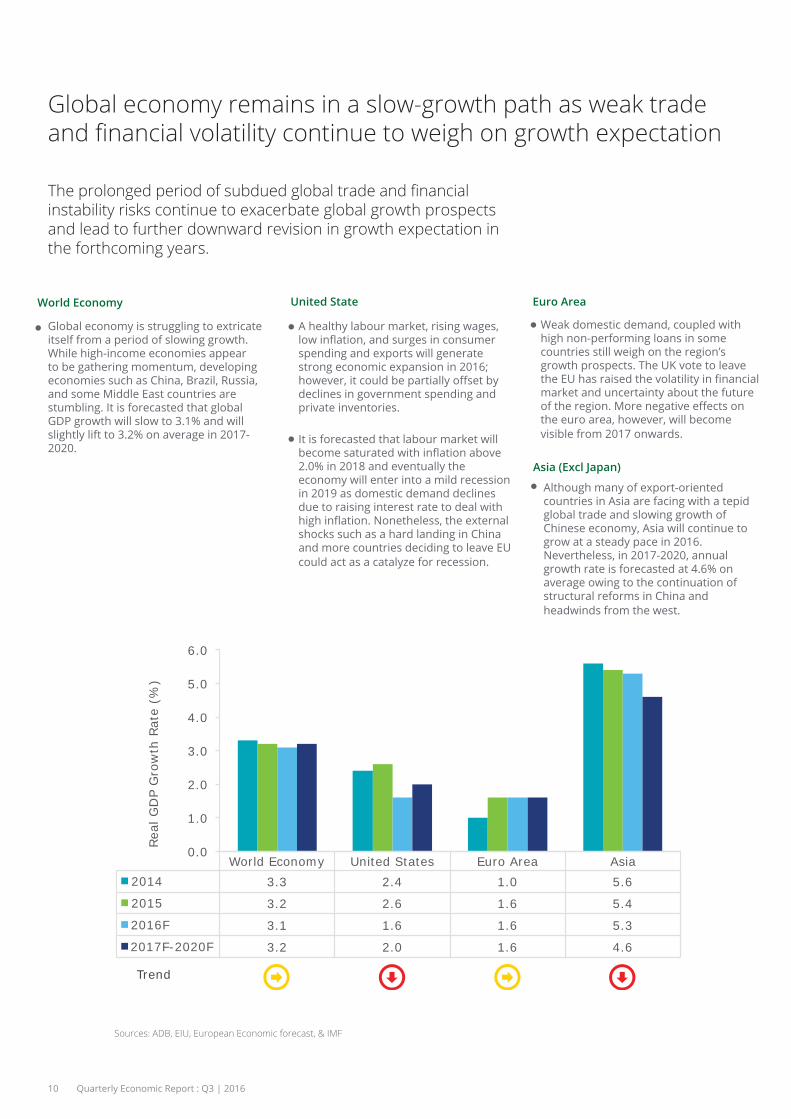
Global economy remains in a slow-growth path as weak trade
Global economy is struggling to extricate itself from a period of slowing growth. While high-income economies appear to be gathering momentum, developing economies such as China, Brazil, Russia, and some Middle East countries are stumbling. It is forecasted that global GDP growth will slow to 3.1% and will slightly lift to 3.2% on average in 2017-2020.
World Economy
Although many of export-oriented countries in Asia are facing with a tepid global trade and slowing growth of Chinese economy, Asia will continue to grow at a steady pace in 2016. Nevertheless, in 2017-2020, annual growth rate is forecasted at 4.6% on average owing to the continuation of structural reforms in China and headwinds from the west.
Asia (Excl Japan)
A healthy labour market, rising wages,
spending and exports will generate strong economic expansion in 2016;
declines in government spending and private inventories.
It is forecasted that labour market will
2.0% in 2018 and eventually the economy will enter into a mild recession in 2019 as domestic demand declines due to raising interest rate to deal with
shocks such as a hard landing in China and more countries deciding to leave EU could act as a catalyze for recession.
United State
Weak domestic demand, coupled with high non-performing loans in some countries still weigh on the region’s growth prospects. The UK vote to leave
market and uncertainty about the future
the euro area, however, will become visible from 2017 onwards.
Euro Area
instability risks continue to exacerbate global growth prospects and lead to further downward revision in growth expectation in the forthcoming years.
World Economy United States Euro Area Asia 2014 3.3 2.4 1.0 5.6
2015 3.2 2.6 1.6 5.4
2016F 3.1 1.6 1.6 5.3
2017F-2020F 3.2 2.0 1.6 4.6
0.0
1.0
2.0
3.0
4.0
5.0
6.0
Trend
Real
GD
P G
row
th R
ate
(%)
Sources: ADB, EIU, European Economic forecast, & IMF

Quarterly Economic Report : Q3 | 2016 11
Lackluster demand growth in developed economies together with China’s structural reform remain a drag on Asia’s growth prospects.
Japanese economy will continue to lose economic momentum. Although the ultra-loose policy will be maintained during the forecast period, it is unlikely
cooperate spending behavior. Stronger yen against the US dollar, moreover, will continue to place constraints on business sentiment and export growth.
Japan
One of the major constraints on growth potential in demographic transition in 2016-2020. The overall population as well as workforce will steadily shrink and consequently will damage consumption and investment sentiment.
A modest economic slowdown is expected in 2016. Real GDP will grow by 6.6% this year compared to 6.9% in previous year. Economic activity will be driven by strong housing market activity and investment by SOEs. Private consumption will robustly grow at the slow rate while investment will lift slightly as a whole.
Real GDP is forecasted to grow by an annual average of 4.8% over 2017-2020 as the reform is slower than expected and continues to undermine the growth prospects for economic growth. Meanwhile a risk of a “hard landing” is anticipated once the authorities impose a tight monetary policy.
China
Strong domestic consumption and government spending on infrastructure will continue to boost India’s economy.
improved business environments due to government initiatives to raise manufacturing output. Nevertheless, a temporary shrink in private-sector investment due to stress in the balance sheets of banks and corporates will slightly weigh on the economy this year.
India
The region will experience a slight slowdown of economic expansion and growth in 2016 is projected to slow to 5.3%. A risk associated with a hard landing in China has grown and will
Japan China India 2014 (0.1) 7.4 7.2
2015 0.6 6.9 7.5
2016F 0.4 6.6 7.3
2017F-2020F 0.3 4.8 7.5
(1.0)
0.0
1.0
2.0
3.0
4.0
5.0
6.0
7.0
8.0
Trend
Real
GD
P G
row
th R
ate
(%)
Sources: ADB, EIU, European Economic forecast, & IMF

Quarterly Economic Report : Q3 | 201612
AEC Economic Review

Quarterly Economic Report : Q3 | 2016 13
ASEAN in theGlobal Economy
In 2014,
ASEAN Economy ASEAN Population ASEAN Trade and FDI
1,367 M 1,259 M 622 M 504 M 319 M
Source: ASEAN Secretariat
ASEAN GDP nearly doubled from USD 1.33 trillion in 2007 to USD 2.57 trillion in 2014.
76% increase in GDP per capita from 2007to 2014.
In 2014, the total popu-lation in ASEAN was 622 million.
More than 50% of population in ASEAN is under 30 years old.
Total trade increased almost USD 1 trillion during 2007 to 2014.
USD 85 billion (5% share to the world) to USD 136 billion (11% of share to the world).
Intra-ASEAN trade contribut-ed to the largest share of trade in ASEAN by trading partner. Intra-ASEAN FDI was the 2nd highest source of total FDI

Quarterly Economic Report : Q3 | 201614
ASEAN’s below-potential performance lies ahead but still at a respectable pace.
Global headwinds continue to pose challenges on ASEAN while a still-wide economic disparity, protectionism, barriers to labour mobility and government intervention will hinder the full integration of regional trade and investment.
Real GDP growth Rate
ASEAN Brunei Darussalam
Cambodia Indonesia Lao PDR Malaysia Myanmar Philippines Singapore Thailand Viet Nam
2014 4.5 (2.3) 7.0 5.0 7.5 6.0 6.4 6.1 2.9 0.8 6.0
2015 4.4 (0.6) 7.0 4.8 7.0 5.0 6.8 5.9 2.0 2.8 6.7
2016F 4.3 0.5 6.8 5.2 7.4 4.3 7.8 6.3 1.8 3.0 6.0
2017F-2020F 4.6 1.0 7.3 5.0 7.6 4.6 9.1 5.4 3.1 3.1 6.5
Trend
-2.0
-1.0
0.0
1.0
2.0
3.0
4.0
5.0
6.0
7.0
8.0
9.0
10.0
2014 2015 2016F 2017F 2020F
ASEAN
Brunei
Cambodia
Indonesia
Lao PDR
Malaysia
Myanmar
Philippines
Singapore
Thailand
Viet Nam
Lao PDR Cambodia
Myanmar
Thailand
Viet Nam
Brunei
Philippines
Malaysia
Indonesia
Singapore
ASEAN
Sources: ADB, EIU, IMF, NESDB, & Research Houses
Real GDP growth rate of ASEAN economies from 2014 – 2020F

Quarterly Economic Report : Q3 | 2016 15
Brunei
GDP growth Private consumption
Total investment
Government Balance1/
Current Acocunt
Balance 1/
2015 (0.6) 6.5 (0.7) 6.5 (0.4)
2016F 0.5 (1.0) (12.7) (1.3) (0.7)
(15.0)
(10.0)
(5.0)
-
5.0
10.0
n/a
n/a
facilities has kept the sultanate’s economy sluggish, a sign of strong rise in oil and gas production has shown. GDP growth will remain in the black at 0.7% this year before picking up to 1.0% in 2017.
A decline in government spending will impede the economic expansion in 2016.Nevertheless, a rising global food prices in 2017 is likely to support the agricultural sector. Works on infrastructure projects such as a bridge to Pulau Muara Besar island and Temburong bridge will continue throughout the forecast period.
An economic stabilisation is forecasted in 2017 due to a recovery of energy prices. A weak positive economic growth will help boost private consumption spending. Meanwhile, unemployment will continue to fall and Brunei is expected to remain dependent on foreign labour.
Bandar Seri Begawan
Brunei economy forecasted to grow 0.5% in 2016Real expenditure on GDP (% change)
Sources: ADB, EIU, and IMF1/ % of GDP
Rising oil and gas production volume shown after the year of maintenance works in aging
spending, on the other hands, will limit growth in service sector and also overall non-energy sector.
Quarterly Economic Report : Q3 | 201616
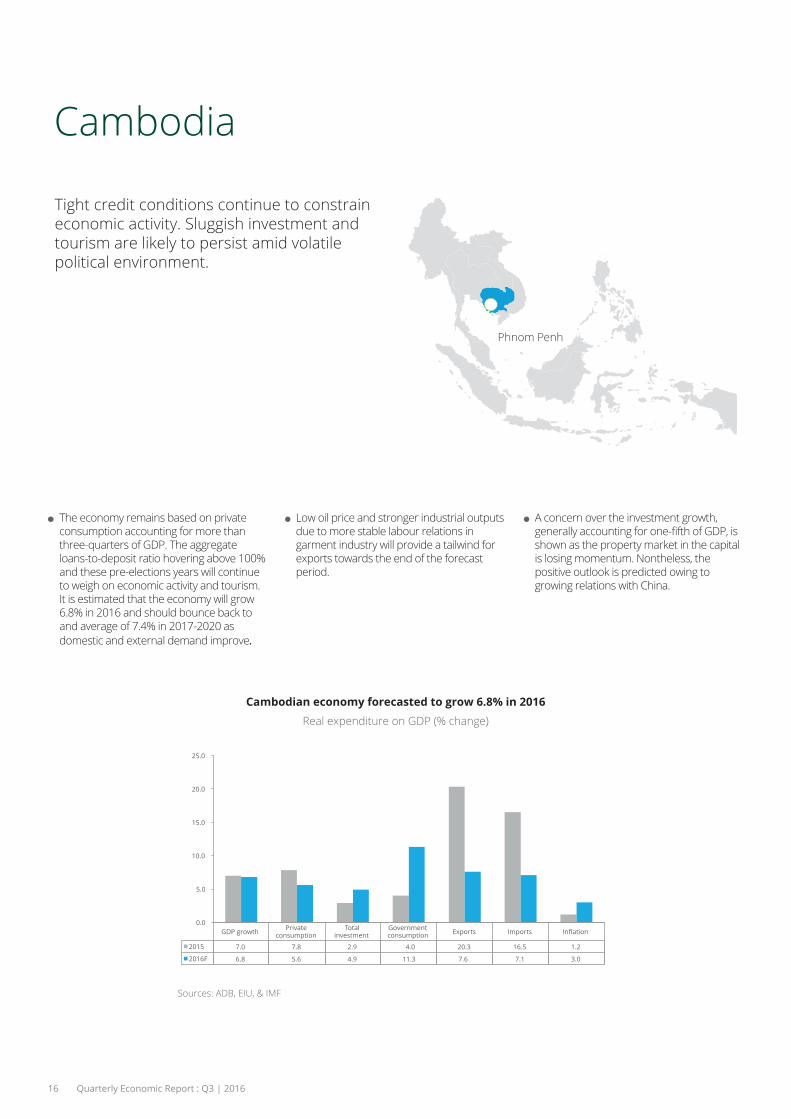
The economy remains based on private consumption accounting for more than three-quarters of GDP. The aggregate loans-to-deposit ratio hovering above 100% and these pre-elections years will continue to weigh on economic activity and tourism. It is estimated that the economy will grow 6.8% in 2016 and should bounce back to and average of 7.4% in 2017-2020 as domestic and external demand improve.
Low oil price and stronger industrial outputs due to more stable labour relations in garment industry will provide a tailwind for exports towards the end of the forecast period.
A concern over the investment growth,
shown as the property market in the capital is losing momentum. Nontheless, the positive outlook is predicted owing to growing relations with China.
GDP growth Private consumption
Total investment
Government consumption Exports Imports
2015 7.0 7.8 2.9 4.0 20.3 16.5 1.2
2016F 6.8 5.6 4.9 11.3 7.6 7.1 3.0
0.0
5.0
10.0
15.0
20.0
25.0
Cambodian economy forecasted to grow 6.8% in 2016Real expenditure on GDP (% change)
Sources: ADB, EIU, & IMF
Cambodia
Tight credit conditions continue to constrain economic activity. Sluggish investment and tourism are likely to persist amid volatile political environment.
Phnom Penh

Quarterly Economic Report : Q3 | 2016 17
Indonesia
Jakarta
Private consumption, gross capital forma and government expenditure has still posted strong growth. A modest improve
With an improvement of news roads, ports, and power stations constructions, an Investment growth in 2016 will increase by 5.2% a year on average in 2016-2020. Some Concerns over government revenue remain and will cause an inconsistency of public spending.
Another challenge on Indonesian economy’ s growth is the administration’s ability to push through reforms such as
labour market in some areas. Hence, a slight drop of economic growth is expected.
GDP growth Private consumption
Total investment
Government consumption Exports Imports
2015 4.8 4.8 5.1 4.9 (1.9) (5.8) 6.4
2016F 5.2 5.2 5.3 5.0 (2.2) (2.1) 3.6
-8.0
-6.0
-4.0
-2.0
0.0
2.0
4.0
6.0
8.0
Indonesian economy forecasted to grow 5.2% in 2016Real expenditure on GDP (% change)
Sources: ADB, EIU, & IMF
Domestic demand remains strong as gross capital formation rises and the government’s
Meanwhile, the external sector will underperform but the overall contribution to growth is still positive.

Quarterly Economic Report : Q3 | 201618
Lao PDR
Vientiane
Continued works on hydropower projects, along with an increasing power exports will largely help lift GDP growth in 2016-2017. Meanwhile, partial recovery in global commodity prices in 2017 will also support in mining sectors. GDP growth in 2016 and 2017 are estimated to reach 7.4% and 7.6% respectively.
The investment spending is still funded by the large number of ongoing construction projects. 480-mw Nam Ngum 3 hydropower project will help domestically supply power. All of the power produced by the 1,285-mw dam penciled to complete in 2019-2020 will be exported to Thailand and help promote energy exports and economic growth.
A delay in the high-speed railway from Vientiane to the Chinese border project is solved and expectedly works will be underway in 2017. Private consumption is expected to continually rise, driven by
Thailand and by remittance from Lao workers working abroad.
GDP growth Private consumption
Total investment
Government Balance 1/
Current Account
Balance 1/
2015 7.0 (5.3) (18.4) 1.3
2016F 7.4 (7.2) (18.2) 1.3
-20.0
-15.0
-10.0
-5.0
0.0
5.0
10.0
n/a
n/a n/a
n/a
Lao PDR economy forecasted to grow 7.4% in 2016Real expenditure on GDP (% change)
Sources: ADB, EIU, and IMF 1/ % of GDP
High power exports and ongoing works on hydropower projects will play an important role in boosting the economy. External trade balance, on the other hands, will be a drag on the acceleration of GDP growth in 2016-2017.

Quarterly Economic Report : Q3 | 2016 19
Malaysia
Kuala Lumpur
The slowest rate of economic growth since
largest oil and gas producers, the drop in the value of oil and gas continues to drag on growth. Meanwhile, demand for electronic and electrical goods, Malaysia’s top exports, is shrinking in line with the slowdown of China, its second-largest export market.
Domestic demand remain resilient and private spending will continue to increase. Economic growth rate is projected to slightly pick up in 2017-20 to an average 4.6% a year as global trade modestly recover.
Services sector still accounts for the lion’s share of GDP where the most dynamic subsectors are information and communication, together with real estate and business services. Agricultural sector will rebound due to the anticipated higher global commodity prices; however its
drive overall GDP
GDP growth Private consumption
Total investment
Government consumption Exports Imports
2015 5.0 6.0 3.7 4.4 0.6 1.2 2.1
2016F 4.3 4.9 4.0 4.2 1.0 1.2 1.9
0.0
1.0
2.0
3.0
4.0
5.0
6.0
7.0
Malaysian economy forecasted to grow 4.3% in 2016Real expenditure on GDP (% change)
Sources: ADB, EIU, & IMF
The weakest pace of economic expansion is likely as a result of subdued global trade and low energy prices. Services and agricultural
-ciently boost the overall GDP.

Quarterly Economic Report : Q3 | 201620
Myanmar
Naypyidaw
Rapid GDP growth is expectedly buttressed by large FDI projects in various industries, notably infrastructure and hydrocarbons. It is projected that the economy will grow 7.8% in 2016 and pick up to 8.9% a year on average in 2016-2020.
Foreign investment continues to grow due to the regulatory and legal reforms and special economic zones. Export growth is
rapid growth in imports due to rising investment activities will subtract net exports.
sector including the entry of foreign banks, the launch of a stock exchange and improved access to capital and foreign market will encourage activities in many sectors, particularly labour-intensive export manufacturing and tourism.
GDP growth Private consumption
Total investment
Government consumption Exports Imports
2015 6.8 1.8 14.0 7.2 18.0 22.0 10.8
2016F 7.8 2.8 14.5 7.2 7.0 13.0 7.0
0.0
5.0
10.0
15.0
20.0
25.0
M economy forecasted to grow % in 2016Real expenditure on GDP (% change)
Sources: ADB, EIU, & IMF
Large projects in a number of industries, particularly infrastructure and hydrocarbons funded by foreign investors continue to lift
sector will help support many fast-growing sectors.

Quarterly Economic Report : Q3 | 2016 21
Philippines
Manila
The economy is gathering growth
investment and government consumption pick up strongly at double-digit rates. Private consumption, moreover, expands at its fastest pace in nearly three
steadily improved employment and healthy
forecasted. Export revenue, particularly from electronic products, machinery and transport equipment and chemicals, will drop sharply amid subdued commodity prices and weak global economy.
Inadequate public investment and poor infrastructure will remain in 2016-2020. The new government, however, aims to push through a number of infrastructure projects, but it is expected that spending will gradually improve in 2016.
GDP growth Private consumption
Total investment
Government consumption Exports Imports
2015 5.9 6.3 15.1 8.4 9.2 14.0 1.3
2016F 6.3 6.7 13.2 7.1 5.2 9.6 1.7
0.0
2.0
4.0
6.0
8.0
10.0
12.0
14.0
16.0
Philippine economy forecasted to grow 6.3% in 2016Real expenditure on GDP (% change)
Sources: ADB, EIU, & IMF
government consumption continue to support economy, while private consumption
improved employment and remittances underpin household spending.

Quarterly Economic Report : Q3 | 201622
Singapore
Singapore
The economy still loses growth momentum amid global headwinds. Both exports and
to slow down. Although public investment continues to positively contribute to overall
outweigh weaker private investment, particularly in property.
Even though Singapore is facing higher unemployment rate and consumers are still cautious, some support from private consumption to boost growth is expected. Meanwhile, rising consumer purchasing power due to higher wage rates and visitor arrivals should help support wholesale and retail services in 2016.
The administration will continue to encourage economic activity through more government spending. Biomedical products remain the key factor determining the manufacturing sector’s performance.
GDP growth Private consumption
Total investment
Government consumption Exports Imports
2015 2.0 4.5 (1.0) 6.6 2.5 2.1 (0.5)
2016F 1.8 2.1 (0.9) 7.0 2.0 1.5 (0.7)
-2.0
-1.0
0.0
1.0
2.0
3.0
4.0
5.0
6.0
7.0
8.0
Singapore economy forecasted to grow 1.8% in 2016Real expenditure on GDP (% change)
Sources: ADB, EIU, & IMF
Sings of weakness in Singapore economy, together with concern over the recovery of global economy, are likely to persist. Government spending will continue to play an impor
external demand.

Quarterly Economic Report : Q3 | 2016 23
Viet Nam
Hanoi
Continued growth in private consumption and foreign investment, particularly in export-oriented electronics sector are
and favourable policies to liberalise regulations and deepen global economic integration. The economy is projected to grow 6.0% in 2016 and 6.5% on average in 2017-2020.
Growth in agricultural sector still struggles to
drought. Meanwhile, the reform of SOEs and government size will continue to limit government spending this year.
The migration of low-cost export manufacturing from China to Viet Nam will help drive exports of goods; however, the negative net exports is forecasted as export revenue will not outweigh import gains.
GDP growth Private consumption
Total investment
Government consumption Exports Imports
2015 6.7 9.3 9.3 7.0 12.6 18.1 0.9
2016F 6.0 5.8 9.8 6.8 8.3 9.3 2.8
0.0
2.0
4.0
6.0
8.0
10.0
12.0
14.0
16.0
18.0
20.0
Vietnamese economy forecasted to grow 6.0% in 2016Real expenditure on GDP (% change)
Sources: ADB, EIU, & IMF
The economy remains in good shape. Both private consumption and investment in electronics sector will help support
drought continue to undermine the agricultural sector.

Quarterly Economic Report : Q3 | 201624
Thailand Economic Review

Quarterly Economic Report : Q3 | 2016 25
Thailand
Bangkok
Thai economy is still dependent on continued private consumption as it accounts for approximately half of GDP in Thailand. With improved political environment and greater consumer
private consumption is forecasted and it is estimated that the economy will expand 3.0% in 2016, compared to 2.8% in previous year.
Tourism industry in Thailand will strongly grow and help support exports in services. On the other hands, merchandise exports
commodity prices and sluggish external demand for industrial and agricultural goods. Meanwhile, a negative growth of imports is forecasted as a result of lower demand for intermediate and capital goods used in export manufacture.
GDP growth Private consumption
Total investment
Government consumption Exports Imports
2015 2.8 2.1 4.8 2.2 0.2 (0.3) (0.9)
2016F 3.0 2.2 4.2 3.1 0.9 (0.3) 0.3
-2.0
-1.0
0.0
1.0
2.0
3.0
4.0
5.0
6.0
Thai economy forecasted to grow 3.0% in 2016Real expenditure on GDP (% change)
Sources: ADB, EIU, & IMFSources: ADB, NESDB, EIU, & IMF
A sign of bounce-back in private consumption growth and strongly competitive tourism industry is shown amid muted external demand. Greater political stability and
improve an economic expansion.

Quarterly Economic Report : Q3 | 201626
Sources: NESDB, K-Research, SCB EIC, & DTTJ Estimates/p preliminary data
49.7%
17.2%
16.3%
6.7%
10.2%
2016 GDP Component Breakdown/p
Private Consumption
Private Investment
Government Consumption
Government Investment
Net Export
Downside risks stemming from rising debt levels of low-income households, widen income gap between urban and rural areas, as well as external-sector weakness will put pressure on private consumption and overall economy.
Weak demographics and a shortage of skilled labour, along with higher wage rates and infrastructure development in other ASEAN countries will weaken the Kingdom’s competitiveness and suggest lower growth potential for Thailand in the future.
An attempt to transform Thai economy towards the value-based economy as stated in Thai Economy 4.0 will enable Thailand to tackle with the troubles of the middle-income trap; however the transformation remains doubtful unless consistent reform of education system and structural reform to lift up a quality of the labour force
One of the key factors driving economic growth in Thailand is a strong public investment in large-scale infrastructure projects, particularly in transport infrastructure.

Quarterly Economic Report : Q3 | 2016 27
Thai Economy 4.0:Transforming towards the Value-BasedEconomy

Quarterly Economic Report : Q3 | 201628
Thailand competitiveness against the world
Population (millions)
GDP per capita (US$) GDP (US$ billions)
GDP (PPP) % of world total
Competitiveness RankingGCI 2016 – 2017: Rank 34th / 138
Source: IMF and World Economic Forum
0 1 2 3 4 5 6 7
Institutions
Infrastructure
Macroeconomic environment
Health and primary
education
Higher education and training
Goods market
Labour market
Financial market development
Technological readiness
Market size
Business sophistication
Innovation
Thailand
1 Transition 1 – 2 2 Transition
2 – 3 3
Factor driven driven
Innovation driven
Stage of Development
Global Rank
Singapore 2
Japan 8
Hong Kong SAR 9
New Zealand 13
Chinese Taipei 14
Australia 22
Malaysia 25
Korea, Rep. 26
China 28
Thailand 34
Thailand in 2015
68.8395.3
education and training, Goods market
Financial market development, Technological readiness, and Market size.
5,742.30.98

Quarterly Economic Report : Q3 | 2016 29
Thailand’s previous performance
Most problematic factors for doing business
Year 2012-13 2013-14 2014-15 201 5 -16 2016-17
Rank 38 /144 37 /148 31 /144 32 /140 34 /138
0 5 10 15 20
Crime and theft
Restrictive labour regulations
Poor public health
Foreign currency regulations
Tax rates
Poor work ethic in national labour force
Tax regulations
Inadequate supply of infrastrcuture
Inadequately educated workforce
Policy instability
ty to innovate
Corruption
overnment bureacracy
Government instability
Score
Source: IMFand World Economic Forum
Thailand is ranked at 10th in East Asia and
world in 2016-17.
Good macroeconomic environment and large market size enable Thai economy to compete in the global market.
Previous performance indicates that Thailand’s competitiveness
Compared to Singapore and Malaysia which their economies are driven by innovation, Thailand is still stuck to
this stage of development due to the low level of innovation and labour
In Executive’s view, political instability, lack
government bureaucracy and
innovation in Thailand limit their business and growth potential.

Quarterly Economic Report : Q3 | 201630
Source: Ministry of Commerce, Thailand
Thai Economy 2.0 Light Industry
Thai Economy 1.0 Agriculture
Thai Economy 3.0 Heavy Industry
Thai Economy 4.0
Wea
lth o
f the
Nat
ion
Seeking for the new economic model is vital to escape from “Middle-income trap”
Thailand Economic Models
It is evident that Thailand is struggling with the so-called “Middle-income trap” as Thai economyis gradually losing its competitiveness in attracting foreign investment and boosting manufactured goods exports due to rising wages and unskilled labour force. Income inequality, Low level of innovation, and a shortage of technological resource, moreover, will hold Thai economy back from a transition to become a high-income economy.

Quarterly Economic Report : Q3 | 2016 31
Transforming towards the Value-Based Economy
Thai economy is a resource-driven growth
abundant resource and labour supply as well as high rates of investment.
Merchandise exports and inward FDI has continued to support and encourage economic activity. In other words,
predominantly relies on the performance of global market.
For a new economic model, Thailand aims to become the “Value-Based Economy” which mainly focus on innovation, technology, and trade in services.
four main areas which are farming, SMEs, labour, and services will be improved to unleash their potential and to become a new engine of Thai economic growth.
Source: Ministry of Commerce, Thailand
Areas of Transformative Shift
Smart Farming
Traditional Farming
Smart Enterprises/
Startups
Traditional SMEs
High Value Services
Traditional Services
Knowledge Workers/
High Skilled labour
Unskilled Labour
Commodities
Industries
Trade in Goods
Innovation
Technology
Trade in Services
More For Less
Less For More

Quarterly Economic Report : Q3 | 201632
Smart Device, Robotics, and Mechatronics
Digital, IoT, and Embedded
Technology
Health, Wellness, and
Bio-Med.
Food Agriculture
and Bio-Tech.
Creative, Culture, and High Value
Services
The new model will be implemented together with the 20-year national strategy and economic reform to turn the Thailand’s traditional economy into value-based economy.
Bio-diversity and cultural diversity which are considered as Thailand’s comparative advantage will be transformed into competitive advantage through the mechanism of “public –private people partnership”.
sized through innovation and creativity to improve Thailand’s competitiveness in global market and eventually to escape
“Transform Thailand’s comparative advantage into competitive advantage”

Quarterly Economic Report : Q3 | 2016 33
Thailand Reform Review

Quarterly Economic Report : Q3 | 201634
Thailand’s Current Politics and Administration system
NCPO
Government NLA NRSA
The National Council for Peace and Order (NCPO)
To maintain peace and security in the country and to ensure a smooth reform process.
The interim Government
To perform public administration duties
in both economic and social aspect.
The National Legislative Assembly
To performs functions of National Parliament,
including passing legislations, approving emergency decrees,
and approving treaties.
The National Reform Steering Assembly
To implement and to initiate ideas for national reforms following the dissolution of the National Reform
Council (NRC)
Note: The National Reform Council (NRC) was for undertaking a comprehensive reform of the country and drawing up recommendations for the Constitution Drafting Committee (CDC) The Constitution Drafting Committee (CDC), which consists of legal experts, academics, former senators, judges, civil servants, representatives from NGOs and the media, is nominated to ensure a truly democratic constitutional monarchy.

Quarterly Economic Report : Q3 | 2016 35
NCPO’s roadmap to reform Thailand in Stage 2
Coup on 22 May 2014
Stage OneBring back normal operations of civil service
Executed national security and law enforcement.
Developed economic master plans.
Launched the 19th interim constitution of Thailand.
Cleared illegal weapons.
Set up Reconciliation & Reform Center.
Drafted the 2015 Annual Budget Bill of THB 2.6 trillion
Enforced narcotic suppression.
Reviewed 56 SOEs’ governance structure.
May 2014
Jun 2014
Jul 2014
The National Council for Peace and Order (NCPO) proposed three stages of national administration during the transition period.
Sources: compiled from NCPO, the Royal Thai Government, ThaiPBS, & Thai Local Newspapers (The Nation, Bangkok Post)

Quarterly Economic Report : Q3 | 201636
Stage TwoCreate an environment contributes to national reforms with NLA & NRC in actions.
Aug 2014 – Oct 2014
Oct 2014 - Sep 2015

Quarterly Economic Report : Q3 | 2016 37
Stage Two - ContinuedCreate an environment contributes to national reforms with NLA and NRSA in actions.
Stage ThreeAn election will be held to restore full democracy.
Appointed a new 21-person Constitutional Drafting Committee to propose the new draft of 20th Constitution of Thailand within 180 days.
Amended the drafted 20th Constitution in line with the referendum result.
Execute general elections – the Senate and the House of Representatives
Established the National Reform Steering Assembly (NRSA) consisting of 200 members to implement the national reform blueprint proposed by the dissolved NRC.
Launch the 20th Constitution of Thailand around November 2016
Parliament in action
Form a new government
Continue Thailand’s reform initiatives
Conducted a nationwide referendum of the drafted 20th Constitution of Thailand on August 7, 2016. the majority of the voters (61%) accepted the drafted 20th Constitution of Thailand and also 58% of them allowed the
transition period.
Draft and deliberate the organic laws of the 20th Constitution of Thailand (December 2016 - July 2017).
Oct 2015 – Aug 2016
Aug 2016 – Nov 2017 (Approximately)
Dec 2017 onwards (Approximately)
Sources: compiled from NCPO, the Royal Thai Government, ThaiPBS, & Thai Local Newspapers (The Nation, Bangkok Post)

Quarterly Economic Report : Q3 | 201638
The government proposed plans to set up a budgetary base for future infrastructure development in Thailand, namely, the “Thailand Future Fund” with an approved total of 100 billion Baht. State Enterprise
fund would be of a closed type with no expiration and would be managed by the Securities and Exchange Commission (SEC) so that it can be accessed via the Stock Exchange of Thailand.
The Prime Minister addressed a national strategy has been included in the draft constitution to ensure transparency in government. Such national strategy will be in line with the 12th National Economic and Social Development Plan to be implemented from October 2016 which includes six key strategies.
The Prime Minister attended the G20 summit held on 4th-5th September 2016 in Hangzhou, China to discuss sustainable mutual economic development and present Thailand as a country able to link the G20 and G77 entities.
The Prime Minister stressed the government’s objective to improve the country’s transport system by connecting Thailand with other ASEAN member states to accommodate the general public and capture more foreign investors. Convenience in transport options will reduce logistics cost, which will enhance Thailand’s competitive advantages and promote Thailand as the transport hub of ASEAN.
Accelerating Thai economic growth
Agricultural reform
Energy and environment sustainability
Thailand and the world
HighlightsGovernment Priorities
The Interim Government to perform public administration
The Interim Government established under Thailand’s Interim Constitution 2014 consists of the Prime Minister (General Prayuth Chan-ocha) and 34 other ministers appointed by the King to perform public administration.
Sources: The Royal Thai Government, Thailand Interim Constitution 2014, National New Bureau of Thailand & Thai local newspapers (The Nation, Bangkok Post)

Quarterly Economic Report : Q3 | 2016 39
NLA deliberated on a transnational trade
services to freely be engaged. The agreement will provide expansion
providers.
NLA endorsed a draft act on the 2017
2.73 trillion Baht. In its third reading on September 9, the NLA members voted 183-0 with 2 abstentions to pass into law the 2017 Fiscal Budget Act that will allow the government to spend from October 1, 2016 till September 30, 2017.
NLA voted to accept an investment promo-tion draft legislation to make investments in the ASEAN Economic Community (AEC)
drafted for the future investments, especially for the AEC and the Thailand4.0 gal.
Minister on the Pichit province gold mine,
rehabilitate the area’s environment and
community and remarking that while the government has discontinued the mine’s license, it will continue to operate until the end of 2016.
Priority role is to act as the House of Representatives, the Senate, and the National Assembly during the transition period.
NLA has the power to:
HighlightsNLA’s Key Duties
The National Legislative Assembly (NLA) to take the Parliament duties
NLA established under Thailand’s Interim Constitution 2014 NLA consists of 220 members appointed by the King in accordance with NCPO’s recommendation.
Issue the rule on election and perform duties of the NLA President, the NLA Vice-Presidents, and its Committees and meetings.
Introduction and deliberation of Bills and Organic Law Bills (i.e. Constitution Related Bills).
Monitor and control the Interim Government by making the submission of motions, discussion, making resolutions, and interpellation.
Peace keeping and other related matters for the performance of its duties.
-
-
-
-
Sources: The Royal Thai Government, Thailand Interim Constitution 2014, National New Bureau of Thailand & Thai local newspapers (The Nation, Bangkok Post)

Quarterly Economic Report : Q3 | 201640
NRSA signed a MOU on cooperation with various organizations to implement the national reform process with a network of 52 organizations. The collaboration is intended to help achieve results in the national reform process in all 11 areas, which are included in the master plan that the assembly had approved.
Implement the national reform blueprints proposed by the dissolved National Reform Council (NRC).
Give advices and recommendations to the Constitution Drafting Committee (CDC) for the purpose of Constitution drafting.
HighlightsNLA’s Key Duties
The National Reform Steering Assembly (NRSA) to implement the national reform blueprintsNRSA established under Thailand’s Interim Constitution 2014 consists of 200 members appointed by the King in accordance with NCPO’s recommendation.
NRSA considered to make political parties to become political institutions to allow for more public participation and to ensure their integrity. It called for political parties to be developed into public institutions where citizens with similar political ideologies can join together without
interests.
The Election Commission released the result of the referendum. The majority of Thai citizens voted to accept the new constitution by approximately 61% or more than 15 million votes. In addition, approximately 58% voted in favor of the additional question which proposes that the appointed Senate be involved in selecting
years.
Sources: compiled from NCPO, the Royal Thai Government, ThaiPBS, & Thai Local Newspapers (The Nation, Bangkok Post)

Quarterly Economic Report : Q3 | 2016 41
Industry Sector Update

Quarterly Economic Report : Q3 | 201642
Thailand key industries are expected to continue their moderate growth path in 2016
Sources: Compiled from various research houses & agencies (e.g. EIU, NESDB, K-Research, SCB EIC, FTI) & DTTJ Analysis
Automotive Finance & Banking Food & Beverages Energy: Electricity Telecommunications 2014 (24.0) 4.0 6.0 0.3 4.5
2015 2.0 3.0 (1.2) 2.5 (14.4)
2016F 5.0 6.0 3.0 4.0 3.0
Forecast CAGR 4.0 7.5 3.0 3.0 5.0
(30.0)
(25.0)
(20.0)
(15.0)
(10.0)
(5.0)
0.0
5.0
10.0
Car production Electricity consumption
Loan at the year end
Mobile subscription
Food
production

Quarterly Economic Report : Q3 | 2016 43
Thai automotive industry in 2015 -
mestic market contracted since 2013. Total car production was 1.91 million units or grew by 2% compared to 2014s’. Car export reached 1.2 million units or increased 7% YoY. However, domestic sales during 2015 was 0.8 million units or 9% lower than 0.9 million units sold in 2014 due to the impact of economic slowdown, lower commodity prices, and high level of household debt.
Car production is projected at 2.0 million units, growing 5% from 2015. Of which, 65% of production is for export and 35% for domestic sales. Domestic car sales is forecasted at 0.7 million units or contracts 10% YoY due to the slowdown of domestic demand, whilst car export is likely to maintain the growth rate at 7%YoY thanks to growing demands in major export markets.
As Thailand represents a regional strategic location for production along with the BOI’s eco-car incentive scheme and mega-project investment to enhance Thailand’s competitiveness, major car producers will continue to deploy their production and supply chain capacity to
overall global economy will gradually capture an upward growth trend in the coming years, Thailand’s car industry is projected to grow 4% over the long-term.
Situation in 2015 Forecast 2016 Long-term trend
Sources: BOI, FTI, OIE, Somboon Advance Technology (SAT), & Thailand Automotive Institute
AutomotiveThai automotive industry in 2016 is forecasted to grow 5% thanks to export growth. However, domestic market continues
long-term, Thailand automotive industry is projected to have an upward moderate growth path.

Quarterly Economic Report : Q3 | 201644
ASEAN car production volume (2012 – 2016F)
Thailand domestic car sales and export(2012 – 2019F)
Sources: ASEAN Automotive Federation, FTI, OIE, OICA, & SAT
Million Unit
0.0
0.5
1.0
1.5
2.0
2.5
3.0
Vietnam Philippines Malaysia Indonesia Thailand
2012
2013
2014
2015
2016F
CAGR (5)%
CAGR 0%
CAGR (4)%CAGR
(33)%CAGR 34%
1.0
1.4
1.1
1.3
1.0
0.9
1.2
0.8
1.3
0.7
2.1 2.2 2.3
0.0
0.5
1.0
1.5
2.0
2.5
3.0
2012 2013 2014 2015 2016F 2017F 2018F 2019F Domestic Sales Export
Million Unit
Thailand remains the ASEAN’s automotive industry leader in the coming years buttressed by an established solid supply chain and a large pool of skilled labours.
Although CAGR displays negative production growth, Thailand remains the leading car producer of ASEAN with 51.2% market share.
During 2016, Thailand is expected to produce 2.0 million cars growing 5% from 2015. Domestic sales is forecasted at 0.7 million units accounting for 35%, while export is projected at 65% or 1.3 million units
Overall, ASEAN car industry in 2016 is forecasted to grow around 1-2% compared to 2015s’. Car export from ASEAN is expected to grow while domestic demand remains in a contraction mode.
Despite the slowdown of both global and domestic car demands, automotive players in Thailand can outperform other regions as a result of an established solid supply chains and a large pool of skilled labours in Thailand.

Quarterly Economic Report : Q3 | 2016 45
only 0.1% compared to 2015s’ due to government stimulus package.
The total number of domestic cars sales during H1-2016 was 0.37 million units dropped 0.1% YoY.
Japanese car manufacturers maintained the market leadership in the Thailand car market. Several car manufacturers attempted to capture emerging and untapped demands in ASEAN countries.
Although macro adverse factors (e.g. high household debt, lower commodity prices, trade contraction) continue to
recent government stimulus packages largely rejuvenated car demands during H1-2016.
Update Thailand Car Market for H1-2016
Toyota 29%
Isuzu 19% Honda
15%
Mitsubishi 8%
Nissan 6%
Mazda 6%
Ford 5%
Suzuki 3%
Chevrolet 2%
Others 7%
Thailand’s domestic car
by brand during H1-2016
Sources: FTI & Toyota (Thailand) Co. Ltd.

Quarterly Economic Report : Q3 | 201646
Sales volume summary as of H1-2016.
Sales Volume YTD 2558
Sales Volume YTD 2559
Sales Growth (%) YoY
Market Share 2558 (%)
Market Share 2559 (%)
Toyota 122,804 108,669 -11.5% 33.3% 29.5%
Isuzu 69,281 72,292 4.3% 18.8% 19.6%
Honda 54,793 53,952 -1.5% 14.8% 14.6%
Mitsubishi 23,719 28,592 20.5% 6.4% 7.8%
Nissan 25,834 23,093 -10.6% 7.0% 6.3%
Mazda 16,837 21,160 25.7% 4.6% 5.7%
Ford 14,331 18,032 25.8% 3.9% 4.9%
Suzuki 10,564 10,736 1.6% 2.9% 2.9%
Chevrolet 7,945 6,926 -12.8% 2.2% 1.9%
Others 23,001 25,178 9.5% 6.2% 6.8%
Total 369,109 368,630 -0.1% 100.0% 100.0%

Quarterly Economic Report : Q3 | 2016 47
Overall, Thailand loan outstanding in 2016 is forecasted at 14.0 trillion Baht or grow 6%YoY. During Q2/2016, total loan outstanding was 13.8 trillion Baht growing 1.6% QoQ or 5.0% YoY. Gross NPL in banking industry was 0.37 trillion Baht raisen 4.6% QoQ or 19.9% YoY
conditions. Overall during 2016, loan demands are expected to stem from an accommodative monetary policy and public infrastructure investment.
Financial institutions will be posting loan growth around 7-8%YoY over the next few years despite facing both external and domestic downside risks. In addition, Thai Government will continue to pursue both short-term and long-term economic stimulus schemes (e.g. SME incentives, transportation infrastructure investments), which will stimulate both Bangkok and upcountry economic expansion, boost loan demands across Thailand, and also, provoke capital markets to raise investment funds.
Situation in 2015 Forecast 2016 Long-term trend
Sources: EIU, K-Research, & SCB EIC
Finance & BankingFinance & banking sector is ted to grow 6% in 2016 mainly
policy.
As a result of domestic and global
adverse factors (e.g. lower commodity prices, high level of household debt,
trillion Baht, growing 3% from 2014.

Quarterly Economic Report : Q3 | 201648
Thailand’s total Loan vs. NPL 2006 – Q2/2016
6.0 6.2 7.5 7.8 8.8 9.8 11.3 12.3 12.9 13.2 13.8
0.0
2.0
4.0
6.0
8.0
10.0
12.0
14.0
16.0
2006 2007 2008 2009 2010 2011 2012 2013 2014 2015 Q2/2016
CAGR 8.7%
CAGR(1.7)%
Trillion Baht
% NPL 7.5% 7.3% 5.3% 4.9% 3.6% 2.8% 2.3% 2.2% 2.2% 2.6% 2.7%
Total Loan
NPL
Sources: BOT, EIU, SCB EIC, K-Research, TMB Analytics, & DTTJ Estimates (Data as of September 2016)Note: (1) Total Loan includes both Thai banks’ and foreign banks’ loan outstanding as of the 2nd quarter 2006-2016
(2) NPL include both Thai banks’ and foreign banks’ gross NPL outstanding as of the 2nd quarter 2006-2016
Thailand’s total loans in Q2/2016 hit 13.8 trillion Baht, increasing 1.6% QoQ or 5.0% YoY. NPL proportion was 2.7% of total loan and NPL outstanding raised 4.6% QoQ or 19.9% YoY.
Overall, the growth of Thailand’s total loan outstanding is likely to accelerate from 3% in 2015 to 6% in 2016. Both corporate and SME loan growth will be driven by public infrastructure investment, which also stimulates private investment. Likewise, overall consumer loan segment will continue to its growth momentum around 6-7% thanks to consumption demands and marketing campaigns. NPL proportion in 2016 is forecasted at 2.8 - 3.0% compared to 2.6% in 2015 as a result of adverse economic conditions. Financial technology (FinTech) in several formats is expected to disrupt Thailand’s

Quarterly Economic Report : Q3 | 2016 49
Selected Financial StatisticsCommercial Bank Loan 2006 – Q1/2016
Consumption Loan 2006 – Q1/2016
Sources: BOT (the latest data as of 2016) & DTTJ EstimatesNote: * Data have been revised by Bank of Thailand.
Thailand’s total loan in 2016 is projected to grow 6% YoY.
Number or latoT
Thai Commercial Bank 15
Foreign Bank Subsidiary & Branch 15
Specialized Financial Institution 8
Foreign Representative 46
Asset Management Company (AMC) 43
Credit Card Company 10
Personal Loan Company 35
Nano Finance Company 21
Credit Card 22.6 M
Debit Card 48.3 M
ATM Card 12.0 M
Personal Loan Account* 13.4 M
E-Money Card/Account* 35.3 M
Internet Banking Account* 10.5 M
Mobile Banking Account* 12.9 M
2.7 2.8 2.9 2.6 2.9 3.3 3.6 4.2 4.4 4.7 4.7
1.2
1.2
1.4
2.0
1.6
3.0
1.7
3.4
2.1
3.8
2.4
4.1
2.9
4.7
3.3
4.9 4.9 4.8 5.2
3.5 3.7 3.8
0.0 2.0 4.0 6.0 8.0
10.0 12.0 14.0 16.0
2006
2007
2008
2009
2010
2011
2012
2013
2014
2015
Q2/
2016
Corporate Loan SME Loan Consumer Loan
CAGR 10.3%CAGR 12.0%
CAGR15.7%
CAGR 5.7%
Trillion Baht
0.3 0.7 0.8 0.9 1.0 1.1 1.2 1.3 1.5 1.7 1.9 1.90.3 0.4 0.4 0.5 0.6 0.8 0.9 0.9 1.0 1.0
0.2 0.3 0.4 0.4 0.5 0.6 0.8
0.9 0.9 0.9 0.9
0.0
1.0
2.0
3.0
4.0
2006
2007
2008
2009
2010
2011
2012
2013
2014
2015
Q2/
2016
Hire Purchase Other Loan Housing Loan
CAGR15.3%
CAGR12.2%
CAGR10.8%
CAGR 11.9%
Trillion Baht

Quarterly Economic Report : Q3 | 201650
Total loan outstanding in Q2/2016 was 13.8 trillion Baht. Corporate, SME and Consumer loan proportion were 38%, 35% and 27% respectively.
Consumer 28%
SME 34%
Corpor ate 38%
Loan proportion in Q2/2016
Loan growth comparisons (Unit: Trillion Baht)
Q2/2015 Q1/2016 Q2/2016 %YoY
%QoQ
Corporate 4.91 5.13 5.23 6.6% 2.0%
SME 4.62 4.68 4.74 2.6% 1.4%
Consumer 3.57 3.73 3.78 6.0% 1.5%
Total 13.09 13.53 13.75 5.0% 1.6%
Source: Bank of Thailand (as of August 2016)

Quarterly Economic Report : Q3 | 2016 51
Food production volume was at 31.0 million tons dropped 1.2% from 2014, while export value grew 927.4 billion Baht or improved 1.5%YoY due to raising demand from key export markets. For key beverages, total production was contracted by 0.6%YoY mainly due to a slowdown of domestic demand.
Food and beverage production growth are projected at 3% and 2%YoY respectively. Major growth drivers include higher public and private consumption as well as favourable trade conditions for Thai food and beverage products. However, lower purchasing power of Thailand’s household sector as a result of lower commodity prices and severe drought to some extent
A positive outlook for food production and export is anticipated in the coming years as a result of demand recovery and the removal of trade barriers in the key export markets, especially the AEC market. For the beverage segment, long-term growth momentum is expectedfor both alcohol and non-alcohol segment due to the rebound of domestic demands over the coming years.
Situation in 2015 Forecast 2016 Long-term trend
Sources: OIE & MOC
Food & BeverageIn 2016, both production and consumption of food and beverage are expected to rebound driven partly by the removal of trade barriers and higher demands for Thai foods in overseas markets.

Quarterly Economic Report : Q3 | 201652
Food
Food Production Volume* Domestic Sales Volume*
Sources: BOT, OIE, & DTTJ Analysis (Data as of June 2016)onomics startin from 2013.
7.7 8.2 8.3
16.2 16.1 15.7
32.0
2.0 2.2 2.1 1.5 1.6 1.7 1.7 1.7 1.7
0.0
5.0
10.0
15.0
20.0
25.0
30.0
35.0
2013 2014 2015 2016F
Sugar
Other
Grains
Dairy
Veg. oil
Fruit & Veg.
Fishery
Million Tons
6.2 6.5 6.5
8.0 7.4 7.9
1.0 1.1 1.01.4 1.4 1.41.1 1.1 1.0
0.0
5.0
10.0
15.0
20.0
2013 2014 2015 2016F
Sugar
Other
Grains
Dairy
Veg. oil
Fruit & Veg.
Fishery
Million Tons
18.7
The situation of Thailand’s food industry in 2016 is expected to moderately improve from 2015s’ amid domestic and global unfavourable factors.
In 2015, food production volume was contracted by 1.2% YoY due to several adverse
production volume was shrunk by 7.3% YoY. Total production volume for 2016 is forecasted at 32.0 million tons growing 2.5%YoY.
In 2015, domestic food sales reached 18.3
2016, food sales volume was dropped by 1.9% YoY. However, total sales volume for 2016 is forecasted at 18.7 million tons or grow by 2% compared to 2015s’.

Quarterly Economic Report : Q3 | 2016 53
Thailand’s Food Trading
In 2016, several key drivers are likely to underpin Thailand’s food export position amid existing unfavourable factors.
0
100
200
300
400
500
600
700
800
900
1,000
2011 2012 2013 2014 2015 2016F
Export Import Billion Baht
895
269 324 333 341 363 374
886 823
925 914927
food export and import was 469 billion Baht growing 6.8% YoY and food import reached 192 billion Baht or raising 5.6% YoY.
For 2016, a moderate rebound of Thailand’s food export around 2.0% is expected due to solid demands in major
scheme by Thai government. Similarly, Thailand’s food import is forecasted to grow 3% compared to 2015 in line with Thailand GDP growth forecast.
In addition, Thailand’s key players in food industry are proactive to expand their footprints in overseas markets. Recently, Thai Union Group, the world largest tuna producer, continues to acquire more sea food players (e.g. Les Pecheries de Chez Nous, Red Lobster Master) to strengthen its leadership position in the global integrated seafood industry.

Quarterly Economic Report : Q3 | 201654
Key Beverage Production Volume
1.7
2.1 2.0 2.1 1.9 6.6
2.0 2.3 2.3 2.2 2.4
1.3
1.5 1.5 1.7 1.7 0.5
0.6 0.6 0.5 0.5
0.0
1.0
2.0
3.0
4.0
5.0
6.0
7.0
2011 2012 2013 2014 2015 2016F
Beer Carbonated Drink Water Soda
CAGR 2011 – 2016F = 3.3% Billion Litres
Beverage
Thailand’s beverage production in 2016 is projected to grow around 2% compared to 2015s’ underpinned by both private and public consumption.
In 2015, total key beverage output volume was 6.5 billion litres contracted 0.6%YoY thanks to sluggish domestic consumption.
Competition among major beer producers continues to intensify. The local Boonrawd Brewery is expected to maintain its leadership in sales by volume. Likewise, ThaiBev, a leading producer of beer and spirit, continues to perform well and aggressively expands its business towards ASEAN market.
volume of four key beverages was around 3.4 billion litres or grew 1.2%YoY. Among them, water and beer production volume increased 12.5% and 6.4% respectively, while soda and carbonated drink volume were shrunk by 10.6% and 9.4% respectively.
Growth of the beer market is likely to be modest in the coming years due to slowdown domestic consumption and market saturation.
Quarterly Economic Report : Q3 | 2016 55
Electricity consumption grew by 3.4%YoY despite the presence of domestic economic slowdown. The country’s gross energy generation and purchase was shifted from 172.0 billion kilowatt-hours (kWh) in 2014 to 177.8 billion kWh in 2015.
Demand for electric power is likely to maintain its growth momentum as a result of the expansion of both public and private investment as well as the bourgeoning of
2016, total electricity consumption was 92.1 billion kilo-watt hour or raising 5.0% compared to 2015s’. For 2016, the total net energy consumption, then, is expected to grow approximately 4.0% from 2015.
Thailand’s electricity consumption is forecasted to rise by an average of 3.0% in the coming years in response to Thailand’s real GDP growth projection. Natural gas will remain the dominant fuel for power. Nevertheless, the approved Thailand’s new Power Development Plan 2015 (PDP2015) will ensure that various sources of power such as renewable energy, clean coal and nuclear power will be used to secure Thailand’s power supply from the rising demand in the future.
Situation in 2015 Forecast 2016 Long-term trend
Sources: BOT, Plus Property, & SCB EIC
Energy: ElectricityAn expansion of domestic economic activities sustains the growth momentum of the demand for electricity during 2016. Natural gas remains the major source of electricity generation in the coming years. Alternative sources such as renewable energy, coal, and nuclear power will help secure Thailand’s power supply from the rising demand in the future as planned in PDP2015

Quarterly Economic Report : Q3 | 201656
Private power plans reach 60% of total electricity capacity in July 2016 and combined cycle remains the major electricity generating mode.
Total Electricity Generating Capacity: 41,097 MW
Sources: EGAT & Electricity Generating Company WebsitesNote: (1) Thai government has privatized electricity generating industry
(2) data as of July 2016 (3) MW = megawatt. 1 MW = 1 million watts
EGAT's Power Plants 39.8%
Private Power Plants 60.2%
EGAT’s Capacity
Thermal 8.9%
Combined Cycle 22.4%
Hydropower 8.5%
Diesel 0.07%
Renewable Energy 0.10%
Private Capacity Thermal 21.1%
Combined Cycle 29.5%
Hydropower 5.1%
Renewable Energy 3.3%
Thailand-Malaysia HVDC 0.7%
IPP 36.4%
SPP 14.3%
Neighboring Countries 9.4%
Types of Producers

Quarterly Economic Report : Q3 | 2016 57
Comparisons of electricity generating capacity July 2015 vs. July 2016.
Thailand’s Electricity Generating Capacity (July 2015 vs 2016)
EGAT vs Private Capacity (July 2015)
EGAT vs Private Capacity (July 2016)Types of Private Capacity (July 2015 vs 2016)
Sources: EGAT & Electricity Generating Company WebsitesNote: MW = megawatt. 1 MW = 1 million watts
0.0
10.0
20.0
Jul-15 Jul-16
EGAT Private
Thousand MW
(42.8%) (39.8%) (57.2%)
(60.2%)
0.0
5.0
10.0
15.0
Thermal Combined Cycle
Hydro Renewable Others
EGAT Private
Thousand MW
15.53.6 3.5 2.1 0.3 0.34.4
8.4
13.6
20.7 16.424.7
0.0
5.0
10.0
15.0
Thermal Combined Cycle
Hydro Renewable Others
EGAT Private
Thousand MW
0.0
10.0
Jul-15 Jul-16
IPP SPP Neighbor
Thousand MW
14.0
3.6 3.5 2.1
8.9 9.212.1
1.3 0.3
14.9
3.8 3.95.92.9

Quarterly Economic Report : Q3 | 201658
Thailand Electricity Consumption
Billion kw hour CAGR 2010 – 2016F = 3.0%
60.5
33.2 32.8 36.5 37.7 39.0 41.3
184.9
61.1 66.9 67.9 69.3 70.4
15.6 15.5 17.1 18.4 18.8 19.8 23.8 23.2 24.9 27.2 27.9 28.9
4.8 4.8 5.4 5.6 5.6 6.0
16.9 16.0 16.8 11.4 11.4 11.5
0.0
50.0
100.0
150.0
200.0
2010 2011 2012 2013 2014 2015 2016F
Household Large-Scale Business
Smal-Scale Business Medium-Scale Business
Special Business Others
consumption was 92.1 billion kilo-watt
Fossil fuels remain the main source for power generation despite the promotion of renewable energy utilization in the coming years. Its share of the total is forecasted at around 70% from 2015 – 2020.
For 2016, the rate of electricity consumption is expected to rise approximately 4.0% YoY in line with real GDP growth prediction.
Large-scale business is the largest electricity user, followed by household sector (accounted for 40% and 23% of total electricity consumption respectively)..
The majority of electricity consumption in Thailand stems from both large-scale business and household sector with an average long-term growth rate of 3.0%.

Quarterly Economic Report : Q3 | 2016 59
After the NBTC has deactivated the unregistered-SIMs, the total number of registered mobile connections at the 2015 year end were 83.0 million or declined 13.3%YoY. Of these, 68.7 million users or 82.7% are on pre-paid plans. The number of post-paid plans, by contrast, reached 14.3 million users or grow 11.4% compared to 2014s’. Likewise, the penetration rate dropped to 123.5% at the end of 2015. TRUE and AIS have secured NBTC’s new licenses while DTAC has strategized to deploy its existing 850- 1,800- and 2,100-MHz spectrum in the most
Competition among major mobile operators concentrates on 4G services. A considerable investment in infrastructure and network is expected with regard to NBTC’s license conditions. There will be marginal changes of market share (e.g. subscribers, revenue) among major
campaigns and network coverage.
Future government policy on ICT will be in favour of all mobile operators as the interim government has committed to promote the Digital Economy in its agenda. A variety of newly integrated services
and alliances between mobile operators and business counter parties including banks, non-banks, retailers, and so on will play essential roles in driving the growth of telecommunication industry.
Situation in 2015 Forecast 2016 Long-term trend
Sources: EIU, NBTC, & Ministry of Information and Communication Technology (MICT)
Telecommunications
Major mobile operators have made their strategic moves on 4G services and expand their network coverage to take advantages from their investments, but also to meet NBTC’s requirements.

Quarterly Economic Report : Q3 | 201660
115% 126%
141% 144% 126% 130%
136% 142% 146% 149%
0
5
1
1
2
0
20
40
60
80
100
120
1102
2102
3102
4102
5102
F6102
F7102
F8102
F9102
F0202
Subcriptions Penetration Rate
Million Subscriptions
(CAGR 3.8%) (CAGR 2.9%)
7790 94
9785 88 92 96 99
107
24% 27% 29% 35%
41% 47%
54% 60%
66% 73%
0%1020304050
60%
7080
0
10
20
30
40
50
60
2011
2012
2013
2014
2015
2016
F
2017
F
2018
F
2019
F
2020
F
Internet User Penetration Rate
Million Subscriptions
(CAGR 13.4%) (CAGR 13.2%)
16 18 19 23 27 32 36 41 45 49
%
0%
00%
50%
00%
6% 7% 8% 9% 10%
12% 14%
17% 20%
23%
0%
5%
10
15
20
25
0 2 4 6 8
10 12 14 16 18
2010
2011
2012
2013
2014
2015
F
2016
F
2017
F
2018
F
2019
F
Subcriptions Penetration Rate
Million Subscriptions
( ) ( )
(CAGR 16.6%) (CAGR 16.3%)
4 5 5 6 7 8 10 11 13 15
Sources: EIU, NBTC, & Ministry of Information and Communication Technology (MICT)
Internet Trend
Mobile Trend
Broadband Trend
Mobile business gradually recover from 2016 onwards after a bulk of pre-paid sim cards were deactivated. Internet and broadband services continue their long-term growth momentum.
According to NBTC’s statistics, during the
penetration grew by 1% and 3% respectively.
Digital Economy Agenda by Thai Government will drive Internet and broadband service demands across various sectors in the coming years. Aggressive marketing campaigns for broadband services are under way and competition to extend

Quarterly Economic Report : Q3 | 2016 61
Sources: EIU, Companies’ Annual Reports and Websites, & NBTCNote: revenue from mobile services only (excl. Interconnection Charge).
Intense competition among three major mobile operators continues with innovative services and marketing campaigns to boost advantages.
Pre-paid Market Share 2015(Total users: 68.7 million)
Post-paid Share 2015(Total users: 18.7 million)
AIS 47%
DTAC 30%
TRUE 20%
CAT 2%
TOT 1%
AIS 39%
DTAC 29%
TRUE 31%
1% 0.3% CAT TOT
Resulting from two auctions during the fourth quarter of 2015, AIS and True won 4G spectrum in the 900-mhz and 1,800-mhz bands and have rolled out 4G
Smartphone penetration has been surged by the overwhelming popularity of LINE application for smartphones and tablets, which features person-to-person messaging, group chats, free one-to-one Voice over Internet Protocol (VoIP) phone calls and social-media services.
Most urban areas across Thailand gain
Internet services as it is a condition of operators’ licences to extend coverage to 80% of the country by end-2016.

Quarterly Economic Report : Q3 | 201662
Upcoming Report HighlightsComing next in Jan’17
Business Survey: Managing in a Slow-Growth EconomyA survey of DTTJ’s client perceptions, business decision-making and practices during a period of slowing growth.
New Thailand key industry updates Current Situation of Key Industries: Electronics, Real estate, Wholesale and Retail sales, and Tourism in Thailand

63
Deloitte refers to one or more of Deloitte Touche Tohmatsu Limited, a UK private
entities. DTTL (also referred to as “Deloitte Global”) does not provide services to clients. Please see www.deloitte.com/th/about for a more detailed description of DTTL and its
services to public and private clients spanning multiple industries. Deloitte serves four
About Deloitte Southeast Asia
PDR, Malaysia, Myanmar, Philippines, Singapore, Thailand and Vietnam – was established to deliver measurable value to the particular demands of increasingly
companies in the region.
All services are provided through the individual country practices, their subsidiaries and
About Deloitte Thailand
This communication contains general information only, and none of Deloitte Touche
network”) is, by means of this communication, rendering professional advice or services. No entity in the Deloitte network shall be responsible for any loss whatsoever sustained by any person who relies on this communication.