q2 fy22 investor presentation 26 october 2021
TRANSCRIPT

Q2 FY22 Investor Presentation26 October 2021

Presentation Path
Bajaj Finance Limited overview
Section 02
Section 03
Financial performance Q2 FY22
Section 01
Executive summary Q2 FY22
Section 04
Asset liability management
Section 05
Customer franchise and distribution reach
Section 06
Business segment wise AUM
Update on credit quality
Section 07
14
4 28 35 46
32 42
Click on the section to view 2

3
Section 01 Executive summary Q2 FY22
1.1 Quarter gone by
1.2 Lead financial indicators

Quarter gone by
A quarter of strong revival across growth, risk, debt management and financial metrics. In absence of a third wave, quite confident about second
half of the year on growth, risk and financial metrics. Business transformation go-live is behind schedule by 45 days due to delays in
certain tech deliveries and code freeze for festival season. Go-live is now planned for mid December.
4
Q2 FY22
AUM Opex to NII
38.1%
Q2 FY2127.8%
Net NPA
1.10%
Q2 FY210.37%**
PAT ROE*
3.8%
Q2 FY212.9%
₹ 1,481 Cr
YoY Growth53%
₹ 1,66,937 Cr
YoY Growth22%
*Not annualized
**Not relevant due to moratorium

5
1. At the outset, YoY numbers are not comparable due to dislocation caused by the pandemic.
2. AUM as of 30 September 2021 was at ₹ 1,66,937 crore as against ₹ 1,37,090 crore as of 30 September 2020. Core AUM growth* in Q2 FY22 was ~₹ 11,150 crore. In absence of a third wave, the Company expects quarterly AUM growth rate for balance of the year to be strong.
3. The Company booked 6.33 MM new loans in Q2 FY22.
4. Customer franchise stood at 52.80 MM as of 30 September 2021, a growth of 20% YoY. Cross sell franchise stood at 29.37 MM, a growth of 23% YoY. During the quarter, customer franchise grew by 2.35 MM. Customer franchise addition in Q2 FY22 was in line with our general guidance of 7-8 MM annually.
5. Total geographic footprint stood at 3,329 locations and 1,19,900+ distribution points. During the quarter, the Company expanded its presence in 216 new locations.
6. The Company continues to protect its margin profile across businesses. Interest income reversal for Q2 FY22 was ₹ 322 crore as against ₹ 216 crore in Q2 FY21. In absence of a third wave, the company expects quarterly interest reversals to normalise to ₹ 180-200 crore by Q3 FY22.
7. Cost of funds reduced to 6.77% in Q2 FY22 vs 7.11% in Q1 FY22. The Company raised ₹ 6,772 crore of fixed rate NCDs in 2 year and above tenor to gain from low interest rates environment. This included ₹ 2,327 crore raised under 10 year tenor. As a result,liquidity buffer was elevated at ₹ 16,842 crore as of 30 September 2021. Liquidity buffer will normalize to pre-COVID levels by Q4 FY22.
Lead financial indicators
*Core AUM growth = (AUM growth for the quarter short tenor IPO financing book + additional losses on account of COVID)
6
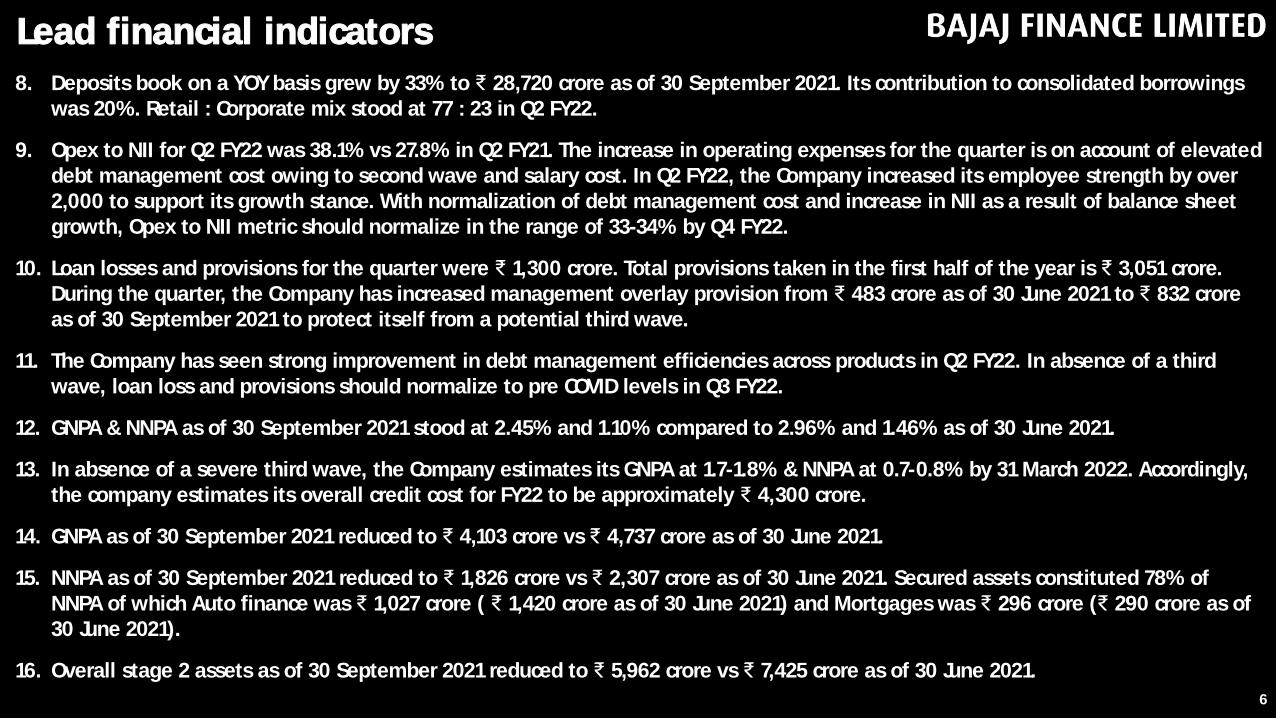
8. Deposits book on a YOY basis grew by 33% to ₹ 28,720 crore as of 30 September 2021. Its contribution to consolidated borrowings was 20%. Retail : Corporate mix stood at 77 : 23 in Q2 FY22.
9. Opex to NII for Q2 FY22 was 38.1% vs 27.8% in Q2 FY21. The increase in operating expenses for the quarter is on account of elevated debt management cost owing to second wave and salary cost. In Q2 FY22, the Company increased its employee strength by over 2,000 to support its growth stance. With normalization of debt management cost and increase in NII as a result of balance sheet growth, Opex to NII metric should normalize in the range of 33-34% by Q4 FY22.
10. Loan losses and provisions for the quarter were ₹ 1,300 crore. Total provisions taken in the first half of the year is ₹ 3,051 crore. During the quarter, the Company has increased management overlay provision from ₹ 483 crore as of 30 June 2021 to ₹ 832 crore as of 30 September 2021 to protect itself from a potential third wave.
11. The Company has seen strong improvement in debt management efficiencies across products in Q2 FY22. In absence of a third wave, loan loss and provisions should normalize to pre COVID levels in Q3 FY22.
12. GNPA & NNPA as of 30 September 2021 stood at 2.45% and 1.10% compared to 2.96% and 1.46% as of 30 June 2021.
13. In absence of a severe third wave, the Company estimates its GNPA at 1.7-1.8% & NNPA at 0.7-0.8% by 31 March 2022. Accordingly, the company estimates its overall credit cost for FY22 to be approximately ₹ 4,300 crore.
14. GNPA as of 30 September 2021 reduced to ₹ 4,103 crore vs ₹ 4,737 crore as of 30 June 2021.
15. NNPA as of 30 September 2021 reduced to ₹ 1,826 crore vs ₹ 2,307 crore as of 30 June 2021. Secured assets constituted 78% of NNPA of which Auto finance was ₹ 1,027 crore ( ₹ 1,420 crore as of 30 June 2021) and Mortgages was ₹ 296 crore (₹ 290 crore as of 30 June 2021).
16. Overall stage 2 assets as of 30 September 2021 reduced to ₹ 5,962 crore vs ₹ 7,425 crore as of 30 June 2021.
Lead financial indicators

7
17. Non overdue one-time restructuring (OTR) book as of 30 September 2021 increased to ₹ 1,512 crore vs ₹ 1,287 crore as of 30 June 2021. In Q2 FY22 the Company offered OTR of ₹ 426 crore under OTR 2.0 framework. The Company has considered OTR as an indicator of significant increase in credit risk (SICR) and as a matter of prudence classified it as Stage 2. The Company holds ECL provision of ₹ 289 crore (19.1%) against this book.
18. Other stage 2 assets as of 30 September 2021 reduced to ₹ 4,451 crore vs ₹ 6,137 crore as of 30 June 2021. The Company holds ECL provision of ₹ 1,030 crore (23.1%). Secured non OTR stage 2 assets was ₹ 2,556 crore (57%) and unsecured was ₹ 1,894 crore (43%).
19. Consolidated post tax profit for Q2 FY22 was ₹ 1,481 crore compared to ₹ 965 crore in Q2 FY21, a growth of 53%.
20. Capital adequacy remained very strong at 27.68% as of 30 September 2021. Tier-1 capital was 24.90%.
21. BHFL AUM grew by 33% to ₹ 44,429 crore as of 30 September 2021.
22. BHFL launched its affordable housing business in Q2 FY22.
23. Capital adequacy of BHFL was 20.26% as of 30 September 2021.
24. BHFL delivered post tax profit of ₹ 166 crore in Q2 FY22 compared to ₹ 83 crore in Q2 FY21, a growth of 100%.
25. BFSL acquired 109K customers in Q2 FY22. Its Retail and HNI customer franchise stood at 204K as of 30 September 2021.
26. BFSL delivered post tax profit of ₹ 3 crore in Q2 FY22.
Lead financial indicators
Omnipresence strategy July AGM announcement
8
Omnipresent financial services Company. The Omnipresencestrategy will enable our existing and new customers to
engage, transact and be serviced online to offline and vice

Omnipresence strategy updateGeography
1. Total geographic footprint stood at 3,329 locations and 1,19,900+ distribution points. During the quarter, the Company expanded its presence by 216 new locations. The company is growing its geographic footprint in north and east as GDP contribution of North and East vs its portfolio contribution is lower. This will result in reducing concentration risk and create new growth opportunities.
9
Omnichannel
1. The Company digitally acquired 372 K new EMI card customers in Q2 FY22 using a integrated digital ecosystem. This offering will be fully integrated into the new consumer app upgrade as it goes live.
2. The EMI store strategy is beginning to yield good momentum. The EMI Store visits increased from 10.2 MM in Q4 FY21 to 29.7 MM inQ2 FY22. This has resulted in 248 K new loans in Q2 FY22. The total SKUs were 30,135 and merchants were 25,031 as of 30 September 2021. This offering is already integrated with the existing consumer app.
3. The point of sale transformation has started delivering good volume momentum for personal loan and credit card distribution business. It is an integrated offline to online framework covering communication, call centre and fulfilment. The consumer app upgrade in mid December will make the process even more seamless and will lead to stronger volume momentum. In Q2 FY22 it delivered ₹ 392 crore in personal loans and 26,989 cards in credit card distribution business.
4. Customer data platform (CDP), key to omnichannel experience has gone live in Q2 FY22. CDP enables multi-channel orchestration, customer communication, call governance with a integrated multi-dialer, multi-lingual architecture. The Company has also migrated from a centralized Pune based call centre infrastructure to 8 regional call centres to deliver multi-lingual sales and service support to its customers.

Omnipresence strategy update
Payments
1. The Company has 3.1 MM customers on its wallet as of 24 October 2021. For festival season, the Company has integrated the walletfeature for seamless fulfilment. It should significantly improve wallet engagement, stickiness and cashback/reimbursement process.
2. Merchant app is on track to go live by February 2022. It will enable P2P and P2M onboarding, transactions, promotions, rewards and settlements.
3. Post receiving Board approval to apply for Payment Aggregator (PA) & Bharat Bill Pay Operating Unit (BBPOU), the Company has initiated various approvals.
4. The Company is in the process of significantly expanding payment talent pool.
10
Consumer app upgrade
1. The current consumer app has 12.9 MM active customers as of 30 September 2021.
2. The upgrade of our new consumer app is delayed by 45 days on account of delays in certain tech deliveries and code freeze for festival season.
3. As part of our sprint release strategy, sprint 1 which covers all customer service menus, payments, EMI store, 20 engagement apps and a robust search functionality has gone live on play store for 10% of customers. Due to festival code freeze, we are now not increasing coverage till 15 November 2021. The sprint 2 which covers end to end business journeys, insurance and mutual fund marketplace will get deployed for all customers by 15 December 2021.

Omnipresence strategy update
11
Productivity apps
1. The new Debt management services app has gone live for ~9 K employees and ~34 K+ agency resources. The app enables agency staff onboarding, cash receipting, training, communication, compliance features, dialer integration and call recording. The app also enables agency staff to help customers with a host of service-related queries. The Company issued 13.5 MM receipts in Q2 FY22.
2. Sales one App has started to go live in phases. The Company expects to complete roll out by January 2022. Apart from its corefeatures of sales dashboards, reporting, engagement, sales visits and dialer integration, the app integrates online channels with offline fulfilment. The app also enables sales staff to help customers with a host of service-related queries.

Lead Financial Indicators Subsidiary companies
Bajaj Housing Finance Limited (BHFL)
1. ₹ 44,429 crore as of 30 September 2021 from ₹ 33,463 crore as of 30 September 2020.
2. ₹ 396 crore from ₹ 248 crore in Q2 FY21.
3. opex to NII stood at 27.8% in Q2 FY22 as against 28.2% in Q2 FY21.
4. loan losses and provisions for Q2 FY22 was ₹ 61 crore as against ₹ 65 crore in Q2 FY21. It has management overlay provision of ₹ 166 crore as of 30 September 2021.
5. GNPA & NNPA as of 30 September 2021 stood at 0.35% and 0.21% respectively compared to 0.28% and 0.18% as of 30 June 2021.
6. profit after tax increased 100% to ₹ 166 crore in Q2 FY22 against ₹ 83 crore in Q2 FY21.
7.
8. BHFL launched its affordable housing business in Q2 FY22.
Bajaj Financial Securities Limited (BFSL)
8. BFSL acquired 109K customers in Q2 FY22. Its Retail and HNI customer franchise stood at 204K as of 30 September 2021.
9. ₹ 32 Crore in Q2 FY22 against ₹ 8 Crore in Q2 FY21.
10. BFSL registered a net profit of ₹ 3 Crore in Q2 FY22 against ₹ 2 Cr in Q2 FY21.12

Bajaj Finance Limited overview
13
Section 02
2.1
2.2
2.5
Bajaj group structure
What do we stand for
2.6
2.7
14-years financial snapshot
Product suite
Key strategic differentiators
2.3Our general long-term guidance on Financial metrics shareholder profile
2.4
Our shareholder profile
Executive summary 2.8

Bajaj Finserv Limited
(Listed)
Financial services arm
Bajaj group structure
39.16%
Bajaj Holdings & Investment Limited (BHIL)
(Listed)
Above shareholding is as of 30 September 2021
21
Bajaj Allianz Life Insurance Company Ltd
Protection and retiral
74%
Bajaj Finance Limited
(Listed)
Lending business arm
52.65% 3
Bajaj Housing Finance Limited
Mortgage Lending
Bajaj Financial Securities Limited
Broking & Depositary
Bajaj Allianz General Insurance Company Ltd
Protection
74%
100%100%
1. 60.80% holding through promoter holding company and promoter group
2. 53.70% holding through promoter holding company and promoter group
3. 56.02% holding through promoter holding company and promoter group
14
Bajaj Auto Limited
(Listed)
Auto business arm
33.43%

What do we stand for
15
a sustainable ROA of 4-4.5% and ROE of 19-21% in the long term
-

16
Our general long-term guidance on financial metrics
AUM growth in corridor of
25%-27%
Profit growth in corridor of
23%-24%
GNPA in corridor of
1.4%-1.7%
NNPA in corridor of 0.4%-0.7%
Return on assets in corridor of
4%-4.5%
Return on equityin corridor of
19%-21%
Key strategic differentiators
17
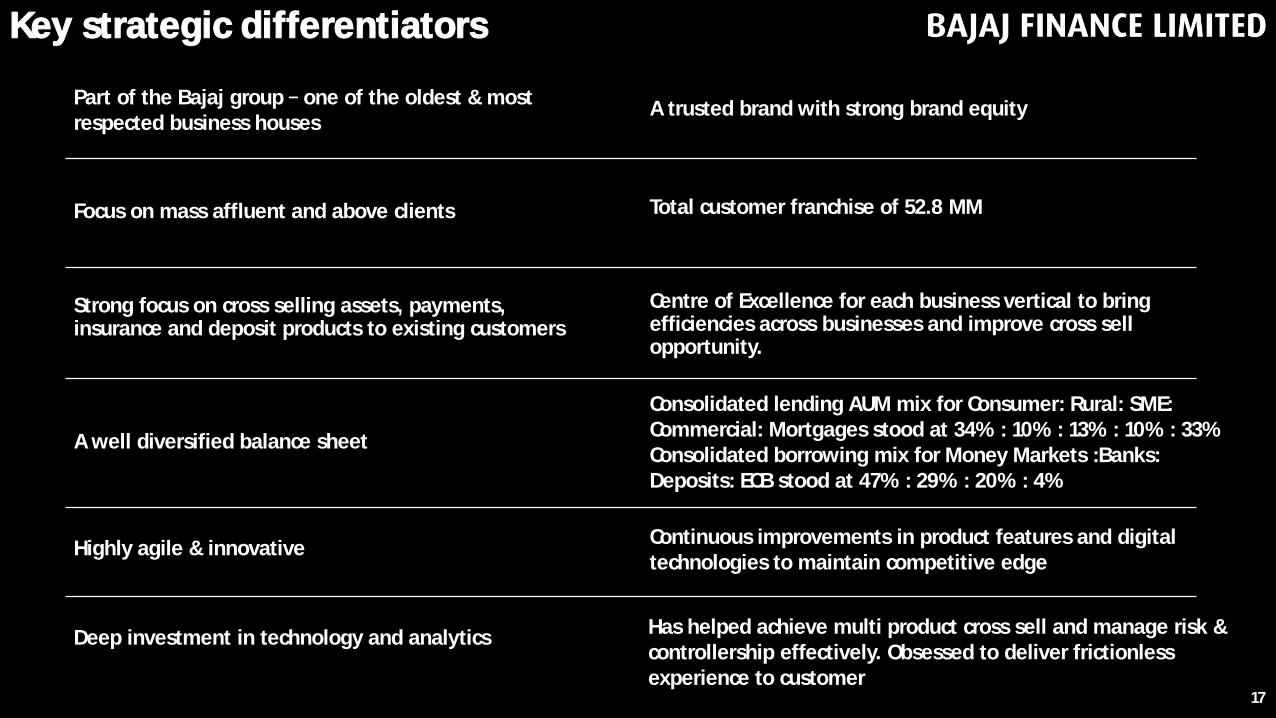
A trusted brand with strong brand equity
Total customer franchise of 52.8 MM
Centre of Excellence for each business vertical to bring efficiencies across businesses and improve cross sell opportunity.
Continuous improvements in product features and digital technologies to maintain competitive edge
Has helped achieve multi product cross sell and manage risk & controllership effectively. Obsessed to deliver frictionless experience to customer
Deep investment in technology and analytics
Highly agile & innovative
A well diversified balance sheet
Strong focus on cross selling assets, payments, insurance and deposit products to existing customers
Focus on mass affluent and above clients
Part of the Bajaj group one of the oldest & most respected business houses
Consolidated lending AUM mix for Consumer: Rural: SME: Commercial: Mortgages stood at 34% : 10% : 13% : 10% : 33% Consolidated borrowing mix for Money Markets :Banks: Deposits: ECB stood at 47% : 29% : 20% : 4%

18
Our shareholder profileTop 20 investors & their holdings
S.No Name of ShareholderAs on 30 Sept 21
As on 30 Jun 21
As on 30 Sept 20
1 BAJAJ FINSERV LTD 52.65% 52.65% 52.74%
2 GOVERNMENT OF SINGAPORE 3.31% 4.09% 4.20%
3 MAHARASHTRA SCOOTERS LIMITED 3.14% 3.14% 3.15%
4 NEW HORIZON OPPORTUNITIES MASTER FUND 0.77% 0.77% 0.77%
5AXIS MUTUAL FUND TRUSTEE LIMITED A/C AXIS MUTUAL FUND A/C AXIS LONG TERM EQUITY FUND
0.76% 0.79% 0.93%
6AXIS MUTUAL FUND TRUSTEE LIMITED A/C AXIS MUTUAL FUND A/C AXIS BLUECHIP FUND
0.72% 0.67% 0.64%
7 SBI-ETF NIFTY 50 0.69% 0.66% 0.68%
8 NEW WORLD FUND INC 0.58% 0.56% 0.56%
9VANGUARD EMERGING MARKETS STOCK INDEX FUND, A SERIES OF VANGUARD INTERNATIONAL EQUITY INDEX FUNDS
0.53% 0.52% 0.43%
10 WF ASIAN SMALLER COMPANIES FUND LIMITED 0.51% 0.51% 0.33%
11 VANGUARD TOTAL INTERNATIONAL STOCK INDEX FUND 0.50% 0.48% 0.53%
12 BARON EMERGING MARKETS FUND 0.48% 0.40% 0.23%
13AXIS MUTUAL FUND TRUSTEE LIMITED A/C AXIS MUTUAL FUND A/C AXIS FOCUSED 25 FUND
0.44% 0.47% 0.46%
14ST. JAMES'S PLACE EMERGING MARKETS EQUITY UNIT TRUST MANAGED BY WASATCH ADVISORS INC
0.43% 0.46% 0.46%
15 SBI LIFE INSURANCE CO. LTD 0.43% 0.41% 0.39%
16 SBI-ETF SENSEX 0.40% 0.36% 0.32%
17 ISHARES CORE EMERGING MARKETS MAURITIUS CO 0.39% 0.39% 0.22%
18 PEOPLE'S BANK OF CHINA 0.39% 0.40% 0.31%
19TOUCHSTONE STRATEGIC TRUST - TOUCHSTONE SANDS CAPITAL EMERGING MARKETS GROWTH FUND
0.39% 0.37% 0.24%
20 DF INTERNATIONAL PARTNERS 0.38% 0.38% 0.38%
Above shareholding is as of 30 September 2021
3.77%
Promoters & Promoter Group
56.03%
0.40%
Others
FII & FPI
23.64%
MF
9.10%
Resident & non residentindividuals
Corporates
Shareholding profile
3.62%
MF
7.19%

19
14-years financial snapshot
@ All figures till including FY17 are as per previous GAAP, whereas for FY18 onwards are as per IndAS
* As per the RBI regulations, NNPA numbers for upto FY15 are at 6 months overdue, FY16 are at 5 months overdue, FY17 are at 4 months overdue and FY18 onwards are at 3 months overdue. Hence NPA across periods are not comparable.
*^
Financials snapshot @ FY08 FY09 FY10 FY11 FY12 FY13 FY14 FY15 FY16 FY17 FY18@
(Consol.)
FY19@
(Consol.)
FY20@
(Consol.)
FY21@
(Consol.)
CAGR(14 yrs)
Assets under Management
2,478 2,539 4,032 7,573 13,107 17,517 24,061 32,410 44,229 60,196 82,422 1,15,888 1,47,153 152,947 37%
Income from operations 503 599 916 1,406 2,172 3,110 4,073 5,418 7,333 9,989 12,757 18,500 26,386 26,683 36%
Interest expenses 170 164 201 371 746 1,206 1,573 2,248 2,927 3,803 4,614 6,623 9,473 9,414 36%
Net Interest Income (NII)
332 435 715 1,035 1,426 1,904 2,500 3,170 4,406 6,186 8,143 11,877 16,913 17,269 36%
Operating Expenses 193 220 320 460 670 850 1,151 1,428 1,898 2,564 3,270 4,197 5,662 5,308 29%
Loan Losses & Provision (ECL)
109 164 261 205 154 182 258 385 543 804 1,030 1,501 3,929 5,969 36%
Profit before tax 30 51 134 370 602 872 1,091 1,357 1,965 2,818 3,843 6,179 7,322 5,992 50%
Profit after tax 21 34 89 247 406 591 719 898 1,279 1,837 2,496 3,995 5,264 4,420 51%
Ratios FY08 FY09 FY10 FY11 FY12 FY13 FY14 FY15 FY16 FY17 FY18 FY19 FY20 FY21
Opex to NII 58.1% 50.6% 44.8% 44.4% 47.0% 44.6% 46.0% 45.0% 43.1% 41.4% 40.2% 35.3% 33.5% 30.7%
Return on assets 0.7% 1.4% 2.8% 4.4% 4.2% 4.1% 3.6% 3.3% 3.5% 3.7% 3.7% 4.2% 4.1% 3.1%
Return on equity 2.0% 3.2% 8% 19.7% 24.0% 21.9% 19.5% 20.4% 20.9% 21.6% 20.1% 22.5% 20.2% 12.8%
Net NPA * 7% 5.50% 2.20% 0.80% 0.12% 0.19% 0.28% 0.45% 0.28% 0.44% 0.43% 0.63% 0.65% 0.75%
NPA provisioning coverage 30% 32% 55% 79% 89% 83% 76% 71% 77% 74% 70% 60% 60% 58%
₹ in crore

1. Consumer Durable Loans
2. Digital Product Loans (E)
3. Lifestyle Product Loans
4. Lifecare financing
5. EMI Cards
6. Retail Spend Financing
7. 2-Wheeler & 3-Wheeler Loans
8. Personal Loan Cross-Sell
9. Salaried Personal Loans (E)
10. E-Commerce - Consumer Finance
11. Retailer Finance
12. Health EMI Card
Consumer
1. Unsecured Working Capital Loans (E)
2. Loans to self employed and Professionals (E)
3. Secured Enterprise Loans
4. Used-car financing
5. Medical equipment financing
SME
1. Loan against securities
2. IPO financing
3. ESOP financing
4. Vendor financing to auto component manufacturers
5. Financial Institutions Lending
6. Light Engineering Lending
7. Specialty Chemicals Lending
1. Consumer Durable Loans
2. Digital Product Loans
3. Lifestyle Product Loans
4. Personal Loans Cross Sell
5. Salaried Personal Loans
6. Gold Loans
7. Loans to Professionals
1. Retail Term Deposits
2. Corporate Term Deposits
3. Systematic Deposit Plan
20
Product suite
Commercial Rural DepositsPartnerships &
Services
1. Salaried Home Loans (E)
2. Salaried Loan Against Property
3. Affordable housing finance
BAJAJ FINANCE LIMITED
BAJAJ HOUSING FINANCE LIMITED
1. Loan Against Property
2. Self Employed Home Loans
3. Lease Rental Discounting
1. Loan Against Property
2. Home Loans
3. Secured Enterprise Loans
1. Developer Finance
2. Commercial Construction Finance
3. Corporate Lease Rental Discounting
BAJAJ FINANCIAL SECURITIES LIMITED
1. Trading Account (E)
2. Depository Services (E)
3. Margin Trading Financing (E)
4. HNI Broking (E) Also available through digital channels
5. Retail Broking (E)
6. IPOs and OFS
7. Mutual Funds (E)
8. Distribution of PMS
1. PPI2. UPI3. BBPS
Payments
New Product
1. Life Insurance Distribution
2. General Insurance Distribution
3. Health Insurance Distribution
4. Pocket Insurance (E)
5. Co-Branded Credit Card
6. Co-Branded Wallet
7. Financial Fitness Report

Executive summary Consolidated
Overview • 34-year-old non-bank with a demonstrated track record of profitable growth
• Diversified financial services company focused on Consumer, Rural, SME, Commercial, Mortgages and Payments
• Focused on mass affluent client with a strategy to cross sell
• Strong focus on deposits acceptance and fee product distribution
• Present in 3,329 locations with over 119.9K+ point of sale
• Customer franchise of 52.8 MM as of 30 September 2021
• Amongst the largest new loan acquirers in the country (6.33 MM in Q2 FY22)
• AUM mix as of 30 September 2021 - Consumer: Rural: SME: Commercial: Mortgages stood at 34% : 10% : 13% : 10% : 33%
• AUM of ₹ 1,66,937 crore as of 30 September 2021 and post tax profit of ₹ 1,481 crore in Q2 FY22
• Capital adequacy ratio (including Tier II capital) of 27.68% as of 30 September 2021. Tier I capital stood at 24.90%
Subsidiaries • 100% shareholding in Bajaj Housing Finance Limited
• 100% shareholding in Bajaj Financial Securities Limited
Treasury • Strategy is to create a balanced mix of wholesale and retail borrowings
• Borrowings of ₹ 1,45,020 crore with a mix of 47% : 29% : 20% : 4% between money markets, banks, deposits & ECB as of 30 September 2021
Credit Quality • Consolidated Gross and Net NPA as of 30 September 2021 stood at 2.45% and 1.10% respectively
• Provisioning coverage ratio as of 30 September 2021 was 55%
• Provisioning coverage on stage 1 & 2 stood at 155 bps as of 30 September 2021 versus 369 bps as of 30 September 2020
21

Executive summary Bajaj Finance Limited
Overview • Focused on Consumer, Rural, SME, Commercial and Payments businesses
• Strategic business unit organization design supported by horizontal common utility functions to drive domain expertise, scalability and operating leverage
• Focused on cross sell, customer experience and product & process innovations to create a differentiated & profitable business model
• AUM of ₹ 1,23,281 crore as of 30 September 2021
• AUM mix as of 30 September 2021 - Consumer: Rural: SME: Commercial: Mortgage stood at 45% : 13% : 18% : 14% : 10%
• Post tax profit of ₹ 1,306 crore in Q2 FY22
• Capital adequacy ratio (including Tier II capital) of 27.68% as of 30 September 2021. Tier I capital stood at 24.90%
Consumerbusiness
• Present in 1,368 locations with 86,800+ active distribution points of sale as of 30 September 2021
• Largest consumer electronics, digital products & lifestyle products lender in India
• 2-wheeler financing business disbursed 165 K accounts in the quarter (growth 5% Y0Y)
• 3-wheeler financing business disbursed 19 K accounts in the quarter (growth of 42% Y0Y)
• Amongst the largest personal loan lenders in India
Payments • EMI Card franchise stood at 25.7 MM cards in force (CIF) as of 30 September 2021
• Bajaj Finserv - RBL Bank co-branded credit card CIF stood at 2.19 MM as of 30 September 2021
• Bajaj Finserv Mobikwik app has 21.3 MM users as of 30 September 2021 who have linked their EMI card to the wallet
• Experia App has 12.9 MM active users as of 30 September 2021
Rural business • Highly diversified lender in rural markets offering 10 loan products across consumer and SME business categories
• Operates with a unique hub and spoke business model
• Present in 1,961 towns and villages with 25,600+ active distribution points of sale as of 30 September 2021 22
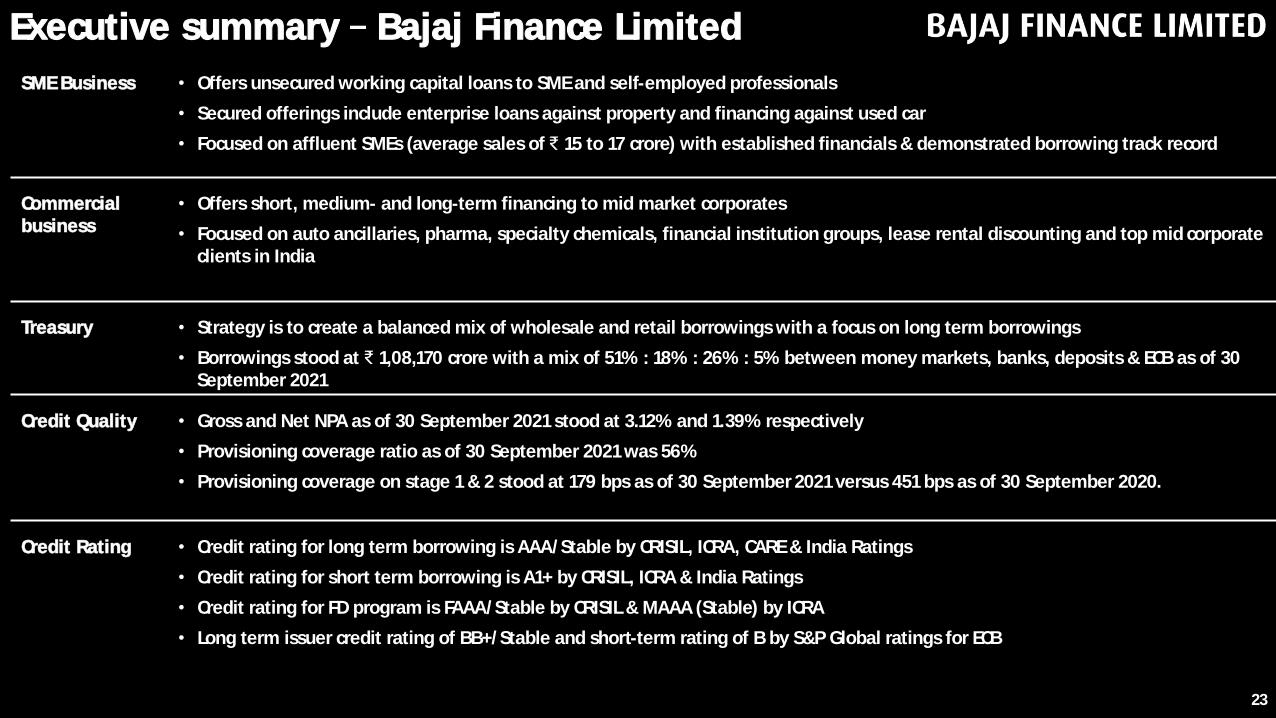
SME Business • Offers unsecured working capital loans to SME and self-employed professionals
• Secured offerings include enterprise loans against property and financing against used car
• Focused on affluent SMEs (average sales of ₹ 15 to 17 crore) with established financials & demonstrated borrowing track record
Commercialbusiness
• Offers short, medium- and long-term financing to mid market corporates
• Focused on auto ancillaries, pharma, specialty chemicals, financial institution groups, lease rental discounting and top mid corporate clients in India
Treasury • Strategy is to create a balanced mix of wholesale and retail borrowings with a focus on long term borrowings
• Borrowings stood at ₹ 1,08,170 crore with a mix of 51% : 18% : 26% : 5% between money markets, banks, deposits & ECB as of 30 September 2021
Credit Quality • Gross and Net NPA as of 30 September 2021 stood at 3.12% and 1.39% respectively
• Provisioning coverage ratio as of 30 September 2021 was 56%
• Provisioning coverage on stage 1 & 2 stood at 179 bps as of 30 September 2021 versus 451 bps as of 30 September 2020.
Credit Rating • Credit rating for long term borrowing is AAA/Stable by CRISIL, ICRA, CARE & India Ratings
• Credit rating for short term borrowing is A1+ by CRISIL, ICRA & India Ratings
• Credit rating for FD program is FAAA/Stable by CRISIL & MAAA (Stable) by ICRA
• Long term issuer credit rating of BB+/Stable and short-term rating of B by S&P Global ratings for ECB
23
Executive summary Bajaj Finance Limited

Bajaj Housing Finance Limited
• A 100% subsidiary of Bajaj Finance Limited, registered with National Housing Bank as a Housing Finance Company
• Strategic business unit organization design supported by horizontal common utility functions to drive domain expertise, scalability and operating leverage
• Offers full range of mortgage products such as home loans, loan against property and lease rental discounting to salaried & self-employed customers. It also offers construction finance and inventory finance to credit worthy developers
• Focused on mass affluent and above customers (salaried and self employed)
• AUM of ₹ 44,429 crore as of 30 September 2021. Post tax profit of ₹ 166 crore for Q2FY22
• Capital adequacy ratio (including Tier II capital) was 20.26% as of 30 Sep 2021
Home Loans • Offers home loans to salaried customers for an average ticket size of approximately 47 lakhs
• Focused on originating home loans at developer points B2B home loans business
• Focused on balance transfers to large existing franchise of BFL by creating customized solutions as well as through channel partners
• Currently present across 46 locations in India
• BHFL launched its affordable housing business in Q2 FY22.
• Home loan mix as of 30 Sep 21 Salaried: Self Employed: Professionals stood at 87%: 8%: 5%
Loan Against Property
• Offers loan to mass affluent and above self-employed customers for an average ticket size of 54 lakhs
• Focused on balance transfers to large existing franchise of BFL by creating customized solutions as well as through channel partners
• Currently present across 13 locations in India
Rural • Offers home loans and loans against property to salaried and self-employed customers with an average ticket size of approximately 17 lakhs for home loans and 12 lakhs for loan against property
• Hub and spoke strategy through branch network and ASSC tie ups
• Currently present across 96 locations in India 24
Executive summary Bajaj Housing Finance Limited

Executive summary Bajaj Housing Finance Limited
25
Lease Rental Discounting
• Offers loan against lease rentals to high-net-worth individuals and developers on commercial property leased mainly to corporate tenants
• All lease rental discounting transactions are backed by rentals through escrow mechanism
• Ticket size of lease rental discounting ranges from 5 - 350 crore with an average ticket size of approximately 35 crore
• Currently present across 8 locations in India (Mumbai, Delhi, Bangalore, Pune, Ahmedabad, Chennai, Kolkata and Hyderabad)
Developer Financing
• Offers construction finance and inventory finance mainly to category A and A+ developers in India
• Average ticket size ranges between 20 25 crore
• Currently present in 12 locations.
Credit Quality • Gross NPA and Net NPA, recognized as per extant RBI prudential norms and provisioned as per Expected Credit Loss (ECL) methodprescribed in Ind AS, as of 30 September 2021 stood at 0.35% and 0.21% respectively
Treasury • Strategy is to create a balanced and sustained mix of borrowings
• Borrowings stood at ₹ 36,284 crore with a mix of 62 : 38 between banks and money markets as of 30 September 2021 against mix of 65 : 35 as of 30 June 2021
Credit Rating • Credit rating for long term borrowing is AAA/Stable by CRISIL & IND AAA/Stable by India Ratings
• Credit rating for short term borrowing is A1+ by CRISIL & IND A1+ by India Ratings

Bajaj Financial Securities Limited
• A 100% subsidiary of Bajaj Finance Limited, registered with Securities and Exchange Board of India (SEBI)
• Member of Stock Exchanges (NSE and BSE), Depositaries (NSDL & CDSL) and AMFI for distribution of Mutual Funds
• Offers Capital Market products like Broking, Depositary services, Margin Trade Financing (MTF), Mutual Funds, IPOs and Distribution of PMS.
• Broking business caters to two different business segment HNI and Retail
• Margin Trade Financing Loan Book of ₹ 564 Cr as of 30 September 2021
• Received issuer rating of AAA from CRISIL
HNI Broking • Business oriented towards delivering relationship based Broking solutions to UHNI & HNI client segment
• Physical Branch network across 7 Location Mumbai, Ahmedabad, Pune, Indore, Bangalore, Kolkata and Delhi
• Total client base over 4K as of 30 September 2021
Retail Broking • Acquired 108 K+ Trading and Demat accounts in Q2 FY22.
• Empaneled 500+ Affiliates and Partners for online accounts.
• Working with 120+ Independent Business Advisor (IBAs)
• Focused on driving client activations and customer service frameworks for real time support
Capabilities Update
• Complete migration to Web & Mobile App 2.0 platform which is aimed at offering fast and simple trading experience to clients
• App in App infrastructure to originate customers from existing Mobile App of BFL (Experia)
• Strong pipelines of upcoming new products and features to offer complete product suite of BFSL clients
26
Executive summary Bajaj Financial Securities Ltd
Financial performanceFinancial statement summary Bajaj Finance Limited
Financial statement summary Consolidated
27
Section 03 3.1
3.2
3.3Financial statement summary Bajaj Housing Finance Limited

Financials snapshot Q2 FY22 Q2 FY21 Y-o-Y H1 FY22 H1 FY21 Y-o-Y FY21
Assets under management 1,66,937 1,37,090 22% 166,937 137,090 22% 1,52,947
Assets under finance 1,60,808 1,31,765 22% 160,808 131,765 22% 1,46,687
Interest income 6,687 5,763 16% 12,642 11,556 9% 23,304
Fee and other income 978 620 58% 1,665 1,212 37% 2,788
Net gain on fair value changes on investment 67 137 (51%) 168 402 (58%) 591
Total Income 7,732 6,520 19% 14,475 13,170 10% 26,683
Interest expenses 2,397 2,358 2% 4,651 4,856 (4%) 9,414
Net Interest Income 5,335 4,162 28% 9,824 8,314 18% 17,269
Operating Expenses 2,031 1,157 76% 3,403 2,313 47% 5,308
Loan losses and provisions 1,300 1,700 (24%) 3,051 3,386 (10%) 5,969
ECL stage 1 & 2 (175) 1,370 (113%) (181) 2,800 (106%) 414
ECL stage 3 & write off 1,475 330 347% 3,232 586 452% 5,555
Profit before tax 2,004 1,305 54% 3,370 2,615 29% 5,992
Profit after tax 1,481 965 53% 2,483 1,927 29% 4,420
Ratios
Operating expenses to Net Interest Income 38.1% 27.8% 34.6% 27.8% 30.7%
Loan loss to average AUF* 0.83% 1.29% 1.98% 2.48% 4.14%
Earning per share - Basic (₹) * 24.6 16.1 41.2 32.1 73.6
Return on Average Assets* 0.9% 0.7% 1.6% 1.4% 3.1%
Return on Average Equity * 3.8% 2.9% 6.5% 5.8% 12.8%
Financial statement summary Consolidated
28* Not annualized
₹ in Crore
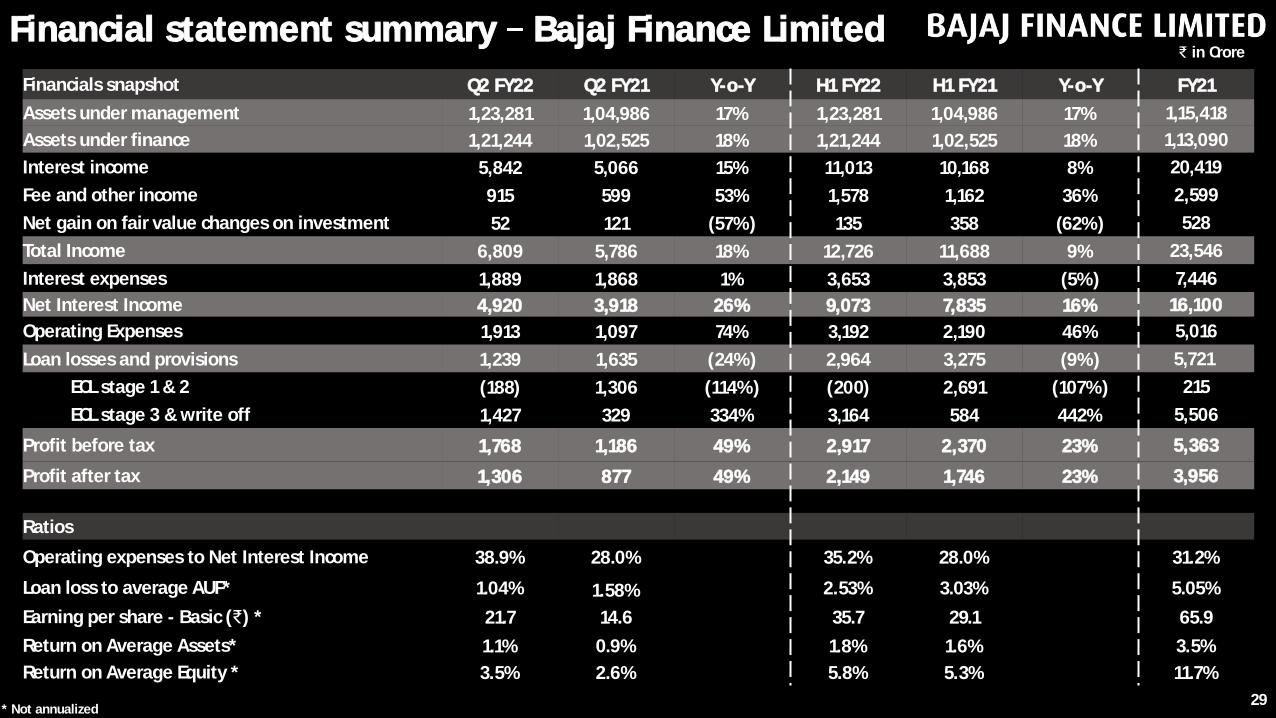
Financials snapshot Q2 FY22 Q2 FY21 Y-o-Y H1 FY22 H1 FY21 Y-o-Y FY21
Assets under management 1,23,281 1,04,986 17% 1,23,281 1,04,986 17% 1,15,418
Assets under finance 1,21,244 1,02,525 18% 1,21,244 1,02,525 18% 1,13,090
Interest income 5,842 5,066 15% 11,013 10,168 8% 20,419
Fee and other income 915 599 53% 1,578 1,162 36% 2,599
Net gain on fair value changes on investment 52 121 (57%) 135 358 (62%) 528
Total Income 6,809 5,786 18% 12,726 11,688 9% 23,546
Interest expenses 1,889 1,868 1% 3,653 3,853 (5%) 7,446
Net Interest Income 4,920 3,918 26% 9,073 7,835 16% 16,100
Operating Expenses 1,913 1,097 74% 3,192 2,190 46% 5,016
Loan losses and provisions 1,239 1,635 (24%) 2,964 3,275 (9%) 5,721
ECL stage 1 & 2 (188) 1,306 (114%) (200) 2,691 (107%) 215
ECL stage 3 & write off 1,427 329 334% 3,164 584 442% 5,506
Profit before tax 1,768 1,186 49% 2,917 2,370 23% 5,363
Profit after tax 1,306 877 49% 2,149 1,746 23% 3,956
Ratios
Operating expenses to Net Interest Income 38.9% 28.0% 35.2% 28.0% 31.2%
Loan loss to average AUF* 1.04% 1.58% 2.53% 3.03% 5.05%
Earning per share - Basic (₹) * 21.7 14.6 35.7 29.1 65.9
Return on Average Assets* 1.1% 0.9% 1.8% 1.6% 3.5%
Return on Average Equity * 3.5% 2.6% 5.8% 5.3% 11.7%
Financial statement summary Bajaj Finance Limited
29* Not annualized
₹ in Crore

Financials snapshot Q2 FY22 Q2 FY21 Y-o-Y H1 FY22 H1 FY21 Y-o-Y FY21
Assets under management 44,429 33,463 33% 44,429 33,463 33% 38,871
Assets under finance 39,130 29,200 34% 39,130 29,200 34% 33,419
Interest income 837 696 20% 1,614 1,387 16% 2,877
Fee and other income 50 27 85% 79 64 23% 218
Net gain on fair value changes on investment 14 15 (7%) 30 43 (30%) 60
Total Income 901 738 22% 1,723 1,494 15% 3,155
Interest expenses 505 490 3% 992 1,003 (1%) 1,966
Net Interest Income 396 248 60% 731 491 49% 1,189
Operating Expenses 110 70 57% 201 143 41% 329
Loan losses and provisions 61 65 (6%) 87 111 (22%) 247
ECL stage 1 & 2 13 64 (80%) 19 109 (83%) 199
ECL stage 3 & write off 48 1 NA 68 2 NA 48
Profit before tax 225 113 99% 443 237 87% 613
Profit after tax 166 83 100% 327 175 87% 453
Ratios
Operating expenses to Net Interest Income 27.8% 28.2% 27.5% 29.1% 27.7%
Loan loss to average AUF* 0.16% 0.23% 0.24% 0.39% 0.80%
Earning per share - Basic (₹) * 0.34 0.17 0.67 0.36 0.93
Return on Average Assets* 0.4% 0.3% 0.9% 0.6% 1.5%
Return on Average Equity * 2.6% 1.5% 5.3% 3.1% 7.8%
Financial statement summary Bajaj Housing Finance Ltd.
30* Not annualized
₹ in Crore
Section 04
Resilient business model Consolidated
Behaviouralized ALM as of 30 SeptemberBajaj Finance Limited
31
4.1
4.2
4.3
Liability mix over last 10 years Consolidated
4.5 Disciplined ALM Management Bajaj Finance Limited
4.6
Conservative leverage standards Bajaj Finance Limited
Asset liability management4.4
Behaviouralized ALM as of 30 September Bajaj Housing Finance Limited

18.7%
16.2%
14.2%
16.1%
14.6%
19.7%
16.3%
21.3% 25.1%25.4% 24.9%
3.3% 2.9%3.8% 3.4%
5.7%5.0%
4.4%3.7% 3.2% 3.2% 2.8%
22.0%
19.1%18.0%
19.5%20.3%
24.7%
20.7%
25.0%
28.3% 28.6%27.7%
5.3
6.2
6.8
6.3
6.6
5.4
6.3
5.14.7 4.6
4.8
Mar'13 Mar'14 Mar'15 Mar'16 Mar'17 Mar'18 Mar'19 Mar'20 Mar'21 Jun'21 Sept'21
Tier 1 Capital Tier 2 Capital Capital Adequacy Ratio (CRAR) Consolidated Leverage Ratio
32
Conservative leverage standards
*Standalone leverage is approximately 3.9X as of 30 September 2021
Capital Adequacy Ratios (CRAR) are on standalone basis
*
denotes point at which the Company initiated its capital raising plan in last 10 years
Leverage Threshold
7.0 7.0 7.0 7.0 7.0 7.0 7.07.07.0 7.0 7.0

33
Resilient business model Consolidated
Post Ind AS, Fee income to PBT represents non-loan fees and commission income as a % of Profit Before Tax
9.74% 9.85% 9.87% 9.47% 9.00% 8.24% 8.27% 8.39% 7.84% 7.11% 6.77%4.1% 3.6% 3.3% 3.5% 3.7% 3.9% 4.1% 4.1% 3.1% 2.7% 3.8%
26.4%28.4%
29.9%
33.3%
36.0%38.4%
27.2%
35.4%
46.5%
50.4%48.8%44.6%
46.0% 45.0%43.1%
41.4% 41.8%
35.3% 33.5%
30.7% 30.6%
38.1%
Mar'13 Mar'14 Mar'15 Mar'16 Mar'17 Mar'18 Mar '19 Mar'20 Mar'21 Jun'21 Sept'21
COF ROA Fee Income to PBT Opex to NII

Particulars 1-7 D 8-14 D 15-30 D >1-2 M >2-3 M >3-6 M >6 M-1 Y >1-3 Y >3-5 Y >5 Y Total
Cash & Investments 10,294 12 6 551 1,580 916 889 2,102 917 5,872 23,138
Advances 6,567 2,281 2,600 6,512 6,415 14,107 21,711 42,468 14,572 7,281 1,24,516
Other inflows 324 116 3,985 1,213 561 29 241 946 234 2,451 10,101
Total Inflows (A) 17,185 2,409 6,591 8,277 8,556 15,053 22,842 45,516 15,723 15,605 1,57,756
Cumulative Total Inflows (B) 17,185 19,594 26,185 34,461 43,018 58,071 80,912 1,26,428 1,42,151 1,57,756
Borrowings 594 607 2,500 4,678 2,428 9,146 24,084 47,124 12,466 10,226 1,13,853
Capital Reserves and Surplus - - - - - - - - - 37,685 37,685
Other Outflows 3,524 572 1,179 0 41 4 54 105 463 276 6,218
Total Outflows (C) 4,118 1,180 3,678 4,679 2,469 9,150 24,138 47,228 12,929 48,187 1,57,756
Cumulative Total Outflows (D) 4,118 5,297 8,975 13,654 16,123 25,273 49,411 96,640 1,09,569 1,57,756
Mismatch (E = A - C) 13,067 1,229 2,913 3,598 6,087 5,903 (1,296) (1,713) 2,794 (32,582)
Cumulative mismatch (F = B-D) 13,067 14,296 17,209 20,807 26,894 32,798 31,501 29,788 32,582 -
Cumulative mismatch as % (D/F)
317% 270% 192% 152% 167% 130% 64% 31% 30% 0%
Permissible cumulative gap % -10% -10% -20%
Additional borrowings possible 23,756
34
₹ in CroreBehaviouralized ALM as of 30 September 2021 BFL

Particulars 1-7 D 8-14 D 15-30 D >1-2 M >2-3 M >3-6 M >6 M-1 Y >1-3 Y >3-5 Y >5-7 Y >7-10 Y >10 Y Total
Cash & Investments 233 400 1,500 1,000 199 - 0 0 - - - - 3,333
Advances 279 227 504 771 755 2,157 3,885 10,931 6,995 4,705 4,227 3,696 39,130
Other inflows 322 7 605 12 1,014 1,497 1,014 1,176 1,015 352 321 863 8,198
Total Inflows (A) 835 634 2,610 1,783 1,969 3,654 4,898 12,107 8,010 5,056 4,548 4,559 50,662
Cumulative Total Inflows (B) 835 1,468 4,078 5,861 7,830 11,483 16,382 28,488 36,498 41,554 46,102 50,662
Borrowings - - 473 764 821 2,804 6,069 18,723 5,244 1,582 - 1,799 38,280
Capital Reserves and Surplus - - - - - - - - - - - 6,359 6,359
Other Outflows 425 329 1,009 342 203 536 658 15 5 1 2,500 - 6,023
Total Outflows (C) 425 329 1,482 1,106 1,024 3,341 6,727 18,738 5,249 1,583 2,500 8,158 50,662
Cumulative Total Outflows (D) 425 753 2,235 3,341 4,365 7,705 14,433 33,171 38,420 40,003 42,503 50,662
Mismatch (E = A - C) 410 305 1,127 677 945 313 (1,829) (6,632) 2,761 3,473 2,048 (3,599)
Cumulative mismatch (F = B-D) 410 715 1,843 2,520 3,465 3,778 1,949 (4,683) (1,922) 1,551 3,599 -
Cumulative mismatch as % (F/D) 97% 95% 82% 75% 79% 49% 14% -14% -5% 4% 8% 0%
Permissible cumulative gap % -10% -10% -20%
Additional borrowings possible 2,862
35
₹ in Crore
Behaviouralized ALM as of 30 Sept 2021 BHFL

36%
141%
48%
61%
119% 120%
51%
220% 216%
160%
192%
16%4%
44%
71%
50%
96%
57% 54%
80% 76%64%
Cumulative gap upto 1 month Cumulative gap upto 12 months
Disciplined ALM Management
-15% ALM mismatch for upto 1 Month and upto 1 year. From FY20 onwards, RBI has prescribed -20% ALM mismatch for upto 1 Month and left mismatch for subsequent buckets to discretion of the company.
36
Sept

0% 1% 4% 6% 8%12% 13%
17% 20% 21% 20%
53%58% 54% 48%
35% 25%
34%
36% 31% 30% 29%
35% 25%33% 38%
40%45%
36%
36%35% 36% 37%
4%
3%
4% 3%
7% 6% 4%
3%3% 3% 3%
8%13%
5% 5%10% 12% 13% 5%
7% 6% 7%
3% 4% 4% 4%
Mar'13 Mar'14 Mar'15 Mar'16 Mar'17 Mar'18 Mar'19 Mar'20 Mar'21 Jun'21 Sept'21
Deposits Bank Loans (incl. CC/OD/WCDL) NCD Subordinate Debt Short term Borrowings ECB37
Consolidated Liability mix over last 10 years

Customer franchise and distribution reach
Geographic presence
38
Section 05 5.1
5.2
5.3
Customer franchise
Strong distribution reach

Total Franchise
Credit segment filter
Overall Cross sell franchise
Non delinquent customers
Cross sell franchise
Q1 FY22
39.82 MM
50.45 MM
38.32 MM
33.15 MM
27.43 MM(54.4%)*
Customer franchise
Q2 FY21
44.11 MM
34.72 MM
33.48 MM
29.63 MM
23.87 MM(54%)*
Q2 FY22
41.68 MM
52.80 MM
40.12 MM
35.31 MM
29.37 MM(57.8%)*
Customer Franchise addition
39
Q1 FY21
0.53 MM
Q2 FY21
1.22 MM
Q3 FY21
2.19 MM
Q4 FY21
2.26 MM
Q1 FY212
1.88 MM
*Represents cross sell franchise as a % of total franchise
Q2 FY22
2.35 MM
40
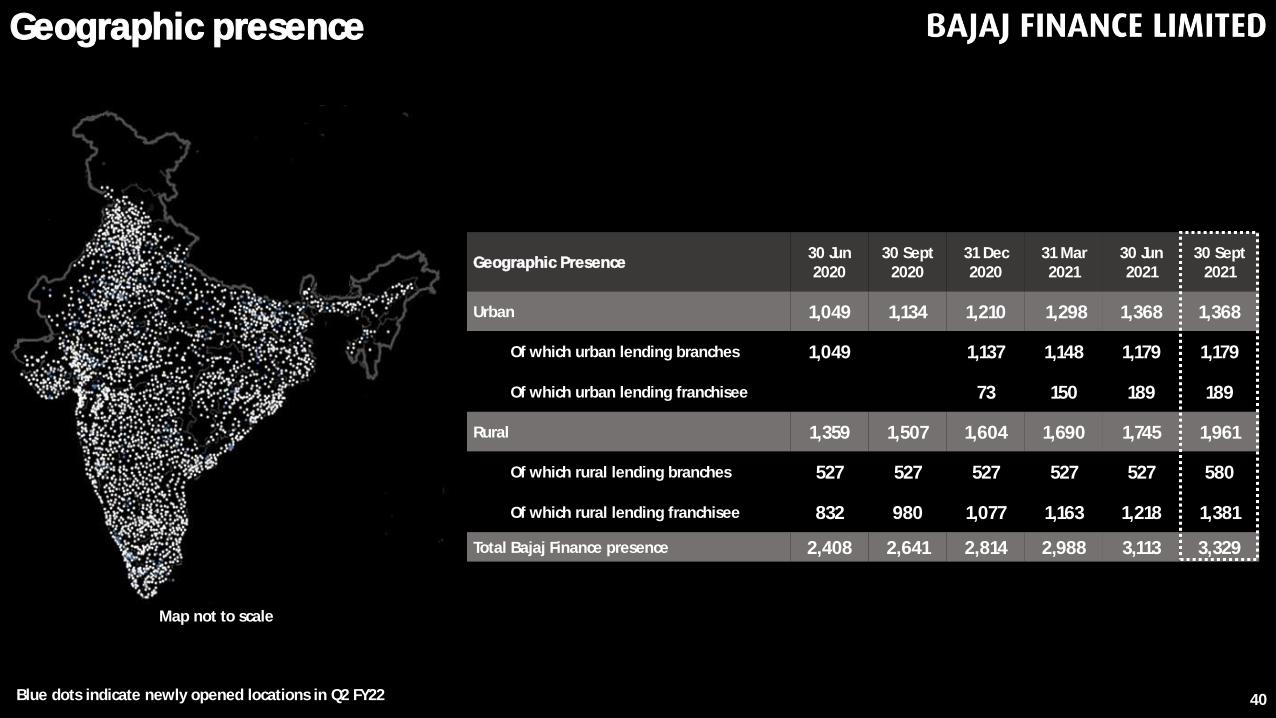
Geographic presence
Blue dots indicate newly opened locations in Q2 FY22
Map not to scale
Geographic Presence 30 Jun 2020
30 Sept 2020
31 Dec 2020
31 Mar 2021
30 Jun 2021
30 Sept 2021
Urban 1,049 1,134 1,210 1,298 1,368 1,368
Of which urban lending branches 1,049 1,137 1,148 1,179 1,179
Of which urban lending franchisee 73 150 189 189
Rural 1,359 1,507 1,604 1,690 1,745 1,961
Of which rural lending branches 527 527 527 527 527 580
Of which rural lending franchisee 832 980 1,077 1,163 1,218 1,381
Total Bajaj Finance presence 2,408 2,641 2,814 2,988 3,113 3,329

41
Strong distribution reach
Active distribution 30-Sep-19 30-Sep-20 31-Dec-20 31-Mar-21 30-Jun-21 30-Sep-21
Consumer durable stores Urban 22,000+ 24,200+ 24,700+ 26,400+ 26,900+ 28,000+
Consumer durable stores Rural 15,200+ 19,600+ 22,500+ 24,000+ 24,000+ 25,600+
Digital product stores 23,100+ 26,400+ 25,400+ 23,800+ 26,350+ 27,600
Lifestyle retail stores 8,300+ 9,500+ 8,800+ 9,800+ 9,400+ 9,700+
EMI card retail spends stores 20,700+ 24,300+ 10,400+ 14,300+ 14,500+ 15,400+
Bajaj Auto dealers, sub-dealerships and ASSC 4,900+ 5,500+ 5,800+ 5,900+ 5,800+ 5,900+
Direct Sales Agents/Independent Financial Agents
2,800+ 4,900+ 5,200+ 6,100+ 7,500+ 7,500+
Overall active distribution network 97,000+ 1,14,400+ 1,02,800+ 1,10,300+ 1,14,400+ 1,19,900+

Business segment wise AUMBusiness segment wise AUM as of 30 September
Mortgages
42
Section 06 6.1
6.2
Business segment wise AUM as of 30 September - Consolidated

43
Assets Under ManagementConsolidated
as of 30 September 2020
BFL as of30 September
2021
BHFL as of 30 September
2021
Consolidated as of 30
September 2021Growth
YoY
Composition as of 30 September
2020
Composition as of 30 September
2021
Auto Finance Business 12,687 10,738 - 10,738 (15%) 9% 6%
Sales Finance Business 7,918 12,555 - 12,555 59% 6% 8%
Consumer B2C Business 28,262 32,374 1,305 33,679 19% 20% 20%
Rural Sales Finance Business 1,808 3,258 - 3,258 80% 1% 2%
Rural B2C Business 10,291 13,376 - 13,376 30% 8% 8%
SME Lending Business 18,253 21,852 144 21,871 20% 13% 13%
Securities Lending Business 4,340 6,729 - 7,293 68% 3% 4%
IPO Financing 987 170 - 170 (83%) 1% 0%
Commercial Lending Business 6,555 9,801 - 9,801 50% 5% 6%
Mortgages 45,989 12,428 42,980 54,196 18% 34% 33%
Total 1,37,090 1,23,281 44,429 1,66,937 22% 100% 100%
Co-brand Credit Card CIF 1.87 MM 2.19 MM 17%
EMI Card CIF 20.6 MM 25.7 MM 25%
Co-brand Wallets 16.8 MM 21.3 MM 27%
Business segment wise AUM - Consolidated ₹ in Crore

44
Bajaj Housing Finance Limited Mortgage All
Assets Under Management 30 Sep 2020 30 Sep 2021 Growth 30 Sep 2020 30 Sep 2021 Growth Composition as of
30 Sep 2021
Home Loans 21,456 27,668 29% 26,165 30,824 18% 57%
Loan against property 4,205 5,071 21% 11,520 11,512 0% 21%
Lease rental discounting 3,396 5,595 65% 4,309 6,809 58% 13%
Developer Finance 1,809 2,526 40% 1,878 2,532 35% 5%
Rural 1,712 2,120 24% 2,117 2,519 19% 4%
Total 32,578 42,980 32% 45,989 54,196 18% 100%
₹ in crore
Business segment wise AUM - Mortgages
Home Loan customer categorisation
Bajaj Housing Finance Limited Mortgage - All
30 Sep 2020 30 Sep 2021 Growth 30 Sep 2020 30 Sep 2021 Growth Composition as of
30 Sep 2021
Home Loan to Salaried 19,830 25,984 31% 22,471 27,738 23% 87%
Home Loan to Self Employed 1,258 1,351 7% 3,038 2,557 (16%) 8%
Home Loan to Professional 1,134 1,429 26% 1,477 1,668 13% 5%

Update on credit quality
45
Section 07
7.1
7.2
Provisioning Coverage - Consolidated
ECL summary Consolidated
ECL summary Bajaj Housing Finance Limited
7.4 Portfolio stagewise provisioning
7.3
7.5 Portfolio credit quality - Consolidated

Provisioning Coverage - Consolidated
46
ParticularsAUM
30 Sept 2021GNPA NNPA
PCR (%)
GNPA % NNPA %
31 Mar 21 30 Jun 21 30 Sept 21 31 Mar 21 30 Jun 21 30 Sept 21
Auto Finance Business 10,738 1,919 1,027 46% 9.31% 19.15% 16.00% 4.84% 12.18% 9.25%
Sales Finance Business 12,555 91 18 80% 1.11% 1.05% 0.64% 0.26% 0.24% 0.13%
Consumer B2C Business 33,679 709 177 75% 1.70% 2.84% 2.11% 0.44% 0.95% 0.54%
Rural Sales Finance Business 3,258 36 7 81% 1.11% 1.35% 1.09% 0.26% 0.29% 0.21%
Rural B2C Business 13,376 429* 175* 59%* 1.65% 2.85% 3.09%* 0.39% 0.92% 1.28%*
SME Lending Business 21,871 379 96 75% 0.94% 2.15% 1.69% 0.23% 0.70% 0.43%
Securities Lending Business 7,463 2 1 18% - - 0.02% - - 0.02%
Commercial Lending Business 9,801 44 29 34% - - 0.45% - - 0.29%
Mortgages 54,196 494 296 40% 0.92% 0.88% 0.97% 0.58% 0.61% 0.59%
Total 1,66,937 4,103 1,826 55% 1.79% 2.96% 2.45% 0.75% 1.46% 1.10%
₹ in Crore
*Includes Gold loan GNPA of ₹ 96 crore and NNPA of ₹ 92 crore. Net of Gold loan, the GNPA, NNPA and PCR are 2.79%, 0.71% and 75%.

ECL summary Consolidated
Assets categorization
Stage 1 & 2 (represents standard assets) 98.66% 97.14% 98.21% 97.04% 97.55%
Stage 3 (classified as NPA) 1.03% 0.55% 1.79% 2.96% 2.45%
Stage 3 (not classified as NPA) 0.31% 2.32% - - -
Assets and impairment allowance
Gross Stage 1 & 2 assets* (A) 1,38,035 1,42,287 1,49,878 1,55,188 1,63,534
ECL Provision Stage 1 & 2 (B) 5,099 2,708 2,713 2,707 2,537
Net Stage 1 & 2 assets (C = A-B) 1,32,936 1,39,579 1,47,165 1,52,481 1,60,997
ECL Provision % Stage 1 & 2 assets (D = B/A) 3.69% 1.90% 1.81% 1.74% 1.55%
Gross Stage 3 assets@ (E) 1,873 4,194 2,731 4,737 4,103
ECL Provision Stage 3 (F) 1,102 2,433 1,595 2,430 2,277
Net Stage 3 assets (G = E-F) 771 1,761 1,136 2,307 1,826
Coverage Ratio % Stage 3 assets (H= F/E) 59% 58% 58% 51% 55%
Overall coverage ratio 4.43% 3.51% 2.82% 3.21% 2.87%
Summary of stage wise assets and provision for impairment allowance
*Gross Stage 1 & 2 assets represent loans balance as per Ind AS after adjusting for the impact of amortisation of fees earned and acquisition cost incurred including other assets like security deposits, advance to dealer, receivable from related parties, capital advances etc@ Gross Stage 3 assets represents loans balance as per Ind AS after adjusting for the impact of (i) amortisation of fees earned and acquisition cost incurred and (ii) overdue interest considered recoverable under Ind AS and other receivables considered as non-performing as at the end of respective periods. 47

ECL summary Bajaj Housing Finance Limited
Asset categorization
Stage 1 & 2 (represents standard assets) 99.91% 99.65% 99.65% 99.72% 99.65%
Stage 3 (classified as NPA) 0.08% 0.06% 0.35% 0.28% 0.35%
Stage 3 (not classified as NPA) 0.01% 0.29%
Assets and impairment allowance
Gross Stage 1 & 2 assets* (A) 29,601 31,356 34,000 36,378 39,892
ECL Provision Stage 1 & 2 (B) 220 291 310 316 330
Net Stage 1 & 2 assets (C = A-B) 29,381 31,065 33,690 36,062 39,562
ECL Provision % Stage 1 & 2 assets (D = B/A) 0.74% 0.93% 0.91% 0.87% 0.83%
Gross Stage 3 assets@ (E) 26.9 110.2 119.1 102.5 142.0
ECL Provision Stage 3 (F) 10.1 41.3 45.2 36.6 56.2
Net Stage 3 assets (G = E-F) 16.8 68.9 73.9 65.9 85.9
Coverage Ratio % Stage 3 assets (H= F/E) 38% 38% 38% 36% 40%
Overall coverage ratio 0.78% 1.06% 1.04% 0.97% 0.96%
Summary of stage wise assets and provision for impairment allowance
*Gross Stage 1 & 2 assets represent loans balance as per Ind AS after adjusting for the impact of amortisation of fees earned and acquisition cost incurred including other assets like security deposits, advance to dealer, receivable from related parties, capital advances etc@ Gross Stage 3 assets represents loans balance as per Ind AS after adjusting for the impact of (i) amortisation of fees earned and acquisition cost incurred and (ii) overdue interest considered recoverable under Ind AS and other receivables considered as non-performing as at the end of respective periods. 48

49
Gross Assets Receivable ECL Provision PCR %
Stage 1Stage 2
Stage 3 Stage 1Stage 2
Stage 3 Stage 1Stage 2
Stage 3OTR* Normal OTR* Normal OTR* Normal
Auto Finance Business 8,465 21 1,588 1,919 137 1 227 892 1.6% 6.5% 14.3% 46.5%
Sales Finance Business 12,222 394 104 91 89 51 42 73 0.7% 13.1% 40.7% 79.7%
Consumer B2C Business 31,729 129 1,010 709 365 31 333 532 1.1% 24.3% 33.0% 75.0%
Rural Sales Finance Business 3,257 - 19 36 14 - 10 29 0.4% 40.3% 51.7% 81.0%
Rural B2C Business 12,784 13 684 429 150 3 127 255 1.2% 23.8% 18.5% 59.3%
SME Lending Business 21,559 133 365 379 229 49 148 284 1.1% 36.0% 40.4% 75.0%
Securities Lending Business 7,511 - 13 2 3 - 1 - 0.0% 0.0% 8.1% 17.5%
Commercial Lending Business 9,775 - 10 44 21 - 0 15 0.2% 0.0% 0.1% 34.3%
Mortgages 48,254 822 658 494 211 154 142 197 0.4% 18.7% 21.6% 40.0%
Total as of 30 Sep 2021 1,55,556 1,512 4,451 4,103 1,219 289 1,030 2,277 0.8% 19.1% 23.1% 55.5%
Total as of 30 Jun 2021 1,46,119 1,287 6,137 4,737 1,077 235 1,395 2,430 0.7% 18.3% 22.7% 51.3%
Total as of 31 Mar 2021 1,41,539 1,739 4,985 2,731 1,145 328 1,239 1,595 0.8% 18.9% 24.9% 58.4%
Stagewise receivables & provisioning as of 30 Sep 2021₹ in crore
* OTR One time Restructuring | Stage 1 - Customer with no overdue on reporting date | Stage 2 - Customer with 1 & 2 instalments overdue, including weak accounts without any overdue | Stage 3 - Customer with 3 & above instalments overdue
Gross Assets receivables Provision Net Assets receivables
Total as of 30 Sep 2021 1,65,622 4,814 1,60,808
Total as of 30 Jun 2021 1,58,280 5,137 1,53,143
Total as of 31 Mar 2021 1,50,995 4,308 1,46,687

Portfolio credit quality Consolidated
50
Two & three-wheeler
Digital product
98.60%
0.96%
98.55%
0.96%
98.65%
0.89%
98.47%
1.04%
92.10%
7.80%
1
Stage
2 9.39%
88.70%
10.17%
87.63%
11.69%
85.81%
1.1.27%
86.00%
25.19%
72.62%
17.59%
76.15%
17.37%
78.02%
16.35%
71.14%1
Stage
2
Stage
B2C loans
1.20%
98.29%
1.39%
98.02%
1.43%
98.00%
1.33%
98.12%
9.03%
90.52%1
Stage
2
98.92%
0.78%
3.35%
95.44%
1.08%
98.24%
0.97%
98.49%
11.14%
88.74%
1.37%
97.85%1
2 0.88%
98.78%
Consumer Durable & Lifestyle
99.52%
0.25%
0.34%
99.27%
2.60%
96.91%
99.05%
0.69%
0.95%
98.71%
3.78%
95.15%
12.67%
77.76%
0.95%
98.71%
0.27%
99.56%
99.58%
0.27%
2.08%
97.37%
0%
1%
2%
3%
4%
5%
6%
7%
8%
9%
Jun'19 Sep'19 Dec'19 Feb'20 Sep'20 Dec'20 Mar'21 Jun'21 Sept'21
1st Bucket 2nd Bucket 3rd Bucket 4th Bucket 5th Bucket
0%
5%
10%
15%
20%
25%
30%
35%
June'19 Sep'19 Dec'19 Feb'20 Sep'20 Dec'20 Mar'21 Jun'21 Sept'21
1st Bucket 2nd Bucket 3rd Bucket 4th Bucket 5th Bucket 5+ Bucket
0%
2%
4%
6%
8%
10%
12%
June'19 Sep'19 Dec'19 Feb'20 Sep'20 Dec'20 Mar'21 Jun'21 Sept'21
1st Bucket 2nd Bucket 3rd Bucket 4th Bucket 5th Bucket
0%1%2%3%4%5%6%7%8%9%
10%
Jun'19 Sep'19 Dec'19 Feb'20 Sep'20 Dec'20 Mar'21 Jun'21 Sept'21
1st Bucket 2nd Bucket 3rd Bucket 4th Bucket 5th Bucket

Loan against property
Portfolio credit quality Consolidated
51
Business & professional loans
0.92%
98.59%
1.13%
98.27%98.35%
1.12%1.10%
98.42%
6.10%
93.43%1 Stage
2
0.14%
97.70%
0.60%
97.31%
0.27%
97.06%
0.30%
97.06%
2.36%
96.93%1
Stage
2
Rural lending B2C
0.91%
98.65%
1.13%
98.32%
1.09%
98.32%
1.02%
98.47%
8.29%
90.94%1
Stage
2
0.63%
98.93%
Rural Lending B2B
0.36%
99.21%
0.32%
99.33%
0.51%
98.87%
7.11%
92.84%1
Stage
2 1.92%
97.19%
3.44%
94.75%
0.52%
99.21%
1.78%
97.31%
1.18%
98.50%
0.10%
99.75%
1.83%
97.67%
0.50%
98.47%
1.97%
97.30%
0.80%
98.89%
3.59%
95.47%
2.69%
96.23%
1.04%
98.51%
0.18%
99.60%
4.19%
94.49%
1.76%
97.15%
0%
1%
2%
3%
4%
5%
6%
7%
June'19 Sep'19 Dec'19 Feb'20 Sep'20 Dec'20 Mar'21 Jun'21 Sept'21
1st Bucket 2nd Bucket 3rd Bucket 4th Bucket 5th Bucket
0%
1%
2%
3%
4%
5%
6%
7%
8%
Jun'19 Sep'19 Dec'19 Feb'20 Sep'20 Dec'20 Mar'21 Jun'21 Sep'21
1st Bucket 2nd Bucket 3rd Bucket 4th Bucket 5th Bucket
0%
1%
2%
3%
4%
5%
6%
7%
8%
9%
10%
Jun;19 Sep'19 Dec'19 Feb'20 Sep'20 Dec'20 Mar'21 Jun'21 Sept'21
1st Bucket 2nd Bucket 3rd Bucket 4th Bucket 5th Bucket
0.0%
0.5%
1.0%
1.5%
2.0%
2.5%
3.0%
3.5%
4.0%
Jun'19 Sep'19 Dec'19 Feb'20 Sep'20 Dec'20 Mar'21 Jun'21 Sept'21
1st Bucket 2nd Bucket 3rd Bucket 4th Bucket 5th Bucket 5+ Bucket

Portfolio credit quality Consolidated
52
Home loans
99.61%
0.13%
99.42%
0.27%
99.60%
0.11%
98.31%
1.40%
98.67%
1.03%
99.63%
0.15%
1
Stage
2
99.56%
0.24%
98.31%
1.36%
99.05%
0.69%
-0.2%0.0%0.2%0.4%0.6%0.8%1.0%1.2%1.4%1.6%1.8%
Jun'19 Sep'19 Dec'19 Feb'20 Sep'20 Dec'20 Mar'21 Jun'21 Sept'21
1st Bucket 2nd Bucket 3rd Bucket 4th Bucket 5th Bucket 5+ Bucket

BAJAJ FINANCE LIMITED Q2 FY22 Investor Presentation
Thank You

Disclaimer
54
This presentation has been prepared by and is the sole responsibility of Bajaj Finance Limited (together with its subsidiaries, referred to as the Company or . By
accessing this presentation, you are agreeing to be bound by the trailing restrictions.
This presentation does not constitute or does not intend to constitute or form part of any offer or invitation or inducement to sell, or any solicitation of any offer or
recommendation to purchase, any securities of the Company, nor shall it or any part of it or the fact of its distribution form the basis of, or be relied on in connection with, any
contract or commitment therefor. In particular, this presentation is not intended to be a prospectus or offer document under the applicable laws of any jurisdiction, including
India. No representation or warranty, express or implied, is made as to, and no reliance should be placed on, the fairness, accuracy, completeness or correctness of the
information or opinions contained in this presentation. Such information and opinions are in all events not current after the date of this presentation. There is no obligation to
update, modify or amend this communication or to otherwise notify the recipient if information, opinion, projection, forecast or estimate set forth herein, changes or
subsequently becomes inaccurate. However, the Company may alter, modify or otherwise change in any manner the content of this presentation, without obligation to notify
any person of such change or changes.
These materials are being given solely for your information and may not be copied, reproduced or redistributed to any other person in any manner. The distribution of these
materials in certain jurisdictions may be restricted by law and persons into whose possession these materials comes should inform themselves about and observe any such
restrictions. Certain statements contained in this presentation that are not statements of historical fact constitute -looking statements. You can generally identify
forward-looking statements by terminology such as
or other words or phrases of similar import. These forward-looking statements involve known and unknown risks,
uncertainties, assumptions and other factors that may cause the actual results, performance or achievements to be materially different from any future results,
performance or achievements expressed or implied by such forward-looking statements or other projections. Important factors that could cause actual results, performance or
achievements to differ materially include, among others: (a) material changes in the regulations governing the businesses; (b) the Company's ability to comply with
the capital adequacy norms prescribed by the RBI; (c) decreases in the value of the Company's collateral or delays in enforcing the Company's collateral upon default by
borrowers on their obligations to the Company; (d) the Company's ability to control the level of NPAs in the Company's portfolio effectively; (e) internal or external fraud,
operational errors, systems malfunctions, or cyber security incidents; (f) volatility in interest rates and other market conditions; and (g) any adverse changes to the Indian
economy.
This presentation is for general information purposes only, without regard to any specific objectives, financial situations or informational needs of any particular person. The
information contained in this presentation is only current as of its date and the Company does not undertake any obligation to update the information as a result of new
information, future events or otherwise.