earnings presentation (fy22 q2)
TRANSCRIPT

Q2FY2022
Financialpresentationtoaccompanymanagementcommentary

Thispresentationcontainsstatementsormayincludeormayincorporatebyreference,statementsthatmaybedeemedtobe"forward-lookingstatements"withinthemeaningofSection21EoftheSecuritiesExchangeActof1934,asamended(the"Act"),thatareintendedtoenjoytheprotectionofthesafeharborforforward-lookingstatementsprovidedbytheActaswellasprotectionsaffordedbyotherfederalsecuritieslaws.Assumptionsonwhichsuchforward-lookingstatementsarebasedarealsoforward-lookingstatements.Suchforward-lookingstatementsarenotstatementsofhistoricalfacts,butinsteadexpressourestimatesorexpectationsforourconsolidated,oroneofoursegment'sorbusiness’,economicperformanceorresultsofoperationsforfutureperiodsorasoffuturedatesoreventsordevelopmentsthatmayoccurinthefutureordiscussourplans,objectivesorgoals.Ouractualresultsmaydiffermateriallyfromthoseexpressedinorimpliedbyanyoftheseforward-lookingstatementsasaresultofchangesincircumstances,assumptionsnotbeingrealizedorotherrisks,uncertaintiesandfactorsincluding:theimpactoftheCOVID-19pandemiconourbusinessandtheglobaleconomy;economic,capitalmarketsandbusinessconditions;trendsandeventsaroundtheworldandinthemarketsinwhichweoperate;currencyexchangeratefluctuations,changesinmarketinterestratesandmarketlevelsofwages;changesinthesizeofvariousmarkets,includingeCommercemarkets;unemploymentlevels;inflationordeflation,generallyandinparticularproductcategories;consumerconfidence,disposableincome,creditavailability,spendinglevels,shoppingpatterns,debtlevelsanddemandforcertainmerchandise;theeffectivenessoftheimplementationandoperationofourstrategies,plans,programsandinitiatives;unexpectedchangesinourobjectivesandplans;theimpactofacquisitions,investments,divestitures,andotherstrategicdecisions;ourabilitytosuccessfullyintegrateacquiredbusinesses;changesinthetradingpricesofcertainequityinvestmentswehold;initiativesofcompetitors,competitors'entryintoandexpansioninourmarkets,andcompetitivepressures;customertrafficandaveragetransactionsinourstoresandclubsandonoureCommercewebsites;themixofmerchandisewesell,thecostofgoodswesellandtheshrinkageweexperience;ourgrossprofitmargins;thefinancialperformanceofWalmartandeachofitssegments,includingtheamountsofourcashflowduringvariousperiods;theamountofournetsalesandoperatingexpensesdenominatedintheU.S.dollarandvariousforeigncurrencies;commoditypricesandthepriceofgasolineanddieselfuel;supplychaindisruptionsanddisruptionsinseasonalbuyingpatterns;theavailabilityofgoodsfromsuppliersandthecostofgoodsacquiredfromsuppliers;ourabilitytorespondtochangingtrendsinconsumershoppinghabits;consumeracceptanceofandresponsetoourstores,clubs,eCommerceplatforms,programs,merchandiseofferingsanddeliverymethods;cybersecurityeventsaffectingusandrelatedcostsandimpacttothebusiness;developmentsin,outcomesof,andcostsincurredinlegalorregulatoryproceedingstowhichweareapartyoraresubject,andtheliabilities,obligationsandexpenses,ifany,thatwemayincurinconnectiontherewith;casualtyandaccident-relatedcostsandinsurancecosts;theturnoverinourworkforceandlaborcosts,includinghealthcareandotherbenefitcosts;oureffectivetaxrateandthefactorsaffectingoureffectivetaxrate,includingassessmentsofcertaintaxcontingencies,valuationallowances,changesinlaw,administrativeauditoutcomes,impactofdiscreteitemsandthemixofearningsbetweentheU.S.andWalmart'sinternationaloperations;changesinexistingtax,laborandotherlawsandregulationsandchangesintaxratesincludingtheenactmentoflawsandtheadoptionandinterpretationofadministrativerulesandregulations;theimpositionofnewtaxesonimports,newtariffsandchangesinexistingtariffrates;theimpositionofnewtraderestrictionsandchangesinexistingtraderestrictions;adoptionorcreationofnew,andmodificationofexisting,governmentalpolicies,programs,initiativesandactionsinthemarketsinwhichWalmartoperatesandelsewhereandactionswithrespecttosuchpolicies,programsandinitiatives;changesinaccountingestimatesorjudgments;thelevelofpublicassistancepayments;naturaldisasters,changesinclimate,geopoliticalevents,globalhealthepidemicsorpandemicsandcatastrophicevents;andchangesingenerallyacceptedaccountingprinciplesintheUnitedStates.
OurmostrecentannualreportonForm10-KandsubsequentquarterlyreportonForm10-QfiledwiththeSECdiscussotherrisksandfactorsthatcouldcauseactualresultstodiffermateriallyfromthoseexpressedorimpliedbyanyforward-lookingstatementinthepresentation.Weurgeyoutoconsideralloftherisks,uncertaintiesandfactorsidentifiedaboveordiscussedinsuchreportscarefullyinevaluatingtheforward-lookingstatementsinthispresentation.Walmartcannotassureyouthattheresultsreflectedinorimpliedbyanyforward-lookingstatementwillberealizedor,evenifsubstantiallyrealized,thatthoseresultswillhavetheforecastedorexpectedconsequencesandeffectsfororonouroperationsorfinancialperformance.Theforward-lookingstatementsmadetodayareasofthedateofthispresentation.Walmartundertakesnoobligationtoupdatetheseforward-lookingstatementstoreflectsubsequenteventsorcircumstances.
Thispresentationincludescertainnon-GAAPmeasuresasdefinedunderSECrules,includingnetsales,revenue,andoperatingincomeonaconstantcurrencybasis,adjustedoperatingincome,adjustedoperatingincomeinconstantcurrency,adjustedEPS,freecashflowandreturnoninvestment.Refertoinformationaboutthenon-GAAPmeasurescontainedinthispresentation.AdditionalinformationasrequiredbyRegulationGandItem10(e)ofRegulationS-Kregardingnon-GAAPmeasurescanbefoundinourmostrecentForm10-KandourForm8-KfurnishedasofthedateofthispresentationwiththeSEC,whichareavailableatwww.stock.walmart.com.
2
Safeharborandnon-GAAPmeasures

3
Metric FY22Guidanceat5.18.21 NewFY22GuidanceConsolidatednetsales Declinelowsingle-digitsinconstantcurrency
• Excludingdivestitures1,consolidatednetsalesgrowthuplow-to-midsingle-digits
Slightlypositiveinconstantcurrency• Excludingdivestitures1,consolidatednetsalesgrowthup6%to
7%,ormorethan$30billion
Compsalesgrowth • WalmartU.S.,uplowsingle-digits,ex.fuel• Sam’sClub,uplowsingle-digits,ex.fuelandtobacco
• WalmartU.S.,up5%to6%,ex.fuel• Sam’sClub,up7.5%to8.5%,ex.fuelandtobacco
WalmartInternationalnetsales Decline20%-25%inconstantcurrencyduetodivestitures1
• Increasemidsingle-digits,excludingdivestitures1Decline21.5%to22.5%inconstantcurrencyduetodivestitures1
• Increase7%to8%,excludingdivestitures1
Consolidatedexpenseleverage Maintainrate,orslightlyleverage Slightlyleverage
Consolidatedoperatingincome Increasemidsingle-digitsinconstantcurrency• Increasehighsingle-digits,excludingdivestitures1,inconstant
currency
Increase9%to11.5%inconstantcurrency• Increase11.5%to14%,excludingdivestitures1,inconstant
currency
WalmartU.S.operatingincome Increasehighsingle-digits Increase11%to13.5%
Effectivetaxrate 24.5%to25.5% Nochange
EPS Increasehighsingle-digits• Increaselowdouble-digits,excludingdivestitures1 $6.20to$6.35
Capitalexpenditures Around$14billion Nochange
1WecompletedthesalesofWalmartArgentinainNovember2020,AsdainFebruary2021andSeiyuinMarch2021.
Fiscal2022Q3andfull-yearguidanceThefollowingguidancereflectsthecompany’supdatedexpectationsforQ3andfiscalyear2022andisprovidedonanon-GAAPbasisasthecompanycannotpredictcertainelementswhichareincludedinreportedGAAPresults,includingtheimpactofforeignexchangetranslationandexternallyadjusteditems.Prioryearresultsareonanadjustedbasis.Thecompany’supdatedguidanceassumescontinuedstrengthintheU.S.economyandnosignificantadditionalgovernmentstimulusfortheremainderoftheyear.
Metric Q3FY22GuidanceCompsalesgrowth WalmartU.S.,up6%-7%,ex.fuel
EPS $1.30to$1.40

4
Totalrevenue
$141.0+2.4%
Totalrevenue,constantcurrency1,2
$138.6+0.6%
MembershipandOtherIncome
$1.2+28.2%
Netsales
$139.9+2.2%
Netsales,constantcurrency1,2
$137.5+0.5%
Grossprofitrate2
24.8%-15bps
Operatingexpenseasapercentageofnetsales2
20.4%-81bps
Operatingincome2
$7.4+21.4%
Adj.operatingincome,constantcurrency1,2
$7.2+10.6%
Effectivetaxrate
26.3%+79bps
EPS
$1.52-33.0%
AdjustedEPS1
$1.78+14.1%
WalmartInc.-Q2FY22Dollarsinbillions,exceptpershare.Changeiscalculatedasthechangeversustheprioryearcomparableperiod
1Seepressreleaselocatedatwww.stock.walmart.comandreconciliationsattheendofpresentationregardingnon-GAAPfinancialmeasures.2WhenremovingthedivestituresofU.K.,JapanandArgentina:
• Totalrevenueinconstantcurrencywouldhaveincreased7.6%,excluding$8.9billioninQ2fiscal2021.• WalmartInternationaleCommercenetsalesinconstantcurrencywouldhaveincreased86%,excluding$1.2billioninQ2fiscal2021.• Grossprofitratewouldhavedecreased22bps,excludingabenefitof7bpsduetothedivestitures.• Operatingexpenseasapercentageofnetsaleswouldhavedecreased78bps,excludinga3bpsbenefitduetothedivestitures.• OperatingincomeinconstantcurrencyandAdj.Operatingincomeinconstantcurrencywouldhaveincreased24.1%and15.1%,respectively,excluding$256millioninQ2fiscal2021.
Adj.operatingincome,constantcurrency1,2
$7.2+10.6%

1DebttototalcapitalizationcalculatedasofJuly31,2021.Debtincludesshort-termborrowings,long-termdebtduewithinoneyear,financeleaseobligationsduewithinoneyear,long-termdebtandlong-termfinanceleaseobligations.TotalcapitalizationincludesdebtandtotalWalmartshareholders'equity.
2Calculatedforthetrailing12monthsendedJuly31,2021.ForROI,seereconciliationsattheendofpresentationregardingnon-GAAPfinancialmeasures.5
Receivables,net Debttocapitalization1
$6.1 36.5%+19.4% -440bps
Inventories Returnonassets2
$47.8 4.4%+16.2% -330bps
Accountspayable Returnoninvestment2
$49.6 14.8%+7.1% +130bps
WalmartInc.-Q2FY22Dollarsinbillions.Changeiscalculatedasthechangeversustheprioryearcomparableperiod

1Seepressreleaselocatedatwww.stock.walmart.comandreconciliationsattheendofthispresentationregardingnon-GAAPfinancialmeasures.2$15.2billionremainingof$20billionauthorizationapprovedinFebruary2021.Thecompanyrepurchasedapproximately17millionsharesinQ2fiscal2022. 6
Operatingcashflow Dividends
$12.4 $3.1-$6.5 ($1.5in2Q22)
Capitalexpenditures Sharerepurchases2
$5.0 $5.2+$1.5 ($2.4in2Q22)
Freecashflow1 Totalshareholderreturns
$7.4 $8.3-$8.0 ($3.9in2Q22)
WalmartInc.-YTDQ2FY22Dollarsinbillions.Dollarchangesmaynotrecalculateduetorounding.Changeiscalculatedasthechangeversustheprioryearcomparableperiod

7
NetSales
$98.2+5.3%
eCommercenetsalesgrowth
+6%
eCommercecontributiontocomp1,2
~20bps
Inventory
Total:+20%
Comparablesales1,2
5.2%Comparabletransactions
6.1%Comparableaverageticket
-0.8%
• eCommercesalesmorethandoubled,up103%,overthepasttwoyears
• WalmartConnectadvertisingsalesincreased95%;rampingnewadvertisers
• Compsalesbetterthanexpectedreflectingstrongunderlyingbusinesstrends,arobustU.S.economyandstimulusspending
• Compsalesup14.5%ontwo-yearstack
• Compsalesgainsincreasedeachmonththroughquarter,withJulythestrongest
• In-storetransactionsacceleratedinQ2
• Compticketincreased~26%ontwo-yearstack
Remodels:187stores
Pickup:~3,900locations
Same-daydelivery:~3,250stores
• Increaseincludeslappinglastyear'sCOVID-relatedeffectsoninventoryaswellasstrongsalesgrowththisyear
1Compsalesforthe13-weekperiodendedJuly30,2021comparedtothe13-weekperiodendedJuly31,2020,andexcludesfuel.2Theresultsofnewacquisitionsareincludedinourcompsalesmetricsinthe13thmonthafteracquisition.
WalmartU.S.-Q2FY22Dollarsinbillions.Changeiscalculatedasthechangeversustheprioryearcomparableperiod

8
Grossprofitrate
+20bps
Operatingincome
$6.1+20.4%
Operatingexpenserate
-49bps
• BenefitedfromCOVIDvaccinesthisyearandlappinglastyear'sCOVID-relatedclosuresofAutoCareCentersandVisionCenters
• AlsobenefitedfromlowermarkdownsandWalmartConnectadvertisingsales
• Partiallyoffsetbyincreasedsupplychaincosts
• Expenseleveragereflectsstrongsales,lowerCOVIDcostsandlappinglastyear'sbusinessrestructuringcharge(~40bps);partiallyoffsetbyinvestmentsinwages,marketingandtechnologyexpenses
• COVIDcostswerelowerby~$1billion;benefitedleverageby~100bps
Adj.operatingincome1
$6.1+12.0%
WalmartU.S.-Q2FY22Dollarsinbillions.Changeiscalculatedasthechangeversustheprioryearcomparableperiod
1Seepressreleaselocatedatwww.stock.walmart.comandreconciliationsattheendofpresentationregardingnon-GAAPfinancialmeasures.

WalmartU.S.-quarterlymerchandisehighlights
9
Category Compsales Details
Grocery +midsingle-digit
• Salesgrowthof6%reflectedstrongmarketsharegains(accordingtoNielsen)andmodestticketinflation;salesacceleratedthroughthequarterandincreasedlowdouble-digitsonatwo-yearstackedbasis
• Foodcategoriessawbroad-basedstrengthwithlow-teensgrowthonatwo-yearstack;aidedbystrongpricepositioning,anelevatedfreshofferingandbetterin-stocks
• Consumablescategoriesreflectedstrengthinpets,beautyandbabyproducts
Health&wellness +mid-teens • Strongsalesreflectedlappinglastyear'sCOVID-relatedclosuresofVisionCenters,thisyear'svaccineadministrationandbrandeddruginflation
Generalmerchandise +lowsingle-digit
• Lappinglastyear'sstimulus-drivengrowth;Q2salesincreasedmid-teenspercentageonatwo-yearstackedbasis
• Strengthinapparelandtravel-relatedcategoriesascustomersincreasesocialization• Automotivecategoriesbenefitedfromlappinglastyear'sCOVID-relatedclosuresofAuto
CareCenters• SolidstartinBack-to-Schoolcategories

• Positivelyaffectedby20bpsfromdivestitures
• Retainedmarketoperatingexpenserateleveraged65bpsfromstrongsalesgrowthandlappinglastyear'sdiscretetaxitem.OffsetbyimpactofCOVID-relatedsalesrestrictions
• RetainedmarketCOVID-relatedcostswerelowerby~$36mil.andbenefitedleverageby~24bps
• Divestituresaccountedforareductionof$1.7billionYoY
• Increaseincludesstrongsalesgrowththisyearandlappinglastyear'sCOVID-relatedeffectsoninventory
101Seepressreleaselocatedatwww.stock.walmart.comandreconciliationsattheendofpresentationregardingnon-GAAPfinancialmeasures.
Inventory
$9.3+5.5%
Grossprofitrate
-76bpsOperatingincome
$0.9+6.0%
Netsales,constantcurrency1
$20.6-24.0%
Operatingexpenserate
-85bps
Operatingincome,constantcurrency1
$0.7-12.4%
• Negativelyaffectedby35bpsfromdivestitures
• Retainedmarketgrossprofitratedecreased41bpsduetomixshifttolowermarginformats,partiallyoffsetbymarkdownoptimization
Netsales
$23.0-15.2%
WalmartInternational-Q2FY22Dollarsinbillions.Dollarchangesmaynotrecalculateduetorounding.Changeiscalculatedasthechangeversustheprioryearcomparableperiod
• Divestituresaccountedforareductionof$8.9billionYoY
• Retainedmarketgrowthof25.8%
• Divestituresaccountedforareductionof$256millionYoY
• Retainedmarketgrowthof54.9%
• Divestituresaccountedforareductionof$256millionYoY
• Retainedmarketgrowthof27.9%
Adj.operatingincome1
$0.9-3.1%
Adj.operatingincome,constantcurrency1
$0.7-20.0%
• Divestituresaccountedforareductionof$8.9billionYoY
• Retainedmarketgrowthof12.7%:◦ StrongsalesgrowthinFlipkart,
MexicoandChina◦ Lappingtightergovernment-
mandatedrestrictionslastyear,largelyinIndia
◦ eCommercenetsalescontributed19%oftotalnetsales
• Retainedmarketgrowthof12.3%

• SalesofgeneralmerchandiselimitedbyCOVID-relatedrestrictionsonnon-essentialcategories;two-yearstackcompsales+10.4%
• Asrestrictionslifted,Q2endedwithpositiveYoYsalesgrowth
• eCommercenetsales+41%
1WalmexincludestheconsolidatedresultsofMexicoandCentralAmerica2ANTAD-AsociacionNacionaldeTiendasdeAutoservicioyDepartamentales;TheNationalAssociationofSupermarketsandDepartmentStores
11
Walmex1 China Canada
Netsalesgrowth +6.7% +6.0% -3.7%
Comparablesales +5.4% +2.9% -3.6%
Comparabletransactions +7.6% +0.1% +5.2%
Comparableticket -2.1% +2.7% -8.4%
• Growthinapparelandgeneralmerchandise,whilefoodandconsumablesweresofter
• InMexico,compsalesincreased+4.7%
• CompsalesoutpacedANTAD2self-serviceandclub
• MexicoeCommercenetsales+13%
• StrongsalesinSam'sClub,partiallyoffsetbysoftertrafficinHypermarkets
• Sam'sClubdelivereddouble-digitcompsalesgrowthwithnewmembersign-upsmorethandoublingYoY
• eCommercenetsales+75%
WalmartInternational-Q2FY22Resultsarepresentedonaconstantcurrencybasis.Netsalesandcompsalesarepresentedonanominal,calendarbasisandincludeeCommerceresults.Changeiscalculatedasthechangeversustheprioryearcomparableperiod.

• COVID-relatedrestrictionsresultedinnegativesalesgrowth,impactingoperatingcosts,alongwithinvestmentsineCommerce
• HigherpenetrationofSam'sClubloweroperatingexpenseformatandcostdiscipline
• SoftgeneralmerchandisesalesaffectedbyCOVID-relatedrestrictions
1WalmexincludestheconsolidatedresultsofMexicoandCentralAmerica.
12
Walmex1 China Canada
Grossprofitrate SlightIncrease Decrease Decrease
• Changeinmixtohighermargincategoriesalongwithcostofgoodssavingsinitiatives
• ChangeinmixtolowermarginformatsofSam'sClubandeCommerce
Operatingexpenserate SlightIncrease Decrease Increase
Operatingincome$ Increase Increase Decrease
WalmartInternational-Q2FY22Resultsarepresentedonaconstantcurrencybasis.Changeiscalculatedasthechangeversustheprioryearcomparableperiod
• Investmentsinassociates'valueproposition,technology,andeCommerceexpansion,partiallyoffsetbylappinglastyear'sdiscretetaxitem

13
+7.7%Comparablesales
+5.1%Comparabletransactions
+2.5%Averagecomparableticket
~180bpseCommercecontribution
$16,437+8%
Netsales
+12.2%Membershipincome
-29.9999999999998bps
Grossprofitrate
-21.9999999999999bps
Operatingexpenserate
$5759.1%
Operatingincome
WithFuel WithoutFuel
Comparablesales1
+13.9%
Netsales
$18.6+13.9%
eCommercenetsalesgrowth
+27%
Comparablesales
+13.9%
Membershipincome
+12.2%
Grossprofitrate
-88bps
Operatingexpenserate
-82bps
Inventory
$4.8+14.0%
Operatingincome
$0.7+11.5%
• Strongmembershiptrendswithrecordtotalmembercount
• Renewalratesincreasedalmost260bpswithPlusmemberrenewalrateincreasingover455bps
• Pluspenetrationincreasedover755bps,reachinganall-timehigh
• Firstyearmemberrenewalsremainsolid
• Higherfuelsalespositivelyaffectedoperatingexpenseleverage
• Wageinvestmentsandlowertobaccosalessomewhatoffsetthattailwind
• COVID-relatedcostswerelowerby~$80mil.andbenefitedexpenseleverageby~50bps
• Unfavorablefuelmixandlowerfuelratenegativelyimpactedgrossprofit
• Excludingfuel,costinflationandstrategicinvestmentsinpricewerepartiallyoffsetbyfavorablechangesinmix
• Strongcurbsideperformanceandsoliddirect-to-homecontribution
• Strongcompsalesgrowthwithcontributionfrombothtransactionsandticketandabenefitfromstimulusspending
• Onatwo-yearstack,compsalesincreased22.6%
• Broadstrengthacrosscategories,ledbyfood
• Tobacconegativelyaffectedcompsales
1Compsalesforthe13-weekperiodendedJuly30,2021comparedtothe13-weekperiodendedJuly31,2020.
• Increasereflectsinventorybuildtosupporthighersalestrendsandlappinglastyear'sCOVID-relatedeffectsoninventory
Sam'sClub-Q2FY22Dollarsinbillions.Changeiscalculatedasthechangeversustheprioryearcomparableperiod

14
$18,644+13.9%NetSales
+33%eCommercenetsalesgrowth
+13.9%Comparablesales
-87.9999999999999bps
Grossprofitrate
-82bpsOperatingexpenserate
$66011.5%
Operatingincome
WithoutFuel
Netsales
$16.4+7.7%
Operatingexpenserate
-22bps
Grossprofitrate
-30bps
Operatingincome
$0.6+9.1%
Comparabletransactions
+5.1%
Comparablesales1,2
+7.7%
eCommercecontribution
~180bps
Averagecomparableticket
+2.5%
1Compsalesforthe13-weekperiodendedJuly30,2021comparedtothe13-weekperiodendedJuly31,2020,andexcludesfuel.2Tobacconegativelyaffectedcompsalesforthe13-weekperiodendedJuly30,2021by290basispoints.Onatwo-yearstack,tobacconegativelyaffectedcompsalesby680basispoints.
Sam'sClub-Q2FY22Dollarsinbillions.Changeiscalculatedasthechangeversustheprioryearcomparableperiod
• Onatwo-yearstack,averagecompticketincreased6.8%
• Onatwo-yearstack,compsalesincreased21.0%
• Onatwo-yearstack,comptransactionsincreased13.8%
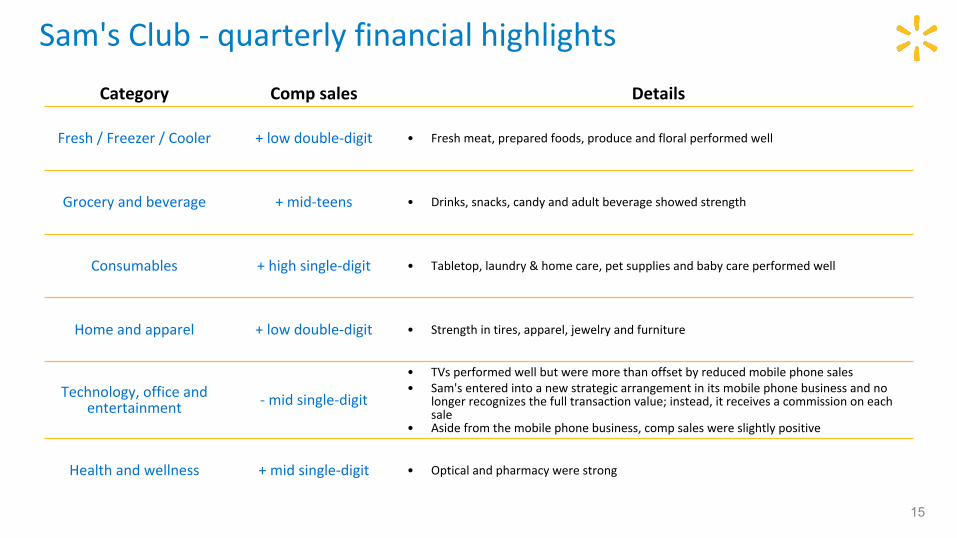
15
Category Compsales Details
Fresh/Freezer/Cooler +lowdouble-digit • Freshmeat,preparedfoods,produceandfloralperformedwell
Groceryandbeverage +mid-teens • Drinks,snacks,candyandadultbeverageshowedstrength
Consumables +highsingle-digit • Tabletop,laundry&homecare,petsuppliesandbabycareperformedwell
Homeandapparel +lowdouble-digit • Strengthintires,apparel,jewelryandfurniture
Technology,officeandentertainment -midsingle-digit
• TVsperformedwellbutweremorethanoffsetbyreducedmobilephonesales• Sam'senteredintoanewstrategicarrangementinitsmobilephonebusinessandno
longerrecognizesthefulltransactionvalue;instead,itreceivesacommissiononeachsale
• Asidefromthemobilephonebusiness,compsaleswereslightlypositive
Healthandwellness +midsingle-digit • Opticalandpharmacywerestrong
Sam'sClub-quarterlyfinancialhighlights

WeincludeReturnonAssets("ROA"),whichiscalculatedinaccordancewithU.S.generallyacceptedaccountingprinciples("GAAP")aswellasReturnonInvestment("ROI")asmeasurestoassessreturnsonassets.ManagementbelievesROIisameaningfulmeasuretosharewithinvestorsbecauseithelpsinvestorsassesshoweffectivelyWalmartisdeployingitsassets.TrendsinROIcanfluctuateovertimeasmanagementbalanceslong-termstrategicinitiativeswithpossibleshort-termimpacts.WeconsiderROAtobethefinancialmeasurecomputedinaccordancewithGAAPthatisthemostdirectlycomparablefinancialmeasuretoourcalculationofROI.
ROAwas4.4percentand7.7percentforthetrailing12monthsendedJuly31,2021and2020,respectively.ThedecreaseinROAwasprimarilyduetothelossesondivestitureofouroperationsintheU.K.,JapanandArgentinaaswellasnetfairvaluechangesinourequityinstruments,partiallyoffsetbytheincreaseinoperatingincome.ROIwas14.8percentand13.5percentforthetrailingtwelvemonthsendedJuly31,2021and2020.TheincreaseinROIwasprimarilyduetotheincreaseinoperatingincome.
WedefineROIasadjustedoperatingincome(operatingincomeplusinterestincome,depreciationandamortization,andrentexpense)forthetrailingtwelvemonthsdividedbyaverageinvestedcapitalduringthatperiod.Weconsideraverageinvestedcapitaltobetheaverageofourbeginningandendingtotalassets,plusaverageaccumulateddepreciationandaverageamortization,lessaverageaccountspayableandaverageaccruedliabilitiesforthatperiod.
OurcalculationofROIisconsideredanon-GAAPfinancialmeasurebecausewecalculateROIusingfinancialmeasuresthatexcludeandincludeamountsthatareincludedandexcludedinthemostdirectlycomparableGAAPfinancialmeasure.Forexample,weexcludetheimpactofdepreciationandamortizationfromourreportedoperatingincomeincalculatingthenumeratorofourcalculationofROI.Asmentionedabove,weconsiderROAtobethefinancialmeasurecomputedinaccordancewithgenerallyacceptedaccountingprinciplesmostdirectlycomparabletoourcalculationofROI.ROIdiffersfromROA(whichisconsolidatednetincomefortheperioddividedbyaveragetotalassetsfortheperiod)becauseROI:adjustsoperatingincometoexcludecertainexpenseitemsandaddsinterestincome;adjuststotalassetsfortheimpactofaccumulateddepreciationandamortization,accountspayableandaccruedliabilitiestoarriveattotalinvestedcapital.Becauseoftheadjustmentsmentionedabove,webelieveROImoreaccuratelymeasureshowwearedeployingourkeyassetsandismoremeaningfultoinvestorsthanROA.AlthoughROIisastandardfinancialmeasure,numerousmethodsexistforcalculatingacompany'sROI.Asaresult,themethodusedbymanagementtocalculateourROImaydifferfromthemethodsusedbyothercompaniestocalculatetheirROI.
16
Non-GAAPmeasures-ROI
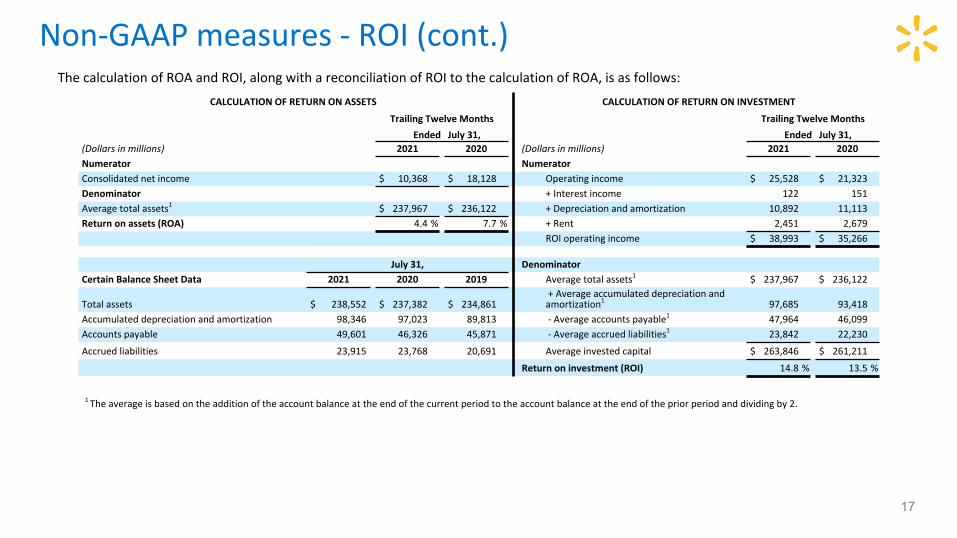
ThecalculationofROAandROI,alongwithareconciliationofROItothecalculationofROA,isasfollows:
17
3 Upon adoption of ASU 2016-02, Leases, a factor of eight times rent is no longer included in the calculation of ROI on a prospective basis as operating lease assets are now recorded on the Consolidated Balance Sheet.
1 The average is based on the addition of the account balance at the end of the current period to the account balance at the end of the prior period and dividing by 2.
2 The average is based on the addition of 'total assets without leased assets, net' at the end of the current period to 'total assets without leased assets, net' at the end of the prior period and dividing by 2, plus 'leased assets, net' at the end of the current period.
3 The average is based on the addition of 'accumulated depreciation and amortization, without leased assets' at the end of the current period to 'accumulated depreciation and amortization, without leased assets' at the end of the prior period and dividing by 2, plus 'accumulated amortization on leased assets' at the end of the current period.
NP = not provided
CALCULATIONOFRETURNONASSETS CALCULATIONOFRETURNONINVESTMENT
TrailingTwelveMonths TrailingTwelveMonths
Ended July31, Ended July31,(Dollarsinmillions) 2021 2020 (Dollarsinmillions) 2021 2020Numerator NumeratorConsolidatednetincome $ 10,368 $ 18,128 Operatingincome $ 25,528 $ 21,323Denominator +Interestincome 122 151Averagetotalassets1 $ 237,967 $ 236,122 +Depreciationandamortization 10,892 11,113Returnonassets(ROA) 4.4% 7.7% +Rent 2,451 2,679
ROIoperatingincome $ 38,993 $ 35,266
July31, DenominatorCertainBalanceSheetData 2021 2020 2019 Averagetotalassets1 $ 237,967 $ 236,122
Totalassets $ 238,552 $ 237,382 $ 234,861'+Averageaccumulateddepreciationandamortization1 97,685 93,418
Accumulateddepreciationandamortization 98,346 97,023 89,813 '-Averageaccountspayable1 47,964 46,099Accountspayable 49,601 46,326 45,871 '-Averageaccruedliabilities1 23,842 22,230
Accruedliabilities 23,915 23,768 20,691 Averageinvestedcapital $ 263,846 $ 261,211
Returnoninvestment(ROI) 14.8% 13.5%
1Theaverageisbasedontheadditionoftheaccountbalanceattheendofthecurrentperiodtotheaccountbalanceattheendofthepriorperiodanddividingby2.
Non-GAAPmeasures-ROI(cont.)

1"Netcashprovidedby(usedin)investingactivities"includespaymentsforpropertyandequipment,whichisalsoincludedinourcomputationoffreecashflow.
18
Wedefinefreecashflowasnetcashprovidedbyoperatingactivitiesinaperiodminuspaymentsforpropertyandequipmentmadeinthatperiod.Wehadnetcashprovidedbyoperatingactivitiesof$12.4billionforthesixmonthsendedJuly31,2021,whichdecreasedwhencomparedto$19.0billionforthesixmonthsendedJuly31,2020primarilyduetoanincreaseininventorypurchasesdueinparttolappingtheimpactofacceleratedinventorysell-throughinthefirsthalfoffiscal2021.Wegeneratedfreecashflowof$7.4billionforthesixmonthsendedJuly31,2021,whichdecreasedwhencomparedto$15.4billionforthesixmonthsendedJuly31,2020duetothesamereasonsasthedecreaseinnetcashprovidedbyoperatingactivities,aswellas$1.5billioninincreasedcapitalexpenditures.
Freecashflowisconsideredanon-GAAPfinancialmeasure.Managementbelieves,however,thatfreecashflow,whichmeasuresourabilitytogenerateadditionalcashfromourbusinessoperations,isanimportantfinancialmeasureforuseinevaluatingthecompany’sfinancialperformance.Freecashflowshouldbeconsideredinadditionto,ratherthanasasubstitutefor,consolidatednetincomeasameasureofourperformanceandnetcashprovidedbyoperatingactivitiesasameasureofourliquidity.Additionally,Walmart’sdefinitionoffreecashflowislimited,inthatitdoesnotrepresentresidualcashflowsavailablefordiscretionaryexpenditures,duetothefactthatthemeasuredoesnotdeductthepaymentsrequiredfordebtserviceandothercontractualobligationsorpaymentsmadeforbusinessacquisitions.Therefore,webelieveitisimportanttoviewfreecashflowasameasurethatprovidessupplementalinformationtoourConsolidatedStatementsofCashFlows.Althoughothercompaniesreporttheirfreecashflow,numerousmethodsmayexistforcalculatingacompany’sfreecashflow.Asaresult,themethodusedbyWalmart’smanagementtocalculateourfreecashflowmaydifferfromthemethodsusedbyothercompaniestocalculatetheirfreecashflow.
Thefollowingtablesetsforthareconciliationoffreecashflow,anon-GAAPfinancialmeasure,tonetcashprovidedbyoperatingactivities,whichwebelievetobetheGAAPfinancialmeasuremostdirectlycomparabletofreecashflow,aswellasinformationregardingnetcashusedininvestingactivitiesandnetcashusedinfinancingactivities.
SixMonthsEndedJuly31,
(Dollarsinmillions) 2021 2020
Netcashprovidedbyoperatingactivities $ 12,423 $ 18,956
Paymentsforpropertyandequipment(capitalexpenditures) (5,019) (3,569)
Freecashflow $ 7,404 $ 15,387
Netcashprovidedby(usedin)investingactivities1 $ 2,402 $ (3,634)
Netcash(usedin)providedbyfinancingactivities (11,559) (7,814)
Non-GAAPmeasures-freecashflow

1Changeversusprioryearcomparableperiod.2WalmartInternationaleCommercenetsaleswere$4.1billionand$8.4billionforthethreeandsixmonthsendedJuly31,2021,andwerepositivelyimpactedby$258millionand$375
millionofcurrencyexchangeratefluctuations,respectively.WalmartInternationaleCommercenetsaleswere$3.3billionand$6.2billionforthethreeandsixmonthsendedJuly31,2020,respectively.
3WalmartInternationaleCommercenetsalesincreased26%onareportedbasisand16%inconstantcurrencyandincreased37%onareportedbasisand30%inconstantcurrencyforthethreeandsixmonthsendingJuly31,2021,respectively.
19
Indiscussingouroperatingresults,thetermcurrencyexchangeratesreferstothecurrencyexchangeratesweusetoconverttheoperatingresultsforcountrieswherethefunctionalcurrencyisnottheU.S.dollarintoU.S.dollars.Wecalculatetheeffectofchangesincurrencyexchangeratesasthedifferencebetweencurrentperiodactivitytranslatedusingthecurrentperiod’scurrencyexchangeratesandthecomparableprioryearperiod’scurrencyexchangerates.Additionally,nocurrencyexchangeratefluctuationsarecalculatedfornon-USDacquisitionsuntilownedfor12months.Throughoutourdiscussion,werefertotheresultsofthiscalculationastheimpactofcurrencyexchangeratefluctuations.Whenwerefertoconstantcurrencyoperatingresults,thismeansoperatingresultswithouttheimpactofthecurrencyexchangeratefluctuations.ThedisclosureofconstantcurrencyamountsorresultspermitsinvestorstobetterunderstandWalmart’sunderlyingperformancewithouttheeffectsofcurrencyexchangeratefluctuations.Thetablebelowreflectsthecalculationofconstantcurrencyfortotalrevenues,netsalesandoperatingincomeforthethreeandsixmonthsendedJuly31,2021.
ThreeMonthsEndedJuly31,2021 SixMonthsEndedJuly31,2021
2021PercentChange1 2021
PercentChange1 2021
PercentChange1 2021
PercentChange1
(Dollarsinmillions) WalmartInternational Consolidated WalmartInternational ConsolidatedTotalrevenues:Asreported $ 23,389 -14.7% $ 141,048 2.4% $ 51,058 -11.1% $ 279,358 2.6%Currencyexchangeratefluctuations (2,426) N/A (2,426) N/A -3,353 N/A -3,353 N/AConstantcurrencytotalrevenues $ 20,963 -23.5% $ 138,622 0.6% $ 47,705 -17.0% $ 276,005 1.3%
Netsales2,3:Asreported $ 23,035 -15.2% $ 139,871 2.2% $ 50,335 -11.6% $ 277,030 2.4%Currencyexchangeratefluctuations (2,397) N/A (2,397) N/A -3,310 N/A -3,310 N/AConstantcurrencynetsales $ 20,638 -24.0% $ 137,474 0.5% $ 47,025 -17.4% $ 273,720 1.2%
Operatingincome:Asreported $ 861 6.0% $ 7,354 21.4% $ 2,055 27.0% $ 14,263 26.4%Currencyexchangeratefluctuations (150) N/A (150) N/A -201 N/A -201 N/AConstantcurrencyoperatingincome $ 711 -12.4% $ 7,204 18.9% $ 1,854 14.6% $ 14,062 24.6%
Non-GAAPmeasures-constantcurrency
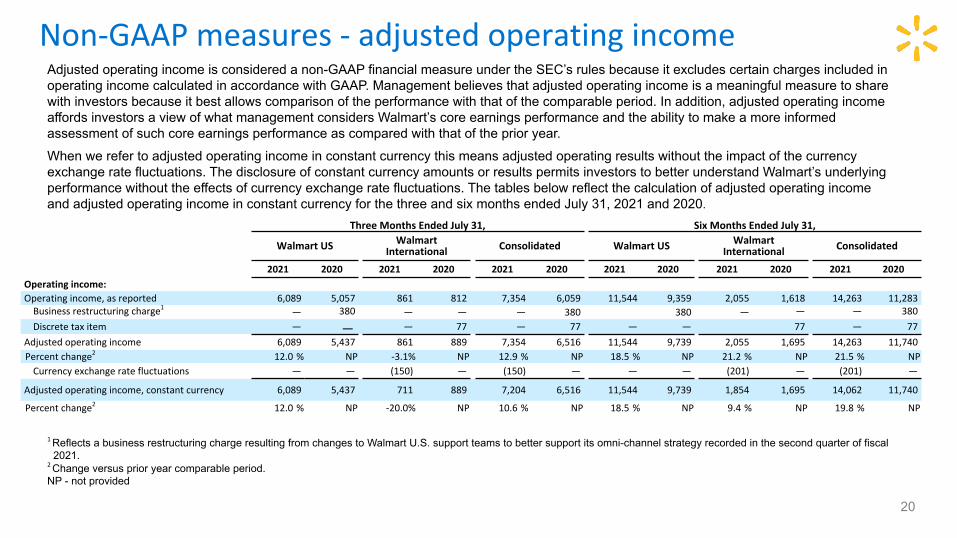
1Reflects a business restructuring charge resulting from changes to Walmart U.S. support teams to better support its omni-channel strategy recorded in the second quarter of fiscal 2021.
2Change versus prior year comparable period.NP - not provided
20
Adjusted operating income is considered a non-GAAP financial measure under the SEC’s rules because it excludes certain charges included in operating income calculated in accordance with GAAP. Management believes that adjusted operating income is a meaningful measure to share with investors because it best allows comparison of the performance with that of the comparable period. In addition, adjusted operating income affords investors a view of what management considers Walmart’s core earnings performance and the ability to make a more informed assessment of such core earnings performance as compared with that of the prior year.
When we refer to adjusted operating income in constant currency this means adjusted operating results without the impact of the currency exchange rate fluctuations. The disclosure of constant currency amounts or results permits investors to better understand Walmart’s underlying performance without the effects of currency exchange rate fluctuations. The tables below reflect the calculation of adjusted operating income and adjusted operating income in constant currency for the three and six months ended July 31, 2021 and 2020.
ThreeMonthsEndedJuly31, SixMonthsEndedJuly31,
WalmartUS WalmartInternational Consolidated WalmartUS Walmart
International Consolidated
2021 2020 2021 2020 2021 2020 2021 2020 2021 2020 2021 2020Operatingincome:Operatingincome,asreported 6,089 5,057 861 812 7,354 6,059 11,544 9,359 2,055 1,618 14,263 11,283Businessrestructuringcharge1 — 380 — — — 380 380 — — — 380
Discretetaxitem — — — 77 — 77 — — 77 — 77
Adjustedoperatingincome 6,089 5,437 861 889 7,354 6,516 11,544 9,739 2,055 1,695 14,263 11,740Percentchange2 12.0% NP -3.1% NP 12.9% NP 18.5% NP 21.2% NP 21.5% NPCurrencyexchangeratefluctuations — — (150) — (150) — — — (201) — (201) —
Adjustedoperatingincome,constantcurrency 6,089 5,437 711 889 7,204 6,516 11,544 9,739 1,854 1,695 14,062 11,740
Percentchange2 12.0% NP -20.0% NP 10.6% NP 18.5% NP 9.4% NP 19.8% NP
Non-GAAPmeasures-adjustedoperatingincome

21
AdjusteddilutedearningspershareattributabletoWalmart(AdjustedEPS)isconsideredanon-GAAPfinancialmeasureundertheSEC’srulesbecauseitexcludescertainamountsincludedinthedilutedearningspershareattributabletoWalmartcalculatedinaccordancewithGAAP(EPS),themostdirectlycomparablefinancialmeasurecalculatedinaccordancewithGAAP.ManagementbelievesthatAdjustedEPSisameaningfulmeasuretosharewithinvestorsbecauseitbestallowscomparisonoftheperformancewiththatofthecomparableperiod.Inaddition,AdjustedEPSaffordsinvestorsaviewofwhatmanagementconsidersWalmart’scoreearningsperformanceandtheabilitytomakeamoreinformedassessmentofsuchcoreearningsperformancewiththatoftheprioryear.
Weadjustfortheunrealizedandrealizedgainsandlossesonourequityinvestmentseachquarterbecausealthoughtheinvestmentsarestrategicdecisionsforthecompany’sretailoperations,management’smeasurementofeachstrategyisprimarilyfocusedontheoperationalresultsratherthanthefairvalueofsuchinvestments.Additionally,managementdoesnotforecastchangesinthefairvalueofitsequityinvestments.Accordingly,managementadjustsEPSeachquarterfortherealizedandunrealizedgainsandlossesrelatedtothoseequityinvestments.
WehavecalculatedAdjustedEPSforthethreeandsixmonthsendedJuly31,2021byadjustingEPSforthefollowing:
1. unrealizedandrealizedgainsandlossesonthecompany’sequityinvestments;and
2. theincrementallossonsaleofouroperationsintheU.KandJapanrecordedduringthefirstquarteroffiscal2022.
Non-GAAPmeasures-adjustedEPS

22
1Changeversusprioryearcomparableperiod.2Calculatedbasedonnatureofitem,includinganyrealizabledeductions,andstatutoryrateineffectforrelevantjurisdictions.Minimalrealizabletaxbenefitwasprovidedinconnectionwiththeincrementallossonsale.
3Thereportedeffectivetaxratewas26.3%and26.5%forthethreeandsixmonthsendedJuly31,2021,respectively.Adjustedfortheaboveitems,theeffectivetaxratewas25.6%and24.5%forthethreeandsixmonthsendedJuly31,2021,respectively.
4QuarterlyadjustmentsoradjustedEPSmaynotsumtoYTDadjustmentsorYTDadjustedEPSduetorounding.
ThreeMonthsEndedJuly31,2021PercentChange1 SixMonthsEndedJuly31,20214
PercentChange1
Dilutedearningspershare:
ReportedEPS $ 1.52 -33.0% $ 2.48 -32.4%
Adjustments:Pre-TaxImpact
TaxImpact2,3
NetImpact
Pre-TaxImpact
TaxImpact2,3
NetImpact
Unrealizedandrealized(gains)andlossesonequityinvestments $ 0.34 $ (0.08) $ 0.26 $ 1.07 $ (0.22) $ 0.85
IncrementallossonsaleofouroperationsintheU.K.andJapan — — — 0.15 — 0.15
Netadjustments $ 0.26 $ 1.00
AdjustedEPS $ 1.78 14.1% $ 3.48 27.0%
Non-GAAPmeasures-adjustedEPS(cont.)

23
AspreviouslydisclosedinoursecondquarterendedJuly31,2020pressrelease,wehavecalculatedAdjustedEPSforthethreeandsixmonthsendedJuly31,2020byadjustingEPSforthefollowing:(1)unrealizedgainsandlossesontheCompany’sequityinvestments;(2)abusinessrestructuringchargeresultingfromchangestocorporatesupportteamstobettersupporttheWalmartU.S.omnichannelstrategy;and(3)adiscretetaxitem.
ThreeMonthsEndedJuly31,2020 SixMonthsEndedJuly31,20204
Dilutedearningspershare:
ReportedEPS $ 2.27 $ 3.67
Adjustments:Pre-TaxImpact
TaxImpact1,2 NCIImpact3 NetImpact
Pre-TaxImpact
TaxImpact1,2 NCIImpact3 NetImpact
Unrealized(gains)andlossesonequityinvestments $ (1.13) $ 0.24 $ — $ (0.89) $ (1.41) $ 0.30 $ — $ (1.11)
Businessrestructuringcharge 0.13 (0.03) — 0.10 0.13 (0.03) — 0.10
Discretetaxitem 0.06 0.05 (0.03) 0.08 0.06 0.05 (0.03) 0.08
Netadjustments $ (0.71) $ (0.93)
AdjustedEPS $ 1.56 $ 2.74
Non-GAAPmeasures-adjustedEPS(cont.)
1Calculatedbasedonnatureofitem,includinganyrealizabledeductions,andstatutoryrateineffectforrelevantjurisdictions.2Thereportedeffectivetaxratewas25.5%and25.1%forthethreeandsixmonthsendedJuly31,2020,respectively.Whenadjustedfortheaboveitems,theeffectivetaxratewas24.8%and24.9%forthethreeandsixmonthsendedJuly31,2020,respectively.3Calculatedbasedontheownershippercentagesofournoncontrollinginterests.4QuarterlyadjustmentsoradjustedEPSmaynotsumtoYTDadjustmentsorYTDadjustedEPSduetorounding.

• Unitcounts&squarefootage• Comparablestoresales,includingandexcludingfuel• Terminology
24
Additionalresourcesatstock.walmart.com