putin’s perilous prolem€¦ · resource development, restrict foreign investment, raise the cost...
TRANSCRIPT

PUTIN’S PERILOUS PROBLEM
Russia’s Troubled Economy
Bob Srenaski


GDP Gross Domestic Product
• The money value of all goods and services produced within a nation’sborders over a specified period of time.
GDP = Consumption + Government + Investment + Exports – Imports
Growth versus Decline = Measures Well-Being of the Economy

Deficits/Surpluses vs National Debt
• Deficits & Surpluses: The amounts by which the national governmentover or under spends the amount of revenue it receives in a year.
• National Debt: The accumulation of annual deficits – the total amount the government owes its creditors.

A Little History
The Soviet Union vs The Russian Federation
The USSR vs Russia Today


A Little Russian Leadership History
• 1917 - Bolshevik Revolution – end of the monarchy
• 1917 – 1924 Vladimir Lenin DIO
• 1924 – 1953 Joseph Stalin DIO
• 1953 – 1955 Georgy Malenkov (forced out by next guy)
• 1955 – 1964 Nakita Krushchev (forced out by party)
• 1964 – 1982 Leonid Brezhnev DIO
• 1982 – 1984 Yuri Andropov DIO
• 1984 – 1985 Konstantin Chernenko DIO

Destruction of the Soviet Union: 1985 - 1991
•Begun by Gorbachev•Finished by Yeltsin
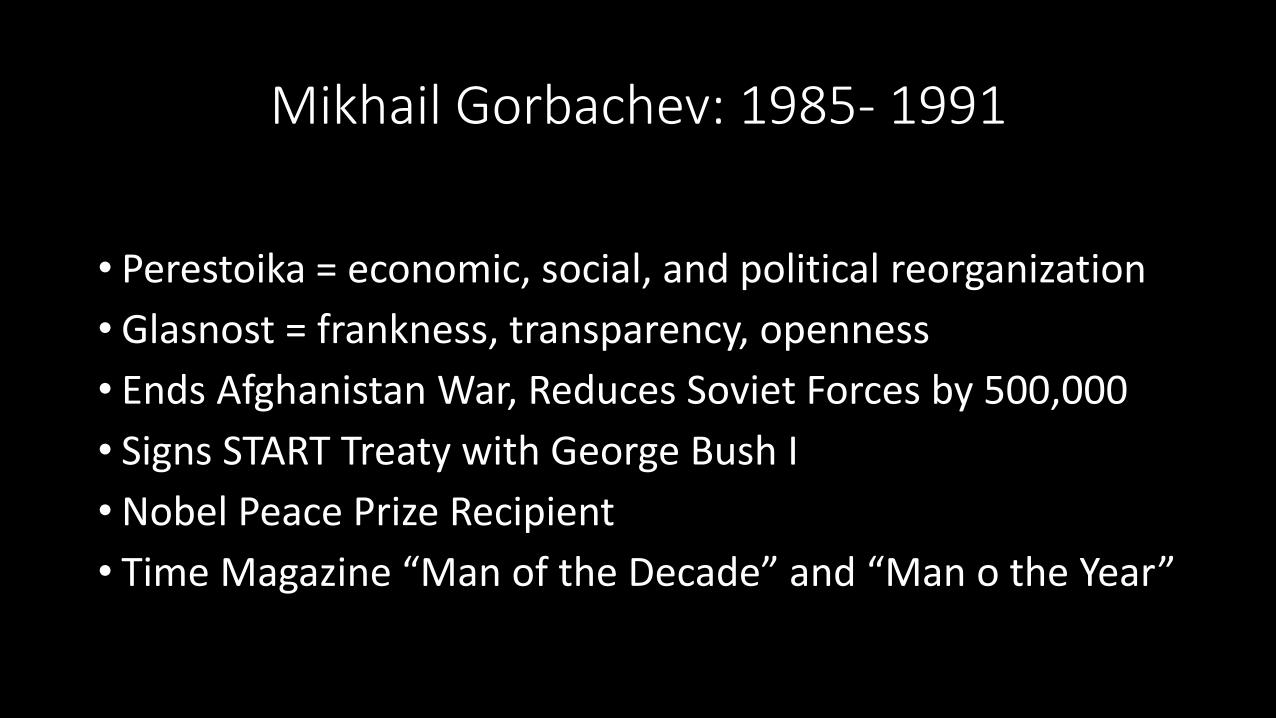
Mikhail Gorbachev: 1985- 1991
• Perestoika = economic, social, and political reorganization
• Glasnost = frankness, transparency, openness
• Ends Afghanistan War, Reduces Soviet Forces by 500,000
• Signs START Treaty with George Bush I
• Nobel Peace Prize Recipient
• Time Magazine “Man of the Decade” and “Man o the Year”
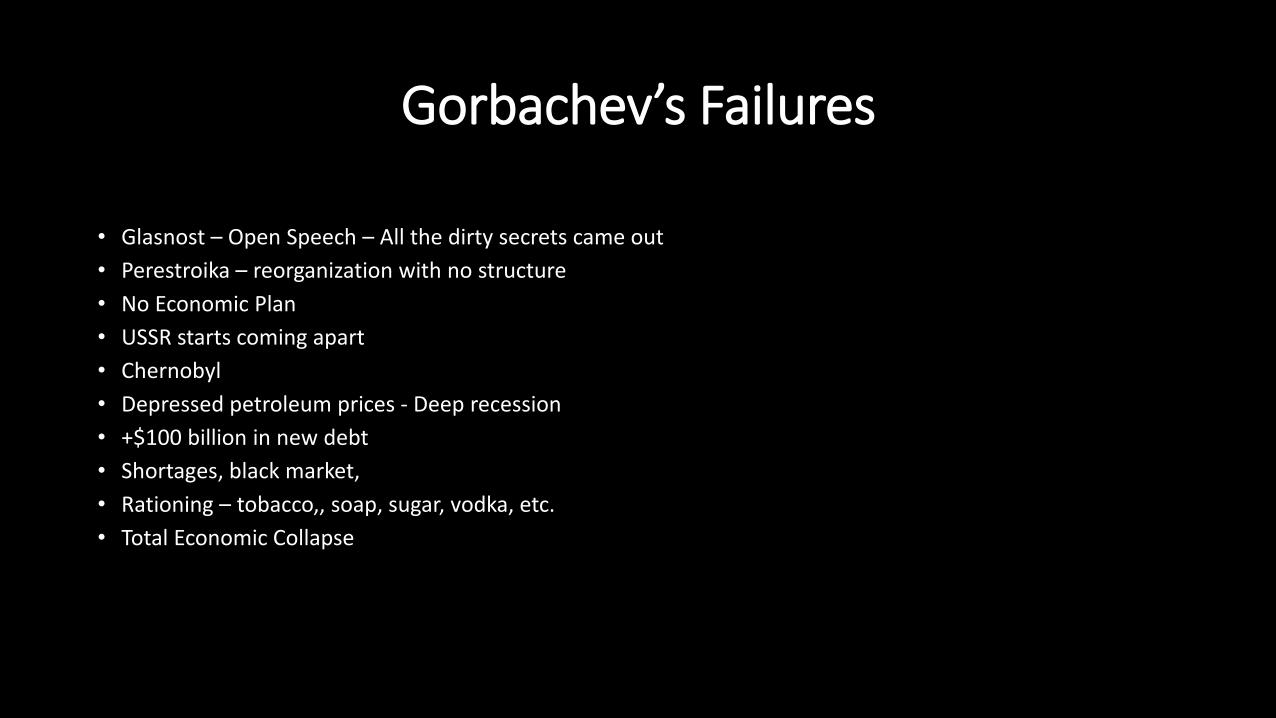
Gorbachev’s Failures
• Glasnost – Open Speech – All the dirty secrets came out
• Perestroika – reorganization with no structure
• No Economic Plan
• USSR starts coming apart
• Chernobyl
• Depressed petroleum prices - Deep recession
• +$100 billion in new debt
• Shortages, black market,
• Rationing – tobacco,, soap, sugar, vodka, etc.
• Total Economic Collapse
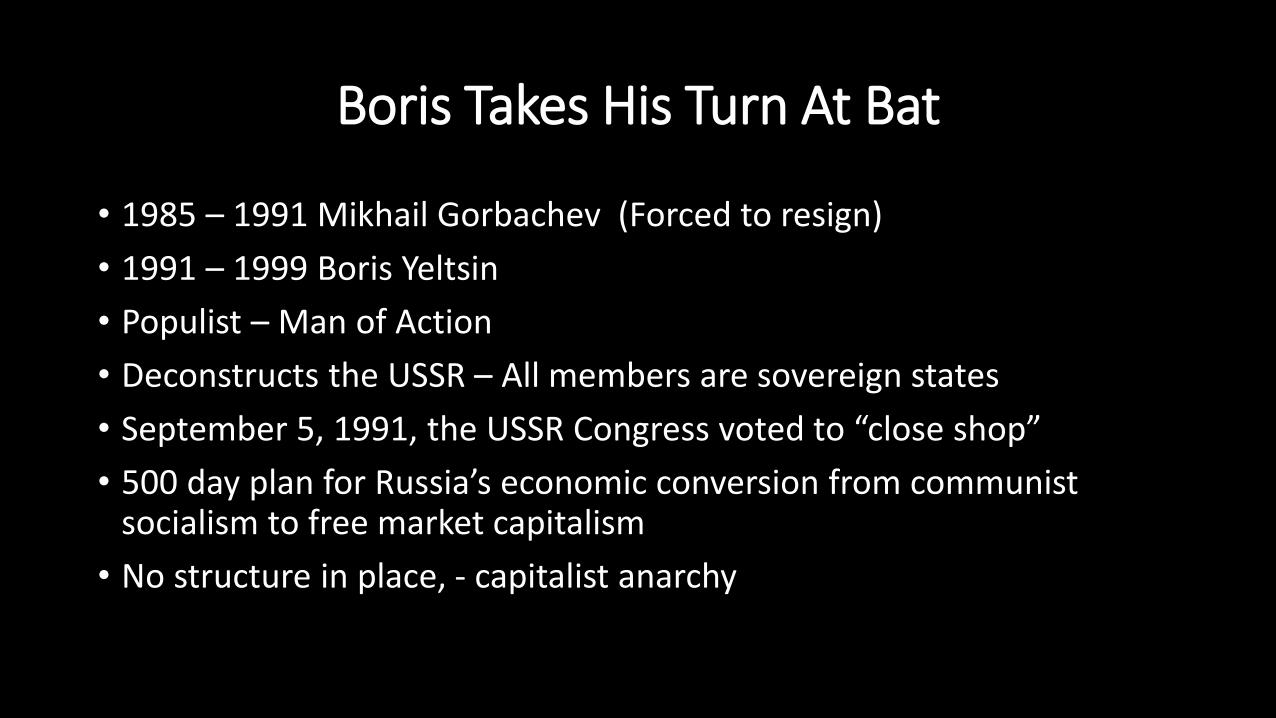
Boris Takes His Turn At Bat
• 1985 – 1991 Mikhail Gorbachev (Forced to resign)
• 1991 – 1999 Boris Yeltsin
• Populist – Man of Action
• Deconstructs the USSR – All members are sovereign states
• September 5, 1991, the USSR Congress voted to “close shop”
• 500 day plan for Russia’s economic conversion from communist socialism to free market capitalism
• No structure in place, - capitalist anarchy

Boris Strikes Out
• “ Free Market” Fails
• 1992 Retail Prices + 2,520 Percent
• 1993 CPI up 840%
• 1993 – 1996 CPI stays in triple digits
• 1991 Crude Oil - $23.54
• 1993 Crude Oil - $13.56
• 1992 GDP – down 15%
• 1993 GDP – Down 9%
• 1994 GDP – Down 14%
• Depression – general misery
• 1999 Resignation


Russia – Largest Country in the World
• USSR 8.1 million sq. mi.• Russia 6.6• Canada 3.8 6,200 mi. East to West• U.S.A. 3.8 2,800 mi. North to South• China 3.7• Brazil 3.3 13,000 mi. Land Borders
23,000 mi. Sea Shore
11% of Earth’s Surface39% of Europe 29% of Asia

Russia has 30% of World’s Natural Resources
• Natural gas – world’s largest reserves, 1st in export, 2nd in production
• Oil – 8th in world reserves, 2nd largest supplier after Saudi Arabia
• Uranium – 3rd largest reserves
• Iron Ore – 1st, 1/6th of the world’s reserves
• Timber – 1/6th of world’s reserves
• Gold – Tied with Australia for 1st
•Coal – 2nd in reserves, 6th in production
• Also, manganese, chromium, nickel, platinum, titanium tungsten, copper, tin, lead, phosphates, diamonds,

Putin as Russian Federation Leader
• August 1999 Appointed Acting Prime Minister by Yeltsen
• Dec 31, 1999 Appointed President
• March 2000 Elected President
• March 2004 Re-elected
• March 2008 Medvedev President, Putin Prime Minister
• Dec 31 2008 Term of President from four to six years
• March 2012 Elected President for six years
• March 2018 Elected for Six More Years

Why Did Putin Become So Popular?“It’s the economy, stupid!”

Putin Gets Lucky

Hooked on Oil & Gas
•52% of Government Revenue (Income)
•68% of Total Exports
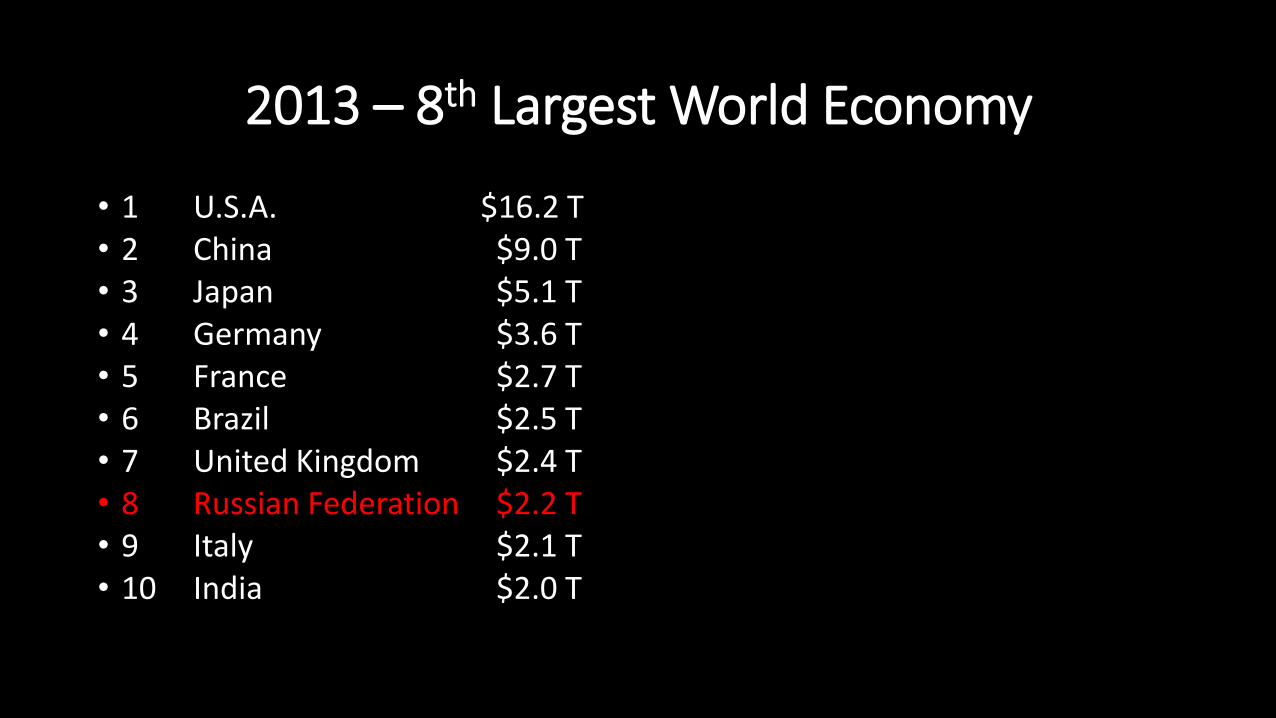
2013 – 8th Largest World Economy
• 1 U.S.A. $16.2 T• 2 China $9.0 T• 3 Japan $5.1 T• 4 Germany $3.6 T• 5 France $2.7 T• 6 Brazil $2.5 T• 7 United Kingdom $2.4 T• 8 Russian Federation $2.2 T• 9 Italy $2.1 T• 10 India $2.0 T

What is missing in this picture?

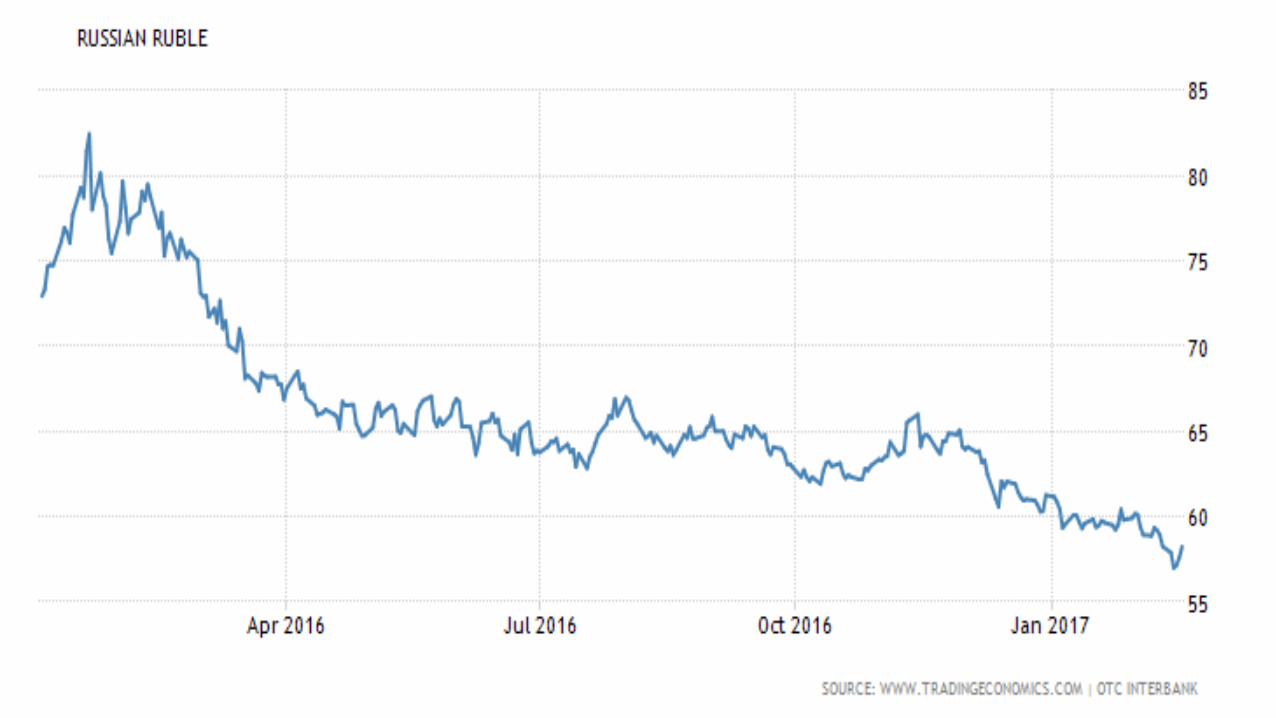
Russia’s Petroleum Dependency Syndrome


Russia vs. France
• Russia = 6.6 million sq. miles
• France= 260,558 sq. miles
• France = 1/25 the physical size of Russia
• France = less than half of Russia’s 143M Population
• Russia GDP = $1.3 Trillion
• France GDP = $2.5 Trillion
• France’s Economy = 2x size of Russian Economy


Non-Oil Economy in Bad Shape

No-Growth Industrial Production

Low Labor Productivity
Russian workers’ GDP contribution: $25.90/hr
•
• Greek Workers’ GDP Contribution: $36.20/hr.
• U.S. Workers’ GDP Contribution: $67.40/hr.

Huge Annual Budget Deficits2016 Fiscal Budget
•Revenue $200 Billion
•Spending $233 Billion
•Deficit $33 Billion


Russia’s Unsustainable Military Spending

Total Government Spending
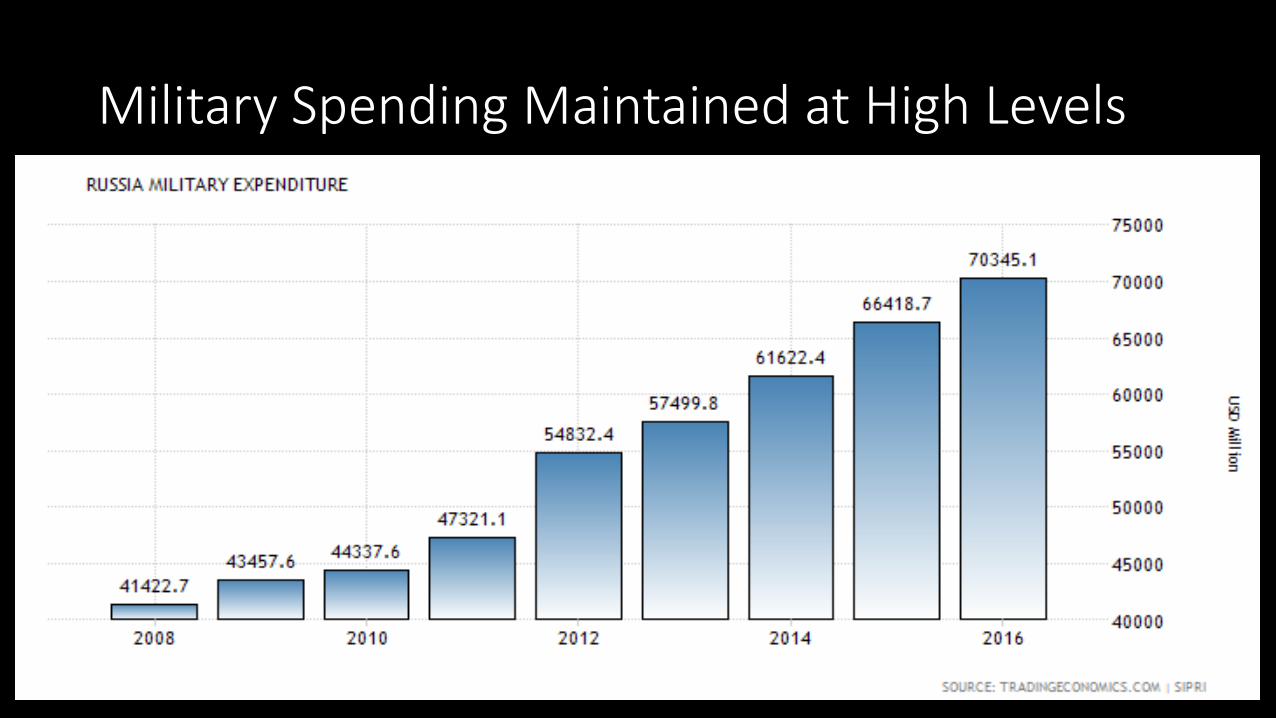
Military Spending Maintained at High Levels
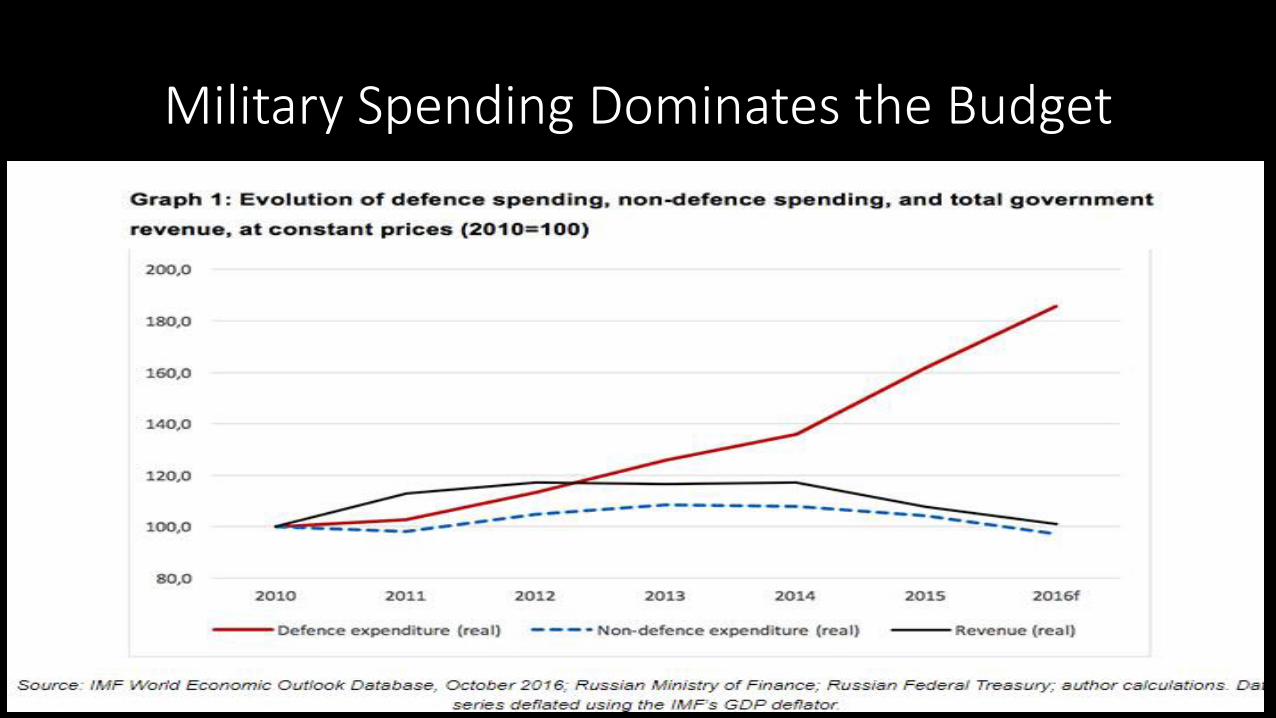
Military Spending Dominates the Budget

Russia’s 2016 Military Budget in Perspective
• Total Government Revenues $200 BillionTotal Military Spending $69.4 Billion
34.7% of 2016 Total Government Revenue
2017 Military Spending Budget: Reduced to $59 Billion


Rampant Corruption at Every Level

Corruption: Robbing the Country
• 48% of GDP consumed by corruption
• $53 Billion/year lost
• Nearly equal to the entire Military Budget
• 2002 – 2011 Russia lost $880 Billion in illicit money outflows
• Source: International Monetary Fund (IMF)

What is an Oligarch?
• Oligarchy: A government in which a small group exercises control especially for corrupt and selfish purposes
• Oligarch: A very rich business leader with a great deal of political influence.

Most Corrupt: Putin and the OligarchsCities with most Billionaires
• 1. Moscow (78)
• 2. New York (62)
• 3. Hong Kong (43)
• 3. London (43)
• 5. Istanbul (37)
• 6. Sao Paulo (26)
• 7. Mumbai (24)
• 8. Seoul (23)
• 9. Beijing (21)
• 10. Dallas (18)
• 10.Paris (18)

Putin’s Wealth
• Says he has:
• Annual Income: $112,000
• One small apartment
• Three Old (Classic) Cars


P

Who is Natalia Veselnitskaya?

Funding the Budget DeficitsLiving off the Past


Living off of Reserve Funds


Sanctions HurtSanctions on state enterprises, Russian businesses, and certain
individuals have negative impact on further petroleum and natural resource development, restrict foreign investment, raise the cost of
money, and generally increase inflation.

2014 Crimea & Ukraine Invasion Sanctions
• Restricts financial access of state-owned enterprises in energy, banking, and defense sectors
• Stops export to Russia of high-tech oil exploration and production equipment – killed the Exon Mobil $500 Billion investment deal
• Stops exports to Russia of military and dual-use goods

Magnitsky Act – Causes & Consequences
• Sergei Magnitsky
• Bill Browder – Hermitage Capital Partners
• Magnitsky Act 2012 Sanctions vs. Russian Individuals & Institutions for Human Rights abuses
• 2014 U.S. Congress issues additional sanctions on Russia for Crimea annexation
• Global Magnitsky Act 2016 Sanctions vs. Individuals & Institutions in any country
• 2017 U.S. Congress passes bill to prevent President from rolling back sanctions without congressional approval (98 to 2 –veto proof)
• Strangles petroleum development
• Increases country’s financial dependence on China

Putin’s People ProblemNot Enough!

Country Growth Requires Population Growth

Russia 9th In Population Size & Declining
Population Yearly Net Fert. Med. Urban
Country -2017 Change Change Rate Age Pop %
1 China 1,388,232,693 0.43% 5,909,361 1.55 37 57.60%
2 India 1,342,512,706 1.18% 15,711,130 2.48 27 32%
3 U.S. 326,474,013 0.73% 2,355,226 1.89 38 82.10%
4 Indonesia 263,510,146 1.12% 2,929,046 2.5 28 53.40%
5 Brazil 211,243,220 0.80% 1,675,300 1.82 31 83.50%
6 Pakistan 196,744,376 2.03% 3,917,874 3.72 23 38.10%
7 Nigeria 191,835,936 2.59% 4,848,373 5.74 18 47.80%
8 Bangladesh 164,827,718 1.18% 1,916,854 2.23 26 34.50%
9 Russia 143,375,006 -0.05% -64,826 1.66 39 73.20%
10 Mexico 130,222,815 1.24% 1,590,811 2.29 27 77.30%
11 Japan 126,045,211 -0.22% -278,504 1.4 47 94.30%


Ratio of Working Age to Above Working Population: Three Scenarios

The 2017 OPEC DealOil Prices Increase

Positive GDP Growth Driven by Oil Price


Major Petroleum Producing CountriesTop Highest OPEC
Rank Producers Mbl/Day Rank Reserves Countries
1 Saudi Arabia 11.75 1 Venezuela Venezuela
2 United States (I) 10.59 2 Saudi Arabia Saudi Arabia
3 Russia 10.3 3 Canada
4 China (I) 4.2 4 Iran Iran
5 Iran 4.1 5 Iraq Iraq
6 Canada 3.9 6 Kuwait Kuwait
7 UAE 3.2 7 UAE UAE
8 Mexico 3.0 8 Russia
9 Brazil 2.8 9 Libya Libya
10 Kuwait 2.8 10 Nigeria Nigeria
indonesia
62.79% of World Petroleum Production Algeria
Qatar
Ecuador
Angola
Gabon

Russia Needs $75 - $80 Oil to Breakeven

Russia Today & Tomorrow

Burden of Ageing and Decreasing Population
• 2010: 3.7 Workers per Senior
• 2050: 1.7 Workers per Senior

Living off its Reserve Funds

Russia’s Economic Future – Steady Decline
• Economy Lacks Diversification
• Industry unproductive
• Large State-Owned Enterprises Dominate
•Not enough SME’s – EU 40% GDP, Russia 15% GDP
•2008-2012 Loss of 300,00 Private Sector Jobs
•2008-2012 State added1.1 million
• Sanctions will continue to hurt

Military Cost Drag on the Economy
Still nearly 1/3 of total government revenues
Cost of War in Syria
Costly Support for “Troops” in Eastern Ukraine
Crimea and Ukraine International Sanctions
Border Protection and National Security Costs

Geographic Challenge – Border ProtectionRussia Shares Borders with Fourteen Countries
• Finland Ukraine•Norway (NATO) Georgia• Estonia (NATO) Azerbaijan• Latvia (NATO) Kazakhstan• Lithuania (NATO) Mongolia •Poland (NATO) North Korea•Belarus China

Ethnic Challenges
• 12-15% Population (16-20 million)= Tartars, Bashkirs, and Chechins
• Those Ethnic groups are Muslim
• Moscow: One Million Muslim residents + 1.5 million migrant Muslim workers
• Moscow is the largest Muslim city in Europe
• Thousands of ISIS fighters returning home

Russia’s Economic Future – Steady Decline
• Military, too costly, wasteful, and corrupt
• Sanctions hurt
• Soverign Funds Being Depleted
• Corruption Continues – Oligarchs Laundering Money
• Well educated Russians leaving in droves
• Bad Demographics – Population Declining
• Steep decrease in working age population
• No incentive to change – Putin very popular still


What will happen to petroleum prices?

It’s About the Middle East, Russia & Oil
• U.S. Government International Influence
• U.S. Isolationism
• Russian Expansionism
• Russia’s Growing Mid-East Influence
• Stability of the OPEC – Russia Petroleum Alliance
• The Growth of U.S. Oil Production
• It’s the Price Per Barrel, Stupid!

What can we expect from Russia in the Future ?
• Strong influence in the Middle East
• Troublemaking in other places depending upon oil prices
• Possible low level invasive challenge to NATO
• Increasing cooperation and support of authoritarian governments, Hungary, Egypt, Turkey, Poland, Syria, Saudi Arabia,
• Continuous cyber attacks to provoke tribalism
• zzzzzzzzzzz

Cyber Warfare - DAMM• Disruptive
• Antagonistic
• Manipulative
• Media

The Future – What to Expect
• The Russian Bear will continue to be Troublesome
and Dangerous – Cyber Warfare, but not Suicidal!
•P.S. Keep your eyes on oil prices & China

•QUESTIONS?


ssia


Composition Russia’s Economy (GDP)
GDP - composition by sector:
agriculture: 4.4%industry: 35.8%services: 59.7% (2015 est.)

Nine Countries Have Nuclear Weapons


Armaments – USA – Russia – China
Land USA Russia China
Tanks 5,884 20,216 6,457
AFV Vehicles 41,062 31,298 4,788
SPG (Guns) 1,934 5,972 1,710
Towed Artil 1,299 4,625 6,246
ML Rockets 1,331 3,793 1,770
Air
Total Arcrft 13,762 3,794 2,955
Fighters 2,296 806 1,271
FW Attack 2,785 1,438 1,385
Atk Hlo 947 490 206
Sea
Total Naval 415 352 714
Carriers 19 1 1
Destroyers 63 15 35
Subs 70 63 68
Def Budget $587.8 BN $44.6 BN $161.7 BN

“Love Money Makes the World Go Round”
Peace - Prosperity - Complacency
Greed – Corruption
Corruption – Corrosion
• Corrosion – Destruction
• Destruction - Authoritarianism

Russia’s Top 15 Export Customers (2015)• Netherlands: US$38.7 billion (11.6% of total Russian exports)
• China: $27.3 billion (8.2%)
• Germany: $24.6 billion (7.4%)
• Italy: $21.8 billion (6.5%)
• Turkey: $19.1 billion (5.7%)
• Belarus: $15 billion (4.5%)
• Japan: $14.2 billion (4.3%)
• South Korea: $13.1 billion (3.9%)
• Kazakhstan: $10.5 billion (3.1%)
• Poland: $9.5 billion (2.9%)
• United States: $9.4 billion (2.8%)
• Ukraine: $9.1 billion (2.7%)
• United Kingdom: $7.5 billion (2.2%)
• Finland: $7 billion (2.1%)
• Latvia: $6.9 billion (2.1%)
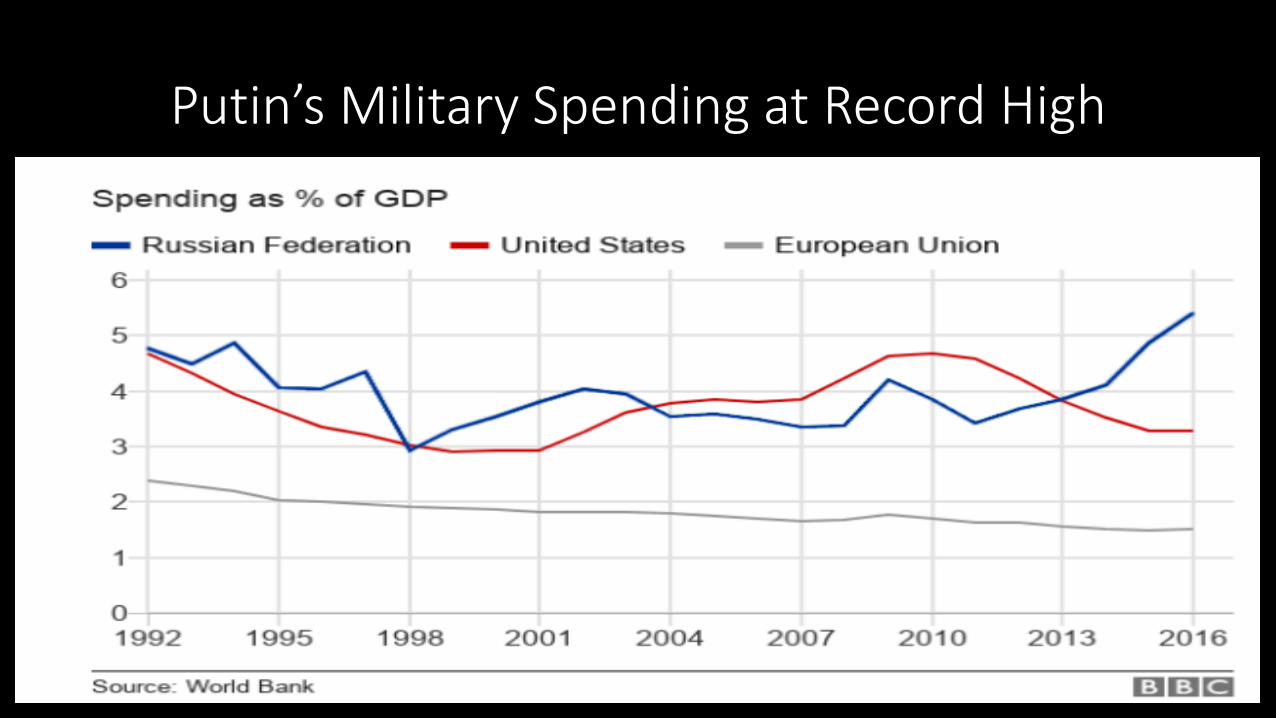
Putin’s Military Spending at Record High