purpose and history of nebraska 21st
TRANSCRIPT

–––––––––––––––––––––––––––––––––––––––––––––––––––––––––––––––––––––––––––––––––––––––––––––– 1®
The 21st Century Community LearningCenters (21st CCLC) is a federally funded,competitive grant program designed tosupport the establishment of communitylearning centers serving studentsattending schools with high needs. TheNebraska Department of Education (NDE)administers these grants to offer studentsa broad array of services, programs, andactivities during non-school hours, orperiods when school is not in session(such as before- and afterschool or duringsummer recess).
In 1998, the 21st CCLC initiative wasauthorized under Title IV, Part B of theElementary and Secondary Education Act(ESEA). The No Child Left Behind (NCLB)Act of 2001 amended the initiative andtransferred the administration to statedepartments of education.
The three overarching goals of this grantprogram are to: 1) improve studentlearning performance in one or more coreacademic areas; 2) improve student socialand behavioral skills; and 3) increasefamily and community engagement insupporting students’ education. Centersmay provide a variety of services to
achieve these goals, including remedialeducation and academic enrichmentlearning programs, tutoring and mentoringservices, services for English LanguageLearning students, technology educationprograms, programs that promoteparental involvement and family literacy,drug and violence prevention programs,and counseling programs, among otherservices.
Further information on 21st CenturyCommunity Learning Centers is availablethrough the United States Department ofEducation. For more information aboutthe Nebraska 21st Century CommunityLearning Centers grant program, call theoffice at 402-471-0876 or visit the website at http://www.education.ne.gov/21stcclc. The US Department of Educationwebsite is located at http://www.ed.gov/programs/21stcclc/index.html.
Purpose and History of Nebraska 21stCentury Community Learning Centers

® 2 21st Century Community Learning Centers – 2012/13 Evaluation Report ––––––––––––––––––––––––––––––––––––––––––
The purpose of the 21st CCLC programevaluation is to provide: (a) descriptiveinformation regarding the implementationof these programs, (b) process data thatwill assist the project staff in continuallyimproving the quality of services to thestudents and their families, (c) outcomedata that will assist the programs indetermining the extent to which theprogram achieved its anticipatedoutcomes, and (d) required data to meetthe federal NCLB, Title IVB programrequirements. The evaluation was andwill continue to be accomplished bycollecting data across multiple sourcesand forms using both qualitative andquantitative approaches.
The evaluation design is based upon autilization-focused approach (Patton, 2012)and utilizes the same continuousimprovement model developed by theNebraska Department of Education forschool improvement planning. (http://www.education.ne.gov/CIPToolkit/).
Continuous ImprovementProcessThe overall design of the 21st CCLC GrantProgram utilizes targeted academic andsocial/behavioral supports in beforeschool, afterschool, out-of-school days (full
days during the school year when schoolis not in session), and summer school of-ferings. Local programs develop theirown models to suit local needs, but mustmeet or exceed the parameters estab-lished in the grant application from NDE.Programs must base their model on localneeds assessment data, describe curricu-lar and evaluation approaches, and partici-pate in a comprehensive, continuousimprovement evaluation process. Pro-grams select an external local evaluator tosupport their evaluation and continuousimprovement process efforts. Programsare required to develop a core local man-agement team, with recommended mem-bership to include the project director,building principal, local evaluator, andother key stakeholders.
The NDE 21st CCLC management teamidentified the elements of a quality after-school program and began to incorporatethem into the continuous improvementprocess for local programs beginning in2007. Each year local evaluation data is
Evaluation Purpose

–––––––––––––––––––––––––––––––––––––––––––––––––––––––––––––––––––––––––––––––––––––––––––––– 3®
submitted by June 15. The externalstatewide evaluator analyzes, verifies theaccuracy of the submitted data, and devel-ops “Continuous Improvement ProcessData Snapshots” for each program. Indi-cators of quality were established on tar-geted data process areas (such as 90%return rates or greater on teacher, parentand student surveys) and on outcomeareas (such as ratings of 3.50 or greateron observation domain categories). Thesesnapshots include site level outcomes,grant program level outcomes, districtlevel outcomes, and state level outcomes.The snapshot provides a summary ofeach school site’s data outcomes and theoverall program’s data outcomes com-pared to state outcomes.
Each year, during the months of Augustand September, the NDE 21st CCLC man-agement team meets with managementteams of grantees in year one. The pur-pose of these meetings is to review theCIP Data Snapshot with the local manage-ment teams and facilitate discussions onlocal plans to improve programs. Granteemanagement teams completing yearstwo, three, or five, meet with externallocal evaluators to complete the same CIPprocess. These management teams thenwork together to complete ContinuousImprovement Process Meeting Sum-maries that identify an area of strengthand an area for improvement. Each localmanagement team then implements theaction plans proposed to improve theirprogram. Data are then collected in thesubsequent year to measure program im-provement.
Technical Assistance and Professional Development. NDE provided technical assistance and professional developmentactivities for grantees in order to facilitatetheir continuous improvement. An ongo-ing technical assistance plan was devel-oped based on the review of research onbest practice for afterschool programs,the statewide evaluation findings, and dis-cussions at each project’s continuous im-provement process meeting. Monthlyelectronic newsletters are sent to allgrantees and posted online. Monthlygrant management and evaluation confer-ence calls are held with project directors.The recordings and conference notes areposted online where others can accessand review them, if they were unable tojoin the monthly call. When requested,resources were provided and some fol-low-up site visits occurred for programsupport in areas identified. A passwordprotected e-learning system, My21stCCLC,was utilized for data collection, grant man-agement, communication, and provisionof technical assistance. All of the Ne-braska project directors were required toattend the Nebraska project director an-nual meeting in September. New grantadministrators were provided with year-long outreach on the basics of grantsmanagement and evaluation. Technical as-sistance was offered to the new and vet-eran project directors on relevant topicsincluding program planning and imple-mentation, operation of an effective pro-gram, collaboration with families andcommunity partners and alignment toschool-day learning objectives. Vehiclesfor the delivery of technical assistance included both face-to-face meetings and

® 4 21st Century Community Learning Centers – 2012/13 Evaluation Report ––––––––––––––––––––––––––––––––––––––––––
technology (e.g., site visits, monthly webi-nars, regional workshops, formation ofthe Middle School Network).
To assist projects in their continuous im-provement process, the 21st CCLC statemanagement team developed The 21stCCLC Elements of Quality, aligning the el-ements with the observation tool used byevaluators. A website for grantees wasorganized with resources available in eachof the domains on the observation tooland the Elements of Quality.
A major professional development initia-tive during the 2011-12 and 2012-2013school years focused on building interestand expertise in teaching and learningSTEM content (Science, Technology, Engi-neering, and Mathematics). In the sum-mer of 2011, the Nebraska 21st CCLCprogram received a four year Summer ofInnovation Cooperative Agreement fromthe National Aeronautics & Space Admin-istration (NASA). This initiative is titledNebraska BLAST! (Building Lasting After-school STEM Teams) and targeted op-tional programming to traditionallyunderrepresented youth in grades 4-8.Content themes included Robotics, Avia-tion and Aeronautics, and Cosmic Con-nections to the Universe. NebraskaBLAST! was implemented through part-nerships with the University of Nebraskaand NASA Nebraska Space Grant. The Ne-braska BLAST! program provided ongoingregional professional development forteachers and afterschool staff who thenpartnered to implement the content intheir 21st CCLC sites. Professional devel-opment provided was focused on building
expertise to teach STEM content, accessand utilize NASA resources, build commu-nity and statewide partnerships, and mostimportantly strengthen collaborative work-ing relationships between afterschoolstaff and classroom teachers.
Summary of data collection systemsSite level data were collected in Microsoft© Access databases developedfor each grantee and disseminated by thestatewide evaluator. Data were also col-lected in the federal web-based data col-lection system Profile and PerformanceInformation Collection Systems (PPICS)and in annual Continuous ImprovementProcess Summaries including action planssubmitted by grantees.
Program EvaluationFindingsProgram evaluation of the 21st CCLCprograms includes examining progress onfour outcomes. These outcomes includemeasured quality of these programs,student achievement, observed changesin student social or behavioral patterns,and changes in family or communitysupport of student learning.
–––––––––––––––––––––––––––––––––––––––––––––––––––––––––––––––––––––––––––––––––––––––––––––– 5®
Description ofGrantees, Sites, andStudents Served
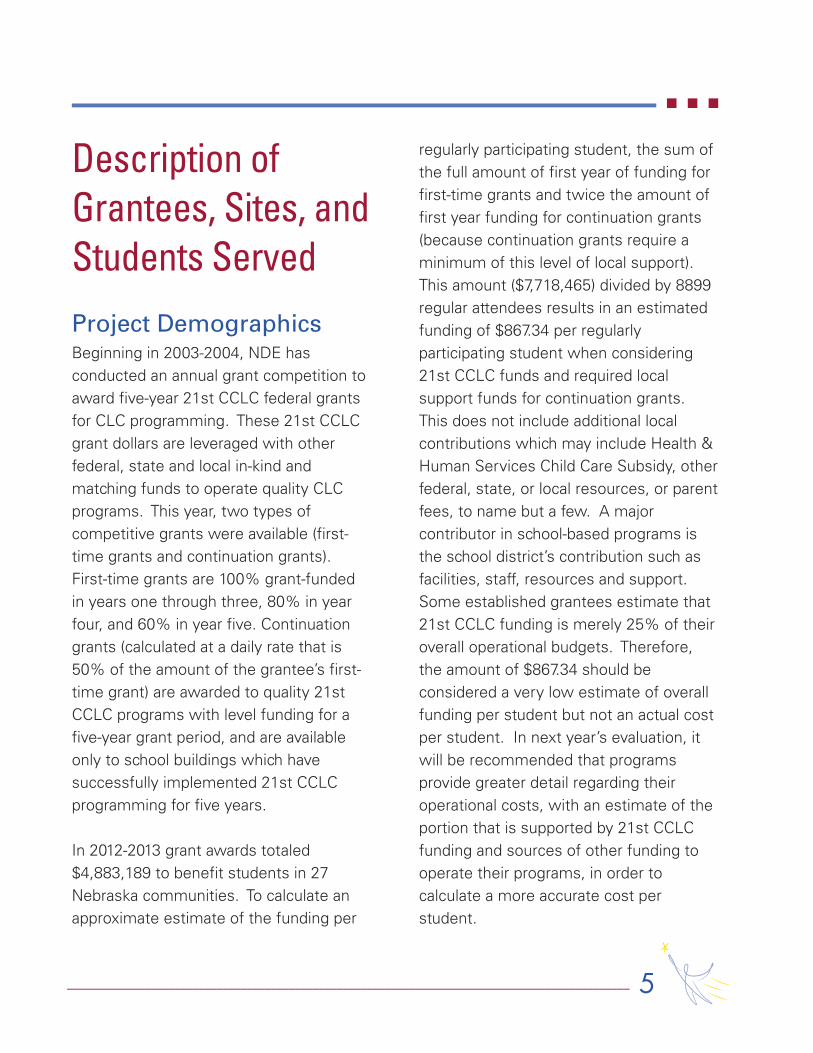
Project Demographics Beginning in 2003-2004, NDE hasconducted an annual grant competition toaward five-year 21st CCLC federal grantsfor CLC programming. These 21st CCLCgrant dollars are leveraged with otherfederal, state and local in-kind andmatching funds to operate quality CLCprograms. This year, two types ofcompetitive grants were available (first-time grants and continuation grants).First-time grants are 100% grant-fundedin years one through three, 80% in yearfour, and 60% in year five. Continuationgrants (calculated at a daily rate that is50% of the amount of the grantee’s first-time grant) are awarded to quality 21stCCLC programs with level funding for afive-year grant period, and are availableonly to school buildings which havesuccessfully implemented 21st CCLCprogramming for five years.
In 2012-2013 grant awards totaled$4,883,189 to benefit students in 27Nebraska communities. To calculate anapproximate estimate of the funding per
regularly participating student, the sum ofthe full amount of first year of funding forfirst-time grants and twice the amount offirst year funding for continuation grants(because continuation grants require aminimum of this level of local support).This amount ($7,718,465) divided by 8899regular attendees results in an estimatedfunding of $867.34 per regularlyparticipating student when considering21st CCLC funds and required localsupport funds for continuation grants.This does not include additional localcontributions which may include Health &Human Services Child Care Subsidy, otherfederal, state, or local resources, or parentfees, to name but a few. A majorcontributor in school-based programs isthe school district’s contribution such asfacilities, staff, resources and support.Some established grantees estimate that21st CCLC funding is merely 25% of theiroverall operational budgets. Therefore,the amount of $867.34 should beconsidered a very low estimate of overallfunding per student but not an actual costper student. In next year’s evaluation, itwill be recommended that programsprovide greater detail regarding theiroperational costs, with an estimate of theportion that is supported by 21st CCLCfunding and sources of other funding tooperate their programs, in order tocalculate a more accurate cost perstudent.

® 6 21st Century Community Learning Centers – 2012/13 Evaluation Report ––––––––––––––––––––––––––––––––––––––––––
Student Demographics A total of 16,121 students were served inout of school time (before-, after-, out ofschool days, or in summer school) in 2012-13 across funded 21st CCLC sites.Of those, 8,899 were regular attenders in
funded 21st CCLC programs (55% of totalstudents). Generally, the number ofstudents served and those regularlyserved have steadily increased over thepast 10 years.
2007-08 2008-09 2009-10 2010-11 2011-12 2012-13
20000
15000
10000
5000
0
Total # of Students Total # of Regular Attenders
Figure 1
The following map provides a summary of the communities served in the 21st CCLCprogram for 2012-2013.
–––––––––––––––––––––––––––––––––––––––––––––––––––––––––––––––––––––––––––––––––––––––––––––– 7®
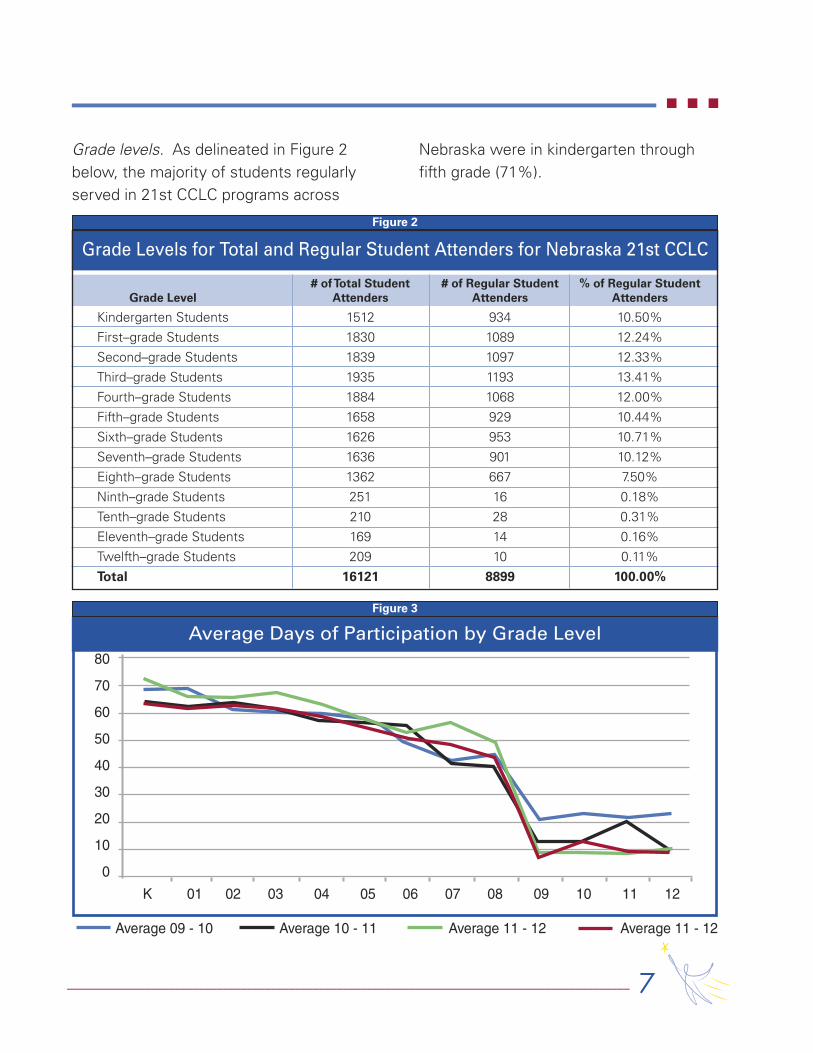
Grade levels. As delineated in Figure 2below, the majority of students regularlyserved in 21st CCLC programs across
Nebraska were in kindergarten throughfifth grade (71%).
Grade Levels for Total and Regular Student Attenders for Nebraska 21st CCLC
# of Total Student # of Regular Student % of Regular StudentGrade Level Attenders Attenders Attenders
Kindergarten Students 1512 934 10.50%First–grade Students 1830 1089 12.24%Second–grade Students 1839 1097 12.33%Third–grade Students 1935 1193 13.41%Fourth–grade Students 1884 1068 12.00%Fifth–grade Students 1658 929 10.44%Sixth–grade Students 1626 953 10.71%Seventh–grade Students 1636 901 10.12%Eighth–grade Students 1362 667 7.50%Ninth–grade Students 251 16 0.18%Tenth–grade Students 210 28 0.31%Eleventh–grade Students 169 14 0.16%Twelfth–grade Students 209 10 0.11%Total 16121 8899 100.00%
Figure 2
Average Days of Participation by Grade Level
K 01 02 03 04 05 06 07 08 09 10 11 12
80
70
60
50
40
30
20
10
0
Average 09 - 10 Average 10 - 11 Average 11 - 12 Average 11 - 12
Figure 3

® 8 21st Century Community Learning Centers – 2012/13 Evaluation Report ––––––––––––––––––––––––––––––––––––––––––
Participation by Grade Level. Theparticipation of different grade levelgroups was examined. Figure 3 depictsaverage days of participation by gradelevel across all students who enrolled in21st CCLC programs from 2009 through2013. Participation generally declined bygrade level. The explanation for thedecline is unknown. Professionaldevelopment efforts (such as NebraskaBLAST!) have not yielded the increase inparticipation rates hoped for at the oldergrade levels. Therefore, furtherexploration will need to occur todetermine the reasons for this trend.
Ethnicity. The 21st CCLC programsserved a diverse group of children andyouth. The majority of students served(57%) were from an ethnic minoritycategory (see Figure 4 below).
Gender. Forty-eight percent (48%) of the
regular attenders were female and 52%were male.
Eligibility for Free/Reduced Lunch.Seventy-two percent (72%) of the regularattenders were eligible for free or reducedlunch. This is a significantly greaterpercentage compared to all of Nebraska’sschools (43.79%, data source is NDEState of the Schools Report, 2011-12).
Eligibility for Other School Services.Almost 16 percent (15.85%) of the regularattenders were English LanguageLearners. NDE State of the SchoolsReport (SOSR) data indicates that 6.47%of students in Nebraska’s schools wereidentified as English Language Learners(2011-12 SOSR). About 18 percent(18.3%) of regular attenders were verifiedfor special education, compared to15.03% across Nebraska’s schools (2011-12 SOSR).
Ethnicity for Regular Student Attenders for Nebraska 21st CCLC
# of Regular Student % of Regular StudentEthnicity Attenders Attenders
American Indian/Alaska Native 551 6.2%Asian/Pacific Islander 202 2.3%Black/African American 1474 16.6%Hispanic/Latino 2396 26.9%White 3874 43.5%Multiple 402 4.5%Total 8899 100.0%
Figure 4
–––––––––––––––––––––––––––––––––––––––––––––––––––––––––––––––––––––––––––––––––––––––––––––– 9®
Quality of 21st CCLC Programs
Quality programs have been linked toimmediate, positive developmentaloutcomes, as well as long-term positiveacademic performance (Beckett,Capizzano, Parsley, Ross, Schirm, & Taylor,2009; Burchinal, Peisner-Feinberg, Bryant,and Clifford, 2000).
Observations of Program Quality. TheObservations for Quality After SchoolProgramming tool was developed by thestatewide evaluator and used for programobservations for the past eight years.Each year, the statewide evaluatorobserves all Year 1, Year 5, and anyprograms for which a new local evaluatoris retained. Local evaluators are trainedon utilizing the observation tool and inter-rater reliability is ensured through aprocess of comparing scores post-observation. Local evaluators are deemedreliable when they match within theprescribed intervals 85% or more of thetime.
This year the statewide evaluatorcompleted first year grant siteobservations and local evaluators withdemonstrated reliability independently
completed observations of Years 2, 3, 4,and 5 grantees. Continuation grantobservations were generally completedby local evaluators, unless there was asignificant change in project directorand/or local evaluator. The observation toolmeasures outcomes in overalladministration of the program,interactions among students and staff,support for family involvement andengagement, linkages between theschool and community, generalenvironment of the program, andobserved program content (e.g.,homework, language, mathematics,science, fine and dramatic arts,recreational activities).
Because programs have beenapproaching the ceiling of quality, the toolcontinues to offer only limited usefulnessto programs. Therefore, this year anoptional tool was piloted and this will bediscussed in the next section of thereport. Those sites that piloted the newtool were allowed to use the currentobservation tool as a self-assessment.Generally, those who completed self-assessments earned ratings very similarto what they scored when they weredirectly observed.
Programs were found to be of highquality. A total of 101 school sites wereobserved or self-assessed in the winter.
® 10 21st Century Community Learning Centers – 2012/13 Evaluation Report––––––––––––––––––––––––––––––––––––––––
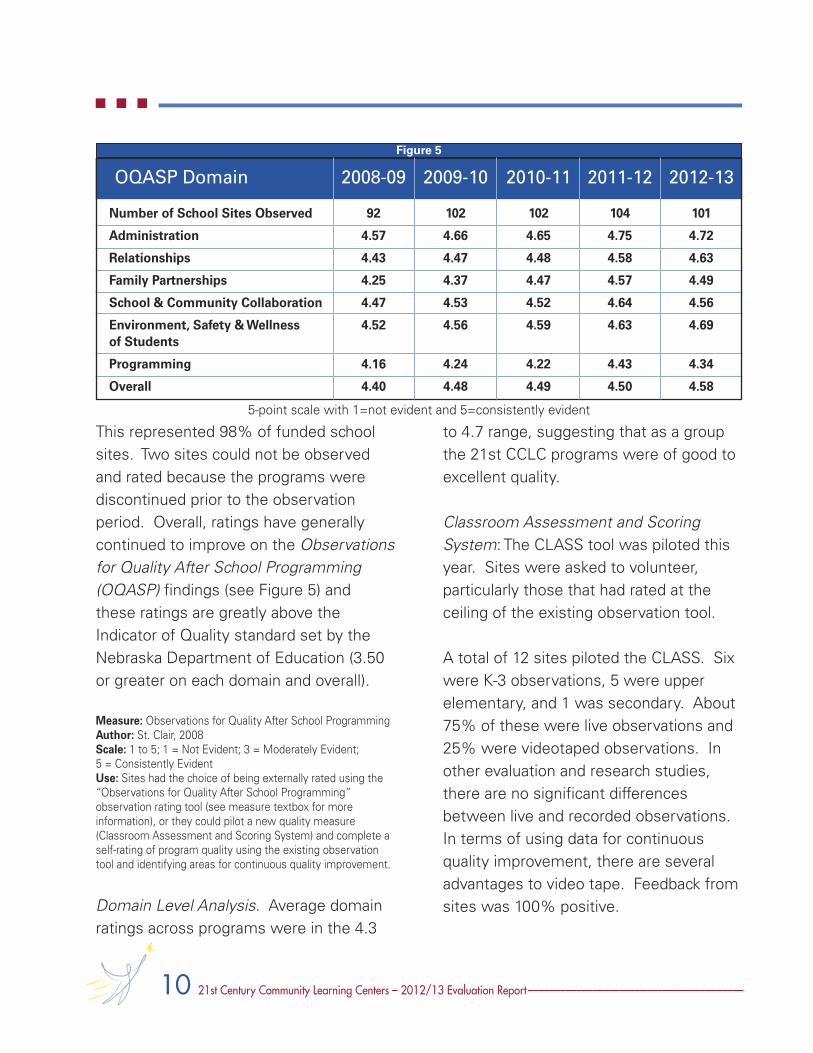
This represented 98% of funded schoolsites. Two sites could not be observedand rated because the programs werediscontinued prior to the observationperiod. Overall, ratings have generallycontinued to improve on the Observationsfor Quality After School Programming(OQASP) findings (see Figure 5) andthese ratings are greatly above theIndicator of Quality standard set by theNebraska Department of Education (3.50or greater on each domain and overall).
Measure: Observations for Quality After School ProgrammingAuthor: St. Clair, 2008Scale: 1 to 5; 1 = Not Evident; 3 = Moderately Evident; 5 = Consistently EvidentUse: Sites had the choice of being externally rated using the“Observations for Quality After School Programming”observation rating tool (see measure textbox for moreinformation), or they could pilot a new quality measure(Classroom Assessment and Scoring System) and complete aself-rating of program quality using the existing observationtool and identifying areas for continuous quality improvement.
Domain Level Analysis. Average domainratings across programs were in the 4.3
to 4.7 range, suggesting that as a groupthe 21st CCLC programs were of good toexcellent quality.
Classroom Assessment and ScoringSystem: The CLASS tool was piloted thisyear. Sites were asked to volunteer,particularly those that had rated at theceiling of the existing observation tool.
A total of 12 sites piloted the CLASS. Sixwere K-3 observations, 5 were upperelementary, and 1 was secondary. About75% of these were live observations and25% were videotaped observations. Inother evaluation and research studies,there are no significant differencesbetween live and recorded observations.In terms of using data for continuousquality improvement, there are severaladvantages to video tape. Feedback fromsites was 100% positive.
5-point scale with 1=not evident and 5=consistently evident
OQASP Domain 2008-09 2009-10 2010-11 2011-12 2012-13
Number of School Sites Observed 92 102 102 104 101
Administration 4.57 4.66 4.65 4.75 4.72
Relationships 4.43 4.47 4.48 4.58 4.63
Family Partnerships 4.25 4.37 4.47 4.57 4.49
School & Community Collaboration 4.47 4.53 4.52 4.64 4.56
Environment, Safety & Wellness 4.52 4.56 4.59 4.63 4.69of Students
Programming 4.16 4.24 4.22 4.43 4.34
Overall 4.40 4.48 4.49 4.50 4.58
t t
Figure 5

–––––––––––––––––––––––––––––––––––––––––––––––––––––––––––––––––––––––––––––––––––––––––– 11®
Results (see Figure 6) showed that 21stCCLC programs had strengths in the areaswe expected: Emotional Support andOrganization. Ratings were low--but notlower than national norms--in Instructional
Support. Student engagement ratingswere positive, but could be improved.
The CLASS has been added to theevaluation design in the coming year. Itwill implemented in all programs using avideo tape format.
Teacher, Parent, Student, andCollaborative Partner SurveyOutcomes
Teacher Survey Outcomes. The return rateof teacher surveys for students whoattended 30 days or more was 76%,slightly lower than the previous threeyears (80%, 85% and 86%). The targetedreturn rate for teacher surveys was 90%.
School day classroom teachers wereasked to rate each student’s performanceon district objectives/standards on a 3-point scale of ‘Exceeds standards,’ ‘Meetsstandards,’ and ‘Below standards.’
About the CLASS:The Classroom Assessment and ScoringSystem (CLASS) was developed by BobPianta and a team of researchers at theCenter for Advanced Study on Teachingand Learning. It is used to rate the qualityof teaching and learning interactions. Itconsists of three to four dimensionsdepending on the grade level of thestudents: • Emotional Support, • Classroom or Group Organization, • Instructional Support, and• Student Engagement.
Scores range from 1 to 7, with scores inthe 6-7 range indicating highest quality(3-5 is modest quality and 1-2 is lowquality). The effectiveness cut point onInstructional Support is 3.25, meaningthat scores above 3.25 are necessary toimpact student achievement.
Emotional Support Organization Instructional Support Student Engagement
7
5
3
1
2012-13 CLASS Pilot
Figure 6
2013 Classroom Assessment & Scoring System Pilot
5.07 5.25 5.20
2.12
® 12 21st Century Community Learning Centers – 2012/13 Evaluation Report––––––––––––––––––––––––––––––––––––––––
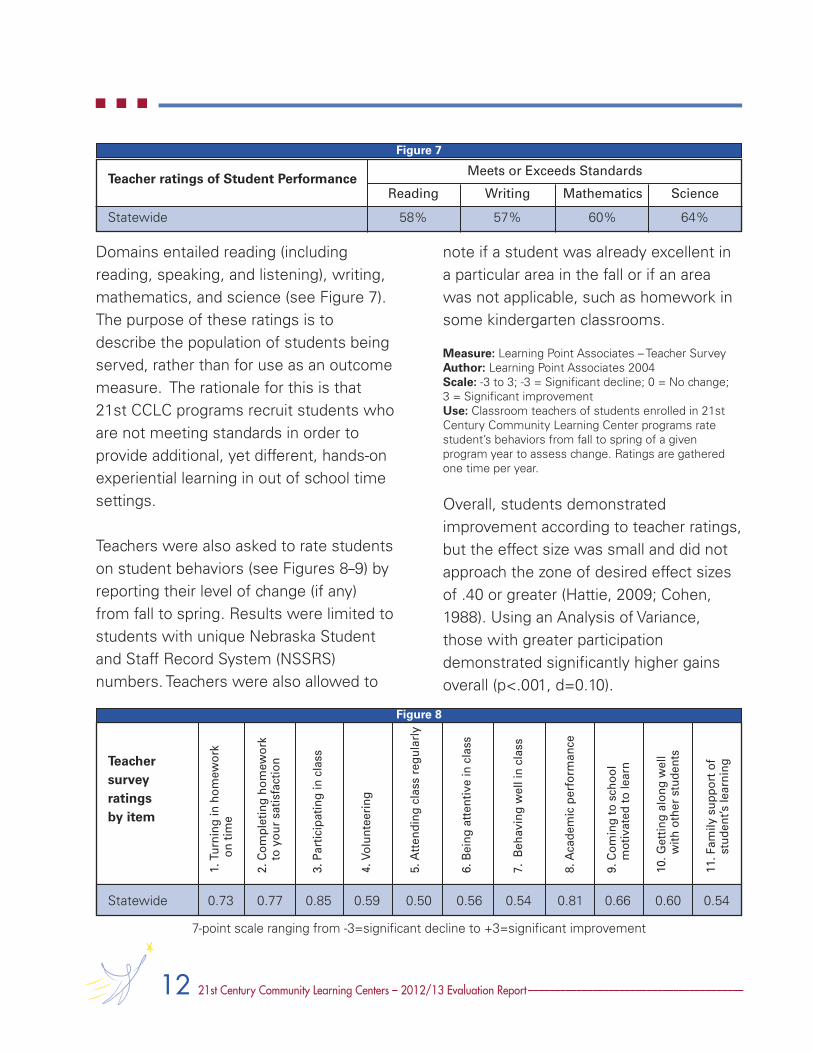
Domains entailed reading (includingreading, speaking, and listening), writing,mathematics, and science (see Figure 7).The purpose of these ratings is todescribe the population of students beingserved, rather than for use as an outcomemeasure. The rationale for this is that21st CCLC programs recruit students whoare not meeting standards in order toprovide additional, yet different, hands-onexperiential learning in out of school timesettings.
Teachers were also asked to rate studentson student behaviors (see Figures 8–9) byreporting their level of change (if any)from fall to spring. Results were limited tostudents with unique Nebraska Studentand Staff Record System (NSSRS)numbers. Teachers were also allowed to
note if a student was already excellent ina particular area in the fall or if an areawas not applicable, such as homework insome kindergarten classrooms.
Measure: Learning Point Associates – Teacher SurveyAuthor: Learning Point Associates 2004Scale: -3 to 3; -3 = Significant decline; 0 = No change; 3 = Significant improvementUse: Classroom teachers of students enrolled in 21stCentury Community Learning Center programs ratestudent’s behaviors from fall to spring of a givenprogram year to assess change. Ratings are gatheredone time per year.
Overall, students demonstratedimprovement according to teacher ratings,but the effect size was small and did notapproach the zone of desired effect sizesof .40 or greater (Hattie, 2009; Cohen,1988). Using an Analysis of Variance,those with greater participationdemonstrated significantly higher gainsoverall (p<.001, d=0.10).
Teacher ratings of Student PerformanceReading Writing Mathematics Science
Statewide 58% 57% 60% 64%
Meets or Exceeds Standards
Figure 7
Teacher survey ratings by item
Statewide 0.73 0.77 0.85 0.59 0.50 0.56 0.54 0.81 0.66 0.60 0.54
1. Turning
in hom
ework
on time
2. Com
pleting ho
mew
ork
to you
r satisfaction
3. Participating in class
4. Volun
teering
5. Atten
ding
class reg
ularly
6. Being
atten
tive in class
7. B
ehaving well in class
8. Acade
mic perform
ance
9. Com
ing to schoo
l motivated
to learn
10. G
ettin
g alon
g well
with
other stude
nts
11. Fam
ily sup
port of
stud
ent’s learning
Figure 8
7-point scale ranging from -3=significant decline to +3=significant improvement

Collective Impact on LongitudinalOutcomes. Another question examined inthis year’s evaluation was the longitudinalimpact of 21st CCLC participation. Dostudents who participate two years in arow demonstrate any academic or otherbenefits? Does 21st CCLC participation,combined with other supports studentsare receiving from their schools andfamilies, yield a collective impact onstudents? To address this question,student attendance data was gathered for2010-11 and 2011-12, and a paired samplestest was conducted using NeSA Readingscores from 2009-10 and NeSA Readingscores from 2011-12. Students
significantly improved in NeSA readingscores from 09-10 (92.07) to 11-12 (99.33),(p<.001, d=0.22 , n=1064). The effect sizewas below the zone of desired effectsizes of .40 or greater (Hattie, 2009;
–––––––––––––––––––––––––––––––––––––––––––––––––––––––––––––––––––––––––––––––––––––––––– 13®
Teacher Survey – Ratings of Change
Items
0-29 days 30-89 days 90-120 days 121+ days
Number of Surveys 864 2906 1414 2465
Turning in homework on time 0.49 0.63 0.62 0.74
Completing homework to your satisfaction 0.52 0.65 0.66 0.81
Participating in class 0.66 0.75 0.77 0.90
Volunteering 0.44 0.54 0.53 0.62
Attending class regularly 0.36 0.48 0.46 0.49
Being attentive in class 0.35 0.50 0.49 0.58
Behaving well in class 0.39 0.46 0.49 0.56
Academic performance 0.58 0.71 0.75 0.82
Coming to school motivated to learn 0.42 0.56 0.55 0.69
Getting along well with other students 0.43 0.54 0.52 0.65
Family support of student’s learning 0.38 0.49 0.49 0.55
Average Change 0.46 0.57 0.58 0.67
7-point scale ranging from -3=significant decline to +3=significant improvement
Students Attending Statewide 21st CCLC Analysis of Gain Scores
Figure 9
NeSA-R (n=1,064)
105
100
95
90
85
2009-10 2011-12
Figure 10
99.33
92.07

Cohen, 1988). For this particularpopulation of students 307 were noteligible for free/reduced lunch (29%), 620were eligible for free lunch (58%), and136 were eligible for reduced price lunch(13%). With 71% of the students beingeligible for free/reduced lunch (commonly
associated with being “at risk”academically), holding steady isconsidered a good result. To showsignificant improvement, albeit with loweffect sizes, is a positive indication aboutthe collective impact of what the studentsare experiencing.
® 14 21st Century Community Learning Centers – 2012/13 Evaluation Report––––––––––––––––––––––––––––––––––––––––
Population Number NESA-R NESA-R Gain in P value Cohen’s d09-10 11-12 NESA R
Scale Score
All participants 1064 92.07 99.33 7.255 <.001 0.22
Disaggregated by Socio-Economic Status
Eligible for Free Lunch 620 82.36 92.23 9.865 <.001 0.31Not eligible for Free or 307 110.50 114.67 4.176 .03 0.12Reduced Price LunchesEligible for Reduced 136 94.52 96.78 2.257 NS NAPrice Lunch
Disaggregated by Racial/Ethnic and Gender Categories
African American Females 110 78.90 91.45 12.554 <.001 0.40African American Males 77 75.38 85.62 10.244 .003 0.35Hispanic Females 143 84.78 97.67 12.895 <.001 0.47Hispanic Males 140 83.43 91.99 8.557 .001 0.28Native American Females 46 55.04 68.26 13.217 .008 0.41Native American Males 38 64.24 59.74 -4.500 NS NA
Disaggregated by Racial/Ethnic, Gender, and Free Lunch status
African American Males 60 71.18 82.68 11.500 .006 0.37Eligible for Free LunchAfrican American Females 85 76.06 90.88 14.824 <.001 0.47Eligible for Free LunchHispanic Males Eligible 99 82.10 92.03 9.929 .002 0.31for Free LunchHispanic Females Eligible 102 79.53 94.13 14.598 <.001 0.55for Free LunchNative American Males 23 54.52 52.70 -1.826 NS NAEligible for Free LunchNative American Females 35 50.03 68.06 18.029 .003 0.54Eligible for Free Lunch
Figure 11
Impacts on Groups and Subgroups of 21st CCLC Participants

–––––––––––––––––––––––––––––––––––––––––––––––––––––––––––––––––––––––––––––––––––––––––– 15®
Who benefited the most fromparticipation? In terms of economicsubgroups, students eligible for free lunchshowed the greatest effect size changes(d=0.31), followed by students not eligiblefor free/reduced lunch, with studentseligible for reduced price lunch showingno significant gain. All subgroups showedsignificant impacts with strong effectsizes except for Native American malesand White male and female studentseligible for Free Lunch (see Figure 11).
Is this result meaningful? This patternwas compared to the statewide averageNESA Reading performance for studentseligible for free/reduced lunch andcompared them to 21st CCLC studentswho were eligible for free/reduced lunch(see Figure 12).
Levels of improvement were comparablebetween statewide free/reduced lunchstudents and 21st CCLC free/reducedlunch participants. The 21st CCLCstudents had fewer students proficient inreading in 2009-10 but a slightly steepertrajectory of improvement in 2011-12, ascompared to students eligible for free orreduced lunch statewide. This suggeststhat the pattern of improvement forstudents who had sufficient participationin 21st CCLC is strong.
Parent Survey Outcomes. Parents ofkindergarten through 12th grade studentswho were regular 21st CCLC attendersacross Nebraska were surveyed regardingtheir ratings of the 21st CCLC programson a number of different areas in order toassess the quality of services and
% Proficient NDE 2009-10 % Proficient 21st CCLC % Proficient NDE 2011-12 % Proficient 21st CCLCFRL Students 2009-10 FRL Students FRL Students 2011-12 FRL Students
100%
75%
50%
25%
0%
% Proficient NDE 2009-10 FRL Students % Proficient 21st CCLC 2009-10 FRL Students% Proficient NDE 20011-12 FRL Students % Proficient 21st CCLC 2011-12 FRL Students
Figure 12
54% 48%56%
+6
61%
+5
NeSA-Reading

® 16 21st Century Community Learning Centers – 2012/13 Evaluation Report––––––––––––––––––––––––––––––––––––––––
perceived outcomes for their children.The statewide return rate for parentsurveys was 65%, which was similar toprior years (63%, 70% and 65%). Thetargeted return rate for parent surveyswas 90%.
Parents were asked to identify theirprimary reason for enrolling their child oryouth in the 21st CCLC program. Figure13 displays their responses.
These data suggest that the majority ofparents (48%) enroll their children foracademic support or enrichmentopportunities as their primary reason.
Parents were asked to rate theirsatisfaction with the 21st CCLC program.Figure 14 reflects the overall averageratings across items for regularlyattending students.
QB0@'-.B%#)::,*$%,*%'(*.B<-'($%
WKc%9'B*'0s,(%,*%B8)C%"`c%
P):'*7.#.,(%,*%B<.8@%B0*'%!Xc%
d)8s:8'%"3c%
5%/-#)!,-.+/)!+M!^RL!=R-L!'#/+&&-N!8)$N-#)!
Figure 13
Parent survey items
Statewide 3.89 3.88 3.56 3.87 3.88 3.78 3.84 3.73 3.81
1. CCLC
is a ben
efit
2. CCLC
staff are
excellent
3. CCLC
staff
commun
icate
4. CCLC
is safe
5. Activities are goo
d
6. Child learns m
ore
7. CCLC
helps child’s
friend
ship
8. In
form
ed abo
ut
child
& beh
avior
Average
Figure 14
1=Disagree, 4=Agree
Parent Report of Why They Enrolled Student

–––––––––––––––––––––––––––––––––––––––––––––––––––––––––––––––––––––––––––––––––––––––––– 17®
Measure: Evaluation Guidebook – Parent SurveysAuthor: St. Clair, 2008Scale: 4 = Agree, 3 = Slightly Agree, 2 = SlightlyDisagree, 1 = DisagreeUse:This survey is administered one time to parents of students enrolled in 21st CCLC programs who haveattended 30 days or more (regular attenders). Parentsrate their perceptions of each statement.
Figure 15 reflects parent ratings of eightitems relevant to 21st CCLCs distributed byattendance or participation grouping of thestudent (e.g., 0-29 days, etc.).
Greater participation was associated withslightly higher ratings on most items. The
most positively rated item was that theprogram is a great benefit to their child,ratings of staff quality, and ratings of thesafety of the program. The lowest rateditem was related to communication abouttheir child’s progress.
Parents were also asked to identify typesof parent involvement activities theydemonstrated during the past programyear. Parents responded either “Yes” or“No” to the following items. Figure 16depicts the percentage of parents
Parent Survey Data
Rating
0-29 days 30-89 days 90-120 days 121+ days
Number of Surveys Collected 459 2243 1275 2320
1 The 21st CCLC program is a great benefit to my 3.89 3.88 3.91 3.90child/youth.
2 The 21st CCLC staff are excellent (caring, 3.87 3.86 3.88 3.90reliable, skilled).
3 The 21st CCLC staff communicates with me 3.47 3.48 3.52 3.61regularly about my child’s progress in the program.
4 The 21st CCLC program is a safe place, physically 3.88 3.86 3.90 3.89and emotionally.
5 The activities offered are good and my child 3.87 3.86 3.88 3.91enjoys them.
6 My child learns more by participating in the 21st 3.76 3.77 3.79 3.81CCLC program.
7 The 21st CCLC program helps my child build and 3.82 3.83 3.85 3.87maintain friendships.
8 My child’s behavior is handled well in the 3.64 3.70 3.72 3.78afterschool program and I am kept informed about strengths and challenges.
Overall Average 3.78 3.78 3.81 3.83
Students Attending Statewide 21st CCLC
1=Disagree, 4=Agree
Figure 15

® 18 21st Century Community Learning Centers – 2012/13 Evaluation Report––––––––––––––––––––––––––––––––––––––––
indicating “Yes.” The following tablereflects overall levels of parentparticipation in the noted activities forparents of regularly attending 21st CCLCstudents.
Figure 17 distributes the percentage ofparents responding affirmatively indicating
they participated in the described activity.The distribution ranges from studentsserved less than 30 days to studentsserved greater than 120 days. Thehighest percentages of parents involvedin activities were generally associatedwith greater participation rates bystudents.
Parent engagementactivities
Statewide 74% 39% 82% 73% 26% 74% 19% 56%
1. Read
newsletters
2. Com
mun
icate
with
teache
r
3. Visit scho
ol
4. Review
homew
ork
5. Volun
teer
6. Sup
port
learning
at hom
e
7. Participate
in group
s
8. Sha
re
inform
ation
Figure 16
Parent Survey Data – Ratings of Involvement
Percentage of Parents Responding Affirmatively to Items by Participation/Attendance Groupingof Student 0-29 days 30-89 days 90-120 days 121+ days
1. Read newsletters from school 77% 72% 78% 81%
2. Talk to or exchange e-mails with school teacher 45% 40% 47% 45%or teachers at least monthly
3. Visit school during parent events (like parent- 80% 73% 79% 82%teacher conference, back to school night, etc.)
4. Review homework every day, even if it is finished 70% 67% 72% 78%in the afterschool program
5. Volunteer (help teacher, field trip, school events, 28% 25% 27% 28%help with book fairs)
6. Support learning at home (extra learning activities, 75% 71% 76% 80%board games, family outings, computers, internet,reading)
7. Participate in advisory groups (PTA, school 20% 17% 18% 19%improvement committees, parent advisory groups, PIRC councils).
8. I share important information about my child with 50% 47% 53% 60%the 21st CCLC and/or school staff.
Attendance Grouping of Students
Figure 17
Scale= % of parents responding yes to described behavior

–––––––––––––––––––––––––––––––––––––––––––––––––––––––––––––––––––––––––––––––––––––––––– 19®
Parents of students with the greatestlevels of participation were often, but notalways, the group with the greatestpercentages of “yes” to readingnewsletters from the school, visitingschool during parent events, reviewinghomework every day, volunteering,supporting learning at home, and sharingimportant information about their childwith program or school staff.
Elementary Student Survey Outcomes.Surveys are collected from students 3rd
grade and older attending elementaryprograms and who have attended 30 daysor more during the school year. The returnrate of 74% was lower than the previousthree years (82%, 83% and 78%). Thetargeted return rate for student surveyswas 90%.
Figure 18 summarizes the ratings of olderelementary students (3rd grade and older)who were regularly attending 21st CCLCstudents.
Elementary Student Survey Items
Return Rate 74%
1. Getting good grades in school is important to me. 1.73
2. I feel accepted by other kids in the 21st CCLC program. 1.40
3. I feel accepted by other kids in school. 1.44
4. I feel safe in the 21st CCLC program. 1.62
5. I get my homework done in the 21st CCLC program (if I have homework). 1.47
6. I talk to my family about my homework or what I’m learning in school. 1.24
7. I’m getting good grades in reading (or language arts) at school. 1.48
8. I’m getting good grades in mathematics at school. 1.48
9. I follow the rules at school. 1.60
10. I follow the rules in the 21st CCLC program. 1.61
11. I get along well with the other students in the 21st CCLC program. 1.45
12. I get along well with the other students in school. 1.48
13. I like the activities in the 21st CCLC program. 1.49
14. I like how we learn things in the 21st CCLC program. 1.46
15. The adults in the 21st CCLC program care about me. 1.66
16. I have a safe way to get home from the 21st CCLC program. 1.76
17. Overall Average 1.53
Statewide 21st CCLC
No = 0, Sometimes = 1, Yes= 2
Figure 18

® 20 21st Century Community Learning Centers – 2012/13 Evaluation Report––––––––––––––––––––––––––––––––––––––––
Measure: Evaluation Guidebook – Student Surveys(Elementary Version)Author: St. Clair, 2008Scale: No = 0, Sometimes = 1, Yes= 2Use:This survey is administered one time to studentsenrolled in 21st CCLC programs who have attended 30days or more (regular attenders) and who are in 3rdgrade or above in an elementary school. Students ratetheir perceptions of each statement. Prompts describeconstructs related to school success and academicachievement.
Overall, ratings by students were positive.Safety was one of the most positivelyrated items. Talking with family abouthomework, feeling accepted by peers inthe program and getting along with peersin the program, and liking how they learnthings in the program were rated lesspositively. It will be recommended thatprograms talk with older elementarystudents about these areas and learnmore about continuous qualityimprovement in these areas.
Data were not disaggregated byattendance grouping because these
analyses in past years have shown nosignificant differences. Figure 18 reflectselementary student ratings, distributed byattendance grouping. Attendancegrouping ranged from less than 30 days togreater than 120 days.
Middle/High School Student SurveyOutcomes. Surveys are collected fromstudents in middle or high school whohave attended 30 days or more during theschool year. Student survey collectionresulted in an average return rate of 75%,a slight decline from the prior year (82%),and a modest improvement from the twoprior years (69% and 68%). The targetedreturn rate for student surveys was 90%.
Figure 19 summarizes the ratings ofmiddle and high school students whoregularly attended the 21st CCLCprogram.
Secondary Student Survey Items
Return Rate 75%
1. Getting good grades in school is important to me. 1.88
2. I feel accepted by others in the 21st CCLC program. 1.68
3. I feel accepted by others in school. 1.63
4. I feel safe in the 21st CCLC program. 1.81
5. I get my homework done in the 21st CCLC program (if I have homework). 1.49
6. I talk to my family about my homework or what I’m learning in school. 1.27
7. I’m getting good grades in reading (or English) at school. 1.67
8. I’m getting good grades in mathematics at school. 1.58
Statewide 21st CCLC
Figure 19

–––––––––––––––––––––––––––––––––––––––––––––––––––––––––––––––––––––––––––––––––––––––––– 21®
Measure: Evaluation Guidebook – Student Surveys(Secondary Version)Author: St. Clair, 2008Scale: No = 0, Sometimes = 1, Yes= 2Use:This survey is administered one time to studentsenrolled in 21st CCLC programs who have attended 30days or more (regular attenders) and who are in asecondary school (middle or high school). Students ratetheir perceptions of each statement. Prompts describeconstructs related to school success and academicachievement.
Safety was rated very positively, as wasthe students’ aspiration to go to collegesomeday. Lower rated items were similarto those of the older elementarystudents—discussing learning orhomework with their family, liking howthey learn things in the program—andthey also rated community serviceinvolvement low. Peer acceptance wasrated more positively than in prior years.
Partner Ratings of Collaboration
Collaboration Survey Outcomes.Collaboration surveys were used tomeasure the quality of collaborationbetween the program representatives,school teachers and administrators, andcommunity partners. Sites were requiredto survey school staff (predominantlyschool administrators and teachers) andcommunity partners to measure ratings ofcollaboration. Return rates are difficult tocalculate, given widely varying schoolsizes and community contexts.
Statewide, a total of 2,839 collaborationsurveys were collected. It is difficult tocalculate a return rate for school and
Secondary Student Survey Items
9. I follow the rules at school. 1.73
10. I follow the rules in the 21st CCLC program. 1.76
11. My friends encourage me to make good choices. 1.55
12. I get along well with the other students in the 21st CCLC program. 1.68
13. I get along well with the other students in school. 1.65
14. I like the activities in the 21st CCLC program. 1.61
15. I like how we learn things in the 21st CCLC program. 1.53
16. The adults in the 21st CCLC program care about me. 1.77
17. I have a safe way to get home from the 21st CCLC program. 1.88
18. I would like to go to college someday. 1.86
19. I am involved in community service or other activities to help others. 1.39
20. There are ways I can make my community a better place. 1.69
21. Overall Average 1.66
Statewide 21st CCLC
No = 0, Sometimes = 1, Yes= 2
Figure 19

® 22 21st Century Community Learning Centers – 2012/13 Evaluation Report––––––––––––––––––––––––––––––––––––––––
community partners. To estimate acalculation, one would need to considerthe number of staff in each schoolbuilding in which a 21st CCLC site isoperating (school partners). To estimatefor community partners, one would needto consider at least those who serve on
the management team, share planning,serve as a subcontractor (such as a localevaluator, community agency, etc.), orprovide some level of programming forstudents. Therefore, return rate targetsare not established for these data.
Collaboration Survey Data
Items
Number 2314 525
1 The 21st CCLC program provides an afterschool program that strengthens student academic achievement. 4.38 4.72
2 The 21st CCLC program provides support for student social and behavioral development. 4.35 4.77
3 The 21st CCLC program helps to engage families and the community. 4.21 4.48
4a The 21st CCLC program appropriately uses classroom spaces, gym or cafeteria spaces, media center, computer labs, and outdoor space. 4.48
4b The 21st CCLC program has sufficient resources to support students and families (physical space, materials, adequate budget, and at least are working toward a sustainability plan). 4.36
5a I work with the 21st CCLC staff to connect programming to content offered during the school day (e.g., connects to standards, offers extension of an activity or concept taught earlier in the day, etc.). 3.65
5b We work together to connect afterschool programming to content offered during the school day, yet make sure the learning is offered differently in afterschool (hands-on more than paper and pencil tasks). 4.39
6a I view the 21st CCLC as a part of our school, not a program offered by an outside agency or staff. 4.42
6b I view the 21st CCLC as a collaborative effort of the school, the program, and our agency. We have regular meetings to share planning and to review outcomes. 4.30
21st CCLC Statewide
SchoolPartners
CommunityPartners
Figure 20
–––––––––––––––––––––––––––––––––––––––––––––––––––––––––––––––––––––––––––––––––––––––––– 23®
Measures: Evaluation Guidebook – CollaborationSurveys (School and Community Partner Versions)Author: St. Clair, 2008Scale: 1 = Disagree; 3 = Neutral; 5= Agree Use: School and Community partners fill out two similarbut distinct surveys that measure agreement withstatements focused on collaboration constructs.
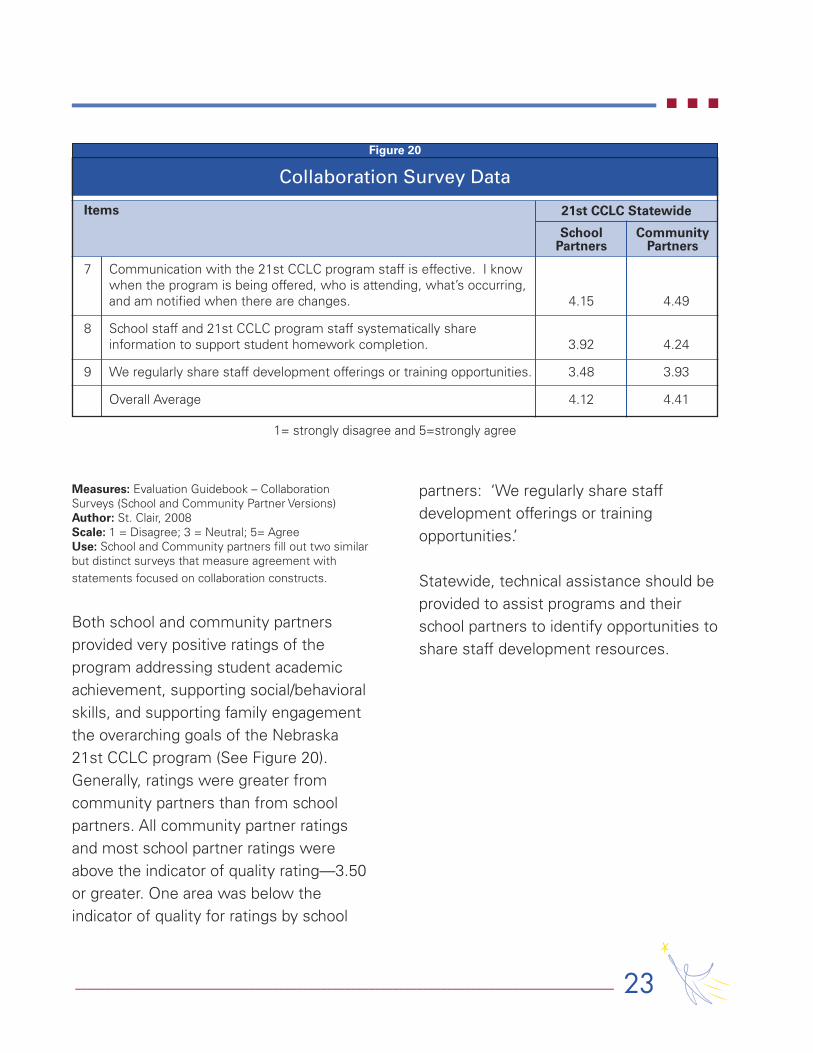
Both school and community partnersprovided very positive ratings of theprogram addressing student academicachievement, supporting social/behavioralskills, and supporting family engagementthe overarching goals of the Nebraska21st CCLC program (See Figure 20).Generally, ratings were greater fromcommunity partners than from schoolpartners. All community partner ratingsand most school partner ratings wereabove the indicator of quality rating—3.50or greater. One area was below theindicator of quality for ratings by school
partners: ‘We regularly share staffdevelopment offerings or trainingopportunities.’
Statewide, technical assistance should beprovided to assist programs and theirschool partners to identify opportunities toshare staff development resources.
Collaboration Survey Data
Items
7 Communication with the 21st CCLC program staff is effective. I know when the program is being offered, who is attending, what’s occurring, and am notified when there are changes. 4.15 4.49
8 School staff and 21st CCLC program staff systematically share information to support student homework completion. 3.92 4.24
9 We regularly share staff development offerings or training opportunities. 3.48 3.93
Overall Average 4.12 4.41
21st CCLC Statewide
1= strongly disagree and 5=strongly agree
SchoolPartners
CommunityPartners
Figure 20

® 24 21st Century Community Learning Centers – 2012/13 Evaluation Report––––––––––––––––––––––––––––––––––––––––
Summary andRecommendationsBenefits for All Students Participation in Nebraska’s 21stCentury Community Learning Centers(21st CCLCs) makes a difference instudent achievement for students atrisk. A total of 16,121 students wereserved this year, and 55% (8,899students) were regular attenders in afterschool programming. Seventy-twopercent (72%) of these students receivefree/reduced lunches, 16% were Englishlanguage learners, and 18% were verifiedfor special education. Students whoattended 90 days or more were also ratedsignificantly more positively by teachers inkey behaviors related to learning:homework, participation, attendance,behavior, motivation, general academicperformance, getting along with otherstudents, and family support of studentlearning. While gains were slight overallacross students, and effect sizes low, theresults showed that greater participationin the program was associated withsignificantly higher gains noted by schoolday teachers.
Students who participate longer earnsignificantly improved NeSA readingscores. Longitudinal analyses examiningmulti-year participation in 21st CCLCshowed collective impact of this programalong with all of the other servicesstudents at risk are receiving in schools.Strong effect sizes on improvements inNESA reading scores were shown from09-10 to 11-12 (92.07 to 99.33, p<.001,d=0.22, n=1064 with 58% eligible for freelunch and 13% eligible for reduced pricelunch, a total of 71% eligible for free orreduced price lunches). Students eligiblefor free lunch demonstrated the mostbenefit (gain of 10 points on NESAReading over two years) and thestrongest effect size gains (d=0.31). Theeffect size change for the group overallwas within the zone of desired effectsizes of .40 or greater (Hattie, 2009;Cohen, 1988). All subgroups showedsignificant improvements with effect sizeswithin or approaching the zone of desiredeffects, including African American Maleseligible for Free Lunch and many othersubgroups; however, Native Americanmales did not follow the same trends.This subgroup of students showeddiminished NESA Reading scores overtime, despite the collective impact ofparticipation in 21st CCLC and otherprograms in their schools.

–––––––––––––––––––––––––––––––––––––––––––––––––––––––––––––––––––––––––––––––––––––––––– 25®
External ratings by qualified evaluatorsand program self-ratings foundNebraska’s programs to be of highquality (4.50 overall rating on a 5.00scale, with an Indicator of Qualitystandard set by the Nebraska Departmentof Education at a rating of 3.50 or greater).Programs have continued to grow inquality overall since the beginning ofNebraska’s 21st CCLC programs. In2004, the overall ratings on the toolaveraged 3.70 overall, compared to thisyear’s 4.58 overall. This past year, 21stCCLC sites volunteered to pilot TheClassroom Assessment and ScoringSystem or CLASS (Pianta, et al). This toolsmeasures teaching interactions related toinstructional support, emotional support,and organizational climate. Preliminarydata from 12 programs ranging from K-3to secondary showed that programs havestrengths in the areas of EmotionalSupport and Organization, but haveopportunities to improve in InstructionalSupport and somewhat in StudentEngagement. The student engagementratings mirror somewhat studentfeedback on student surveys about notalways liking how they are learning thingsin the 21st CCLC programs. CLASS videotapes will be scored and narrativefeedback combined with embedded videoclips will be used to assist sites in seeingopportunities to more often provide
student centered, experiential, and hands-on activities that prompt students to thinkcreatively and critically about their work.Statewide professional development thenwill need to focus on helping programs toreplace work sheets, repetitive andteacher-directed activities with anincreasing percentage of experiential,inquiry based activities.
Parents primarily enrolled their childrenfor academic support and enrichment,and reported that these programsbenefited their children. Forty-eightpercent of parents reported they chosethe 21st CCLC program for academicsupport or enrichment. Parentsoverwhelmingly reported the programwas a great benefit to their child (3.89 ona 4.00 scale indicating strong agreement).Parents of students who attended 121days or more reported significantlygreater family engagement than parentsof students in the lesser tiers ofparticipation.
Future Directions andContinuous ImprovementRecommendations for continuousimprovement are developed from areaswhere statewide averages do not meetthe indicators of quality, where statewideaverages are approaching the ceiling of

measurement for a tool consistently overtime, or where a review of theimplementation of the program statewidesuggests an area for improvement.
1. It is recommended that explorationoccur to learn more about why theaverage days of participation generallydecline by grade level. This, combinedwith the mixed results on studentsurveys, suggests the need foradditional or alternative evaluationmethodology to dig deeper intostudent perceptions. This explorationmight take the form of focus groups,interviews, or supplemental surveyswith older students.
2. It is recommended that statewideprofessional development focus onstrategies for:a. Assisting programs in moving
beyond teacher/group leaderdirected activities to studentcentered activities that areexperiential and inquiry based,
b. Connecting students and theirfamilies on what students arelearning in school,
c. Providing service learning orcommunity service options formiddle and high school students,
d. Assisting programs in determininghow best to include arepresentative group of parents inshared decision making on keyissues related to student learning,
e. Providing strategies for schools andprograms to work together toensure that at least one afterschool program staff memberparticipates on schoolimprovement teams.
f. Focus specifically on NativeAmerican male students and thecollective efforts of the schools and21st CCLC programs in improvingthe academic and life trajectory ofthis particular subgroup of studentsgiven the lack of impact on theirlong term reading skills.
3. It is recommended that programs beasked to provide greater detailregarding their operational costs withan estimate of the portion that issupported by 21st CCLC funding andsources of other funding to operatetheir programs in order to calculate amore accurate cost per student.
® 26 21st Century Community Learning Centers – 2012/13 Evaluation Report––––––––––––––––––––––––––––––––––––––––

–––––––––––––––––––––––––––––––––––––––––––––––––––––––––––––––––––––––––––––––––––––––––– 27®
ReferencesBeckett, M., Borman, G., Capizzano, J., Parsley, D., Ross, S., Schirm, A., & Taylor, J. (2009).
Structuring out-of-school time to improve academic achievement: A practice guide(NCEE #2009-012). Washington, DC: National Center for Education Evaluation andRegional Assistance, Institute of Education Sciences, U.S. Department of Education.Retrieved from http://ies.ed.gov/ncee/wwc/publications/practiceguides.
Burchinal, M., Peisner-Feinberg, E., Bryant, D., & Clifford, R. (2000). Children’s social andcognitive development and childcare quality: Testing for differential associations relatedto poverty, gender, or ethnicity. Applied Development Science, 4, 149-165.
Cohen, J. (1988). Statistical power analysis for the behavioral sciences (2nd ed). Hillsdale,NJ: Erlbaum.
Hattie, J. (2009). Visible Learning: A synthesis of over 800 meta-analyses relating toachievement. New York, NY: Routledge.
Henderson, A. & Mapp, K. (2002). A new wave of evidence: The impact of school, family,and community connections on student achievement. Austin, TX: National Center forFamily & Community Connections with Schools, Southwest Educational DevelopmentLaboratory.
Learning Point Associates (2004). Teacher Survey for 21st Century Community LearningCenters. Naperville, IL.
Nebraska Department of Education, 2011-12 State of the Schools Report: A Report onNebraska Public Schools, http://www.education.ne.gov/21stcclc/Index.html.
Patton, M. Q. (2012). Essentials of Utilization-Focused Evaluation. Thousand Oaks, CA: SagePublications.
Pianta, R., LaParo, K., & Hamre, B. (2008). Classroom assessment scoring system(CLASS). Baltimore, MD: Brookes Publishing.

St. Clair, L. (2008). Collaboration survey (school & community partner versions). NebraskaDepartment of Education, http://www.education.ne.gov/21stcclc/Index.html.
St. Clair, L. (2008). Observations for quality after school programming. NebraskaDepartment of Education, http://www.education.ne.gov/21stcclc/Index.html.
St. Clair, L. (2008). Parent surveys. Nebraska Department of Education,http://www.education.ne.gov/21stcclc/Index.html.
St. Clair, L. (2008). Student surveys (elementary & secondary versions). NebraskaDepartment of Education, http://www.education.ne.gov/21stcclc/Index.html.
® 28 21st Century Community Learning Centers – 2012/13 Evaluation Report––––––––––––––––––––––––––––––––––––––––

–––––––––––––––––––––––––––––––––––––––––––––––––––––––––––––––––––––––––––––––––––––––––– 29®
#1 Elementary Success StoryKayla is a first grade girl at a tribalelementary school. She was new to theschool this past academic year. Shesigned up for the after school program inAugust, 2012. Originally, her attendancewas sporadic, but she soon became aregular attender.
Kayla is the 4th child in a large family withsix other siblings. Her mother is a singlemom who lives in a nearby community.Kayla and her younger brother stay withtheir grandparents. They shift betweentwo sets of grandparents. Thegrandparents that they stay with mostregularly have other grandchildren in theirhome too.
When Kayla began the afterschoolprogram, she struggled a great deal withreading and math. Staff spent the majorityof one-on-one time with Kayla working onreading concepts such as fluency,
comprehension, retelling and vocabulary.In math, staff concentrated on addition andsubtraction exercises.
Kayla has nearly perfect school attendance.She is very polite and is a pleasure to havein class. Although she is very young, Kaylais remarkably responsible and works wellwith older students. Kayla especially enjoysusing the puppets to help with readingconcepts. In the afterschool program, sheis learning and practicing computer skills,playing math games and working on herreading skills.
Kayla has strengthened her abilities in bothreading and math this year! She enjoysworking in pairs and in groups with kidsher age. Moreover, her self-confidence hasseemed to build and shine over the courseof the year. The program aims to maintainthis and continue to build her academicand social emotional progress.
Appendix 1: Success Stories submitted by Grantees
Names have been changed to pseudonyms and any identifying information isremoved. Stories are otherwise not edited and are left in the voice of the
program staff preparing these success stories.

#2 Secondary Success StoryAt the beginning of the year, CommunityLearning Center (CLC) staff went to all theteachers and asked about students in theirclassrooms. Jose, a Hispanic-sixth gradestudent, was one of the names that got lostin the shuffle. He has average grades,studies enough to pass the tests, andresponds in class when spoken to directly.Jose attends afterschool programming. Heshows up for enrichment activities, but—just like in class—he attends the bareminimum. The CLC staff membersattempted to engage him in more activities,bring out his personality, and ask forsuggestions about future activities. This alloccurred with little success. Jose’s behaviordid not become worse, but it was notimproving.
Jose chose to join a writing club calledNaNoWriMo. NaNoWriMo is a continuousclub with stages stretching out acrosssecond, third, and fourth quarters. At theend of the term, if the students complete allthe necessary steps, they receive a boundcopy of their writings. This club was led byhis former fifth grade writing teacher.Knowing his temperament, the club leaderwas expecting Jose to complete theminimum, but possibly not get his bookfinished—this could be due to lack of timeor motivation. After reading his first draft,
the club leader was amazed at Jose‘swriting abilities. She shared her excitementwith me and we spoke with Jose afterschool. We shared our encouragement withJose, hoping to bring up his spirits andmotivate him to complete his book. Joseseemed more interested after ourencouragement, but continued on asnormal. After a few weeks, Jose beganasking if he could visit his NaNoWriMoleader after school to work more on hisbook. Soon after, he began asking her if hecould stop by before school as well. By theend of the writing process, Jose was visitinghis club leader before school, during lunchhour, and also after school. It was obvious that Jose was becomingmore motivated as the weeks passed. Hetook constructive criticism well, was moreapt to ask questions, and even begansharing his writing with classmates andfriends. Before CLC staff members knew it,Jose was handing in his finished, boundbook to read! Jose has already begun askingabout writing next year with NaNoWriMo.We are hoping we can continue Jose‘swriting throughout the year and motivatehim to write a second book!
#3 Secondary Success StoryThis student success story is a little differentand I hope that this story really puts thingsin perspective as to why we really serve our
® 30 21st Century Community Learning Centers – 2012/13 Evaluation Report––––––––––––––––––––––––––––––––––––––––

–––––––––––––––––––––––––––––––––––––––––––––––––––––––––––––––––––––––––––––––––––––––––– 31®
members and families. This story is about a10 year old named S . He comes from asingle parent home where he is raised byhis mother, a new baby sister, a youngerbrother, and a couple of more siblings thatare still in Africa. S came to the UnitedStates from East Africa from the city ofKenya last July. Our middle school was thefirst ever school that S attended in theUnited States.
When I first met S’s mother, she told methat S struggled in reading and languagearts. She said that even though he spoke alittle English, he still needed to comprehendit on paper. His mother put S in the CLC sothat he could get tutoring in math andreading as well as to have a safe place for Sto be while she was at work. His motherworks the 3-11pm shift at the hospitals as aLicense Practical Nurse (LPN). His motherwas very adamant about S receiving a goodeducation in the states and she was veryclear on his reason for attending our schooland the CLC. She stated that this was aprivilege for S to learn and for him not totake it for granted because the educationalsystem was not as successful in Kenya as itis in the United States.
S was up for the challenge and excelled inthe classroom as well as in the CLCprogram. S attended the program two tothree times a week and really loved
attending the program. S enjoyed art,basketball, the cake decorating club,reading, and just learning. He was a verymature and well-mannered young man to be10 years old. S would always tell my staffand I that he did not understand why theAmerican kids were so disrespectful to theirauthorities and to each other. Everycomment or reply that came out of S’smouth was “yes sir, yes ma’am, please andthank you.” His politeness really won S a lotof friends in his 5th grade class as well as inthe CLC.
Unfortunately, S passed away in the earlymorning hours one Friday toward the end ofthe school year. His death was untimely andwhen the school and CLC staff received thisvery sad news, it sent shock waves allthrough the school. In life, S was a youngvibrant, happy, respectful, and loving kid. Swas a very quiet and soft spoken young manbut you noticed him by his smile and hismannerism. When he got finished with hisart projects, he would give them to the CLCstaff and they would post them on the wall.S’s positive attitude, loving spirit, his love forlearning, and his passion for art will bemissed. S had a great time when heattended the CLC. This is the very reasonthat I enjoy the work that I do and why Istress the quality of the program. Our goalis to offer unique opportunities where themembers can still learn while having fun. I

tell my staff to love all the members andgive them a fun time of their life for 3 hoursand put 100% in to their work all of thetime.
I will leave with this basketball analogy sinceI am a former college basketball coach. I amthe head coach, my staff are the assistantcoaches, the members are the players, thelesson plans are the basketball plays, andwe all work for the franchise. Each day thatwe come to work is a basketball game. Thegame lasts 3 hours or more. During thegame, the coaches (staff) will have plays(lesson plans) for the players (members) torun. If the plays don’t work, you have tothrow that play out and make up a new oneso that the organization can win the game.In those plays are character builders,teaching the members to be responsible,become caring citizens, life skills, positiverelationships being built, art activities, love,education and career activities, fitnessactivities, cooking activities and so on. Ourbiggest cheer leaders are the families,providers, the school staff, communitypartners, and philanthropic organizations, tomake this program a success, and if themembers had fun and learned something atthe end of the day then we won the game.
® 32 21st Century Community Learning Centers – 2012/13 Evaluation Report––––––––––––––––––––––––––––––––––––––––

–––––––––––––––––––––––––––––––––––––––––––––––––––––––––––––––––––––––––––––––––––––––––– 33®
Lisa St. Clair, Ed.D.
Assistant Professor, MMI & PediatricsMunroe-Meyer Institute
University of Nebraska Medical Center985450 Nebraska Medical Center
Omaha, NE [email protected]
(402) 559-3023 (office) and (402) 677-2684 (cell)
Funding for the external evaluation and this publication was provided byfederal funds under No Child Left Behind, Title IV B (2001 Amendment toESEA) and administered by the Nebraska Department of Education.
21st Century Community Learning Centers Grant ProgramNebraska Department of Education301 Centennial Mall South, Box 94987Lincoln, NE 68509-4987Phone: (402) 471-0876Fax: (402) 471-2434Web Site: http://www.education.ne.gov/21stcclc
The contents of this Annual Evaluation Report are available online athttp://www.education.ne.gov/21stcclc/ProgramEvaluation/EvaluationReport2012.pdf.
©2012 Nebraska Department of Education. This publication may be reproduced withoutfurther permission as long as it is not altered. If any part of the contents of this publicationare altered in any way and used in a compilation or derivative work, prior written permissionmust be obtained from the Nebraska Department of Education.
NEBRASKADEPARTMENT OF
EDUCATION