pupil weighting factors report
TRANSCRIPT
Pupil Weighting Factors Report Act 173 of 2018, Sec. 11
REPORT December 24, 2019 UPDATED: January 18, 2020
Report to the House and Senate Committees on Education, the House Committee on Ways and Means, and the Senate Committee on Finance
Submitted by Daniel M. French, Ed.D., Secretary of Education
Prepared by
Tammy Kolbe, Ed.D., University of Vermont
Bruce Baker, Ph.D., Rutgers University
Drew Atchison, Ph.D., American Institutes for Research
Jesse Levin, Ph.D., American Institutes for Research
LEGISLATIVE REPORT: Pupil Weighting Factors (Revised: February 19, 2020)
Page 2 of 150
Background This report has been prepared and submitted as required by Act 173 of 2018, Section 11.
Legislation
Section 11 of Act 173 of 2018 requires the Agency of Education (AOE) to consider and make various recommendations for changes to the census grant funding model, changes or additions to the per pupil weighting factors used to allocate special education funding under the census grant model, and any additional methods for consideration.
Section 11(d) of this act requires the agency to “contract with a contractor with expertise in Vermont’s education funding system to assist the Agency in producing the study required by this section.”
Contractor
The AOE contracted with the University of Vermont and State Agricultural College (UVM) to produce the study contained in this report. The team:
• Conducted a nation-wide policy scan of other states’ special education funding systems, with an in-depth focus on nine states;
• Conducted stakeholder interviews to identify experiences with and perceptions of the current funding system;
• Conducted a risk and cost analysis and proposed a new set of cost factors and weights for the equalized pupil calculation;
• Considered whether adjustments to the special education census block grant are appropriate and developed design considerations;
• Simulated various scenarios for incorporating new cost factors into Vermont’s census grant system; and
• Produced overall findings and recommendations for future policy.
Lead author Professor Tammy Kolbe, Ed.D. and her team submitted the below study to the agency on December 23, 2019.
Structure of the Report The structure of the report produced by the UVM team is as follows:
• Executive summary for the study report • The study report: “Study of Pupil Weights in Vermont’s Education Funding Formula” • A simulator tool (Microsoft Excel format) to allow replication of the scenarios
considered in the report, and guidance documentation for the simulator tool.
Accessibility of the Report As a contracted entity of the State of Vermont, UVM and the study author team are bound by AOE standard contract language for compliance with web and document accessibility requirements under Section 504 of the Rehabilitation Act of 1973 and Title II of the Americans with Disabilities Act (ADA) of 1990. The author team submitted an updated version of this

LEGISLATIVE REPORT: Pupil Weighting Factors (Revised: February 19, 2020)
Page 3 of 150
report which corrects for known accessibility errors in the original version. If you have questions, or if you encounter errors in formatting or structure that prevent you from accessing the content in this document, please contact Ted Fisher, AOE Director of Communications and Legislative Affairs, at [email protected].
LEGISLATIVE REPORT: Pupil Weighting Factors (Revised: February 19, 2020)
Page 4 of 150
(this page intentionally left blank)

Executive Summary: Study of Pupil Weights in Vermont’s Education Funding Formula 1
Study of Pupil Weights in Vermont’s Education Funding Formula
December 2019
Submitted to: Secretary, Dan French, Ed.D. Vermont Agency of Education Montpelier, VT 05641
Submitted by: Tammy Kolbe, Ed.D. University of Vermont
Bruce Baker, Ed.D. Rutgers University New Brunswick, NJ
Drew Atchison, Ed.D. Jesse Levin, Ph.D. American Institutes for Research®

Executive Summary: Study of Pupil Weights in Vermont’s Education Funding Formula 2
Executive Summary
Background to the Report The Vermont Agency of Education (AOE) was directed, under Section 11 of No. 173 of the 2018 Acts and Resolves of the Vermont General Assembly (Act 173) to undertake a study that examines and evaluates whether:
1) the current weights for economically-disadvantaged students, English language learners (ELL), and secondary-level students should be modified;
2) new cost factors and weights should be incorporated into the equalized pupil calculation; and
3) the special education census grant should be adjusted for differences in the incidence of and costs associated with SWD across school districts.
In part, the Assembly’s direction stems from concerns about the extent to which the existing funding formula is effective in equalizing educational costs, and by extension, opportunities to learn for students across the state. The manner in which the State currently calculates the number of equalized pupils in a school district has been criticized for being out of step with contemporary educational conditions. For the most part, the student need cost factors and weights used in the calculation have not been modified in more than 20 years, despite the significant changes in statewide demographics and student need that have transpired during that time.
All of these concerns and critiques occur against a shifting policy landscape. Vermont’s “Act 46,” which encourages, and in some instances, requires school districts to consolidate into larger units, has created both opportunities and challenges for the State’s existing school funding mechanisms. In particular, stakeholders have raised concerns about the potential misalignment between the State’s existing Small Schools Grant program and the governance reforms articulated by Act 46.
Districts and schools are also grappling with implementing other systemic education reforms that may have implications for both the cost of and equity in educational opportunities. Policies such as the Flexible Pathways Initiative, including the Early College Program, created by Vermont Act 77 and requirements to implement multi-tiered systems of support (MTSS) for struggling students have implications for how resources are allocated to ensure equal access to quality educational programs and services.
The purpose of this study is to undertake a comprehensive analysis of Vermont’s approach to providing supplemental funding to districts and schools according to differences in student need or geographic location through the use of pupil weights and categorical funding programs.
Key objectives for the study were to:
1. Develop a comprehensive national profile of state policies that adjust for differences in educational costs across school districts.
2. Summarize perspectives in the field about how Vermont’s existing education funding policies, particularly the cost factors and weights used in the equalized pupil calculation and the State’s categorical funding programs for special education, transportation, and smalls schools
3. Evaluate the cost factors and weights to be used in Vermont’s equalized pupil calculation and recommend changes, where appropriate.
Executive Summary: Study of Pupil Weights in Vermont’s Education Funding Formula 3
4. Consider whether the approach that will be used to calculate supervisory unions’ special education census grant should be revised to reflect differences in student need across supervisory unions.
5. Provide concrete examples for how incorporating different cost factors and weights into the funding formula might impact school districts’ equalized pupil counts and, by extension, local education-related property tax rates.
6. Model how potential changes to the special education census grant calculation would affect the amount of state aid supervisory unions receive for special education programs.
Major Findings & Recommendations
State Funding Formulae
Students come to school with dissimilar learning needs and socioeconomic backgrounds that may require different types and levels of educational supports for them to achieve common standards or outcomes. Similarly, schools in different contexts may also require different levels of resources due to scale of operations or the price they must pay for key resources.
Dissimilar resource requirements translate to differences in the cost of education among school districts. Without additional funding from states, some communities may be either unable or unwilling to pay for the additional resources necessary to ensure an adequate education for its students.
All states operate school funding formula and supplemental grants-in-aid programs that attempt to address differences in educational costs across school districts, while simultaneously account differences in the ability of local communities to pay for these costs. However, there is considerable variation across states in the policies and level of funding available.
Cost factors that are commonly-recognized in state funding formula include adjustments for: student need, including economically-disadvantaged and at-risk students; ELL; SWD; and gifted and talented; economies of scale and geographic necessity, including district and school size and population density; grade range; and resource prices.
State funding formula use different mechanisms to adjust for cost differences, including: weights, resource-based allocations, cost reimbursement, and categorical funding.
Vermont’s existing school funding formula accounts for differences in educational costs across school districts by recognizing three cost factors – student poverty, limited English proficiency, and secondary-level education – and assigning weights to these factors it its equalized pupil calculations. In addition, the State operates categorical funding programs for special education, small schools, and transportation.
Executive Summary: Study of Pupil Weights in Vermont’s Education Funding Formula 4
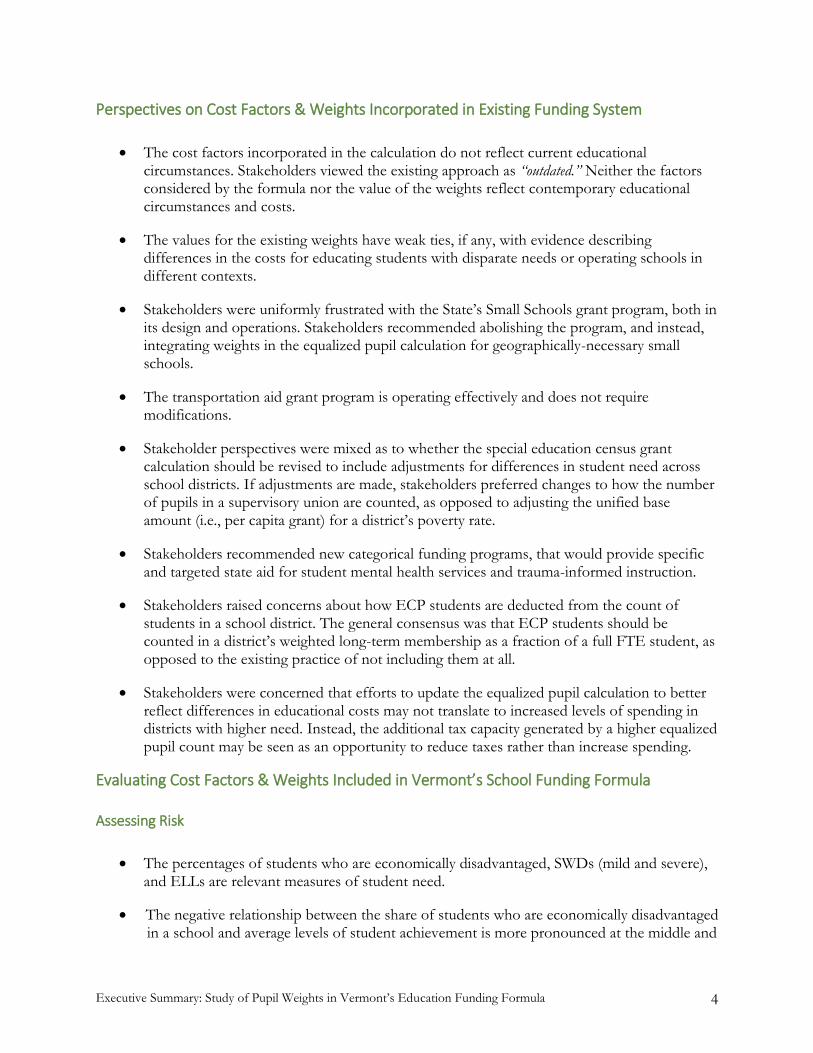
Perspectives on Cost Factors & Weights Incorporated in Existing Funding System
The cost factors incorporated in the calculation do not reflect current educational circumstances. Stakeholders viewed the existing approach as “outdated.” Neither the factors considered by the formula nor the value of the weights reflect contemporary educational circumstances and costs.
The values for the existing weights have weak ties, if any, with evidence describing differences in the costs for educating students with disparate needs or operating schools in different contexts.
Stakeholders were uniformly frustrated with the State’s Small Schools grant program, both in its design and operations. Stakeholders recommended abolishing the program, and instead, integrating weights in the equalized pupil calculation for geographically-necessary small schools.
The transportation aid grant program is operating effectively and does not require modifications.
Stakeholder perspectives were mixed as to whether the special education census grant calculation should be revised to include adjustments for differences in student need across school districts. If adjustments are made, stakeholders preferred changes to how the number of pupils in a supervisory union are counted, as opposed to adjusting the unified base amount (i.e., per capita grant) for a district’s poverty rate.
Stakeholders recommended new categorical funding programs, that would provide specific and targeted state aid for student mental health services and trauma-informed instruction.
Stakeholders raised concerns about how ECP students are deducted from the count of students in a school district. The general consensus was that ECP students should be counted in a district’s weighted long-term membership as a fraction of a full FTE student, as opposed to the existing practice of not including them at all.
Stakeholders were concerned that efforts to update the equalized pupil calculation to better reflect differences in educational costs may not translate to increased levels of spending in districts with higher need. Instead, the additional tax capacity generated by a higher equalized pupil count may be seen as an opportunity to reduce taxes rather than increase spending.
Evaluating Cost Factors & Weights Included in Vermont’s School Funding Formula
Assessing Risk
The percentages of students who are economically disadvantaged, SWDs (mild and severe), and ELLs are relevant measures of student need.
The negative relationship between the share of students who are economically disadvantaged in a school and average levels of student achievement is more pronounced at the middle and

Executive Summary: Study of Pupil Weights in Vermont’s Education Funding Formula 5
secondary levels than at the elementary level. This relationship also varies according to whether a district is located in a urban or rural area.
The negative relationship between the share of students who are economically disadvantaged in a school and average levels of student achievement is weaker in smaller schools than it is in larger schools.
Recommended Cost Factors & Weights
The empirical analyses undertaken for this study identify a comprehensive set of factors that
are related to differences in educational costs across school districts. Specifically:
1) Percentage of students who are economically disadvantaged
2) Percentage of students who are ELL
3) Percentage of students who are enrolled in the middle- and secondary-grades
4) Indicators for geographically-necessary small schools
5) Population density of the community in which a district is located
Table E.1 lists two sets of recommended weights for each cost factor.
The first set of weights assume that policymakers implicitly adjust for differences in the demand for special education when calculating the number of equalized pupils in a district. The second set of weights assumes that policymakers explicitly adjust for differences by modifying how the special education census grant is calculated.
Table E.1. Recommended Weights for Vermont’s School Funding Formula
Weight Value
Cost Factor Measure Existing Weight
New Weight Derived from
Models Without Controls for SWDs
New Weight Derived from Models With
Controls for SWDs Student Needs Poverty Rate (AOE) 0.25 3.14 2.97
% of ELLs 0.20 0.57 1.58
Context
Enrollment <100 Students 0.24 0.26
101–250 0.12 0.12
Population Density <36 Persons per Square Mile 0.23 0.23
36 to <55 0.17 0.17
55 to <100 0.11 0.11
Grade Range % Middle Grades Enrollment 1.23 1.23
% Secondary Grades Enrollment 1.13 1.13 1.20
Pre-kindergarten 0.46
Note. Grade range weights were set to a base value of 1.00. Grade range weights and poverty weights are multiplicative, meaning that the poverty weight is applied to the grade range weighted enrollment. Therefore, the poverty weight has a large effect in grade ranges with a larger weight. The remaining weights are additive, meaning the effect of the weights does not vary with the strength of other weights. Enrollment weights apply to school size. Evaluating the existing weight used for PK students was not included in the scope of this study.

6
Census-Based Special Education Block Grant
Whether a census-based funding mechanism is an appropriate and fair approach to providing localities with supplemental funding for special education is contingent on (1) the proportion of SWDs being roughly the same across supervisory unions, and (2) the nature and extent of student need and the cost of providing special education services are similar across jurisdictions.
The share of enrolled SWDs varied considerably across districts, with some districts having less than 2% of their student population identified for special education and others with more than 30%.
Variability in the share of SWDs across districts, is related to a district’s poverty rate. Districts with proportionately larger shares of students who are economically disadvantaged also, on average, have larger shares of students with IEPs.
Assuming that the existing formula for calculating the census grant amount (starting in FY2021), we found that state aid for special education will comprise a proportionately smaller share of total special education spending in supervisory unions with larger percentages of SWDs than in supervisory unions with fewer SWDs.
An alternative approach to calculating the census grant amount for differences in student need is to inflate the number of pupils to which the per-capita amount is applied. That is, rather than calculating a supervisory union’s census grant based on the long-term PK–12 ADM, the grant is calculated on a weighted pupil count that implicitly accounts for differences in student need across jurisdictions.
Possible adjustments to the census grant should be considered in light of other policy objectives, particularly the intent to provide districts with new flexibility in using funding to strengthen early intervening services for students who are struggling and incentives to revamp special education service delivery models. Across time, such changes to local policies and practices may result in fewer students identified for special education and, as a result, less concern about sufficiency and fairness in state special education funding.
Executive Summary: Study of Pupil Weights in Vermont’s Education Funding Formula

(this page intentionally left blank)

Study of Pupil Weights in Vermont’s Education Funding Formula
Submitted to: Secretary, Dan French, Ed.D.Vermont Agency of EducationMontpelier, VT 05641
Submitted by: Tammy Kolbe, Ed.D.University of Vermont
Bruce Baker, Ed.D. Rutgers University New Brunswick, NJ
Drew Atchison, Ed.D. Jesse Levin, Ph.D. American Institutes for Research®
Study of Pupil Weights in Vermont’s Education Funding Formula
1
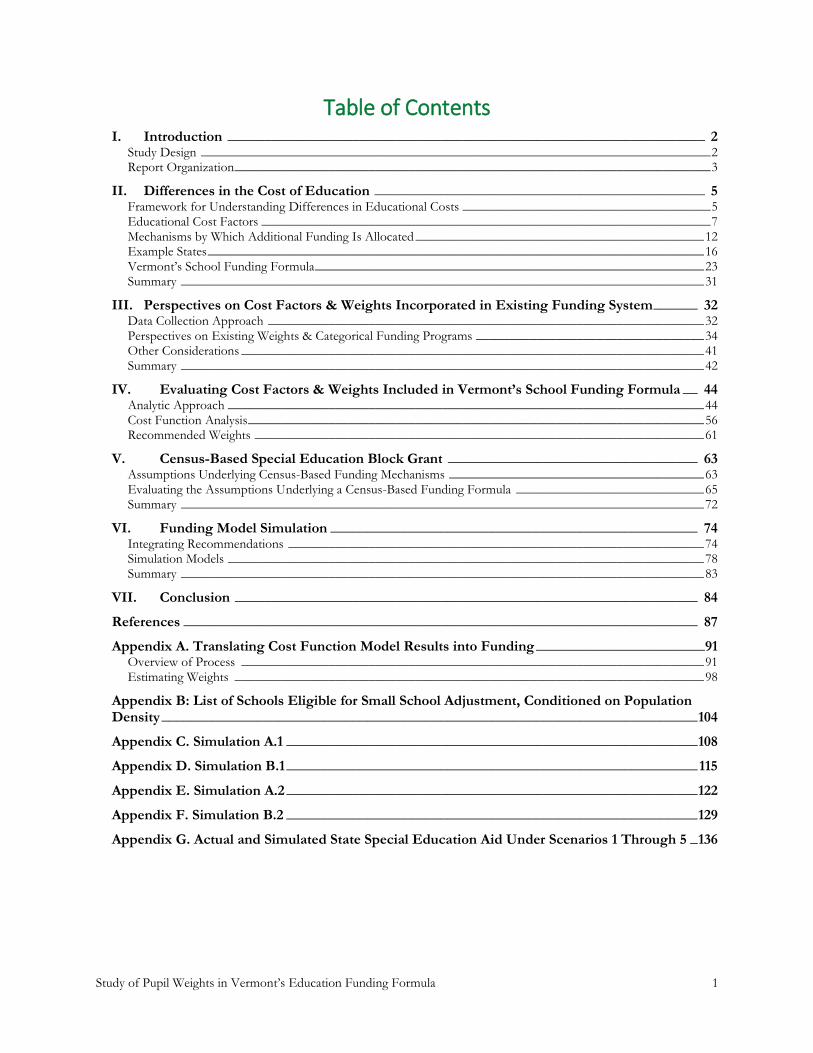
Table of Contents I. Introduction _________________________________________________________________ 2
Study Design ____________________________________________________________________________ 2 Report Organization _______________________________________________________________________ 3
II. Differences in the Cost of Education _____________________________________________ 5 Framework for Understanding Differences in Educational Costs _____________________________________ 5 Educational Cost Factors ___________________________________________________________________ 7 Mechanisms by Which Additional Funding Is Allocated ___________________________________________ 12 Example States __________________________________________________________________________ 16 Vermont’s School Funding Formula __________________________________________________________ 23 Summary ______________________________________________________________________________ 31
III. Perspectives on Cost Factors & Weights Incorporated in Existing Funding System ______ 32 Data Collection Approach _________________________________________________________________ 32 Perspectives on Existing Weights & Categorical Funding Programs __________________________________ 34 Other Considerations _____________________________________________________________________ 41 Summary ______________________________________________________________________________ 42
IV. Evaluating Cost Factors & Weights Included in Vermont’s School Funding Formula __ 44 Analytic Approach _______________________________________________________________________ 44 Cost Function Analysis ____________________________________________________________________ 56 Recommended Weights ___________________________________________________________________ 61
V. Census-Based Special Education Block Grant __________________________________ 63 Assumptions Underlying Census-Based Funding Mechanisms ______________________________________ 63 Evaluating the Assumptions Underlying a Census-Based Funding Formula ____________________________ 65 Summary ______________________________________________________________________________ 72
VI. Funding Model Simulation __________________________________________________ 74 Integrating Recommendations ______________________________________________________________ 74 Simulation Models _______________________________________________________________________ 78 Summary ______________________________________________________________________________ 83
VII. Conclusion _______________________________________________________________ 84
References ______________________________________________________________________ 87
Appendix A. Translating Cost Function Model Results into Funding _______________________ 91 Overview of Process _____________________________________________________________________ 91 Estimating Weights ______________________________________________________________________ 98
Appendix B: List of Schools Eligible for Small School Adjustment, Conditioned on Population Density _________________________________________________________________________ 104
Appendix C. Simulation A.1 ________________________________________________________ 108
Appendix D. Simulation B.1 ________________________________________________________ 115
Appendix E. Simulation A.2 ________________________________________________________ 122
Appendix F. Simulation B.2 ________________________________________________________ 129
Appendix G. Actual and Simulated State Special Education Aid Under Scenarios 1 Through 5 _ 136
Study of Pupil Weights in Vermont’s Education Funding Formula
2
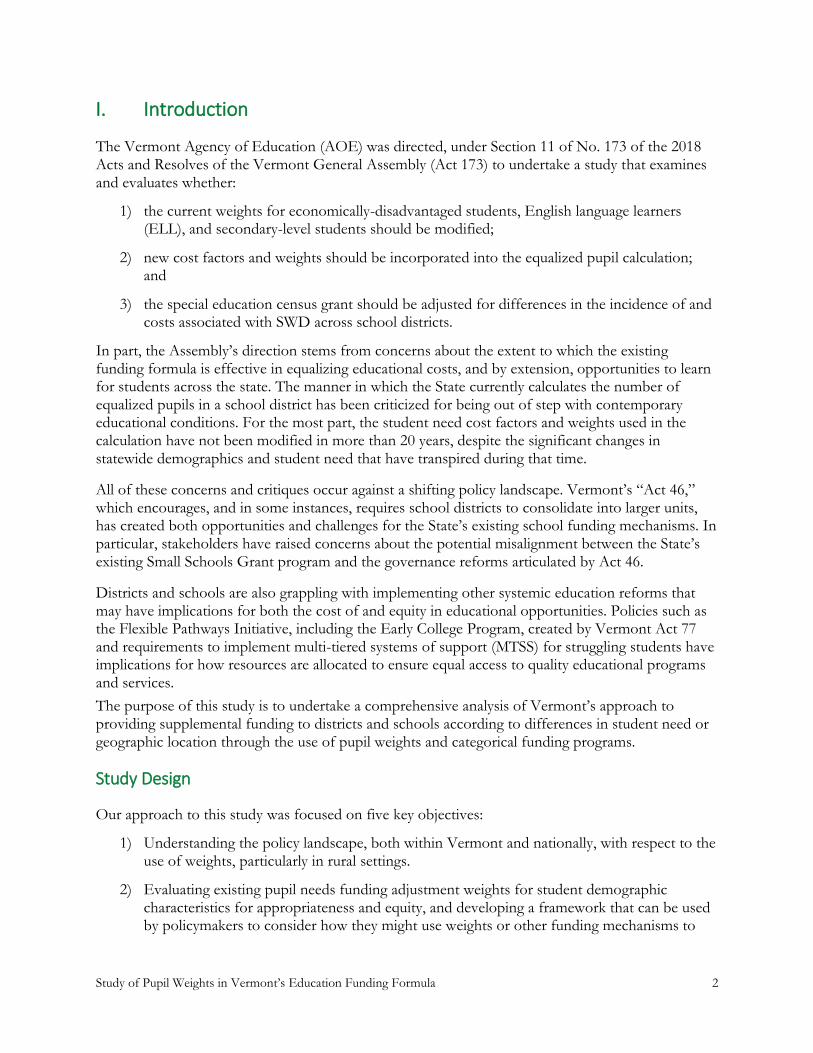
I. Introduction
The Vermont Agency of Education (AOE) was directed, under Section 11 of No. 173 of the 2018 Acts and Resolves of the Vermont General Assembly (Act 173) to undertake a study that examines and evaluates whether:
1) the current weights for economically-disadvantaged students, English language learners (ELL), and secondary-level students should be modified;
2) new cost factors and weights should be incorporated into the equalized pupil calculation; and
3) the special education census grant should be adjusted for differences in the incidence of and costs associated with SWD across school districts.
In part, the Assembly’s direction stems from concerns about the extent to which the existing funding formula is effective in equalizing educational costs, and by extension, opportunities to learn for students across the state. The manner in which the State currently calculates the number of equalized pupils in a school district has been criticized for being out of step with contemporary educational conditions. For the most part, the student need cost factors and weights used in the calculation have not been modified in more than 20 years, despite the significant changes in statewide demographics and student need that have transpired during that time.
All of these concerns and critiques occur against a shifting policy landscape. Vermont’s “Act 46,” which encourages, and in some instances, requires school districts to consolidate into larger units, has created both opportunities and challenges for the State’s existing school funding mechanisms. In particular, stakeholders have raised concerns about the potential misalignment between the State’s existing Small Schools Grant program and the governance reforms articulated by Act 46.
Districts and schools are also grappling with implementing other systemic education reforms that may have implications for both the cost of and equity in educational opportunities. Policies such as the Flexible Pathways Initiative, including the Early College Program, created by Vermont Act 77 and requirements to implement multi-tiered systems of support (MTSS) for struggling students have implications for how resources are allocated to ensure equal access to quality educational programs and services.
The purpose of this study is to undertake a comprehensive analysis of Vermont’s approach to providing supplemental funding to districts and schools according to differences in student need or geographic location through the use of pupil weights and categorical funding programs.
Study Design
Our approach to this study was focused on five key objectives:
1) Understanding the policy landscape, both within Vermont and nationally, with respect to the use of weights, particularly in rural settings.
2) Evaluating existing pupil needs funding adjustment weights for student demographic characteristics for appropriateness and equity, and developing a framework that can be used by policymakers to consider how they might use weights or other funding mechanisms to

Study of Pupil Weights in Vermont’s Education Funding Formula
3
direct additional resources to local school districts with larger proportions of students with different learning needs.
3) Considering whether districts and schools located in sparsely-populated areas of the state require additional funding to offset differences in economies of scale that impact the quality of education students receive, and if so, the amounts of additional resources needed and the potential funding mechanisms for distributing these funds.
4) Assessing the census grant amount established by the Vermont General Assembly in Act 173 (May 2018) to determine whether adjustments should be made, particularly for supervisory unions that serve greater concentrations of students with disabilities (SWD).
5) Developing a simulation model and tool that the Agency can use to predict the effect of various changes to pupil weights and other supplemental funds directed to districts on quality and equity.
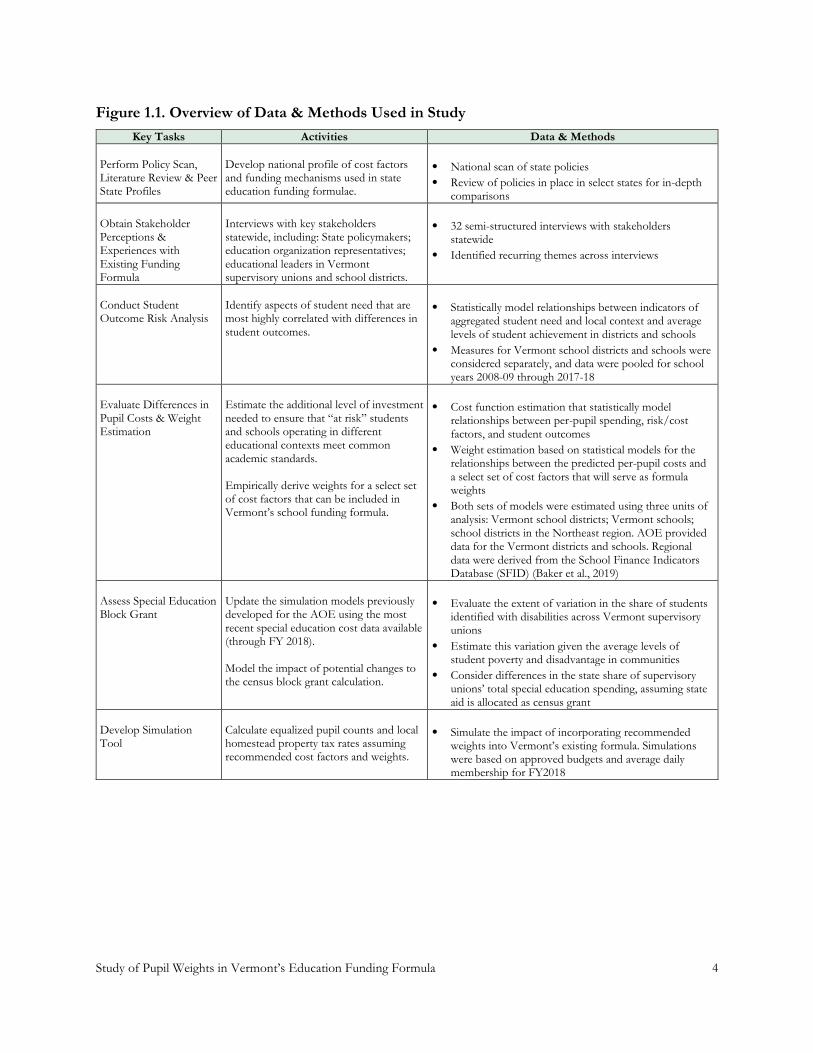
The multiple study objectives required different approaches to data collection and analysis. Figure 1.1 provides a summary of the methods used in this study.
Although each objective was tied to discrete sets of analyses, the study was a comprehensive effort, where the project tasks yielded information that was integrated into a synthetic report intended to guide discussion and decision making by Vermont policymakers.
Report Organization
The remainder of this report is organized as follows: The report’s second chapter presents findings from our national scan of state school funding policies and an in-depth review of nine states’ school funding policies. This is followed by a description of Vermont’s approach to adjusting for differences in educational costs across supervisory unions and school districts. The third chapter offers key findings from our stakeholder interviews on the perceptions of and experiences with Vermont’s existing school funding policies. The fourth chapter presents findings from the risk and cost analysis and concludes with recommendations for a new set of cost factors and weights that can be used in Vermont’s equalized pupil calculation. The following chapter considers whether adjustments to the special education census block grant are appropriate, and provides design considerations for revising existing policy. The sixth chapter presents findings from our simulations, and the final chapter summarizes our overall findings and recommendations.
Study of Pupil Weights in Vermont’s Education Funding Formula
4
Figure 1.1. Overview of Data & Methods Used in Study
Key Tasks Activities Data & Methods
Perform Policy Scan, Literature Review & Peer State Profiles
Develop national profile of cost factors and funding mechanisms used in state education funding formulae.
• National scan of state policies
• Review of policies in place in select states for in-depth comparisons
Obtain Stakeholder Perceptions & Experiences with Existing Funding Formula
Interviews with key stakeholders statewide, including: State policymakers; education organization representatives; educational leaders in Vermont supervisory unions and school districts.
• 32 semi-structured interviews with stakeholders statewide
• Identified recurring themes across interviews
Conduct Student Outcome Risk Analysis
Identify aspects of student need that are most highly correlated with differences in student outcomes.
• Statistically model relationships between indicators of aggregated student need and local context and average levels of student achievement in districts and schools
• Measures for Vermont school districts and schools were considered separately, and data were pooled for school years 2008-09 through 2017-18
Evaluate Differences in Pupil Costs & Weight Estimation
Estimate the additional level of investment needed to ensure that “at risk” students and schools operating in different educational contexts meet common academic standards. Empirically derive weights for a select set of cost factors that can be included in Vermont’s school funding formula.
• Cost function estimation that statistically model relationships between per-pupil spending, risk/cost factors, and student outcomes
• Weight estimation based on statistical models for the relationships between the predicted per-pupil costs and a select set of cost factors that will serve as formula weights
• Both sets of models were estimated using three units of analysis: Vermont school districts; Vermont schools; school districts in the Northeast region. AOE provided data for the Vermont districts and schools. Regional data were derived from the School Finance Indicators Database (SFID) (Baker et al., 2019)
Assess Special Education Block Grant
Update the simulation models previously developed for the AOE using the most recent special education cost data available (through FY 2018). Model the impact of potential changes to the census block grant calculation.
• Evaluate the extent of variation in the share of students identified with disabilities across Vermont supervisory unions
• Estimate this variation given the average levels of student poverty and disadvantage in communities
• Consider differences in the state share of supervisory unions’ total special education spending, assuming state aid is allocated as census grant
Develop Simulation Tool
Calculate equalized pupil counts and local homestead property tax rates assuming recommended cost factors and weights.
• Simulate the impact of incorporating recommended weights into Vermont’s existing formula. Simulations were based on approved budgets and average daily membership for FY2018

Study of Pupil Weights in Vermont’s Education Funding Formula
5
II. Differences in the Cost of Education
States are responsible for ensuring equal educational opportunities for all students. Equal opportunity, however, does not necessarily translate to equal educational resources. Students come to school with dissimilar learning needs and socioeconomic backgrounds that may require different types and levels of educational supports for them to achieve common standards or outcomes. Similarly, schools in different contexts may also require different levels of resources due to scale of operations or the price they must pay for key resources.
Dissimilar resource requirements translate to differences in the cost of education among school districts. Higher educational costs, however, may pose a greater or lesser financial burden to local communities, depending on their capacity to raise revenue through local property and income taxes. Without additional funding, some communities may be either unable or unwilling to pay for the additional resources necessary to ensure an adequate education for its students.
Presently, all states operate school funding formula and supplemental grants-in-aid programs that attempt to address differences in educational costs across school districts, while simultaneously considering differences in the ability of local communities to pay for these costs. However, there is considerable variation across states in the policies and level of funding available.
In the following sections, we present a framework for understanding differences in educational costs among school districts. We then describe the range of cost factors states adjust for in their education funding policies and present a typology of the different approaches states use to allocate additional aid to school districts to offset differences in costs. To illustrate different approaches used by states, we describe existing policies used by six example states.
Framework for Understanding Differences in Educational Costs
The cost of educating students to common standards varies across school districts. Cost is the level of spending required to achieve any given set of outcome goals. Typically, outcome goals are operationalized as achieving common targets on state assessments or graduation rates. Cost factors are things that affect the level of spending required to achieve stated goals and are outside the control of local district administers.
For example, schools or districts with limited enrollment may face circumstances where their size is insufficient to achieve economies of scale and as a result have higher educational costs to achieve a common outcome goal than their peers with higher enrollments. This is a cost factor if schools or districts cannot readily be consolidated to mitigate that cost difference. If consolidation is an option, the additional spending by smaller schools is an inefficiency – i.e., they are small by choice, spending above what is needed to achieve the desired outcomes.
School districts may make many other choices that result in spending differences but are not cost differences. These include the choice to provide more programs and services or smaller classes than might be absolutely necessary to merely achieve the outcome targets in question. Those choices may result in achieving higher outcomes, or different outcomes (as with arts and athletic programs). These spending differences are not necessarily inefficiencies, but rather, spending choices based on local preferences. They are not, however, considered cost factors for the purposes of developing state education funding policy.

Study of Pupil Weights in Vermont’s Education Funding Formula
6
Figure 2.1 describes the primary categories of cost factors that affect districts and schools.1 Two types of student risk factors – individual student factors and collective population characteristics – impact education costs. Individual students with specific educational needs (e.g., SWD; ELL students) may need specialized programs, services or interventions to achieve common outcomes. These efforts can require additional resources to implement, which come at an additional cost to a school district.
There are other collective characteristics of the student population, such as the local concentration of student economic disadvantage, that may require schoolwide intervention to achieve common outcomes. For instance, an economically disadvantaged child may not have a specific identifiable educational need to be remediated, but a school population of disadvantaged children may require smaller classes, early childhood programs, and/or other services to have equal opportunity to achieve common goals. Designing educational environments and implementing comprehensive programs appropriate for concentrations of students with similar needs may face higher-than-average educational costs to educate all students to common outcomes.
School and district structure, organization and location may also affect “costs” (i.e., constitute cost factors) to the extent that those features are generally unalterable. Economies of scale is a major cost factor for very small schools and districts that are remotely located, and thus unable to consolidate to achieve scale (Andrews, Duncombe and Yinger, 2002). Research has shown that districts with fewer than 100 students may operate at more than double the per pupil cost of scale efficient districts serving over 2,000 pupils and districts with 100 to 300 students about 50% more (Baker, 2005). Most of these cost differences are driven by the underlying staffing ratios and not overhead expenses. Additionally, population sparsity affects transportation costs because students must travel further average distances to school.
Finally, there are differences in input prices faced by districts in one location versus another. As with “costs” generally, input price variation speaks to differences in the price one must pay for a specific good or service of specific characteristics/qualities. Teacher and other employee wages are the most commonly addressed input price factor in schooling, mainly because they make up the largest share of education spending. The wages required to recruit and retain teachers, administrators, and other types of staff may vary significantly across different regions of a state (Chambers, 1995; Taylor, 2006).
1 See Duncombe and Yinger (2005) for a discussion of factors that differentially impact educational costs.

Study of Pupil Weights in Vermont’s Education Funding Formula
7
Figure 2.1. Factors Affecting the Costs of Achieving Common Outcome Goals
Note. Cost is the spending required, less inefficiency, to achieve any specific set of outcome goals
Cost differences attributable to factors outside of district control pose a risk to equal educational opportunities for all students. Differences in student needs and educational contexts create conditions where school districts must spend more for students to reach state standards. Yet, not all districts have the same ability to pay for these costs (Baker, 2018). Local school district capacity to raise revenue is typically a function of local taxable property wealth and the incomes of local property owners. The risk is that school districts with less wealth (property, income, or both) will be unable to raise sufficient dollars or unwilling to assume the tax burden necessary to spend at the level required to ensure its students attain desired outcomes. It is in these instances that states have put in place policies that direct additional resources to school districts to offset differences in the cost of educating students to common standards.
Educational Cost Factors
Most states implement K12 education funding policies that take into account differences in the cost of educating students. A key goal for these policies has been to develop programs that provide additional resources to school districts to offset higher costs, particularly those located in communities that are less able to raise the revenues needed to pay for the cost of education (Baker, 2018).
While each state’s funding policies operate differently, most state policies first, recognize a core set of cost factors that contribute to differences in educational costs across districts, and then use one or more common mechanisms to distribute additional aid to offset the additional costs introduced by these factors. Together, the cost factors and mechanisms incorporated in state funding policies comprise the building blocks of state efforts to redistribute educational resources among school districts.
In the following sections, we describe the range of cost factors considered by state policies. We then provide a typology of the funding mechanisms states use to allocate additional resources to school districts to offset differences in educational costs. To illustrate different approaches used by states, we describe existing policies in nine example states.

Study of Pupil Weights in Vermont’s Education Funding Formula
8
Cost Factors Considered in State Funding Formula Cost factors incorporated in state funding formula fall into four broad categories that adjust for costs associated with differences in: (1) student need; (2) scale of operations; (3) grade level; and (4) resource prices.
Student Need All state funding policies incorporate adjustments for differences in the cost of educating students with higher levels of need.2 Student characteristics considered by state policies include: a) SWD; b) socio-economic disadvantage; c) ELL; and d) gifted and talented students.
Students with disabilities. Despite federal law and regulations that articulate detailed requirements that states and districts must follow, the federal government plays a relatively limited role in funding educational programs for SWD. A limited federal role in paying for special education places states in the position of deciding whether and to what extent they will step in to help localities pay for special education. Absent state funding, the risk is that localities cannot, and possibly will not, meet their obligations to educate children with disabilities. In response, all states provide some form of supplemental funding to pay for some portion of the additional cost of providing special education and related services to SWD.3
Socio-economic disadvantage. Nearly all states consider differences in student disadvantage, and the resulting increase in educational costs that come with investments in compensatory education programs and student support services for students living in poverty or who have been identified as at-risk for academic failure.4
The most commonly-used indicator for the extent of student need in a school district is the share of students who receive or who are eligible to receive nutrition benefits through federal and state school lunch programs (e.g., Free- or Reduced Price Lunch, FRPL) or other state aid programs for needy families (e.g., Supplemental Nutrition Assistance Program, SNAP; Medicaid). The extent of need in a school district is typically tied to either a count of students (per capita) who meet specified criteria or the percentage of a district’s or school’s population who are identified as economically disadvantaged.
A smaller number of states use average levels of student achievement in a school district to identify districts that require additional resources. In Georgia, the state provides additional funding for remedial students – i.e., those that are identified as not reaching or maintaining adequate academic
2 The survey state policies included in this section is largely based on the results of a national scan of state policies completed by Augenblick, Palaich & Associates (2018) for the State of Nevada. We build on their work with our own review of state policies and by summarizing tabulated findings presented in the report’s appendices. In the sections that follow, we provide additional footnotes that point the reader to the specific appendices from the Augenblick report where the reader can find additional detail on state-specific policies. 3 A complex array of federal, state, and local sources funds special education, with the federal government paying the smallest portion, and the balance of cost shared between states and localities. Over time, states have developed very different funding policies. In fact, the existing policy landscape includes 50 distinct state funding policies, each of which places different limits on state funding obligations and imposes requirements for localities wanting to access state funding. (See Kolbe, 2019.) 4 As of AY 2018, three states (Alaska, Delaware, and South Dakota) did not provide additional state funding for at-risk students. For a state-by-state overview of state policies, see Appendix D: Funding Mechanisms for At-Risk Students in Augenblick, Palaich, & Associates’ (2018) recent policy report. The information about state policies presented in this section is based on the state policy overview summary in this appendix.

Study of Pupil Weights in Vermont’s Education Funding Formula
9
achievement relative to grade level, and school districts in Florida may apply for funding from the Supplemental Academic Instruction Categorical Fund by submitting a plan that identifies students to be served and the scope of academic instruction to be provided.
When considering differences in costs among school districts, some states also distinguish among districts according to the concentration, or density, of economically-disadvantaged or at-risk students. For instance, California’s formula includes a “concentration grant” that allocates an additional 50% of the adjusted base grant amount to districts with more than 55% of students meeting the state’s definition of “at-risk” student (the unduplicated count of FRPL-eligible students, ELL students, or foster youth). Alternatively, other states use a sliding scale to allocate state aid, where districts with greater concentrations of students living in poverty receive more aid per student than those with proportionately fewer students (e.g., Nebraska, New Jersey).
English language learners. Similarly, all but two states provide additional funding to educate students who are unable to communicate fluently or learn effectively in English.5 ELL students have different language, academic, and socio-emotional needs that require specialized instruction and support services for them to meet common academic standards.
As was the case for economically-disadvantaged and at-risk students, most states adjust for either the number or share of ELL students served by a school district. Maine, however, applies a sliding scale that corresponds with the concentration of ELL students in a district, with larger concentrations of ELL students resulting in increasingly larger weighting factors. By contrast, Hawaii assigns different weights according to students’ levels of English language proficiency – i.e., larger weights for students who are less proficient in English and smaller weights for students with greater proficiency. Massachusetts’ formula places additional weight on ELL students, but the weight varies according to students’ grade level.
Gifted and talented students. Thirty-five states implement policies that provide school districts with additional funding for programs targeted at gifted and talented students.6 The majority of states allocate funding on a per-capita (student count) basis. However, across states, there is no commonly accepted approach to identifying the number or share of gifted and talented students in a school district.
By contrast, a few states assume that the share of gifted and talented students is the same for all school districts – for instance, Arkansas and North Carolina assume that 4% of a school district’s membership qualifies as gifted and talented and provides funding based on this basis. Alternatively, some states embed funding for gifted and talented students in their special education funding programs (e.g., Kentucky, Georgia, Tennessee). In Oregon, school districts may apply to the state for additional funding to pay for educational programs and services for gifted and talented students.
5 As of AY2018, Mississippi and Montana were the only two states that did not provide school districts with additional funding to offset the additional costs associated with educating students who are ELL. For a state-by-state summary of state policies, see Appendix E: Funding Mechanisms for ELL in Augenblick, Palich & Associates’ (2018) recent policy report. 6 Two other states (Illinois & Maryland) have programs in statute that operate on a “funds available” basis, and 13 states do not provide supplemental funding to local school districts for gifted and talented programs. For a state-by-state overview of state policies, see Appendix F: Funding Mechanisms for Gifted/Talented Students in Augenblick, Palaich & Associates’ (2018) recent policy report. The information about state policies presented in this section is based on the state policy overview presented in this appendix.
Study of Pupil Weights in Vermont’s Education Funding Formula
10
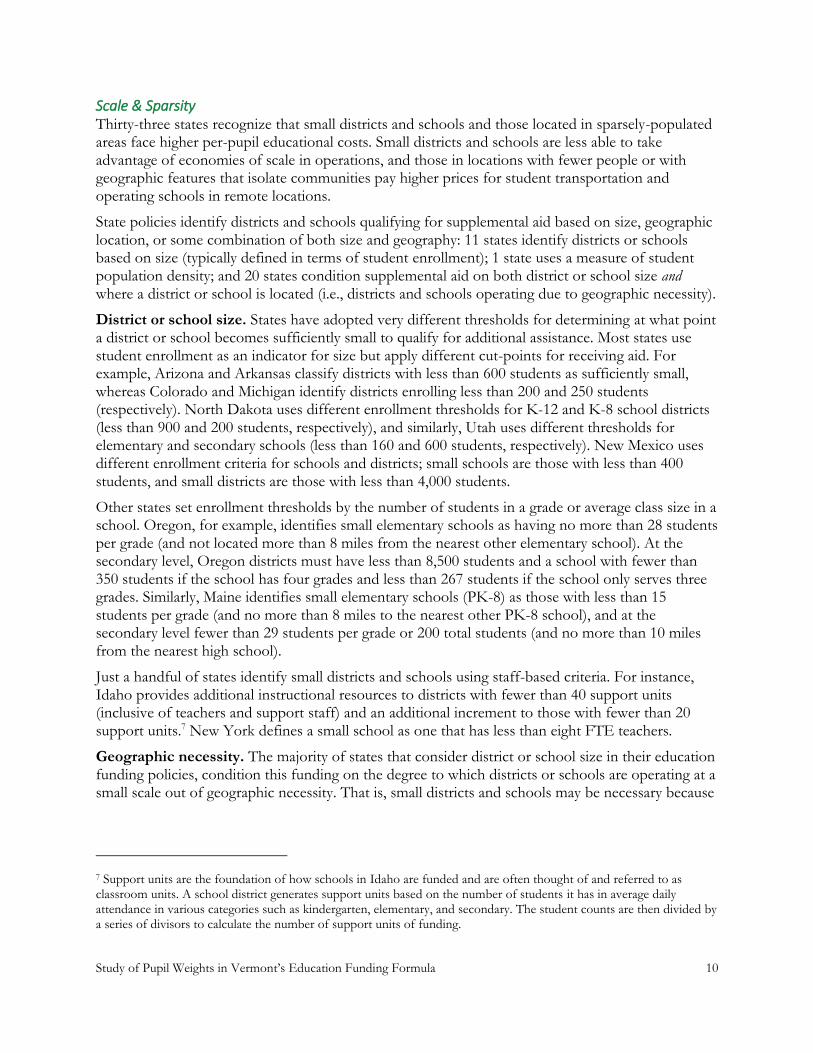
Scale & Sparsity Thirty-three states recognize that small districts and schools and those located in sparsely-populated areas face higher per-pupil educational costs. Small districts and schools are less able to take advantage of economies of scale in operations, and those in locations with fewer people or with geographic features that isolate communities pay higher prices for student transportation and operating schools in remote locations.
State policies identify districts and schools qualifying for supplemental aid based on size, geographic location, or some combination of both size and geography: 11 states identify districts or schools based on size (typically defined in terms of student enrollment); 1 state uses a measure of student population density; and 20 states condition supplemental aid on both district or school size and where a district or school is located (i.e., districts and schools operating due to geographic necessity).
District or school size. States have adopted very different thresholds for determining at what point a district or school becomes sufficiently small to qualify for additional assistance. Most states use student enrollment as an indicator for size but apply different cut-points for receiving aid. For example, Arizona and Arkansas classify districts with less than 600 students as sufficiently small, whereas Colorado and Michigan identify districts enrolling less than 200 and 250 students (respectively). North Dakota uses different enrollment thresholds for K-12 and K-8 school districts (less than 900 and 200 students, respectively), and similarly, Utah uses different thresholds for elementary and secondary schools (less than 160 and 600 students, respectively). New Mexico uses different enrollment criteria for schools and districts; small schools are those with less than 400 students, and small districts are those with less than 4,000 students.
Other states set enrollment thresholds by the number of students in a grade or average class size in a school. Oregon, for example, identifies small elementary schools as having no more than 28 students per grade (and not located more than 8 miles from the nearest other elementary school). At the secondary level, Oregon districts must have less than 8,500 students and a school with fewer than 350 students if the school has four grades and less than 267 students if the school only serves three grades. Similarly, Maine identifies small elementary schools (PK-8) as those with less than 15 students per grade (and no more than 8 miles to the nearest other PK-8 school), and at the secondary level fewer than 29 students per grade or 200 total students (and no more than 10 miles from the nearest high school).
Just a handful of states identify small districts and schools using staff-based criteria. For instance, Idaho provides additional instructional resources to districts with fewer than 40 support units (inclusive of teachers and support staff) and an additional increment to those with fewer than 20 support units.7 New York defines a small school as one that has less than eight FTE teachers.
Geographic necessity. The majority of states that consider district or school size in their education funding policies, condition this funding on the degree to which districts or schools are operating at a small scale out of geographic necessity. That is, small districts and schools may be necessary because
7 Support units are the foundation of how schools in Idaho are funded and are often thought of and referred to as classroom units. A school district generates support units based on the number of students it has in average daily attendance in various categories such as kindergarten, elementary, and secondary. The student counts are then divided by a series of divisors to calculate the number of support units of funding.

Study of Pupil Weights in Vermont’s Education Funding Formula
11
they are located in sparsely populated areas or are geographically bounded in ways that make consolidation with other entities impracticable.8
State policies differ in how they measure population density and the threshold used to determine which districts are located in sparsely populated areas. For example, Michigan defines a sparsely-populated school district as having fewer than 4.5 students per square mile, whereas Wisconsin identifies districts with less than 10 students per square mile and New York identifies at less than 25 pupils per square mile. By contrast, North Dakota defines sparsity as fewer than 100 students in a 275 square mile area (i.e., equivalent to 0.36 students per square mile).
In addition to population density, some state policies also incorporate criteria based on a school district’s physical geography and the distance between neighboring districts and schools. When considering physical geography, states recognize that some school districts operate in remote or geographically-isolated areas. In Maine, additional consideration is given to districts in remote areas of the state and “island schools.” Michigan qualifies supplemental aid to small and remote schools in the Upper Peninsula on being at least 30 miles from any other public school or being located “on islands that are not accessible by bridge.” Arkansas’ definition of a geographically-necessary school identifies those where no more than 50% of the bus route is on “hard-surfaced roads” or where “geographic barriers” impede travel to other programs.
Some states further condition aid on the driving distance between districts or schools. In Arkansas, for instance, a district must not only have low enrollment and be located in a geographically sparse area, but it must also be at least 12 miles from the nearest out-of-district high school. To qualify for additional aid in Colorado, a small school must be at least 20 miles from the nearest district school with the same grade levels. Similarly, in Nebraska, small elementary schools must be at least seven miles away from the nearest elementary school or the only elementary school in their district.
Grade Range Thirty-two states’ funding formula adjust for differences in educational costs across grade levels (EdBuild, n.d.).9 Cost differences across grade levels can be tied to smaller class sizes in early elementary grades and increased course offerings and supplemental academic and non-academic programming in the middle- and secondary-grades. For example, of the states that adjust for differences in costs associated with educating students in different grade levels, most consider cost differences across multiple grade spans (e.g., K-3, 4-8, 7-8, and 9-12).
Resource Prices Eleven states adjust for differences in the price school districts must pay to hire similarly qualified teachers (Taylor, 2015). States use one of three approaches to adjust for cost: (1) Comparable Wage Index (CWI), which measures regional differences in the cost of hiring teachers by comparing regional differences in the cost of hiring of non-teachers in comparable fields (e.g., Florida, Massachusetts & New York); (2) Comparable Living Index (CLI), which describes the differences among communities in the cost of a purchasing a similar “basket” of consumer goods and services
8 In FY2018, of the 33 states with funding policies that consider differences in costs due to scale in operations across districts or schools, 20 conditioned this funding on both district (or school) size and some indicator of sparsity in population or geographic constraint that makes consolidation with other entities impracticable. 9 Information presented in this section about state policies that provide varying levels of funding is based on the state policy overview prepared by EdBuild (n.d.).
Study of Pupil Weights in Vermont’s Education Funding Formula
12
(e.g., Colorado); and (3) Hedonic Wage Index, which adjusts costs based on factors that impact teachers’ employment choices (within education) and attempt to provide districts with comparable resources to recruit and retain teachers of similar quality (e.g., Maine & Maryland) (Baker, 2008; Taylor, 2015).10
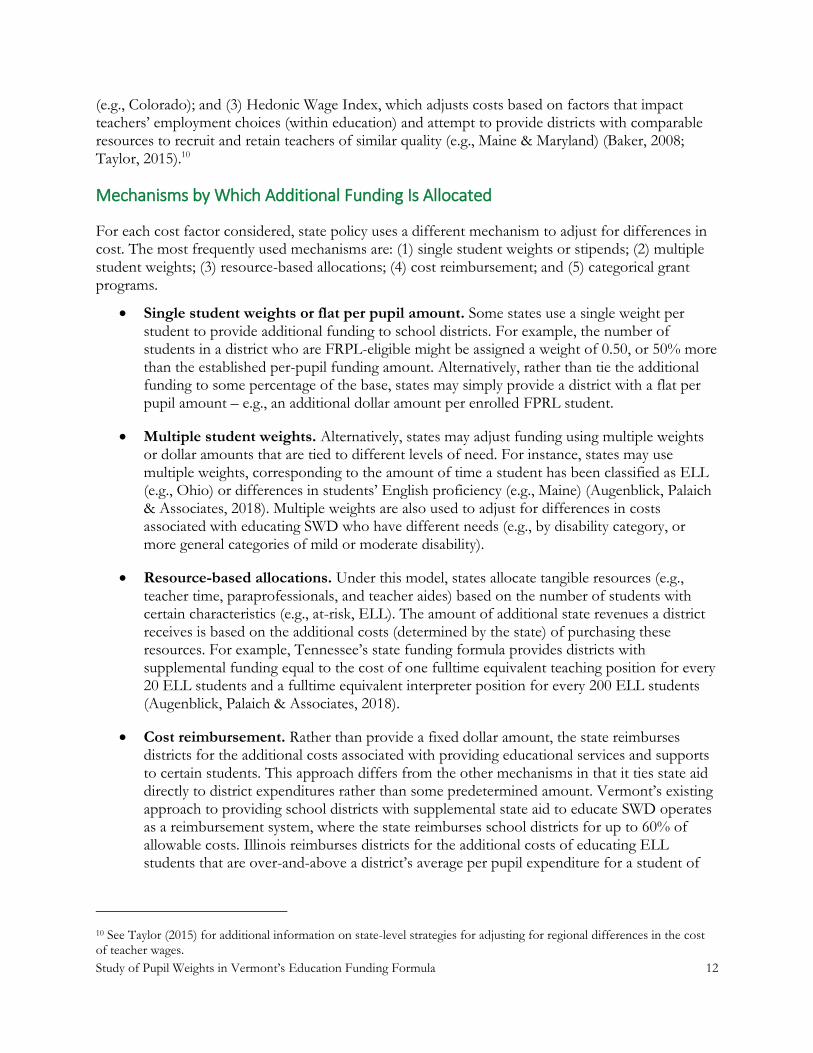
Mechanisms by Which Additional Funding Is Allocated
For each cost factor considered, state policy uses a different mechanism to adjust for differences in cost. The most frequently used mechanisms are: (1) single student weights or stipends; (2) multiple student weights; (3) resource-based allocations; (4) cost reimbursement; and (5) categorical grant programs.
Single student weights or flat per pupil amount. Some states use a single weight per student to provide additional funding to school districts. For example, the number of students in a district who are FRPL-eligible might be assigned a weight of 0.50, or 50% more than the established per-pupil funding amount. Alternatively, rather than tie the additional funding to some percentage of the base, states may simply provide a district with a flat per pupil amount – e.g., an additional dollar amount per enrolled FPRL student.
Multiple student weights. Alternatively, states may adjust funding using multiple weights or dollar amounts that are tied to different levels of need. For instance, states may use multiple weights, corresponding to the amount of time a student has been classified as ELL (e.g., Ohio) or differences in students’ English proficiency (e.g., Maine) (Augenblick, Palaich & Associates, 2018). Multiple weights are also used to adjust for differences in costs associated with educating SWD who have different needs (e.g., by disability category, or more general categories of mild or moderate disability).
Resource-based allocations. Under this model, states allocate tangible resources (e.g., teacher time, paraprofessionals, and teacher aides) based on the number of students with certain characteristics (e.g., at-risk, ELL). The amount of additional state revenues a district receives is based on the additional costs (determined by the state) of purchasing these resources. For example, Tennessee’s state funding formula provides districts with supplemental funding equal to the cost of one fulltime equivalent teaching position for every 20 ELL students and a fulltime equivalent interpreter position for every 200 ELL students (Augenblick, Palaich & Associates, 2018).
Cost reimbursement. Rather than provide a fixed dollar amount, the state reimburses districts for the additional costs associated with providing educational services and supports to certain students. This approach differs from the other mechanisms in that it ties state aid directly to district expenditures rather than some predetermined amount. Vermont’s existing approach to providing school districts with supplemental state aid to educate SWD operates as a reimbursement system, where the state reimburses school districts for up to 60% of allowable costs. Illinois reimburses districts for the additional costs of educating ELL students that are over-and-above a district’s average per pupil expenditure for a student of
10 See Taylor (2015) for additional information on state-level strategies for adjusting for regional differences in the cost of teacher wages.
Study of Pupil Weights in Vermont’s Education Funding Formula
13
comparable age and who does not receive special education or related services (Augenblick, Palaich & Associates, 2018).
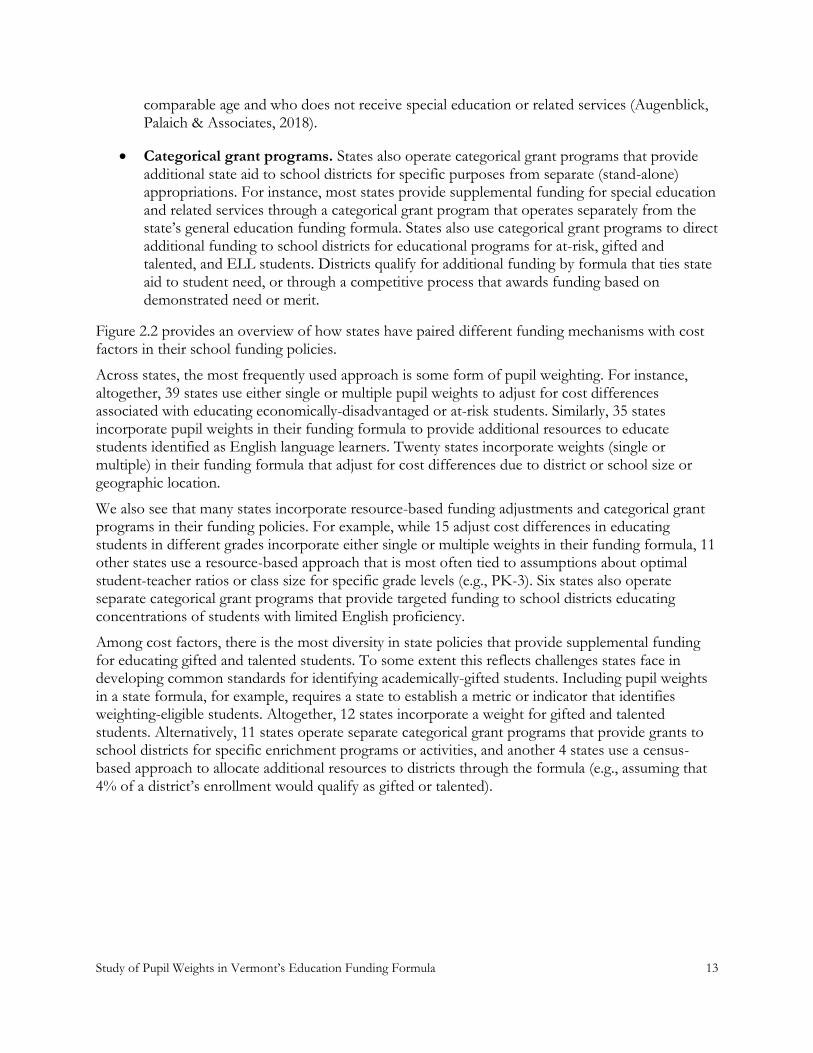
Categorical grant programs. States also operate categorical grant programs that provide additional state aid to school districts for specific purposes from separate (stand-alone) appropriations. For instance, most states provide supplemental funding for special education and related services through a categorical grant program that operates separately from the state’s general education funding formula. States also use categorical grant programs to direct additional funding to school districts for educational programs for at-risk, gifted and talented, and ELL students. Districts qualify for additional funding by formula that ties state aid to student need, or through a competitive process that awards funding based on demonstrated need or merit.
Figure 2.2 provides an overview of how states have paired different funding mechanisms with cost factors in their school funding policies.
Across states, the most frequently used approach is some form of pupil weighting. For instance, altogether, 39 states use either single or multiple pupil weights to adjust for cost differences associated with educating economically-disadvantaged or at-risk students. Similarly, 35 states incorporate pupil weights in their funding formula to provide additional resources to educate students identified as English language learners. Twenty states incorporate weights (single or multiple) in their funding formula that adjust for cost differences due to district or school size or geographic location.
We also see that many states incorporate resource-based funding adjustments and categorical grant programs in their funding policies. For example, while 15 adjust cost differences in educating students in different grades incorporate either single or multiple weights in their funding formula, 11 other states use a resource-based approach that is most often tied to assumptions about optimal student-teacher ratios or class size for specific grade levels (e.g., PK-3). Six states also operate separate categorical grant programs that provide targeted funding to school districts educating concentrations of students with limited English proficiency.
Among cost factors, there is the most diversity in state policies that provide supplemental funding for educating gifted and talented students. To some extent this reflects challenges states face in developing common standards for identifying academically-gifted students. Including pupil weights in a state formula, for example, requires a state to establish a metric or indicator that identifies weighting-eligible students. Altogether, 12 states incorporate a weight for gifted and talented students. Alternatively, 11 states operate separate categorical grant programs that provide grants to school districts for specific enrichment programs or activities, and another 4 states use a census-based approach to allocate additional resources to districts through the formula (e.g., assuming that 4% of a district’s enrollment would qualify as gifted or talented).

Study of Pupil Weights in Vermont’s Education Funding Formula
14
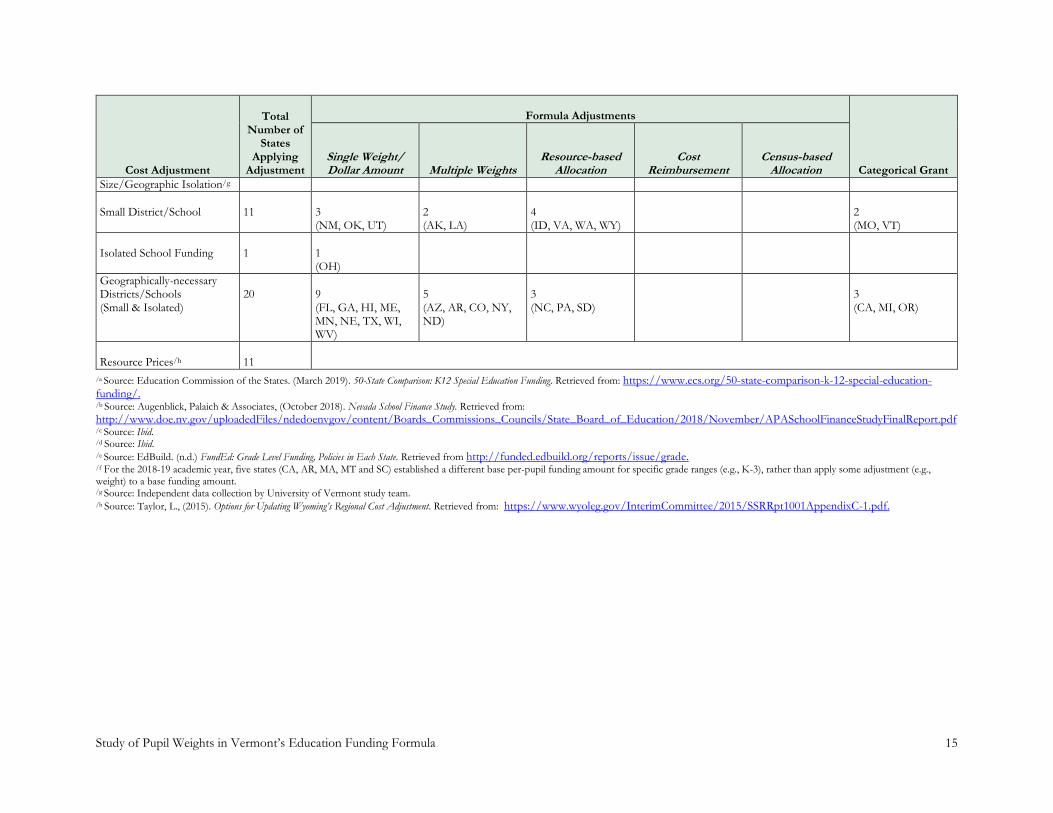
Figure 2.2. Overview of Approaches Used by States to Adjust for Cost Differences Across School Districts
Cost Adjustment
Total
Number of States
Applying Adjustment
Formula Adjustments
Categorical Grant
Single Weight/ Dollar Amount
Multiple Weights
Resource-based Allocation
Cost Reimbursement
Census-based Allocation
Students With Disabilities/a
50
11 (AK, LA, MD, MO, NV, NH, NY, NC, ND, OR, WA)
16 (AZ, CO, FL, GA, IN, IA, KY, ME, MN, NM, OH, OK, PA, SC, SD, TX)
8 (DE, HI, IL, MS, TN, VT, VA, WV)
6 (MI, NE, RI, VT, WI, WY)
5 (AL, CA, ID, MA, NJ)
2 (MT, UT) 2 (State Funding for High-cost students only: AR, CT)
Economically-disadvantaged/At-risk Students/b
46
31 (AL, AZ, CA, CT, HI, IN, IA, KY, LA, ME, MO, MA, MI, MN, MS, MO, NH, NM, NV, NY, ND, OH, OK, OR, RI, SC, TX, VT, WA, WV, WY)
8 (AR, CO, IL, KS, NE, NJ, PA, VA)
4 (GA, ID, NC, TN)
4 (FL, MT, UT, WI)
English Language Learners/c
48
25 (AK, AZ, AR, CA, FL, GA, IS, KS, KY, LA, MD, MO, NE, NH, NJ, NM, OK, OR, PA, RI, SC, SD, TX, VT, WY)
10 (CO, HI, IN, ME, MA, MI, MN, NY, ND, OH)
5 (DE, NC, TN, VA, WA)
2 (IL, WI)
6 (AL, CT, ID, NV, UT, WV)
Gifted & Talented Students/d
35
10 (AK, GA, IA, LA, MN, NV, OK, SC, TX, WY)
2 (KY, NM)
5 (DE, MS, OH, TN, VA)
3 (CT, ND, PA)
4 (AZ, HI, NC, WA)
11 (AR, CO, FL, ID, IN, ME, MT, NE, OR, UT, WI)
Grade Level/e
32/f
7 (LA, ME, MI, MN, OH, TX, VT)
8 (AZ, CA, FL, GA, HI, NJ, NM, OK)
11 (AL, AR, DE, ID, IL, NV, NC, TN, VA, WA, WY)
1 (UT)
Study of Pupil Weights in Vermont’s Education Funding Formula
15
Cost Adjustment
Total
Number of States
Applying Adjustment
Formula Adjustments
Categorical Grant
Single Weight/ Dollar Amount
Multiple Weights
Resource-based Allocation
Cost Reimbursement
Census-based Allocation
Size/Geographic Isolation/g
Small District/School
11
3 (NM, OK, UT)
2 (AK, LA)
4 (ID, VA, WA, WY)
2 (MO, VT)
Isolated School Funding
1
1 (OH)
Geographically-necessary Districts/Schools (Small & Isolated)
20
9 (FL, GA, HI, ME, MN, NE, TX, WI, WV)
5 (AZ, AR, CO, NY, ND)
3 (NC, PA, SD)
3 (CA, MI, OR)
Resource Prices/h
11
/a Source: Education Commission of the States. (March 2019). 50-State Comparison: K12 Special Education Funding. Retrieved from: https://www.ecs.org/50-state-comparison-k-12-special-education-funding/. /b Source: Augenblick, Palaich & Associates, (October 2018). Nevada School Finance Study. Retrieved from:
http://www.doe.nv.gov/uploadedFiles/ndedoenvgov/content/Boards_Commissions_Councils/State_Board_of_Education/2018/November/APASchoolFinanceStudyFinalReport.pdf /c Source: Ibid. /d Source: Ibid. /e Source: EdBuild. (n.d.) FundEd: Grade Level Funding, Policies in Each State. Retrieved from http://funded.edbuild.org/reports/issue/grade. /f For the 2018-19 academic year, five states (CA, AR, MA, MT and SC) established a different base per-pupil funding amount for specific grade ranges (e.g., K-3), rather than apply some adjustment (e.g., weight) to a base funding amount. /g Source: Independent data collection by University of Vermont study team. /h Source: Taylor, L., (2015). Options for Updating Wyoming’s Regional Cost Adjustment. Retrieved from: https://www.wyoleg.gov/InterimCommittee/2015/SSRRpt1001AppendixC-1.pdf.

Study of Pupil Weights in Vermont’s Education Funding Formula
16
Example States
All states incorporate multiple cost factors, and funding mechanisms, in their overarching school funding policies. Together, these factors and mechanisms work together to provide different types and amounts of supplemental state aid to school districts to offset differences in educational costs.
To illustrate, we describe the current policies in place in nine example states, including: Alaska, Connecticut, Delaware, Maine, Massachusetts, New Hampshire, New Jersey, Rhode Island, and Wyoming. Included in our profile are states located in the Northeast region, and other states outside the region that share relevant demographic and geographic characteristics with Vermont. That said, the selected state profiles are not intended to serve as policy archetypes but rather are provided as holistic examples of the range of cost factors and funding mechanisms incorporated in state education funding policies.11
Figure 2.3 presents an overview of selected states’ funding policies, and in the sections that follow, we describe each states’ general approach to adjusting for cost differences across school districts.
Alaska
Alaska operates a foundation formula for allocating state aid to school districts, with a base per pupil funding amount of $5,930 (FY17; Augenblick, Palaich, & Associates, 2018). The state uses a single pupil weight (1.2) to provide additional funding to school districts for SWD, gifted and talented students, students participating in vocational education, and students receiving bilingual education services. The formula provides additional funding, over-and-above that generated by the single weight, for high-need SWD.12 Notably, Alaska is one of the few states that does not adjust for cost differences for at-risk students.
The state’s formula also adjusts its base funding amount for the additional costs associated with operating small school districts (defined as having less than 750 students). Multipliers are set annually and correspond to specific district enrollment cut points. Most recently, the weights fell within the range of 1.0-2.116 per pupil. Additionally, the formula also adjusts for differences in resource costs using a district cost factor that is based on a hedonic wage index that accounts for the difference in price that districts must pay to employ similarly qualified instructional staff.
Connecticut
Connecticut operates a foundation formula for allocating state aid to school districts, with a base per pupil funding amount of $11,525 (FY17; Augenblick, Palaich, & Associates, 2018).
Connecticut is one of four states that does not operate a special education funding system; instead, local school districts receive funding for special education through the state’s main education equalization aid grant (the Education Cost Sharing [ECS] grant) (Connecticut School Finance Project, 2016). Districts are eligible to receive supplemental assistance for high-cost SWD from
11 The states included in our profiles were selected in cooperation with AOE based on the following criteria: (1) regional peer states; (2) size; (3) rurality and prevalence of schools operating in geographically-isolated areas. The selection process did not consider whether states operated an adequate or equitably-funded system, but rather selected states are intended to provide policymakers with a general overview of how states of similar size and geographic circumstances have implemented their school funding policies. 12 Alaska’s funding formula further adjusts for the number of students with disabilities that require “intensive services.” Specifically, the formula inflates a district’s student count by 13 when applying the weight for special needs students [i.e., (1.2 + (intensive student count * 13)].
Study of Pupil Weights in Vermont’s Education Funding Formula
17
state’s Excess Cost grant program, which reimburses districts for cost of educating specific students that exceed 4.5 times the average per pupil educational costs in a school district. Expenditures for gifted and talented students are included in the state’s reimbursement program for high-cost students (Connecticut General Statutes, Title 10, Chapter 164, Section 10-76f).
Connecticut school districts receive an additional 30% of the ECS base funding amount for each student who is eligible for free- or reduced-price meals. The formula also includes a concentrated poverty weight, which applies to a district with 75 percent or more of their students identified as FRPL-eligible. The concentration weight increases the poverty weight by 5% (i.e., 1.35) for the count of students above the 75% level (Augenblick, Palaich, & Associates, 2018). The state, however, provides supplemental funding for the additional cost of approved programs for English-language learners through a separate categorical grant program. Districts operating an approved program may apply to the State Board of Education (annually) to receive (within available appropriations) a grant equal to the product obtained by multiplying $1,916,130 (the stipulated appropriation amount) by the district’s share (percentage) of the statewide population of English-language learners (Connecticut General Statutes, Title 10, Chapter 164, Section 10-17g).
Connecticut’s Education Cost Sharing grant does not include adjustments for differences in costs attributable to student grade level, district or school size, or resource prices.
Delaware
Delaware operates a resource-based funding formula that is based on the cost of delivering education in a district and school, especially personnel costs (Augenblick, Palaich, & Associates, 2018). The formula takes into account differences in resources across grade levels using student-to-funding unit ratios for grades K-3 (16.2:1) and grades 4-12 (20:1). The formula also assumes additional staff to provide special education and related services for SWD.13 However, the formula does not provide supplemental funding for the additional costs of educating students with diverse learning needs (e.g., economically-disadvantaged, ELL). Instead, Delaware operates separate competitive grant programs to which districts can apply for additional funding to operate specific programs. Delaware also does not provide supplemental funding for gifted and talented students or programs, nor does it adjust state aid for differences in district or school size or resource prices across districts.
Maine
Maine operates a hybrid funding formula that first determines the cost of education in a school district using the value of a stipulated package of resources (e.g., teachers, administrative personnel, classroom materials), and then dividing this total cost by a district’s enrollment. This base amount is further adjusted for regional differences in resource prices, resulting in a district-specific per student adjusted base cost amount. For FY 2018, the base funding amount for a student ranged from $5,134 to $7,353, depending on the district (Maine Department of Education, 2017).
Pupil weights are applied to districts’ adjusted base funding amounts to account for differences in student needs. Multiple weights are used to adjust for differences in the share of SWD in a school
13 For FY17, the formula assumed increased teacher-student staff ratios for basic special education in grades 4-12 (8.4:1), PK-12 intensive special education (6:1), and PK12 complex special education (2.6:1) (Education Commission for the States, 2019).
Study of Pupil Weights in Vermont’s Education Funding Formula
18
district (Education Commission for the States, 2019),14 and a single weight (1.15) is used to inflate the base funding amount for each student in a school district that is eligible for free- or reduced-price meals.
Maine’s formula includes multiple weights to adjust for the cost of educating English-language learners. The multiplier depends on the number of students in a district that are limited-English proficient – i.e., for school districts with fewer than 15 ELL students the multiplier is 1.7; for districts with between 16 and 250 ELL students the multiplier is 1.50; and for districts where there is more than 250 ELL students the multiplier is 1.525 (Maine Department of Education, 2016).
Maine provides a higher level of funding for students in grades K-2, by applying a multiplier of 1.1 to a district’s adjusted base funding amount for students enrolled in these grades (Maine Department of Education, 2016).
The formula uses multiple weights to adjust for differences in educational costs in remote, small schools. A school is eligible for additional funding when it meets specific size and distance criteria – e.g., PK-8 schools with less than 15 students per grade and more than 8 miles from the nearest other PK-8 school; secondary schools with less than 29 students per grade, fewer than 200 students, and more than 10 miles from the nearest high school (Maine Department of Education, 2016).
School districts are eligible to receive additional funding for state-approved gifted and talented programs from a separate categorical funding program. The amount districts receive is based on prior year spending for an approved program or an approved budget amount (whichever is less).
Massachusetts
Massachusetts also operates a hybrid funding system that incorporates both resource- and student-based elements. A “foundation budget” amount is calculated for each school district. This amount is derived by multiplying the number of pupils in enrollment categories by a set “cost rate”. Specifically, each pupil enrolled in a district is initially assigned to one of 10 discrete categories: (1) PK (regular and special education); (2) half-day kindergarten (regular and special education); (3) full-day kindergarten; 4) grades 1-5; (5) grades 6-8; 6) grades 9-13; (7) limited-English proficient (LEP) PK; 8) LEP half-day kindergarten; 9) LEP grades 1-12; and 10) vocational education (grades 9-12). The state applies a resource-based cost rate to a district’s count of students in each category.15
Special education and low-income students are treated as “above the base” – and receive additional weight in the calculation. The formula assumes that special education students comprise 3.75% of the foundation enrollment, and that an additional 1% of district enrollment will require out-of-district placement to receive special education and related services appropriate to a student’s needs (Massachusetts Department of Education, 2017). For FY2018, the state provided districts with $25,632 for each assumed, in-district student with disabilities, and $26,696 for each assumed out-of-district special education placement.
Massachusetts’ formula also provides additional funding a school district based on the concentration of economically-disadvantaged students. Specifically, each district is assigned to a decile according to the share of students participating in one or more state-administered programs, including: SNAP,
14 The state weights students with disabilities at 2.277, up to 15% of a school district’s enrollment. Over 15% of students are weighted at 1.38. The state also provides additional funding for high-cost students with disabilities (Education Commission for the States, 2019). 15 A wage adjustment is used to calculate district-specific cost rates that reflect differences in labor costs across school districts.

Study of Pupil Weights in Vermont’s Education Funding Formula
19
Transitional Assistance for Families with Dependent Children (TAFDC), foster care, and MassHealth (Medicaid; up to 133% of federal poverty level) (Massachusetts Department of Education, 2017). The dollar amount depends on the decile to which a district is assigned. For FY2018, school districts with the smallest share of economically-disadvantaged students received $3,817 per student, while those with the largest shares received $4,181 (Massachusetts Department of Education, 2017). Massachusetts does not provide additional funding for gifted and talented students, nor for small districts or schools.
New Hampshire
New Hampshire operates a foundation funding program that specifies a base amount corresponding to the cost of educating students with no additional needs, regardless of the grade in which a student is enrolled. For FY18, the base amount was $3,636.06 per student.
Districts receive supplemental funding for high-need students in the form of additional flat dollar allocations that are applied to the base foundation amount. For instance, for FY2018, districts received an additional $1,818.02 for each low-income student,16 and $711.40 for each student identified as an English-language learner. New Hampshire districts also received an additional flat dollar allocation of $1,956.09 for each student with a disability, regardless of the severity in disability or extent of need.
New Hampshire’s funding formula does not provide districts with supplemental funding for gifted and talented education, nor does it adjust state funding for differences in school size or geographic location.
New Jersey
New Jersey operates a foundation formula for allocating state aid to school districts, with a base per pupil funding amount of $11,007 (FY2017; New Jersey Department of Education, 2017). A geographic cost adjustment is applied to the base funding amount to reflect differences in resource prices across school districts.
New Jersey’s funding formula accounts for the additional cost of educating students with diverse learning needs by applying multipliers to the base amount. Initially, the base funding amount is adjusted using grade level weights: 1.04 for students in grades 6-8, and 1.16 for students in grades 9-12. Subsequently, the formula inflates the grade-adjusted base amount for the number of economically-disadvantaged and ELL students. The student poverty weight depends on the concentration of low-income students in a school district, and for FY17 fell between 1.41 (for districts with <20% of FRPL-eligible students) and 1.46 (for districts with >40% of FRPL-eligible students) (Augenblick, Palaich, & Associates, 2018). The formula uses a single weight (0.47) is used to inflate the grade-level adjusted base funding amount for ELL students. The formula does not provide supplemental aid for gifted and talented students, and does not adjust for differences in economies in scale across districts or schools.
New Jersey provides districts with supplemental aid for special education programs through a census-based funding system. For FY17, the state assumed that 14.92% of students in each school district will require special education services, and 1.63% will require speech and language services. The state provided a supplemental flat grant of $17,034 and $1,159 (respectively) for the assumed
16 Low-income students are defined as those who qualify for FRPL under the National School Lunch Program, or from households receiving Temporary Assistance for Needy Families (TANF) or SNAP benefits.
Study of Pupil Weights in Vermont’s Education Funding Formula
20
number of SWD and those requiring speech and language services. The flat grant amount is adjusted for geographic differences in costs according to the county in which a school district is located.
Rhode Island
Rhode Island uses a foundation funding formula to allocate state aid to districts. Like other states that use a foundation formula, the state assigns a base amount to the typical student that has no special needs nor requires additional educational services. For FY17, the base amount was $9,163.
The formula then accounts for differences in the cost educating students across school districts by applying a weight to the base amount for low-income students (1.40) and English-language learners (1.1). The state’s formula does not adjust for differences in educational costs across grade levels, nor does it provide supplemental funding for gifted and talented students or small districts or schools.
The foundation base amount is intended to cover a portion of special education costs, as a result the existing formula does not include additional adjustments for the share of SWD in a school district. Apart from the funding formula, the state operates a separate categorical grant program for high-cost special education students (i.e., those whose costs exceed five times a school district’s combined per pupil core instruction amount). Districts may apply to the state for this additional funding from this program; however, the available funding typically falls short of need. For FY19, the state appropriation was $4.5 million, while the estimated cost to fully fund the program was $12.5 million (Rhode Island House Fiscal Advisory Staff, 2017).
Wyoming
Wyoming operates a resource-based funding formula that bases state aid on the cost of the resources required for school districts to provide comparable educational opportunities to all students. Resource costs are adjusted for regional differences in input prices (Taylor, 2015). The level of funding varies across grade levels, by specifying class sizes for students in grades K-5 (16:1) and grades 6-12 (21:1). Class size determines the resource units to which a school district is entitled.
The state operates a block grant program for at-risk students, including those who are FRPL-eligible, have limited English proficiency, or are mobile secondary students (a student is only counted once for the purposes of calculating a district’s block grant). For FY18, the block grant amount was set at $500 per pupil. Wyoming also provides school districts with a per capita grant of $40.29 to support programs for gifted and talented students.
Wyoming provides additional funding for districts and schools with low enrollment by guaranteeing a minimum number of staff positions in locations. For FY17, the state provided funding for a minimum number of teachers in schools with less than 49 students in any grade band (elementary, middle, or secondary). Eligible schools were guaranteed funding for at least 1 teacher for 7 students, and school districts with less than 244 students received funding for at least one teacher per grade level in each school.
The state reimburses school districts for 100% of their special education costs (for the prior year). The reimbursement covers the direct costs of special education and related services for SWD.

Study of Pupil Weights in Vermont’s Education Funding Formula
21
Figure 2.3. Overview of Ten States’ Education Funding Policies
AK CT DE ME MA NH NJ RI WY
Funding Model
Foundation
Foundation
Position Allocation
System
Hybrid System
Input-based
Foundation
Foundation
Foundation
Input-based
Cost Adjustments
Students with Disabilities/a
Single student weight (1.2)
State funding for high-cost students
Resource-based allocation
Multiple student weights
Census-based allocation
Single student weight
Census-based allocation
Cost reimbursement
Cost reimbursement
Economic Disadvantage/ At-risk Students/b
None Single weight (1.30) &
additional weight for districts with
concentrated poverty (1.05)
Competitive grant program
Single weight (1.15)
Single dollar amount (FY16:
$2,809)
Single dollar amount (FY18:
$1,780.63)
Multiple weights (FY2017: <20% FRPL-eligible,
1.41; >40% FRPL-eligible, 1.46; sliding
scale in between)
Single weight (1.4)
Flat grant amount ($500)
English-language Learners/c
Single student weight (1.2)
Categorical grant Competitive grant program
Multiple student weights
(Weight depends on ELL density)
Multiple student weights
(Weight depends on ELL grade
level)
Single dollar amount
(FY18/19: $711.40)
Single weight (0.47)
Single weight (1.1)
Flat grant amount ($500)
Gifted & Talented/d
Single weight (1.2)
Included in the state’s special
education funding program
None Categorical grant None None None None Census grant ($40.29/ADM)
Grade Level/e None None Resource-based
formula that uses different student-to-
funding unit ratios for K-3) &
grades 4-12
Single weight (Students in
grades K-2, 1.1)
Different base funding amounts for students in: K, elementary, junior middle grades, & high
school
None Multiple weights (Grades 6-8
(1.04); & grades 9-12 (1.16))
None Resource-based (Class sizes for:
K-5, 16 students; grades 6-12, 21
students)
Size & Geography/g
Multiple weights (School size
<750 students)
None None Multiple weights
None None None None Resource-based
Resource Prices/h
District Cost Factor
None None Regional Labor Market
Adjustment
Wage Adjustment
Factor
None Geographic Cost Adjustment
None Regional Cost Adjustment
/a Source: Education Commission of the States. (March 2019). 50-State Comparison: K12 Special Education Funding. Retrieved from: https://www.ecs.org/50-state-comparison-k-12-special-education-funding/
Study of Pupil Weights in Vermont’s Education Funding Formula
22
/b Source: Augenblick, Palaich & Associates, (October, 2018). Nevada School Finance Study. Retrieved from:
http://www.doe.nv.gov/uploadedFiles/ndedoenvgov/content/Boards_Commissions_Councils/State_Board_of_Education/2018/November/APASchoolFinanceStudyFinalReport.pdf /c Source: Ibid /d Source: Ibid /e Source: EdBuild. (n.d.) FundEd: Grade Level Funding, Policies in Each State. Retrieved from http://funded.edbuild.org/reports/issue/grade /f For the 2018-19 academic year, five states (CA, AR, MA, MT, & SC) established a different base per pupil funding amount for specific grade ranges (e.g., K-3), rather than apply some adjustment (e.g., weight) to a base funding amount. /g Source: Independent data collection by University of Vermont study team. /h Source: Taylor, L., (2015). Options for Updating Wyoming’s Regional Cost Adjustment. Retrieved from: https://www.wyoleg.gov/InterimCommittee/2015/SSRRpt1001AppendixC-1.pdf
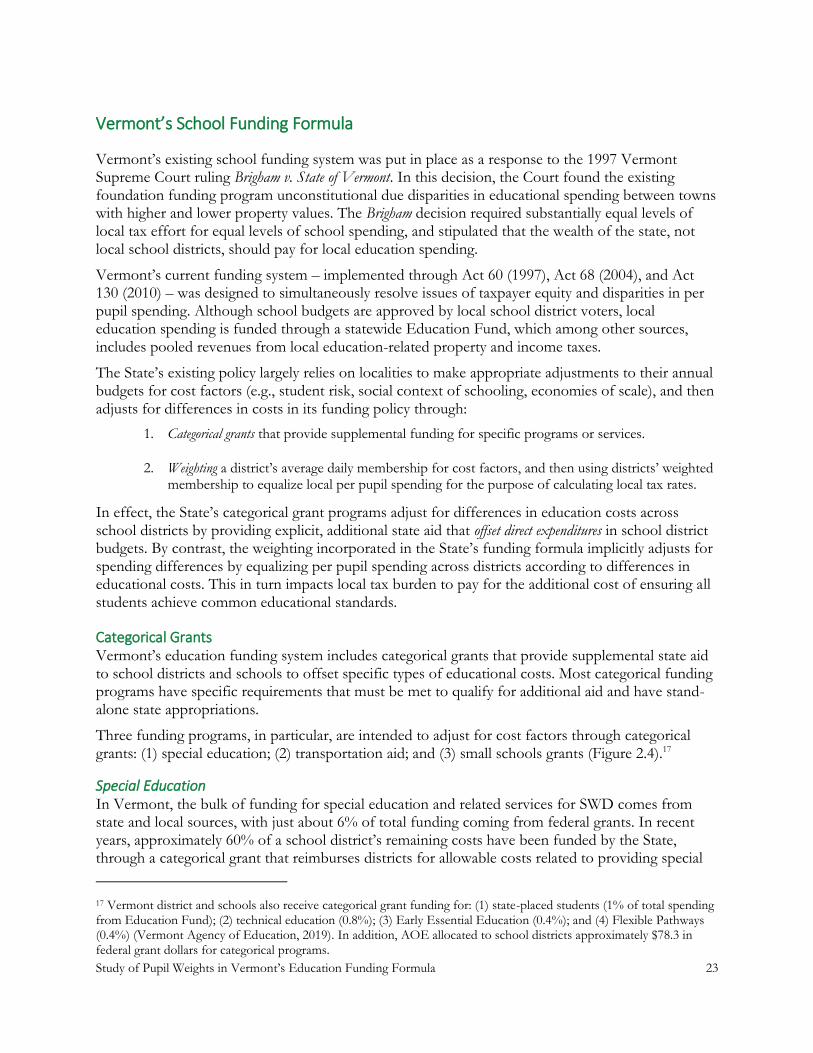
Study of Pupil Weights in Vermont’s Education Funding Formula
23
Vermont’s School Funding Formula
Vermont’s existing school funding system was put in place as a response to the 1997 Vermont Supreme Court ruling Brigham v. State of Vermont. In this decision, the Court found the existing foundation funding program unconstitutional due disparities in educational spending between towns with higher and lower property values. The Brigham decision required substantially equal levels of local tax effort for equal levels of school spending, and stipulated that the wealth of the state, not local school districts, should pay for local education spending.
Vermont’s current funding system – implemented through Act 60 (1997), Act 68 (2004), and Act 130 (2010) – was designed to simultaneously resolve issues of taxpayer equity and disparities in per pupil spending. Although school budgets are approved by local school district voters, local education spending is funded through a statewide Education Fund, which among other sources, includes pooled revenues from local education-related property and income taxes.
The State’s existing policy largely relies on localities to make appropriate adjustments to their annual budgets for cost factors (e.g., student risk, social context of schooling, economies of scale), and then adjusts for differences in costs in its funding policy through:
1. Categorical grants that provide supplemental funding for specific programs or services.
2. Weighting a district’s average daily membership for cost factors, and then using districts’ weighted membership to equalize local per pupil spending for the purpose of calculating local tax rates.
In effect, the State’s categorical grant programs adjust for differences in education costs across school districts by providing explicit, additional state aid that offset direct expenditures in school district budgets. By contrast, the weighting incorporated in the State’s funding formula implicitly adjusts for spending differences by equalizing per pupil spending across districts according to differences in educational costs. This in turn impacts local tax burden to pay for the additional cost of ensuring all students achieve common educational standards.
Categorical Grants Vermont’s education funding system includes categorical grants that provide supplemental state aid to school districts and schools to offset specific types of educational costs. Most categorical funding programs have specific requirements that must be met to qualify for additional aid and have stand-alone state appropriations.
Three funding programs, in particular, are intended to adjust for cost factors through categorical grants: (1) special education; (2) transportation aid; and (3) small schools grants (Figure 2.4).17
Special Education In Vermont, the bulk of funding for special education and related services for SWD comes from state and local sources, with just about 6% of total funding coming from federal grants. In recent years, approximately 60% of a school district’s remaining costs have been funded by the State, through a categorical grant that reimburses districts for allowable costs related to providing special
17 Vermont district and schools also receive categorical grant funding for: (1) state-placed students (1% of total spending from Education Fund); (2) technical education (0.8%); (3) Early Essential Education (0.4%); and (4) Flexible Pathways (0.4%) (Vermont Agency of Education, 2019). In addition, AOE allocated to school districts approximately $78.3 in federal grant dollars for categorical programs.

Study of Pupil Weights in Vermont’s Education Funding Formula
24
education and related services as specified on a student’s IEP. For FY2019, the total state appropriation was $189,382,665.
Starting in FY2021, Vermont will migrate to a census-based funding model, where state aid will be allocated to school districts on a per capita basis. This change was intended to break the link between student identification, service delivery, and state aid, and provide districts with new flexibility in how they develop systems of support for struggling students.
Transportation aid The State also operates a transportation grant program, designed to offset spending by supervisory unions and school districts for the cost of transporting students to and from school for regular classroom services. Grantees are eligible to have up to 50% of their allowable expenditures reimbursed by the State.18 For FY2019, total state aid was $9,551,507, equivalent to about 45% of allowable transportation expenditure statewide.
Small Schools Grant Historically, Vermont has operated a grant program that provides supplemental funding to “small” districts and schools. This program is intended to offset the higher costs of operation due to limited economies of scale in small districts and schools. Specifically, the State provides formula grants to school districts operating schools with a two-year average combined enrollment of less than 100 students, or in instances where the average grade size is 20 or fewer students. Districts that receive a support grant are also been eligible for a supplemental stability grant in instances where there is at least a 10% decrease in its two-year average enrollment in any one year.
In 2015, as part of the State’s larger effort to encourage consolidation among Vermont’s small districts and schools, Vermont’s General Assembly put in place two additional criteria schools must meet to qualify for a Small Schools Grant (Act 26, Section 21) – specifically:
1) geographic-isolation; or
2) demonstrated academic excellence and operational efficiency.
The law defined geographic isolation in terms transportation routes – i.e., “lengthy driving times or inhospitable travel routes between the school and the nearest school in which there is capacity” (16 VSA §4015(B)(i)). A school’s performance and efficiency were defined broadly as “measurable success in providing a variety of high-quality educational opportunities that meet or exceed” the State’s Educational Quality Standards; the outcomes for students from economically-disadvantaged backgrounds; student-to-staff ratios; and participation in a merger study (16 VSA §4015(B)(I-IV).
The State Board of Education was charged with the task of adopting the metrics used to determine eligibility. In its efforts to do so, the Board noted that developing metrics that are “objective, comparable, and measurable” was a challenging task, especially measuring geographic isolation and the excess capacity of neighboring schools (Huling, 2018). As an interim measure, the Board defined the metric for geographic isolation as a “school more than 15 miles from the nearest school in which there is capacity, or more than the 5% of the applicant school’s students reside more than 15 miles from the nearest school in which there is capacity” (Huling, 2018). The Board also recommended a
18 It is important to note that not all Vermont school districts provide transportation, and some do so for only certain grade levels (e.g., students in the elementary grades).
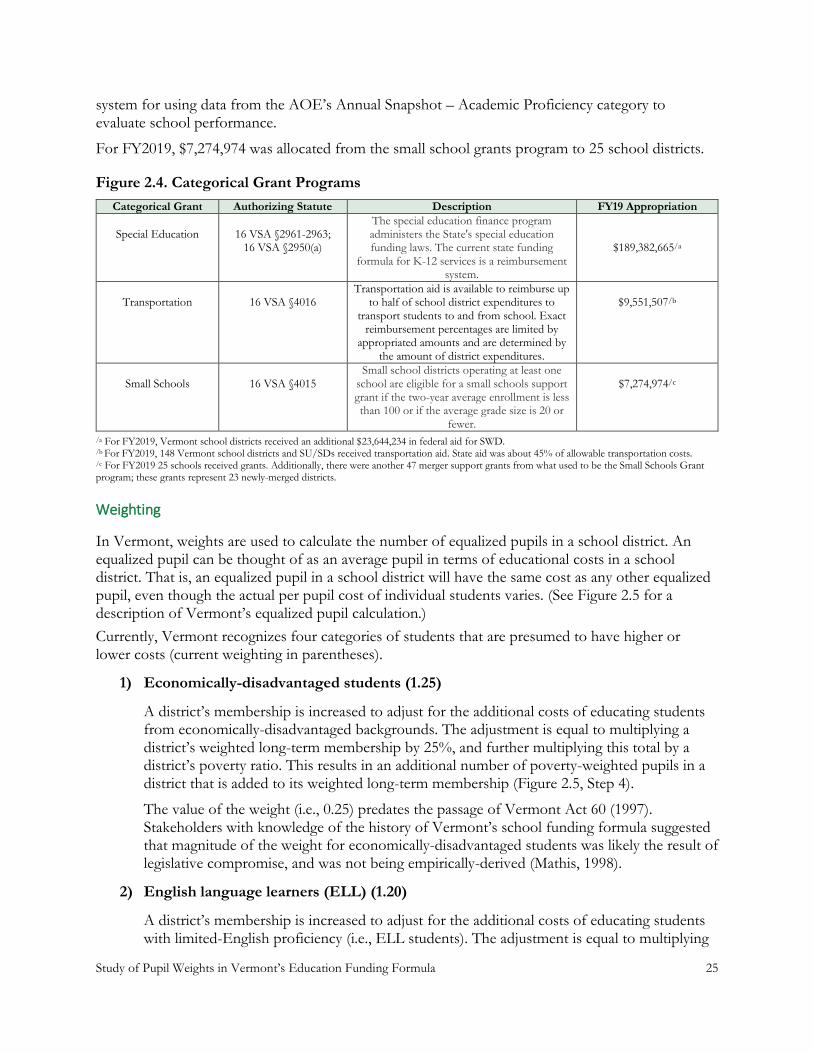
Study of Pupil Weights in Vermont’s Education Funding Formula
25
system for using data from the AOE’s Annual Snapshot – Academic Proficiency category to evaluate school performance.
For FY2019, $7,274,974 was allocated from the small school grants program to 25 school districts.
Figure 2.4. Categorical Grant Programs
Categorical Grant Authorizing Statute Description FY19 Appropriation
Special Education
16 VSA §2961-2963;
16 VSA §2950(a)
The special education finance program administers the State's special education funding laws. The current state funding
formula for K-12 services is a reimbursement system.
$189,382,665/a
Transportation
16 VSA §4016
Transportation aid is available to reimburse up to half of school district expenditures to
transport students to and from school. Exact reimbursement percentages are limited by
appropriated amounts and are determined by the amount of district expenditures.
$9,551,507/b
Small Schools
16 VSA §4015
Small school districts operating at least one school are eligible for a small schools support grant if the two-year average enrollment is less than 100 or if the average grade size is 20 or
fewer.
$7,274,974/c
/a For FY2019, Vermont school districts received an additional $23,644,234 in federal aid for SWD. /b For FY2019, 148 Vermont school districts and SU/SDs received transportation aid. State aid was about 45% of allowable transportation costs. /c For FY2019 25 schools received grants. Additionally, there were another 47 merger support grants from what used to be the Small Schools Grant program; these grants represent 23 newly-merged districts.
Weighting
In Vermont, weights are used to calculate the number of equalized pupils in a school district. An equalized pupil can be thought of as an average pupil in terms of educational costs in a school district. That is, an equalized pupil in a school district will have the same cost as any other equalized pupil, even though the actual per pupil cost of individual students varies. (See Figure 2.5 for a description of Vermont’s equalized pupil calculation.)
Currently, Vermont recognizes four categories of students that are presumed to have higher or lower costs (current weighting in parentheses).
1) Economically-disadvantaged students (1.25)
A district’s membership is increased to adjust for the additional costs of educating students from economically-disadvantaged backgrounds. The adjustment is equal to multiplying a district’s weighted long-term membership by 25%, and further multiplying this total by a district’s poverty ratio. This results in an additional number of poverty-weighted pupils in a district that is added to its weighted long-term membership (Figure 2.5, Step 4).
The value of the weight (i.e., 0.25) predates the passage of Vermont Act 60 (1997). Stakeholders with knowledge of the history of Vermont’s school funding formula suggested that magnitude of the weight for economically-disadvantaged students was likely the result of legislative compromise, and was not being empirically-derived (Mathis, 1998).
2) English language learners (ELL) (1.20)
A district’s membership is increased to adjust for the additional costs of educating students with limited-English proficiency (i.e., ELL students). The adjustment is equal to multiplying
Study of Pupil Weights in Vermont’s Education Funding Formula
26
.20 by the count of resident students in a district for whom English is not the primary language. This results in an additional number of ELL-weighted pupils in a district that is added to its weighted long-term membership. As was the case for the weight for economically-disadvantage, the value for the ELL weight predates Act 60 and we could find no evidence that the weight was empirically derived.
3) Secondary students (1.13)
The weight for secondary students is used to adjust a district’s long-term membership for the number of students enrolled in grades 7-12.19 The current weight for secondary students is 1.13, based on the assumption that the cost to educate secondary students is 13 percent higher than an elementary school student.
Prior to FY2009, the secondary student weight was 1.25. A study of budget data (FY2007), however, suggested that secondary costs were approximately 13% higher, and the weight was changed by the Vermont General Assembly in 2007 (2007, No. 82, §7). In 2017, AOE evaluated the accuracy of the secondary weight by comparing secondary spending per equalized pupil statewide to elementary spending per equalized pupil statewide. It concluded that a secondary weight of 1.18 (the average of the ratio of FY2016 and FY2017 secondary spending per pupil to elementary spending) was about 1.00 (Holcombe, 2017).
4) Pre-kindergarten students (0.46)
The existing formula deflates pre-kindergarten students by applying a weight of 0.46 when calculating a district’s long-term membership.
The weights are used to calculate a district’s long-term weighted PK12 average daily membership (PK12ADM). Statewide, the long-term weighted PK12ADM exceeds the number of actual pupils in the state. An “equalization ratio” is calculated, which proportionately deflates the long-term weighted PK12ADM back to the actual number of students in the state. This deflator is then applied to each school district’s long-term weighted PK12ADM to generate an “equalized pupil count” for each Vermont school district (Figure 2.5, Steps 7 & 8).
The number of equalized pupils in a district is used to create an equalized per pupil spending amount for each district. Equalized per pupil spending is a key input when calculating local education tax rates (homestead and income).
To do so, AOE calculates education spending in each district. Spending is equivalent to a district’s approved budget, less other revenues from federal and state categorical grants, deficit carryover spending from prior year, and tuition a district receives, for a given fiscal year.20 Specifically:
Education Spendingdistrict = Approved School District Budget – Other Revenues
19 The secondary student weight is applied to the actual average number of resident secondary students (grades 7-12) during the two most recent school years. 20 As a result, tax rates that are calculated using on total statewide education spending do not reflect the total level of spending across districts (i.e., the full budgeted amount). Rather, what is included is: general payroll and operating costs that do not have specific funding sources; special education not covered by federal aid or state categorical grants; transportation costs not covered by state categorical aid; tuition owed by a district; and federal funding through its consolidated grant program.

Study of Pupil Weights in Vermont’s Education Funding Formula
27
Education spending is then adjusted for the number of equalized pupils in a school district.
Education Spending Per Equalized Pupildistrict = Education Spendingdistrict
Equalized Pupil Countdistrict
Education spending per equalized pupil is the key input in calculating a town’s education tax rates (homestead and income-based). Generally speaking, a town’s homestead tax rate is calculated as:21
Homestead Tax Ratetown = (Equalized PP Spending/Property Yield) * Statewide Homestead Rate
In this way, a district’s equalized pupil count can serve to inflate or deflate a district’s education spending per pupil, for the purposes of calculating local tax burden. For example, assuming no change in education spending per pupil, increasing the number of equalized pupils in a school district effectively lowers a district’s per pupil education spending for the purposes of calculating a locality’s property tax rate. Conversely, a decrease in the number of equalized pupils effectively raises a district’s per pupil education spending for the purposes of this calculation. Put another way, the weighting used to calculate a school district’s equalized pupil count affects local tax capacity to raise revenues to pay for education spending.
21 For FY2020, the yield was $10,648 and 1.00, respectively.

Study of Pupil Weights in Vermont’s Education Funding Formula
28
Figure 2.5. Calculating a School District’s Equalized Pupil Count
Description Calculation
Step 1
Calculate
Long-term Membership
(16 VSA § 4010(a) & (b))
Long-term membership is the actual average daily
membership (PK12ADM) in a school district, excluding State-placed students, over two consecutive years, the latter of which is the current school year, plus full-time equivalent enrollment of State-placed students for the most recent of
the two years
Long-term Membership =
((PK12ADM2017+PK12ADM2018)/2) +
Number State-placed students2017
Step 2
Calculate
Weighted Long-term Membership
(16 VSA § 4010(c))
Weighted Long-term Membership adjusts a district’s Long-
term Membership for grade-level weighting factors. Specifically: a) pre-kindergarten students are deflated using a weight of .46; and b) secondary students are weighted using
a factor of 1.13.
The PK weight is applied to actual average number of resident pre-kindergarten students in a district (as defined by
16 VSA §4001 (1)(B) during the two most recent school years.
The secondary student weight is applied to the actual
average number of resident secondary students (grades 7-12) during the two most recent school years.
Weighted Long-term Membership =
(District Long-term Membership) +
((PK Students2017+PK Students2018)/2) * .46) + ((SEC Students2017+SEC Students2018)/2) * 1.13)
Step 3
Calculate the Poverty Ratio
(16 VSA §4001(8))
The actual average number of persons in a school district aged 6-17, for the two prior school years, who are from economically-disadvantaged backgrounds divided by a district’s long-term membership to establish a district’s
poverty ratio.
The number of economically-deprived persons is defined as a person who resides with a family unit receiving nutrition benefits, and any other persons who do not reside with a
family unit receiving nutrition benefits for whom English is not the primary language.
Poverty Ratio =
((ED2017+ED2018)/2) +(ELL2017+ELL2018)/2)) /
Long-term Average Daily Membership

Study of Pupil Weights in Vermont’s Education Funding Formula
29
Description Calculation
Step 4
Calculate Poverty-weighted Student
Count (16 VSA § 4010(d))
The Weighted Long-term Membership is increased for each
school district to compensate for the additional costs imposed by students from economically-deprived
backgrounds.
The adjustment is equal to a district’s Weighted Long-term Membership, multiplied by 25%, and further multiplied by a district’s poverty ratio. This results in an additional number
of “poverty-weighted” pupils, that will be added to a district’s Weighted Long-term Membership.
Poverty-weighted Student Count =
(Weighted Long-term Membership) * (Poverty Ratio) * 0.25
Step 5
Calculate
ELL-weighted Student Count
(16 VSA § 4010(e))
The Weighted Long-term Membership is increased for each
school district is increased by .2 for each resident student (included in PK12 ADM) for whom English is not the
primary language.
The number of resident students for whom English is not the primary language is provided by districts to AOE as a
part of their annual reporting.
ELL-weighted Student Count =
(Weighted Long-term Membership) * 0.20
Step 6
Calculate Long-term Weighted PK12 ADM
A district’s long-term weighted PK12
ADM is the total of its: 1) Weighted long-term membership; 2) Poverty-weighted student count; and 3) ELL-weighted
student count
Long-term Weighted PK12 ADM =
(Weighted long-term membership) + (Poverty-weighted student count) +
(ELL-weighted student count)
Step 7
Calculate
Equalization Ratio (16 VSA §4001(3))
The equalization ratio is the ratio of long-term PK12ADM
and long-term weighted PK12ADM. It is used as a proportional deflator when calculating the number of
equalized pupils in a school district.
For the purposes of a district’s equalized pupil calculation, a district’s equalized pupil count will not be less than 96.5% than a district’s actual number of equalized pupils for the
prior year (16 VSA § 4010(f))
Equalization ratiostate =
Long-term PK12ADMstate
Long-term Weighted PK12ADMstate
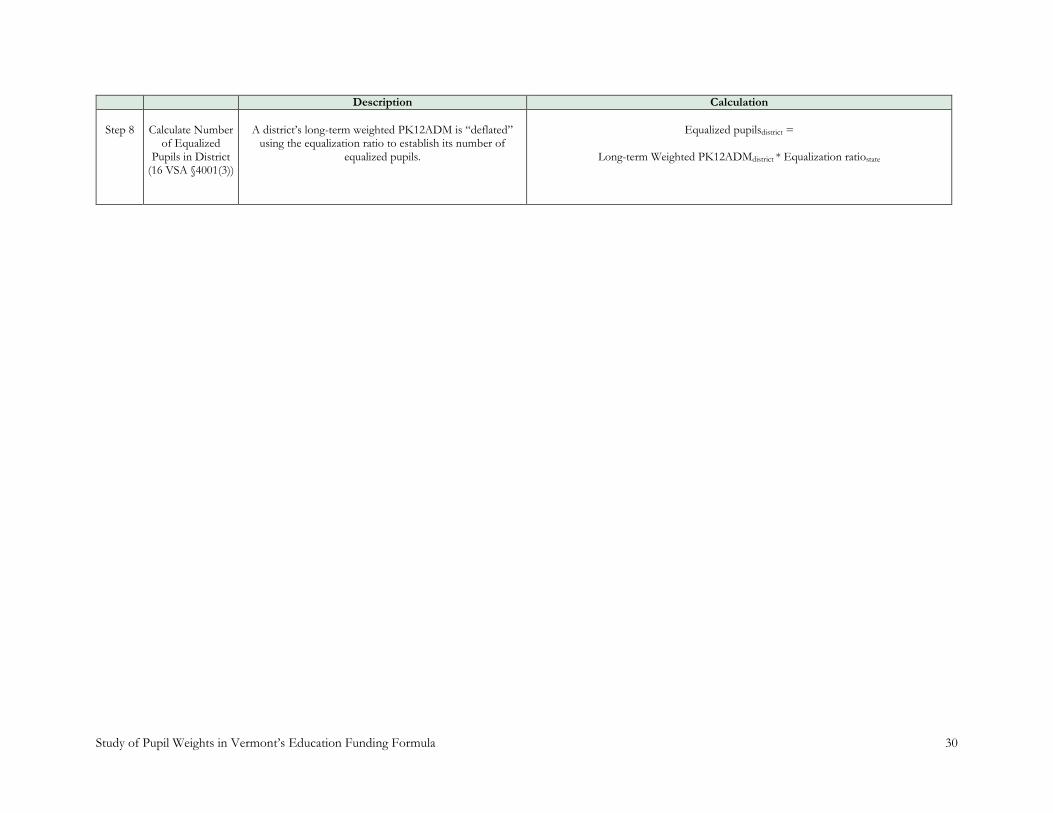
Study of Pupil Weights in Vermont’s Education Funding Formula
30
Description Calculation
Step 8
Calculate Number
of Equalized Pupils in District
(16 VSA §4001(3))
A district’s long-term weighted PK12ADM is “deflated”
using the equalization ratio to establish its number of equalized pupils.
Equalized pupilsdistrict =
Long-term Weighted PK12ADMdistrict * Equalization ratiostate
Study of Pupil Weights in Vermont’s Education Funding Formula 31
Summary
Students come to school with dissimilar learning needs and socioeconomic backgrounds that may require different types and levels of educational supports for them to achieve common standards or outcomes. Similarly, schools in different contexts may also require different levels of resources due to scale of operations or the price they must pay for key resources.
Dissimilar resource requirements translate to differences in the cost of education among school districts. Without additional funding from states, some communities may be either unable or unwilling to pay for the additional resources necessary to ensure an adequate education for its students.
All states operate school funding formula and supplemental grants-in-aid programs that attempt to address differences in educational costs across school districts, while simultaneously account differences in the ability of local communities to pay for these costs. However, there is considerable variation across states in the policies and level of funding available.
Cost factors that are commonly-recognized in state funding formula include adjustments for: student needs, including economically-disadvantaged and at-risk students; ELL; SWD; and gifted and talented; economies of scale and geographic necessity, including district and school size and population density; grade range; and resource prices.
State funding formula use different mechanisms to adjust for cost differences including: weights, resource-based allocations, cost reimbursement, and categorical funding.
Vermont’s existing school funding formula accounts for differences in educational costs across school districts by recognizing three cost factors – student poverty, limited English proficiency, and secondary-level education – and assigning weights to these factors it its equalized pupil calculations. In addition, the State operates categorical funding programs for special education, small schools, and transportation.

Study of Pupil Weights in Vermont’s Education Funding Formula 32
III. Perspectives on Cost Factors & Weights Incorporated in Existing Funding System
We interviewed stakeholders statewide with the goal of better understanding the field’s experiences with the Vermont’s funding policies. Findings provide important context for evaluating the existing weights and the impact other categorical funding policies have on adjusting for differences in educational costs across Vermont school districts.
Below, we describe our data collection approach. This is followed by an overview of key findings from our stakeholder interviews. Findings are organized thematically – starting with reflections on the existing cost factors and weights included in the equalized pupil calculation and the State’s other categorical grant programs, followed by other design considerations for reform.
Data Collection Approach
Our interviews explored stakeholder perspectives on how Vermont’s existing school funding policy functions, with particular attention to: (1) the cost factors and weights used in calculating the number of equalized pupils in a school district; and (2) the State’s special education, Small Schools, and transportation grant programs. On average, interviews lasted 60 minutes. When possible, interviews were conducted face-to-face, with some completed by phone when an in-person interview was not practicable. Altogether, we interviewed 35 individuals, including:
1) educational leaders in Vermont school districts and supervisory unions;
2) members of the Vermont General Assembly;
3) representatives from Vermont-based education organizations; and
4) organizational leadership and fiscal staff at the AOE.
Figure 3.1 lists the organizations represented in our interviews.
In the case of school districts and supervisory unions, we selected districts located in different areas of the state (e.g., rural, urban areas) and those with higher and lower levels of student need. Additionally, we targeted districts in sparsely populated areas of the state with small schools. The goal was to ensure that a broad range of perspectives and experiences were represented in the data. That said, the findings generated from our interviews are not strictly representative of all stakeholders’ responses; rather, interviewee statements characterize the points of view of individuals or their organizations.
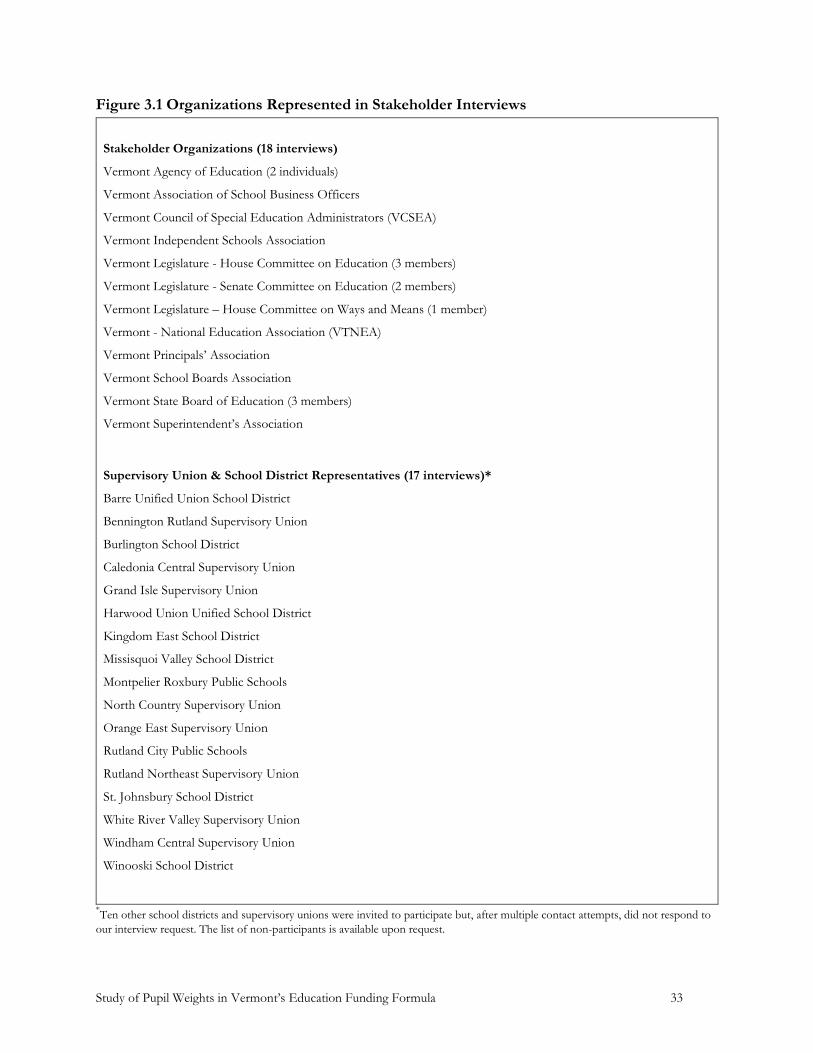
Study of Pupil Weights in Vermont’s Education Funding Formula 33
Figure 3.1 Organizations Represented in Stakeholder Interviews
Stakeholder Organizations (18 interviews)
Vermont Agency of Education (2 individuals)
Vermont Association of School Business Officers
Vermont Council of Special Education Administrators (VCSEA)
Vermont Independent Schools Association
Vermont Legislature - House Committee on Education (3 members)
Vermont Legislature - Senate Committee on Education (2 members)
Vermont Legislature – House Committee on Ways and Means (1 member)
Vermont - National Education Association (VTNEA)
Vermont Principals’ Association
Vermont School Boards Association
Vermont State Board of Education (3 members)
Vermont Superintendent’s Association
Supervisory Union & School District Representatives (17 interviews)*
Barre Unified Union School District
Bennington Rutland Supervisory Union
Burlington School District
Caledonia Central Supervisory Union
Grand Isle Supervisory Union
Harwood Union Unified School District
Kingdom East School District
Missisquoi Valley School District
Montpelier Roxbury Public Schools
North Country Supervisory Union
Orange East Supervisory Union
Rutland City Public Schools
Rutland Northeast Supervisory Union
St. Johnsbury School District
White River Valley Supervisory Union
Windham Central Supervisory Union
Winooski School District
* Ten other school districts and supervisory unions were invited to participate but, after multiple contact attempts, did not respond to
our interview request. The list of non-participants is available upon request.
Study of Pupil Weights in Vermont’s Education Funding Formula 34
Perspectives on Existing Weights & Categorical Funding Programs
Stakeholders viewed the cost factors and weights used in the State’s education funding formula as “essential” for equalizing spending differences across districts. In the words of one stakeholder, “[weights] are an acknowledgement that kids in certain categories may cost more to educate.” The weights were also viewed as impacting local decisions about the investments they make in schools. As summarized by one interview participant:
“The weights impact tax rates, which in turn has a major impact and influence on school boards’ interest in investing in new programs or eliminating programs. From a program development perspective, the weights are a central part of managing a school district to meet the needs of students.”
However, everyone agreed that the existing approach to pupil weighting was “falling short” of promoting equal educational opportunities for students across the state. Put succinctly, the “weights are not doing a good job of closing the vast chasm in resources between school districts.”
In our interviews, stakeholders cited two interrelated problems with the formula’s existing approach to weighting pupils:
1) The cost factors incorporated in the calculation do not reflect current educational circumstances. Stakeholders viewed the existing approach as “outdated.” Neither the factors considered by the formula nor the value of the weights reflect contemporary educational circumstances and costs. In the words of several interview participants:
“The weighting system is a relic of a bygone era. There hasn’t been a lookback or check in with regard to the origins, relevance, or accuracy of the weights.”
“Since the weighting formula was created, the needs of students and schools have changed, become more complicated. But the weighting system has not been updated to reflect these changes.”
“It’s time to recognize that everything is not the same and educating students with different circumstances – now – requires different resources than what we had then.”
2) The values for the existing weights have weak ties, if any, with evidence describing differences in the costs for educating students with disparate needs or operating schools in different contexts. There was considerable skepticism as to whether the existing weights are valid estimates of
the actual cost differentials for educating economically-disadvantaged, ELL, and secondary-
level students. A number of stakeholders noted that there is no evidence to support the
existing weights. As one individual put it, “no one can answer for how they did [the weights] or why
they did it that way.” Similarly, a recurring question posed by interview participants was, “Are
we weighting on the right things? How do we even know that the weights we have are right?”
Stakeholders were also critical of the State’s categorical funding programs. They were uniformly frustrated with the State’s Small Schools grant program, both in its design and operations. They also cited the need for new grant programs which would provide specific and targeted grant aid to support schools struggling to meet different and increased levels of student need due to childhood trauma and mental health concerns.
Study of Pupil Weights in Vermont’s Education Funding Formula 35
The following sections summarize stakeholder input on the factors and weights incorporated in the equalized pupil calculation and the State’s categorical grant programs.
Factors & Weights
Student Need Stakeholders unanimously agreed that the funding formula should continue to include weights for economically-disadvantaged and ELL students. In fact, if anything, there was a sense among interview participants that these weights are increasingly important in the context of present-day educational conditions. The extent of economic-disadvantage, in particular, was seen as the primary driver of differences in educational costs across schools – i.e., “it is at the heart of considering equity in school funding.” That said, everyone also agreed that the existing weights for economically-disadvantaged and ELL students are insufficient. That is,
“The additional cost of educating low-income and ELL students far exceed[s] the existing weights.”
“The fact that some of the most ‘needy’ districts are making the lowest investments, is problematic. It should be the other way around. Improving the weight for poverty will help with this.”
There were also concerns that the weights do not recognize differences across schools in the concentration of need. There was a sense among stakeholders that the per-capita cost of operating a school with a greater share of economically-disadvantaged or ELL students was higher than schools that served proportionately fewer high-need students. Schools with greater concentrations of need are, “just plain different schools,” and require school-wide programs and resources that cost more than smaller-scale interventions for struggling students. In the words of several stakeholders,
“The one-to-one proportionality doesn’t make as much sense when you have concentrated need.”
“There is a difference between scattered poverty and concentrated poverty. Schools with concentrated poverty have concentrated problems. More than supports for individual students – they have systemic issues that they need to address. This is more difficult than just the scattered student.”
When asked about how to best adjust for differences in costs associated with concentrated poverty or limited-English proficiency, stakeholders were less sure that a new or different weight in the equalized pupil calculation makes sense. Rather, several stakeholders suggested that the State might provide targeted grants to districts dealing with higher-than-average levels of need, and in doing so, provide technical assistance as to how to best redesign or structure systems of support in these schools.
Additionally, stakeholders spoke about the increasing number of students who have experienced childhood trauma and the additional costs associated with meeting their needs.22 For example:
“The amount of money we are spending on support for students in our ‘trauma’ population is a strain on our local budget…The trauma population continues to have needs that are hard to maintain. Our costs continue to go up.”
“There is something magnificently different about kids that have experienced trauma.”
22 Stakeholders speculated that the increase in students who have experienced childhood trauma is related to the effects of the opioid crisis.
Study of Pupil Weights in Vermont’s Education Funding Formula 36
However, there was general agreement that incorporating a “trauma” weight in the funding formula would be difficult, and in fact, may not be the best way to provide districts and schools with additional resources. Instead, many stakeholders suggested a new state grant program for student mental health and professional development for trauma-informed practices. In the words of several stakeholders,
“The needs are complex … and it is unclear how to weight for these kids. How would they be identified? Instead, it makes more sense for there to be special funding programs that offset the costs of mental health services for these kids. This would spur best practices, would be focused – that is, where need is, and what is needed – rather than a more generalized solution.”
“There is value in weighting to address the challenges of poverty. But, other issues – trauma related – might be better served through grants for specific programs or services.”
“The poverty weight is not enough. But, I’m not sure that a change to how the equalized pupil numbers are generated would help. This needs to be a focused effort to support schools facing these challenges.”
“I really struggle with the idea of creating more categories of kids… We have significant resource needs for mental health troubles in our schools, but I don’t want to label kids anymore.”
Economies of Scale Stakeholders recognized that small districts and schools require additional resources to provide opportunities to learn similar to those found in places with larger enrollments – i.e., “It [costs] more to create opportunity in rural schools.” Schools with small enrollments face unique challenges and may experience difficulties providing similar academic and non-academic opportunities to students. Stakeholders also shared the view that the State has a responsibility to support small districts or schools that exist by necessity, not preference. In the words of one stakeholder,
“Now that the dust has settled on Act 46, it’s time to think about how we are going to support small districts and schools that operate out of necessity. The Law has taken effect. For the most part the schools we have are now the schools we are going to have in the future. It’s time to reaffirm public obligation that small schools – by necessity – stay viable.”
Stakeholders agreed that incorporating weights for small school size into the equalized pupil calculation was preferable to the existing Small Schools grant program.23 Stakeholders felt that weights would “standardize” the way that these adjustments are made, and in doing so, would make adjustments “more predictable” for planning and budgeting. In the words of one stakeholder, “If there are needs, then why are they not guaranteed.”
A number of interview participants felt that targeting cost adjustments at the district level was a better fit with recent changes in school governance. In the words four stakeholders,
“For the most part, small schools across the state are now part of larger districts – and this is where decisions are made about spending and budgets.”
23 As discussed in further detail below, stakeholders were unanimous in their view that the existing Small Schools grant program should be discontinued, and that cost adjustments for economies of scale should be built into the approach used to calculate the number of equalized pupils in a school district. Instead, stakeholders felt that adjustments for cost differences associated with economies of scale should be built into the overall funding formula.
Study of Pupil Weights in Vermont’s Education Funding Formula 37
“It’s time to look at this at the SU level. This would make it about the system as a whole – and about thinking how to consider resources for small schools in the context of the larger system.”
“With Act 46, the economies of scale question becomes not one about small schools but economies within a district. And this needs to be reflected in the formula.”
“Weighting at the district would mitigate some concerns over Act 46 – and would place the responsibility with local school boards to make decisions about whether, and under what circumstances, to operate small schools.”
“Under Act 46, we shouldn’t have small schools that aren’t geographically necessary.”
“Adjustments for size need to be tied to sparsity – as opposed to strictly based on child count.”
That said, stakeholders were unanimous in their views that attempts to weight for small school size should be predicated on the fact that a school operates out of necessity. Adjustments based strictly on size, without taking into account population density, geographic limitations, or capacity in neighboring schools were viewed as inappropriate and inconsistent with other policy priorities. In the words of several stakeholders,
“We need a model that deemphasizes size as the sole criteria. Rather, size needs to be buffered by some weighting that looks at where schools are located.”
“Whatever we do, it shouldn’t work against Act 46. What we have now has created an unnecessary difficult dynamic.”
Population Density The population density on the community in which a district is located was generally viewed by stakeholders as impacting educational costs. 24 As put by one interviewee, “Sparsity and size are different things. Size does not take into account rural access challenges.”
Many interview participants shared the view that “it costs more” to operate rural schools than schools in suburban or urban areas. Stakeholders suggested that rural schools may have to pay more to attract and keep similarly qualified teachers and for contracted services for “mental and behavioral health services” and teacher professional development. Several interviewees also described the “rural condition” as impacting costs in an indirect way, especially as it relates to student poverty. In one person’s words: “I see the challenges … being poor and rural is sometimes more expensive than being just poor in an urban area.”
Despite agreement that educational costs vary according to where a district is located, nearly all stakeholders acknowledged that these perceptions were based on a “general sense” of conditions in the field, “rather than hard evidence.” In the worlds of one stakeholder,
“[Higher costs in rural schools] is really an open question. Does it cost more to educate a student in a rural area than in other areas of the state? Lots of debate – but no hard evidence one way or another. We hope the weighting study will answer this question for us.”
24 For some stakeholders, differences in economies of scale was equated with location – i.e., whether a district or school is located in a rural, suburban, or urban area. While these individuals contemplated a weight based on “rurality,” the broader consensus among interview participants was that whether a district or school was located in a rural area of the state was an unreliable proxy for differences in costs attributable to limitations on economies of scale.

Study of Pupil Weights in Vermont’s Education Funding Formula 38
When asked about how to best adjust for potential differences in costs between rural, suburban, and urban schools, stakeholders unanimously agreed that a new weight for the population density of the area in which a district is located should be included in the equalized pupil calculation. The value for this weight should be empirically derived
Grade Range There was less agreement about whether grade range weights, particularly the existing secondary-level weight, are appropriate. Some stakeholders felt that each grade range (elementary, middle, and secondary) has its own unique cost structure, and one grade range is no more expensive than the other. Other interview participants felt strongly that the cost of education varies across grade level.
“At the secondary level, not only are there co-curricular programs that do not exist at elementary – for example, driver’s ed, the far more sophisticated online or virtual high school that [offers] AP math courses etc. – do not exist at the elementary level. And, then there is the issue of school safety management. At the high school level this is a larger investment.”
“With proficiency-based learning, internships, we’ve had to add high school staff.”
“Middle grades! By looking at the standards – to meet standards they need additional teachers. Cannot teach to the standards with one teacher, one classroom. We have to have specialization at the middle grades, and this requires more teachers.”
“We should be dedicating more resources at early education.”
While these stakeholders shared different perspectives on which grade levels should be accounted for in the equalized pupil calculation, they all agreed that the value of the existing secondary-level grade weight is arbitrary and that there is a need for “new evidence” about how costs differ across grade levels.
Categorical Funding Programs Stakeholders were asked to share their perspectives on three state-funded categorical grant programs: (1) special education; (2) transportation aid; and (3) the Small Schools grants. Overall, stakeholders thought that the State should continue to provide supplemental aid for local special education programs and transportation as categorical grant programs. However, interview participants felt strongly that the existing Small Schools grant program should be abolished.
Additionally, the majority of stakeholders felt that there are opportunities to address differences in educational opportunities across Vermont school districts through new, targeted categorical grant programs. In some instances, new grant programs were preferable to further adjustments to the cost factors or weights used in the equalized pupil calculation.
Special Education Census Grant A key objective for our stakeholder interviews was to better understand perspectives in the field on whether changes should be made to how the forthcoming special education census grant will be calculated. Since Act 173 was enacted (May 2017), concerns have been raised about whether the approach used to calculate a supervisory union’s census grant amount should be adjusted for differences across school districts in the incidence and costs associated with educating SWD.
We asked stakeholders to share their perspectives on whether the intended methodology for calculating the special education census grant requires further consideration. Overall, we found that stakeholder perspectives were mixed – ranging from no concerns to significant worry, and still others felt that it is too soon to make a determination.
Study of Pupil Weights in Vermont’s Education Funding Formula 39
At one end of the continuum, one group of stakeholders thought the existing approach will provide adequate state aid for local special education programs and that districts should move forward with reforming their service delivery systems to improve their effectiveness and efficiency. Put succinctly by two superintendents, “We feel confident that we can handle the changes that are proposed”; and the other, “The sky is not going to fall.” A number of other stakeholders remarked that they viewed the funding formula change favorably, especially the new spending flexibility and break in the long-standing connection between local special education practices and the level of state funding.
For others, however, there were significant concerns with how the grant will be calculated. At issue, was the fact that the formula does not account for the significant variation in student need across Vermont school districts. These stakeholders shared the same perspective – i.e., that there is an underlying difference in the prevalence of disability among districts, and that the formula does not appropriately account for these differences in its calculation. As a result, without modification, some stakeholders felt that the census grant will amount to a “fiscal penalty” for localities that are already challenged to meet higher-than-average levels of student need. One superintendent explained, “When I see the modeling and we get less money but have the same general needs, I get really worried.”
When concerned stakeholders spoke of differences in the demand for special education services across districts, they framed this issue in terms of varying levels of student poverty and childhood trauma, citing these conditions as precursors and predictors of the extent of student need in a district. In the words of one stakeholder, “The correlation between poverty and disability is strong.” Another stakeholder remarked that she, “Wants the General Assembly to recognize that these differences exist; and that there is an intersection between community poverty and disability rates in a school.”
A number of interviewees also felt that changes to how the State funds special education undermines districts’ capacity to serve struggling students, generally. The existing reimbursement funding mechanism served as an “escape valve,” where districts facing higher levels of student need were “tapping into” the special education reimbursement system to access supplemental funding for struggling students. In the words of one interview participant:
“The number of districts that are true outliers with respect to [special education] incidence and need [is small] – but, this is not … the norm. Rather, the concerns are more grounded in the fact that level funding is a sea change from the existing reimbursement approach. The risk is that without this fiscal relief from the State that localities will have to pay more for struggling students, and administrators know that their local voters will not approve higher taxes to do so.”
Stakeholders who were concerned about how the census grant will be calculated also recognized that, at least in part, their apprehension was tied to concerns about challenges with the existing system for weighting pupils in the general education formula. A number of individuals remarked that if the weight for poverty was adjusted to reflect what they thought was the “true differential in costs” in educating economically-disadvantaged students and students with complex socio-emotional needs that they would be “more comfortable” with the census grant.
In the context of our discussions, we asked stakeholders about how they thought the census grant calculation should be changed to respond to their concerns. Interview participants uniformly responded that there should be some sort of “poverty adjustment” to the census grant. When asked about what such an adjustment might look like, two consistent themes emerged:
1) Apply the per capita grant amount to a weighted number of pupils, not ADM. “Done correctly,” calculating the census grant in this manner would account for differences in student
Study of Pupil Weights in Vermont’s Education Funding Formula 40
need across districts. When asked further about what weighted pupil count should be used in the calculation, stakeholders suggested using either a “poverty weighted” count or a district’s equalized pupil count.
2) Deduct 100% of special education spending – both state and local – when calculating the education spending amount used when calculating towns’ education-related tax rates (homestead and income-based). This would effectively lower tax rates in districts where there is higher spending on special education and related services.
Another group of stakeholders felt that it was “too soon” to make changes to how the census grant will be calculated. In the words of one interviewee,
“I don’t see how we can make adjustments yet. We haven’t even seen the final numbers, and schools haven’t had a chance to do the work of updating their practices. This all may be a moot point in three years.”
When considering reforms, stakeholders were unanimous in their perspective that whatever change is made the calculation should retain the simplicity, predictability, and transparency inherent in the current approach. “Complicating the education finance formula further is a non-starter,” remarked one superintendent. It was with this perspective that stakeholders felt that adjusting the uniform base amount (i.e., per capita grant amount) for a district’s poverty rate, either using a sliding scale or a threshold amount, would add unnecessary complexity and would make it more difficult for districts to predict their grant amount year-to-year.
Transportation Aid Stakeholders were unanimously in favor of the State continuing to provide localities with supplemental funding for student transportation as a separate categorical grant. Transportation aid was viewed as essential for districts, particularly those that serve large geographical areas and face higher-than-average costs in transporting students. Stakeholders also recognized that transportation needs, and as a result costs, vary considerably across districts, and attempts to standardize aid through a weight or some other per pupil adjustment that is applied equally to all districts would not work. In the words of one interviewee, “Transportation aid needs to be kept separate from weights. Not all districts need it, and the transportation needs are so varied.” Stakeholders also felt that the transportation should remain a reimbursement program so that aid is tied to districts’ actual costs.
Small Schools Grant By contrast, stakeholders were uniformly opposed to continuing the Small Schools grant program. In the words of one stakeholder, “Everyone is looking for a better way forward.”
Nearly all interview participants viewed the Small Schools grant program as fundamentally at odds with the policy goals articulated in Act 46. In the words of several stakeholders,
“[The Small Schools grant] tends to be a disincentive for a school to face the challenges with demographics and high per pupil spending.”
“Challenges with the existing [grant] is that schools may be small by choice … and this works against other policy goals for Act 46.”
“The Small Schools grant removes the sense of urgency around reevaluating educational practices to make things more fiscally responsible, and to do what is best for kids.”
Study of Pupil Weights in Vermont’s Education Funding Formula 41
Stakeholders also viewed the evolution of the Small Schools grant program as “very inequitable.” There was a sense that, as currently structured, the program is susceptible to political manipulation and that not all schools are subject to the same eligibility criteria. Several interviewees also noted that uncertainties surrounding the program has made it difficult for local school boards to establish budgets. One interviewee observed,
“Schools are waiting each year to learn if they have a grant – and then the grant can be pulled at the last minute – and it would be challenging to make up the revenues. This needs to be fixed. It needs to be predictable and transparent, and built into the existing formula.”
Stakeholders understood the Small Schools grant program’s historical legacy and thought that eliminating the program could meet with political opposition. One stakeholder noted, “Right or wrong – small schools grants have been around a long time. People in small towns understand them and will be distrustful of change.” Proposals to eliminate the grant program will likely draw opposition from communities that received grants in the past, especially for those districts to whom the State committed to providing grants in perpetuity as an incentive for consolidation with other districts under Act 46. In the words of one interviewee,
“It’s a matter of principle, though. AOE made a promise. The Small Schools grant was a big piece of Act 46 – if you were an early adopter, you were able to keep your small school dollars indefinitely. Any change would feel like the State changed the rules.
There was general agreement, however, that difference in education costs for “geographically necessary small schools” need to be recognized in state funding policy.
“We don’t want to create disincentives with respect to Act 46 – but, we want to address factors that stress schools and impact risk to equal opportunity.”
Simply eliminating the grant program, however, without some other cost adjustment in place for school size would be problematic. In general, stakeholders felt that incorporating weights for school size and “rurality” in the equalized pupil calculation might alleviate concerns related to eliminating the Small Schools grant program. In the words of one stakeholder, “It wouldn’t be that they would get a dedicated grant – but, as long as it is coming in another way, as long as the dollars come back in a different way.”
Other Considerations
In the course of our discussions with stakeholders, two additional topics were consistently identified as concerns with the State’s existing funding policies: (1) the impact of “Early College” on how the State calculates a district’s long-term membership; (2) the disconnect between tax equity and local decisions about school spending.
Early College Stakeholders raised concerns about the impact of Vermont’s Early College Program (ECP) on a districts’ long-term weighted membership. Students who opt to participate in ECP are no longer included in a district’s average daily membership. This can result in: (1) a lower equalized pupil count for a school district; and (2) by extension, higher per pupil spending and local tax rates, even if a school budget does not change. Also, at issue was the fact that although ECP students are no longer counted in district enrollment, most school districts continue to provide academic and non-academic supports for ECP students. Two superintendents described the situation,
Study of Pupil Weights in Vermont’s Education Funding Formula 42
“We continue to provide guidance support - lots, in fact - and [ECP] students continue to meet with their advisors and advisories. It is important for socio-emotional [support] that the guidance counselors meet with them regularly… As a district, we continue to invest in these students even though they are not here full time.”
“Some of the early college students come back each day and access afterschool academic support and participate in extracurriculars. But we don’t receive any credit for these students in the funding formula.”
The general consensus among stakeholders was that ECP students should be counted in a district’s weighted long-term membership as a fraction of a full FTE student, as opposed to the existing practice of not including them at all.
Tax Capacity & Local Spending Decisions A number of stakeholders noted that the weights used in the equalized pupil calculation have “very little to do with what a school district spends. All they do is ‘tweak’ the tax rates.” For many, this systemic artifact was at odds with equalizing opportunities to learn. In the words of one interviewee,
“What we’ve done is raise the money more fairly, but we don’t spend it fairly. We have high and low spending districts. But there is no floor for spending – no adequacy threshold. It’s up to localities to decide what is needed, and in some districts, this is really a function of what taxpayers are willing to pay – not student need.”
For stakeholders, the underlying concern was that efforts to update the equalized pupil calculation to better reflect costs and introduce “more equity into the system” may not translate to increased levels of spending in districts with higher need. Instead, the additional tax capacity generated by a higher equalized pupil count may be seen as an opportunity to reduce taxes, rather than increase spending.
Stakeholders who were concerned about this issue that the State consider adopting new provisions that link “taxing policy” with student outcomes or educational practices in a town. One stakeholder called for increased, “field reviews” that are tied to state education funding. Another interviewee noted that there needs to be a level of “quality” under which a district or school cannot go. In the words of two interview participants,
“We have a minimum spending threshold – in the yield – but there is no floor for evaluating quality and no way to link this to the current funding formula. So, the risk is that with any potential adjustments to the equalized pupil is that even with additional capacity, some districts continue to not provide the quality of education their students deserve.”
“Where you open tax capacity in a locality [through new weights] – how do you protect to make sure that the additional capacity is used for kids, not tax cuts?”
Despite concerns, stakeholders were unsure about how to mitigate this issue. Rather, most agreed that, “there needs to be a robust conversation. If we’re going to provide additional capacity, there needs to be additional capacity to use this correctly.”
Summary
The cost factors incorporated in the calculation do not reflect current educational circumstances. Stakeholders viewed the existing approach as “outdated.” Neither the factors considered by the formula nor the value of the weights reflect contemporary educational circumstances and costs.
Study of Pupil Weights in Vermont’s Education Funding Formula 43
The values for the existing weights have weak ties, if any, with evidence describing differences in the costs for educating students with disparate needs or operating schools in different contexts.
Stakeholders unanimously agreed that the funding formula should continue to include weights for economically-disadvantaged and ELL students. However, the existing weights for economic-disadvantage and ELL students are insufficient and should be updated to reflect the actual level of investment that is needed to ensure these students meet state standards.
Stakeholders shared different perspectives on which grade levels should be accounted for in the equalized pupil calculation. However, they all agreed that the value of the existing secondary-level grade weight is arbitrary and that there is a need for “new evidence” about how costs differ across grade levels.
Stakeholders recommended that a new weight for the population density of the area in which a district is located be used when calculating the number of equalized pupils in a school district.
They were uniformly frustrated with the State’s Small Schools grant program, both in its design and operations. Stakeholders recommended abolishing the program, and instead, integrating weights in the equalized pupil calculation for geographically-necessary small schools.
The transportation aid grant program is operating effectively and does not require modifications.
Stakeholder perspectives were mixed as to whether the special education census grant calculation should be revised to include adjustments for differences in student need across school districts. If adjustments are made, stakeholders preferred changes to how the number of pupils in a supervisory union are counted, as opposed to adjusting the unified base amount (i.e., per capita grant) for a district’s poverty rate.
Stakeholders recommended new categorical funding programs which would provide specific and targeted aid for student mental health services and trauma-informed instruction. They also suggested that the State consider new grant programs that provide supplemental aid to districts that have higher-than-average concentrations of economically-disadvantaged and ELL populations.
Stakeholders raised concerns about how ECP students are deducted from the count of students in a school district. The general consensus was that ECP students should be counted in a district’s weighted long-term membership as a fraction of a full FTE student, as opposed to the existing practice of not including them at all.
There was a general concern among stakeholders that efforts to update the equalized pupil calculation to better reflect differences in educational costs may not translate to increased levels of spending in districts with higher need. Instead, the additional tax capacity generated by a higher equalized pupil count may be seen as an opportunity to reduce taxes rather than increase spending.
Study of Pupil Weights in Vermont’s Education Funding Formula 44
IV. Evaluating Cost Factors & Weights Included in Vermont’s School Funding Formula
A key task for this study was to consider the appropriateness of the cost factors and weights to be used in Vermont’s equalized pupil calculation. Specifically, our work was guided by the following two questions:
1) What cost factors should be accounted for in Vermont’s equalized pupil calculation?
2) When calculating the number of equalized pupils, what should the magnitude of the adjustment (or weight) be for each cost factor?
In this chapter, we report the results of our evaluation. Specifically, we identified factors that most thoroughly address differences in educational costs across Vermont districts. For each identified factor, we then developed specific cost adjustments, in the form of weights, that can be incorporated into Vermont’s school funding formula.
In the following sections, we describe our methods and findings. The chapter concludes with a summary of key findings and our recommendations.
Analytic Approach
Our analytic approach involved two sets of statistical analyses: (1) a risk analysis and (2) a cost function analysis (Table 4.1).
We conducted a statistical risk analysis to identify factors (e.g., poverty) that pose a “risk” to students achieving common measured outcome standards for academic achievement in mathematics and English language arts (ELA) (Table 4.1, Step 1). Where risk factors adversely affect student outcomes, additional resources might be used to mitigate negative effects.
This work involved statistically evaluating multiple measures of student need to identify those that most accurately explain differences in student outcomes in Vermont. Factors adversely affecting student outcomes (i.e., “risk factors”) can influence the cost of meeting specific outcome targets for students with different educational needs and in varied educational settings. The risk factors identified in our analysis served as the starting point for selecting which measures of student need are most useful for explaining differences in educational costs across Vermont districts and schools.
As a second step, cost function analysis was used to identify, more specifically, factors associated with differences in the cost of achieving common outcomes goals and estimate each factor’s cost differential. For instance, cost function models (Table 4.1, Step 2a) tell us how much more it costs to achieve a given outcome target in a school with higher versus lower concentrations of student poverty, English language learners (ELLs), and SWD or for very small versus large schools and schools in sparsely versus densely populated areas.
Ultimately, the policy application of the cost modeling findings is to identify specific cost adjustments—in the form of understandable and usable weights—that can be incorporated into Vermont’s school funding formula. To do this, the initial cost models are further distilled to arrive at a set of weight adjustments for the set of cost factors that most readily account for differences in student achievement across Vermont schools (Table 4.1, Step 2b).
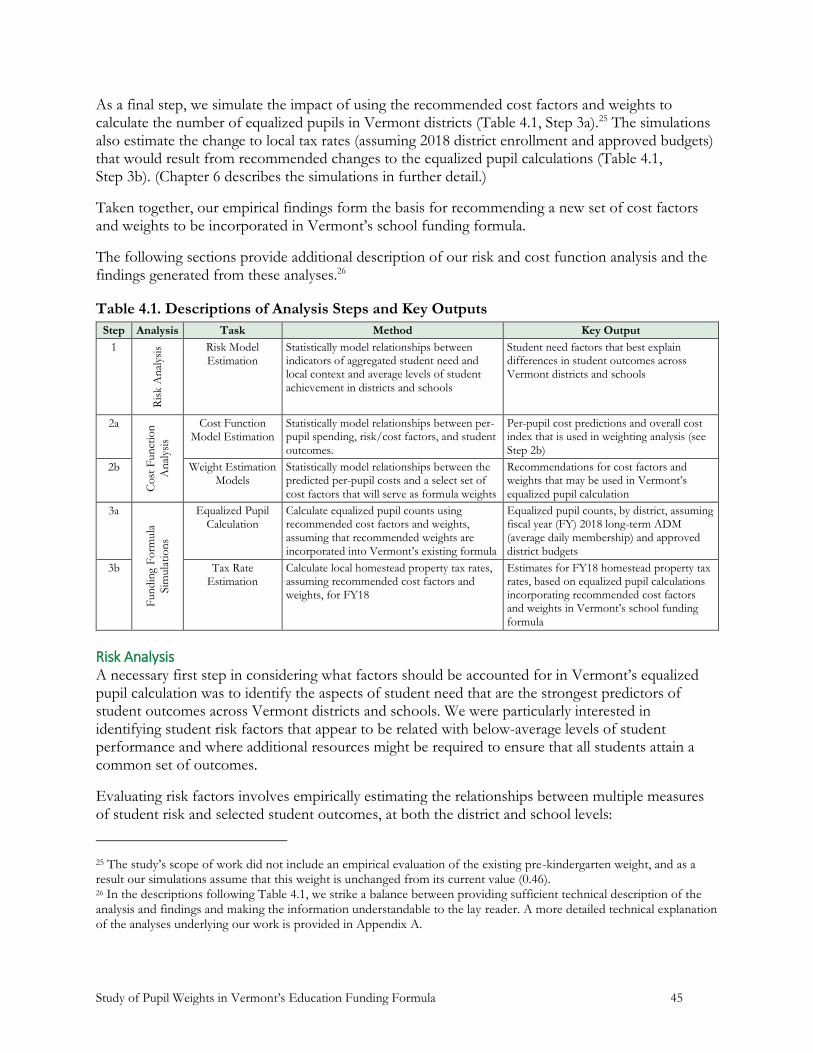
Study of Pupil Weights in Vermont’s Education Funding Formula 45
As a final step, we simulate the impact of using the recommended cost factors and weights to calculate the number of equalized pupils in Vermont districts (Table 4.1, Step 3a).25 The simulations also estimate the change to local tax rates (assuming 2018 district enrollment and approved budgets) that would result from recommended changes to the equalized pupil calculations (Table 4.1, Step 3b). (Chapter 6 describes the simulations in further detail.)
Taken together, our empirical findings form the basis for recommending a new set of cost factors and weights to be incorporated in Vermont’s school funding formula.
The following sections provide additional description of our risk and cost function analysis and the findings generated from these analyses.26
Table 4.1. Descriptions of Analysis Steps and Key Outputs
Step Analysis Task Method Key Output
1
Ris
k A
nal
ysis
Risk Model Estimation
Statistically model relationships between indicators of aggregated student need and local context and average levels of student
achievement in districts and schools
Student need factors that best explain differences in student outcomes across Vermont districts and schools
2a
Co
st F
un
ctio
n
An
alys
is
Cost Function Model Estimation
Statistically model relationships between per-pupil spending, risk/cost factors, and student
outcomes.
Per-pupil cost predictions and overall cost index that is used in weighting analysis (see
Step 2b)
2b Weight Estimation Models
Statistically model relationships between the predicted per-pupil costs and a select set of
cost factors that will serve as formula weights
Recommendations for cost factors and weights that may be used in Vermont’s
equalized pupil calculation
3a
Fun
din
g F
orm
ula
Sim
ula
tio
ns
Equalized Pupil Calculation
Calculate equalized pupil counts using recommended cost factors and weights, assuming that recommended weights are incorporated into Vermont’s existing formula
Equalized pupil counts, by district, assuming fiscal year (FY) 2018 long-term ADM (average daily membership) and approved district budgets
3b Tax Rate Estimation
Calculate local homestead property tax rates, assuming recommended cost factors and weights, for FY18
Estimates for FY18 homestead property tax rates, based on equalized pupil calculations incorporating recommended cost factors and weights in Vermont’s school funding
formula
Risk Analysis A necessary first step in considering what factors should be accounted for in Vermont’s equalized pupil calculation was to identify the aspects of student need that are the strongest predictors of student outcomes across Vermont districts and schools. We were particularly interested in identifying student risk factors that appear to be related with below-average levels of student performance and where additional resources might be required to ensure that all students attain a common set of outcomes.
Evaluating risk factors involves empirically estimating the relationships between multiple measures of student risk and selected student outcomes, at both the district and school levels:
25 The study’s scope of work did not include an empirical evaluation of the existing pre-kindergarten weight, and as a result our simulations assume that this weight is unchanged from its current value (0.46). 26 In the descriptions following Table 4.1, we strike a balance between providing sufficient technical description of the analysis and findings and making the information understandable to the lay reader. A more detailed technical explanation of the analyses underlying our work is provided in Appendix A.

Study of Pupil Weights in Vermont’s Education Funding Formula 46
Risk Factordistrict/school → Outcome Measuredistrict/school
In our models, we also considered whether the relationship between risk factors and student outcomes varies according to the district or school context. For example, student poverty in schools in sparsely populated areas may affect student outcomes differently than how it is experienced in more populated areas.27
Measures Used in Analysis Three sets of measures were used in our risk analysis: indicators of (1) student need, (2) district and school context (as controls), and (3) aggregated student outcomes. Table 4.2 lists the specific measures used in our analysis and the data sources from which they were derived.28
Student Need We incorporated multiple indicators of student need in our district- and school-level risk models, including the percentages of (1) students who are economically disadvantaged, (2) ELLs, and (3) students with mild and severe disabilities (see Table 4.2).
We empirically evaluated several measures of student economic disadvantage, with the goal of identifying distinct measures that are most closely associated with average levels of student achievement in a district or school. At the school level, we considered two alternative measures for the share of students who are FRPL eligible: one reported by Vermont’s Agency of Education (AOE)29 and a second measure reported by the U.S. Department of Education’s Common Core of Data (CCD). The distinction between the two sources rests with how AOE categorizes schools eligible for schoolwide nutrition programs in their data.30
At the district level, we draw on two other sources of information about student poverty. First, we consider the percentage of students who are economically disadvantaged in a district.31 Alternatively, we also consider the percentage of school-aged children residing in a district (ages 5–17) who are identified as living in poverty, according to the U.S. Census Bureau’s Small Area Income Poverty (SAIPE) data.
The percentages of ELLs and SWDs in districts and schools were provided by AOE.
27 Contextual factors considered in our district- and school-level models include student grade range, enrollment, and population density. (See Table 4.2 for a list of measures.) 28 Data were pooled for academic years 2008–09 through 2017–18, and observations were weighted by district and school enrollment. 29 When evaluating the appropriateness of the AOE FRPL measure, we further disaggregated the data according to the share of students who receive free lunch and those who receive reduced-price lunch. Correlations for these supplemental variables are reported in Tables 4.4 and 4.5. 30 Schools with more than 40% of the student population identified as FRPL eligible are considered eligible for a schoolwide nutrition program. As a result, AOE data report schools with more than 40% of the students who are FRPL eligible as having 100% of the student population FRPL eligible. Information reported to the U.S. Department of Education to be included in the CCD, however, reports the actual percentage of students in a school who are FRPL eligible. Accordingly, the CCD data may include more variation in the share of students who are FRPL eligible in a school than data reported by AOE. Accordingly, we evaluated which measure of student economic disadvantage was most closely associated with differences in student outcomes across Vermont schools. 31 This measure is calculated by AOE using data from Vermont’s Department of Children and Families on the share of children residing with family units who receive nutrition benefits. AOE uses this measure to estimate district-level poverty ratios, which are applied when calculating the number of equalized pupils in a district.
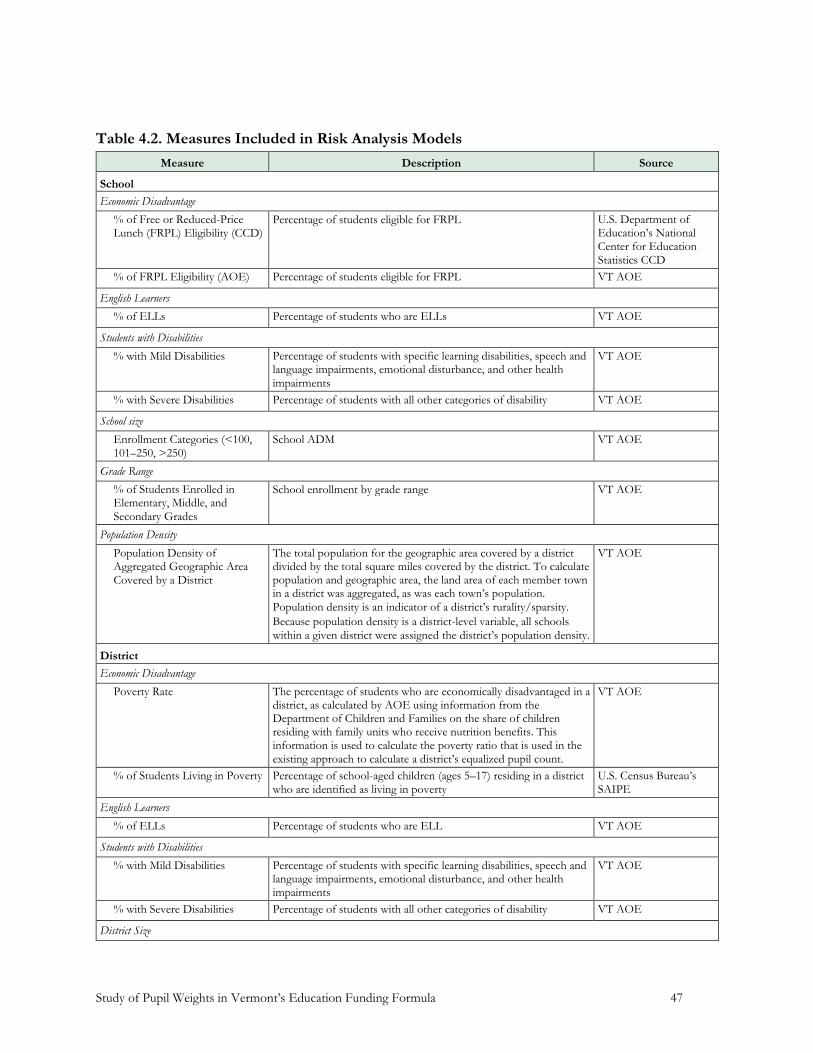
Study of Pupil Weights in Vermont’s Education Funding Formula 47
Table 4.2. Measures Included in Risk Analysis Models
Measure Description Source
School
Economic Disadvantage
% of Free or Reduced-Price Lunch (FRPL) Eligibility (CCD)
Percentage of students eligible for FRPL U.S. Department of Education’s National Center for Education Statistics CCD
% of FRPL Eligibility (AOE) Percentage of students eligible for FRPL VT AOE
English Learners
% of ELLs Percentage of students who are ELLs VT AOE
Students with Disabilities
% with Mild Disabilities Percentage of students with specific learning disabilities, speech and language impairments, emotional disturbance, and other health
impairments
VT AOE
% with Severe Disabilities Percentage of students with all other categories of disability VT AOE
School size
Enrollment Categories (<100, 101–250, >250)
School ADM VT AOE
Grade Range
% of Students Enrolled in Elementary, Middle, and
Secondary Grades
School enrollment by grade range VT AOE
Population Density
Population Density of Aggregated Geographic Area Covered by a District
The total population for the geographic area covered by a district divided by the total square miles covered by the district. To calculate population and geographic area, the land area of each member town in a district was aggregated, as was each town’s population.
Population density is an indicator of a district’s rurality/sparsity.
Because population density is a district-level variable, all schools
within a given district were assigned the district’s population density.
VT AOE
District
Economic Disadvantage
Poverty Rate The percentage of students who are economically disadvantaged in a district, as calculated by AOE using information from the Department of Children and Families on the share of children residing with family units who receive nutrition benefits. This information is used to calculate the poverty ratio that is used in the existing approach to calculate a district’s equalized pupil count.
VT AOE
% of Students Living in Poverty Percentage of school-aged children (ages 5–17) residing in a district who are identified as living in poverty
U.S. Census Bureau’s SAIPE
English Learners
% of ELLs Percentage of students who are ELL VT AOE
Students with Disabilities
% with Mild Disabilities Percentage of students with specific learning disabilities, speech and language impairments, emotional disturbance, and other health impairments
VT AOE
% with Severe Disabilities Percentage of students with all other categories of disability VT AOE
District Size
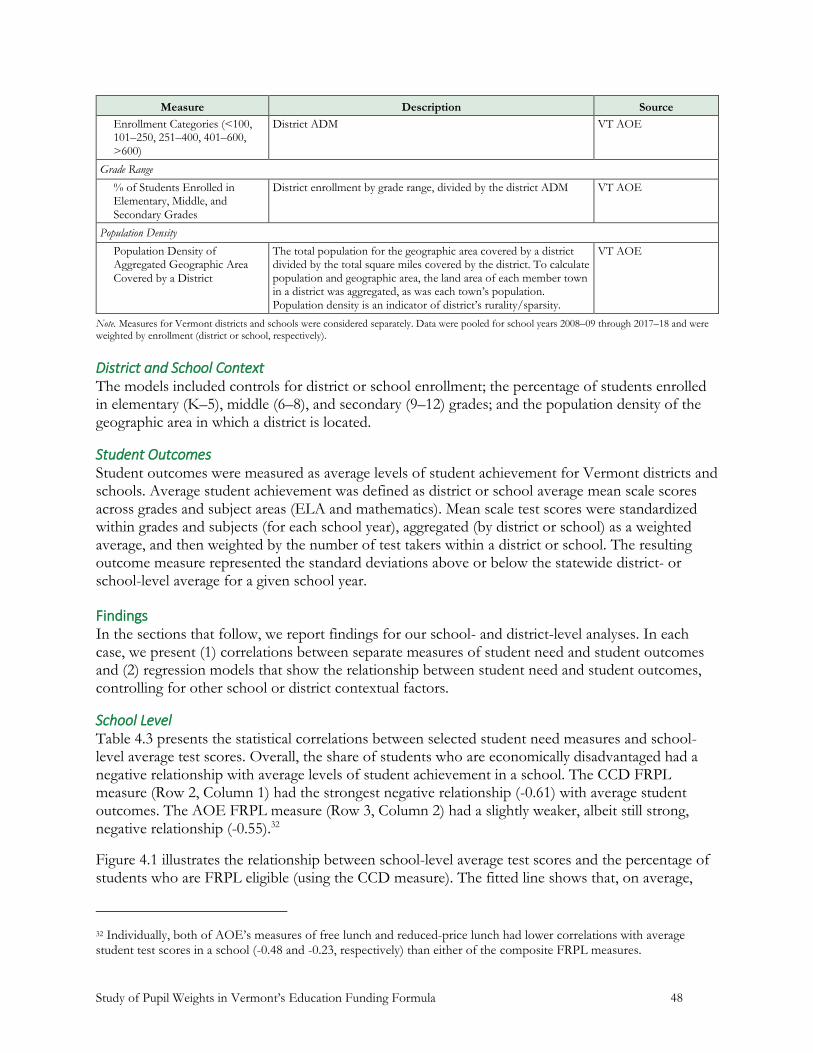
Study of Pupil Weights in Vermont’s Education Funding Formula 48
Measure Description Source
Enrollment Categories (<100, 101–250, 251–400, 401–600, >600)
District ADM VT AOE
Grade Range
% of Students Enrolled in Elementary, Middle, and
Secondary Grades
District enrollment by grade range, divided by the district ADM VT AOE
Population Density
Population Density of Aggregated Geographic Area
Covered by a District
The total population for the geographic area covered by a district divided by the total square miles covered by the district. To calculate population and geographic area, the land area of each member town in a district was aggregated, as was each town’s population. Population density is an indicator of district’s rurality/sparsity.
VT AOE
Note. Measures for Vermont districts and schools were considered separately. Data were pooled for school years 2008–09 through 2017–18 and were weighted by enrollment (district or school, respectively).
District and School Context The models included controls for district or school enrollment; the percentage of students enrolled in elementary (K–5), middle (6–8), and secondary (9–12) grades; and the population density of the geographic area in which a district is located.
Student Outcomes Student outcomes were measured as average levels of student achievement for Vermont districts and schools. Average student achievement was defined as district or school average mean scale scores across grades and subject areas (ELA and mathematics). Mean scale test scores were standardized within grades and subjects (for each school year), aggregated (by district or school) as a weighted average, and then weighted by the number of test takers within a district or school. The resulting outcome measure represented the standard deviations above or below the statewide district- or school-level average for a given school year.
Findings In the sections that follow, we report findings for our school- and district-level analyses. In each case, we present (1) correlations between separate measures of student need and student outcomes and (2) regression models that show the relationship between student need and student outcomes, controlling for other school or district contextual factors.
School Level Table 4.3 presents the statistical correlations between selected student need measures and school-level average test scores. Overall, the share of students who are economically disadvantaged had a negative relationship with average levels of student achievement in a school. The CCD FRPL measure (Row 2, Column 1) had the strongest negative relationship (-0.61) with average student outcomes. The AOE FRPL measure (Row 3, Column 2) had a slightly weaker, albeit still strong, negative relationship (-0.55).32
Figure 4.1 illustrates the relationship between school-level average test scores and the percentage of students who are FRPL eligible (using the CCD measure). The fitted line shows that, on average,
32 Individually, both of AOE’s measures of free lunch and reduced-price lunch had lower correlations with average student test scores in a school (-0.48 and -0.23, respectively) than either of the composite FRPL measures.
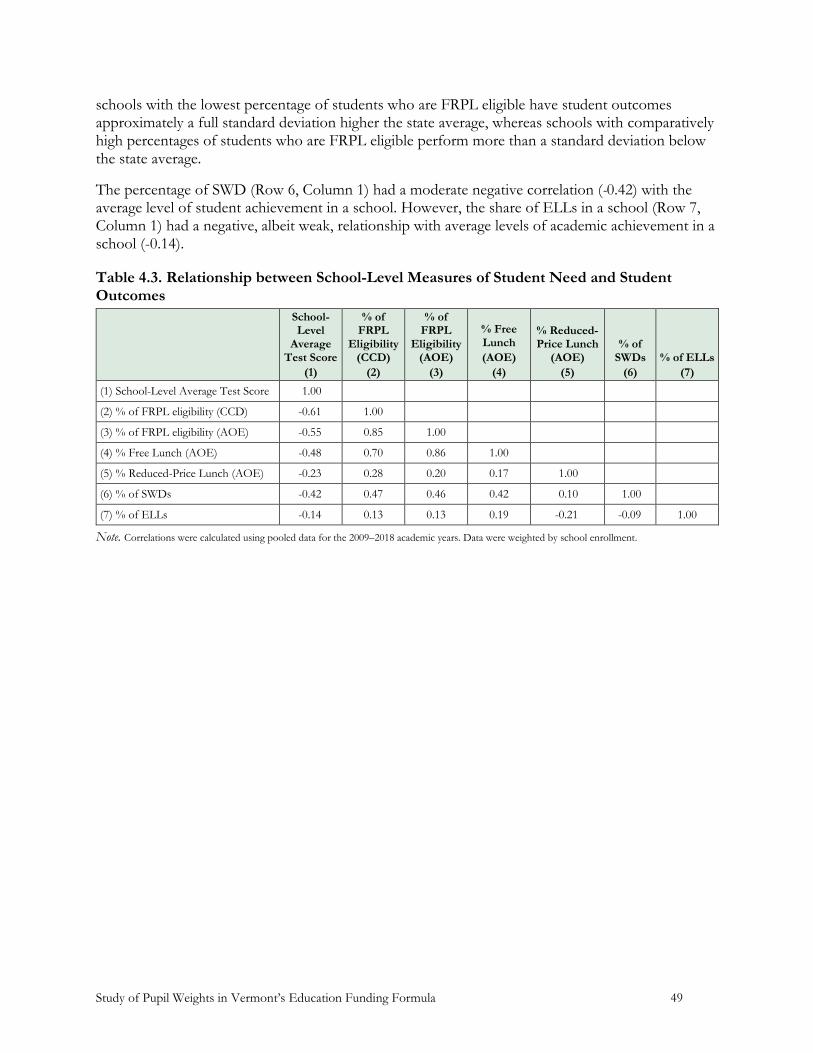
Study of Pupil Weights in Vermont’s Education Funding Formula 49
schools with the lowest percentage of students who are FRPL eligible have student outcomes approximately a full standard deviation higher the state average, whereas schools with comparatively high percentages of students who are FRPL eligible perform more than a standard deviation below the state average.
The percentage of SWD (Row 6, Column 1) had a moderate negative correlation (-0.42) with the average level of student achievement in a school. However, the share of ELLs in a school (Row 7, Column 1) had a negative, albeit weak, relationship with average levels of academic achievement in a school (-0.14).
Table 4.3. Relationship between School-Level Measures of Student Need and Student Outcomes
School-Level
Average Test Score
(1)
% of FRPL
Eligibility (CCD)
(2)
% of FRPL
Eligibility (AOE)
(3)
% Free Lunch
(AOE)
(4)
% Reduced-Price Lunch
(AOE)
(5)
% of SWDs
(6)
% of ELLs
(7)
(1) School-Level Average Test Score 1.00
(2) % of FRPL eligibility (CCD) -0.61 1.00
(3) % of FRPL eligibility (AOE) -0.55 0.85 1.00
(4) % Free Lunch (AOE) -0.48 0.70 0.86 1.00
(5) % Reduced-Price Lunch (AOE) -0.23 0.28 0.20 0.17 1.00
(6) % of SWDs -0.42 0.47 0.46 0.42 0.10 1.00
(7) % of ELLs -0.14 0.13 0.13 0.19 -0.21 -0.09 1.00
Note. Correlations were calculated using pooled data for the 2009–2018 academic years. Data were weighted by school enrollment.
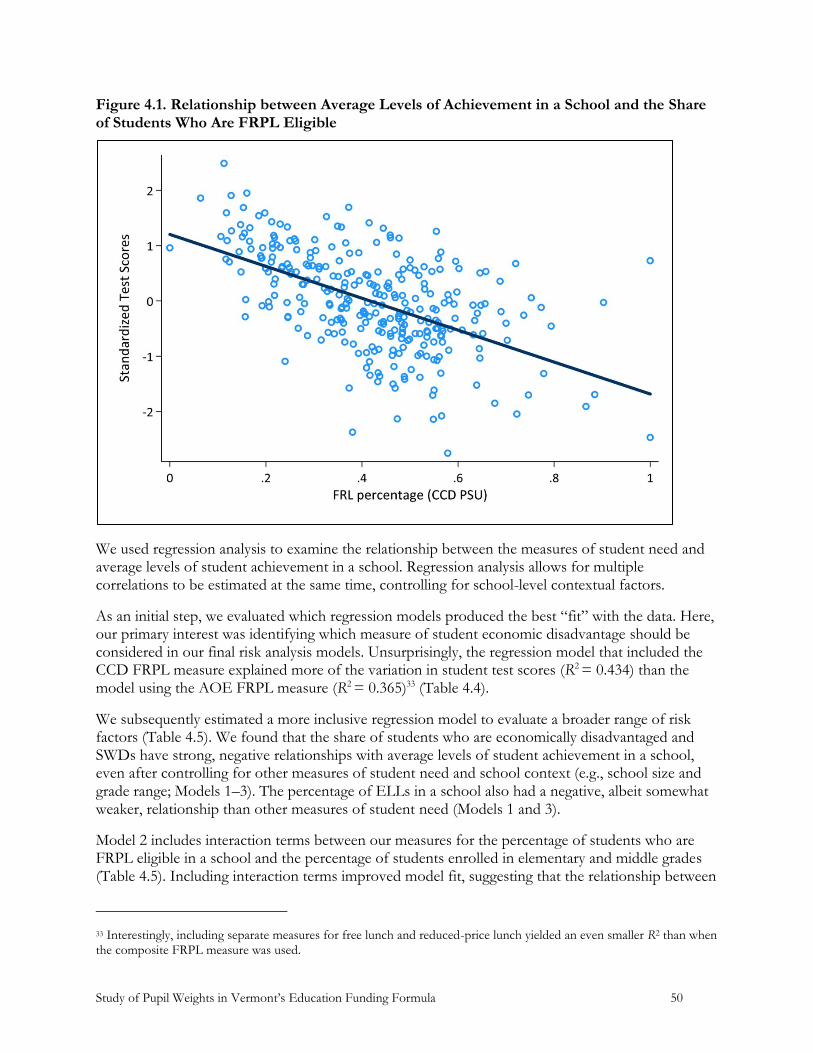
Study of Pupil Weights in Vermont’s Education Funding Formula 50
Figure 4.1. Relationship between Average Levels of Achievement in a School and the Share of Students Who Are FRPL Eligible
We used regression analysis to examine the relationship between the measures of student need and average levels of student achievement in a school. Regression analysis allows for multiple correlations to be estimated at the same time, controlling for school-level contextual factors.
As an initial step, we evaluated which regression models produced the best “fit” with the data. Here, our primary interest was identifying which measure of student economic disadvantage should be considered in our final risk analysis models. Unsurprisingly, the regression model that included the CCD FRPL measure explained more of the variation in student test scores (R2 = 0.434) than the model using the AOE FRPL measure (R2 = 0.365)33 (Table 4.4).
We subsequently estimated a more inclusive regression model to evaluate a broader range of risk factors (Table 4.5). We found that the share of students who are economically disadvantaged and SWDs have strong, negative relationships with average levels of student achievement in a school, even after controlling for other measures of student need and school context (e.g., school size and grade range; Models 1–3). The percentage of ELLs in a school also had a negative, albeit somewhat weaker, relationship than other measures of student need (Models 1 and 3).
Model 2 includes interaction terms between our measures for the percentage of students who are FRPL eligible in a school and the percentage of students enrolled in elementary and middle grades (Table 4.5). Including interaction terms improved model fit, suggesting that the relationship between
33 Interestingly, including separate measures for free lunch and reduced-price lunch yielded an even smaller R2 than when the composite FRPL measure was used.

Study of Pupil Weights in Vermont’s Education Funding Formula 51
the percentage of students who are FRPL eligible and average student test scores varies by the share of students enrolled in elementary, middle, and secondary grades. Specifically, the interaction terms by grade range show that the association between the share of students who are FRPL eligible and average student test scores is weaker in the elementary grades compared with the middle and secondary grades. Put another way, the negative relationship between the share of students who are economically disadvantaged and student outcomes is more pronounced at the middle and secondary levels than at the elementary level.
Model 3 includes interaction terms between our measure for the share of students who are FRPL eligible in a school and school enrollment. The interaction terms also improve model fit, suggesting that the relationship between the percentage of students who are FRPL eligible and average student test scores varies by school enrollment. In particular, the interactions suggest that the share of students who are economically disadvantaged in a school has a diminished relationship with test scores in smaller schools than larger ones (i.e., the relationship between the share of students who are economically disadvantaged is weaker in smaller schools than it is in larger schools).
Although not shown in Table 4.5, Models 1–3 also included a control for the population density of the district in which a school is located. However, population density was not a statistically significant predictor of average levels of student achievement in schools. The interaction between the percentage of students who are FRPL eligible in a school and population density also was statistically insignificant.
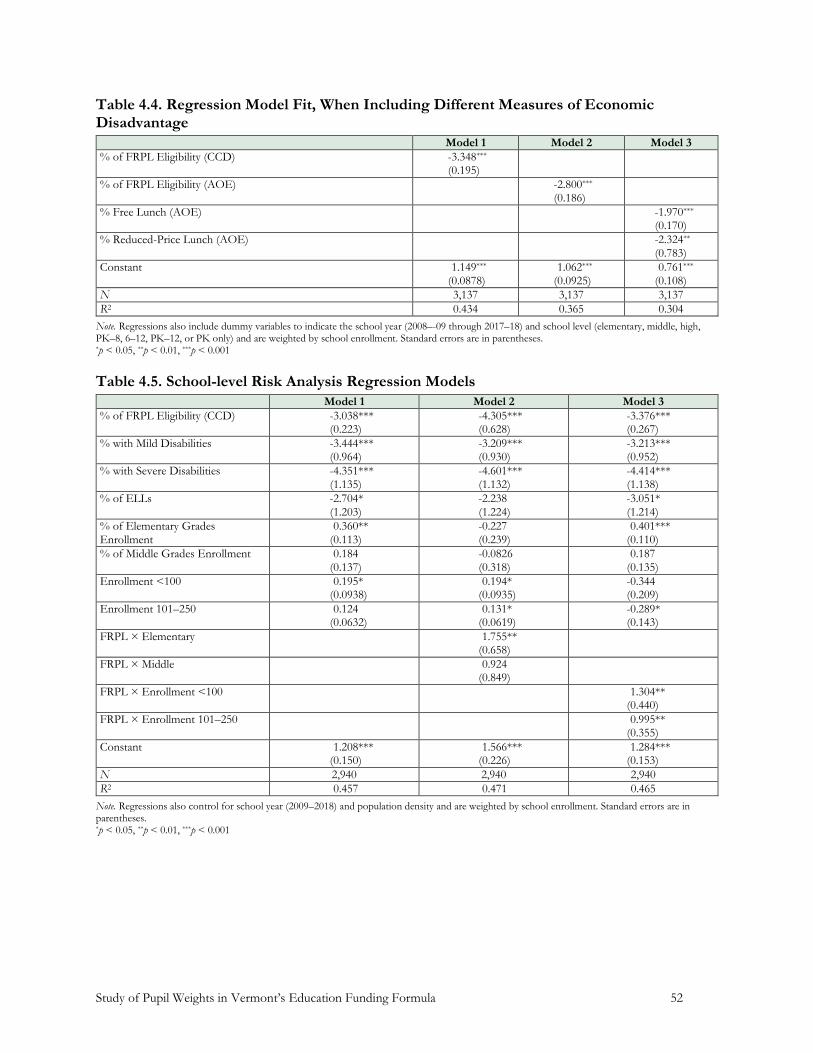
Study of Pupil Weights in Vermont’s Education Funding Formula 52
Table 4.4. Regression Model Fit, When Including Different Measures of Economic Disadvantage
Model 1 Model 2 Model 3
% of FRPL Eligibility (CCD) -3.348*** (0.195)
% of FRPL Eligibility (AOE) -2.800*** (0.186)
% Free Lunch (AOE) -1.970*** (0.170)
% Reduced-Price Lunch (AOE) -2.324** (0.783)
Constant 1.149*** (0.0878)
1.062*** (0.0925)
0.761*** (0.108)
N 3,137 3,137 3,137
R2 0.434 0.365 0.304
Note. Regressions also include dummy variables to indicate the school year (2008–-09 through 2017–18) and school level (elementary, middle, high, PK–8, 6–12, PK–12, or PK only) and are weighted by school enrollment. Standard errors are in parentheses. *p < 0.05, **p < 0.01, ***p < 0.001
Table 4.5. School-level Risk Analysis Regression Models
Model 1 Model 2 Model 3
% of FRPL Eligibility (CCD) -3.038*** (0.223)
-4.305*** (0.628)
-3.376*** (0.267)
% with Mild Disabilities -3.444*** (0.964)
-3.209*** (0.930)
-3.213*** (0.952)
% with Severe Disabilities -4.351*** (1.135)
-4.601*** (1.132)
-4.414*** (1.138)
% of ELLs -2.704* (1.203)
-2.238 (1.224)
-3.051* (1.214)
% of Elementary Grades Enrollment
0.360** (0.113)
-0.227 (0.239)
0.401*** (0.110)
% of Middle Grades Enrollment 0.184 (0.137)
-0.0826 (0.318)
0.187 (0.135)
Enrollment <100 0.195* (0.0938)
0.194* (0.0935)
-0.344 (0.209)
Enrollment 101–250 0.124 (0.0632)
0.131* (0.0619)
-0.289* (0.143)
FRPL × Elementary 1.755** (0.658)
FRPL × Middle 0.924 (0.849)
FRPL × Enrollment <100 1.304** (0.440)
FRPL × Enrollment 101–250 0.995** (0.355)
Constant 1.208*** (0.150)
1.566*** (0.226)
1.284*** (0.153)
N 2,940 2,940 2,940
R2 0.457 0.471 0.465
Note. Regressions also control for school year (2009–2018) and population density and are weighted by school enrollment. Standard errors are in parentheses. *p < 0.05, **p < 0.01, ***p < 0.001

Study of Pupil Weights in Vermont’s Education Funding Formula 53
District Level As with our school-level analysis, we first examined correlations between average student test scores in Vermont districts and district-level measures of student need (Table 4.6).
Among student need measures, the district poverty rate (calculated by AOE; Row 2, Column 1) had the strongest negative relationship with average levels of student achievement in a district (0.61). The population-based poverty measure derived from the U.S. Census Bureau’s SAIPE data also had a negative relationship with student outcomes (-0.49; Row 3, Column 1) but was not as strongly related as the AOE-calculated poverty rate.
The percentage of SWDs in a district had a strong negative relationship with average levels of student achievement in a district (-0.51; Row 4, Column 1). However, the percentage of ELLs in a district had a very weak, but negative, association with average test scores (Row 5, Column 1).
Table 4.6. Relationship between District-Level Measures of Student Need and Student Outcomes
District-Level Average Test
Scores
(1)
Poverty Rate (AOE)
(2)
Poverty Rate (SAIPE)
(3)
% of SWDs
(4)
% of ELLs
(5)
(1) District-Level Average Test Scores 1.00
(2) Poverty Rate (AOE) -0.61 1.00
(3) Poverty Rate (SAIPE) -0.49 0.62 1.00
(4) % of SWDs -0.51 0.56 0.41 1.00
(5) % of ELLs -0.06 0.21 0.09 -0.16 1.00
Note. Correlations are weighted by district enrollment and were calculated using pooled data for the 2009–2018 academic years.
As was the case with our school-level analysis, we also estimated regression models to evaluate the relationships between measures of student need and district context and average levels of student achievement in districts (Table 4.7). We found that two district-level measures of student need have a strong, negative relationship with average student test scores: (1) a district’s poverty rate and (2) the percentage of students with mild disabilities in a school district (Models 1–3). We did not find a statistically significant relationship between the percentage of SWDs with severe disabilities or ELL in a district and average levels of student achievement (Models 1–3).
Model 3 includes interaction terms between a district’s poverty rate and measures of district context.34 We found a statistically significant interaction between poverty and the population density of the area in which a district is located. Figure 4.2 depicts this relationship. Here, we see that the relationship is stronger at a population density of 1,500 people per square mile compared with a population density of 10 people per square mile (i.e., depicted by the steeper slope of the dashed line). The negative relationship between the share of students who are economically disadvantaged in a district and average levels of student achievement is stronger in districts in more populated areas than in districts in more sparsely-populated areas of the state.
34 The overall fit of our regression models improved when we added the interaction terms (Model 3; R2 = 0.488). The improvement in model fit was largely caused by the statistically significant interaction between a district’s poverty rate and population density of the area in which a district is located.
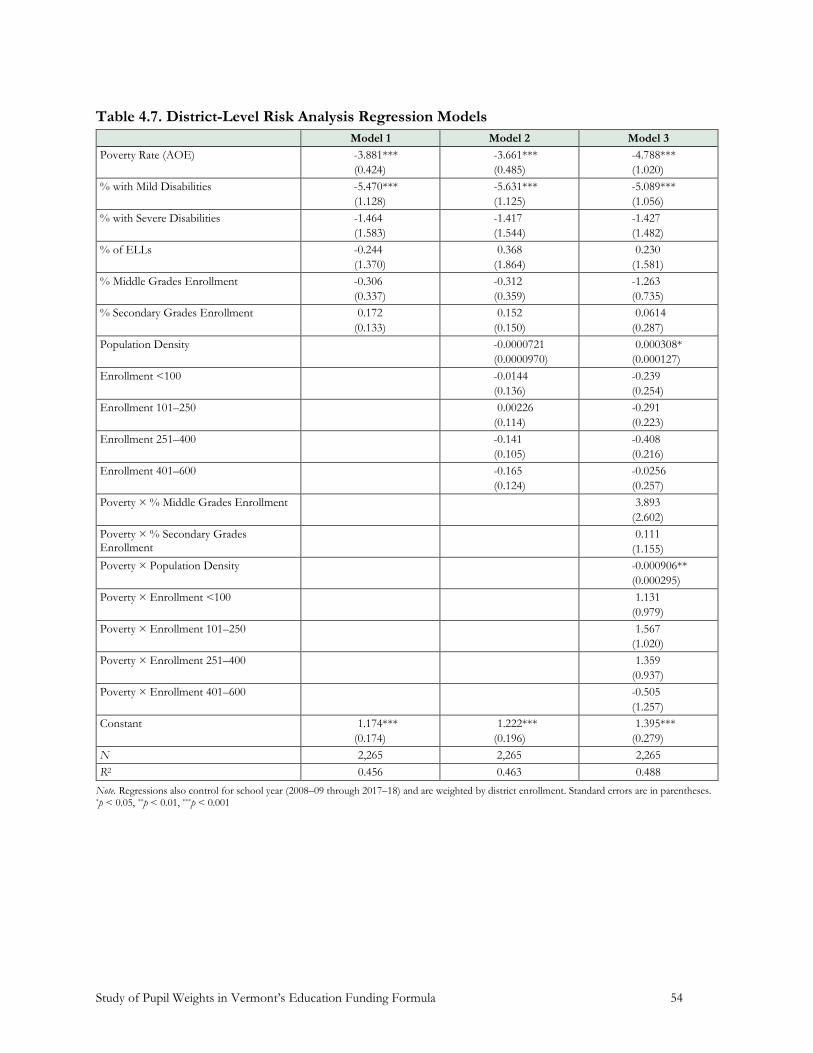
Study of Pupil Weights in Vermont’s Education Funding Formula 54
Table 4.7. District-Level Risk Analysis Regression Models
Model 1 Model 2 Model 3
Poverty Rate (AOE) -3.881***
(0.424)
-3.661***
(0.485)
-4.788***
(1.020)
% with Mild Disabilities -5.470***
(1.128)
-5.631***
(1.125)
-5.089***
(1.056)
% with Severe Disabilities -1.464
(1.583)
-1.417
(1.544)
-1.427
(1.482)
% of ELLs -0.244
(1.370)
0.368
(1.864)
0.230
(1.581)
% Middle Grades Enrollment -0.306
(0.337)
-0.312
(0.359)
-1.263
(0.735)
% Secondary Grades Enrollment 0.172
(0.133)
0.152
(0.150)
0.0614
(0.287)
Population Density -0.0000721
(0.0000970)
0.000308*
(0.000127)
Enrollment <100 -0.0144
(0.136)
-0.239
(0.254)
Enrollment 101–250 0.00226
(0.114)
-0.291
(0.223)
Enrollment 251–400 -0.141
(0.105)
-0.408
(0.216)
Enrollment 401–600 -0.165
(0.124)
-0.0256
(0.257)
Poverty × % Middle Grades Enrollment 3.893
(2.602)
Poverty × % Secondary Grades Enrollment
0.111
(1.155)
Poverty × Population Density -0.000906**
(0.000295)
Poverty × Enrollment <100 1.131
(0.979)
Poverty × Enrollment 101–250 1.567
(1.020)
Poverty × Enrollment 251–400 1.359
(0.937)
Poverty × Enrollment 401–600 -0.505
(1.257)
Constant 1.174***
(0.174)
1.222***
(0.196)
1.395***
(0.279)
N 2,265 2,265 2,265
R2 0.456 0.463 0.488
Note. Regressions also control for school year (2008–09 through 2017–18) and are weighted by district enrollment. Standard errors are in parentheses. *p < 0.05, **p < 0.01, ***p < 0.001
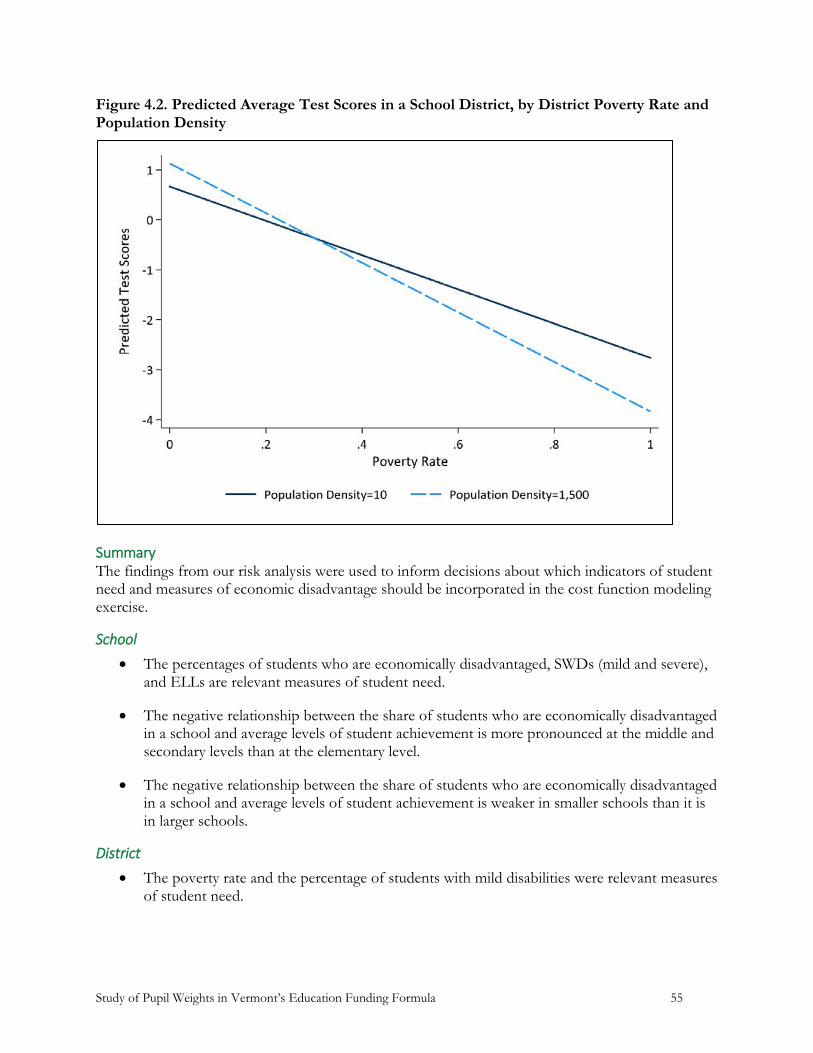
Study of Pupil Weights in Vermont’s Education Funding Formula 55
Figure 4.2. Predicted Average Test Scores in a School District, by District Poverty Rate and Population Density
Summary The findings from our risk analysis were used to inform decisions about which indicators of student need and measures of economic disadvantage should be incorporated in the cost function modeling exercise.
School
The percentages of students who are economically disadvantaged, SWDs (mild and severe), and ELLs are relevant measures of student need.
The negative relationship between the share of students who are economically disadvantaged in a school and average levels of student achievement is more pronounced at the middle and secondary levels than at the elementary level.
The negative relationship between the share of students who are economically disadvantaged in a school and average levels of student achievement is weaker in smaller schools than it is in larger schools.
District
The poverty rate and the percentage of students with mild disabilities were relevant measures of student need.
Study of Pupil Weights in Vermont’s Education Funding Formula 56
The negative relationship between the share of students who are economically disadvantaged in a district and average levels of student achievement is stronger in districts in more populated areas than in districts in more sparsely populated areas of the state.
Measuring Economic Disadvantage
The empirical evaluation of alternative strategies for measuring the extent of economic disadvantage among students in a district or school found that the following measures had the strongest relationship with average student achievement in a district or school: (1) at the school level, the percentage of students who are FRPL eligible, as reported by the U.S. Department of Education’s CCD, and (2) at the district level, the poverty rate estimated by AOE.
Cost Function Analysis
Cost function analysis was used to estimate the additional level of investment needed to ensure that at-risk students and schools with higher operating costs have sufficient resources for students to meet common academic standards. For instance, cost function estimation tells us how much more it costs to achieve a given outcome target in a school with higher versus lower concentrations of poverty, ELL, and SWDs; in smaller versus larger districts and schools; and those in more and less populated areas of the state.
Cost function models estimate per pupil district- or school-level spending as a function of student outcomes, cost factors, and controls for efficiency in producing outcomes. Model results are used to predict the per pupil cost for a district or school, while allowing the cost factors to vary at their observed levels. The predicted costs are then used to estimate weights for selected cost factors.
We estimated three sets of cost function models, each corresponding to a different unit of analysis (Table 4.1, Step 2a):
Model 1 examined educational spending for Vermont districts35 for the 2009–2018 academic years. The model used data provided by Vermont AOE.
Model 2 examined educational spending for Vermont schools36 for the 2009–2018 academic years. The model used data provided by Vermont AOE.
Model 3 examined educational spending for districts in the Northeast region,37 including Vermont, New Hampshire, Maine, and Massachusetts. The model used data from the School Finance Indicators Database.38
Estimating multiple cost function models allowed us to evaluate the consistency of our findings across different units of analysis and data sources.
35 Our models assumed the configuration of Vermont districts in place for the 2018 academic year. Where district governance changed during this time period, AOE established a cross-walk that linked data from prior years to the district configuration in place for the 2018 academic year. 36 Our models assumed including schools in operation during FY2018. 37 Districts in the Boston Metropolitan Statistical Area were excluded from the analysis. 38 For additional information on the School Finance Indicators Database, see Baker, Di Carlo, Srikanth, & Weber (2019).
Study of Pupil Weights in Vermont’s Education Funding Formula 57
To align the cost function estimation with the current structure of Vermont’s funding system, we estimated a second set of more parsimonious weight estimation models that include a selected set of cost factors for policymakers’ consideration (Table 4.1, Step 2b).
The empirical strategies underlying model estimation are rigorous, albeit complex. Appendix A provides a detailed description of the analytic approach and includes supplementary tables that present our findings for each set of cost models. In the sections that follow, we present findings from the weight estimation models that distill the cost function models’ results into a set of funding weights that can be incorporated in Vermont’s existing school funding formula.
Weight Estimation Models The weight estimation models estimate the relationship between the predicted per-pupil spending derived from our cost function models and a selected set of cost factors:
Predicted Per-Pupil Spendingdistrict/school = 𝑓 (Cost Factors district/school)
This calculation produces a “weight” for each cost factor included in the estimation model. Six cost factors were incorporated in the weight estimation models:
Percentage of students who are economically disadvantaged
Percentage of ELLs
Percentage of SWDs (mild and severe)
Percentage of students enrolled in elementary, middle, and secondary grades
Indicators for small district or school enrollment
Population density of the community in which a district or school is located
Students With Disabilities Although our risk analysis and cost function models identified the percentage of SWD as a cost factor, we gave special consideration to this factor in our weight estimation models. Currently, Vermont operates a separate categorical funding program that provides supplemental aid to districts, apart from the general education funding formula. Incorporating an additional weight for the share of students receiving special education services in the equalized pupil calculation would be a second, potentially duplicative, cost adjustment for this population group.
However, whether to include the share of students receiving special education services as a cost factor in the weight estimation models has practical implications for how the weights for all other cost factors are interpreted. For all cost factors, estimated weights are dependent on the other factors included in the estimation models. For instance, the weight for students who are economically disadvantaged, which was derived from a model that controls for the share of students receiving special education services in a district will be different from that derived from a model
Study of Pupil Weights in Vermont’s Education Funding Formula 58
without this control.39 Conversely, an estimation model that controls for the share of students receiving special education services (as a control) would produce a weight for students who are economically disadvantaged that was independent of the extent of student disability in a school district.
Accordingly, our weighting estimation models make different assumptions about whether to include SWDs as a cost factor. Specifically, one set of estimations included control variables that accounted for cross-district or -school differences in the share of students receiving special education services (Estimation 1), whereas the other set of estimations did not (Estimation 2). Weight estimation models with controls yielded weights for all cost factors that are independent of the share of SWDs in a district or school, whereas estimations without controls produced weights for selected cost factors that also may include some of the variation in costs attributable to the share of students receiving special education services in a district or school.
The distinction between whether weights for other cost factors are independent of the share of SWDs in a district or school has practical implications for how policymakers might approach revising the State’s approach to funding local special education programs. Starting in FY2021, Vermont will allocate state special education aid as a census block grant. Since adopting the new formula, questions have been raised as to whether the formula used to calculate the census grant amount should be revised to include adjustments for differences among supervisory unions in the incidence of SWDs.
Weights derived from the different estimation models inform this discussion in two ways. First, policymakers could adopt weights derived from Estimation 2. This would effectively inflate the equalized pupil count by weights that have absorbed some of the variation associated with differences in special education costs across districts or schools. As a result, general education funding will implicitly vary with respect to special education costs through adjustments for the other cost factors (e.g., student poverty) that are correlated with special education. Alternatively, policymakers can adopt weights that are independent of differences in the share of students receiving special education services in a district (derived from Estimation 1) and then make explicit adjustments to how the census grant amount is calculated.
Both alternatives are incorporated in the simulations presented in Chapter 6.
Derived Weights Table 4.8 presents weights derived from cost function models for Vermont school districts and schools. For comparison, Table 4.9 presents weights derived from cost function models for school districts in the Northeast region.
39 In fact, we might expect this weight to be larger than one estimated using a model that included students receiving special education services as a cost factor because of the correlation between student poverty and disability. If the estimation model does not control for the share of students receiving special education services in a district, the weight for students who are economically disadvantaged absorbs some of the explained cost variation that is actually attributable to special education.
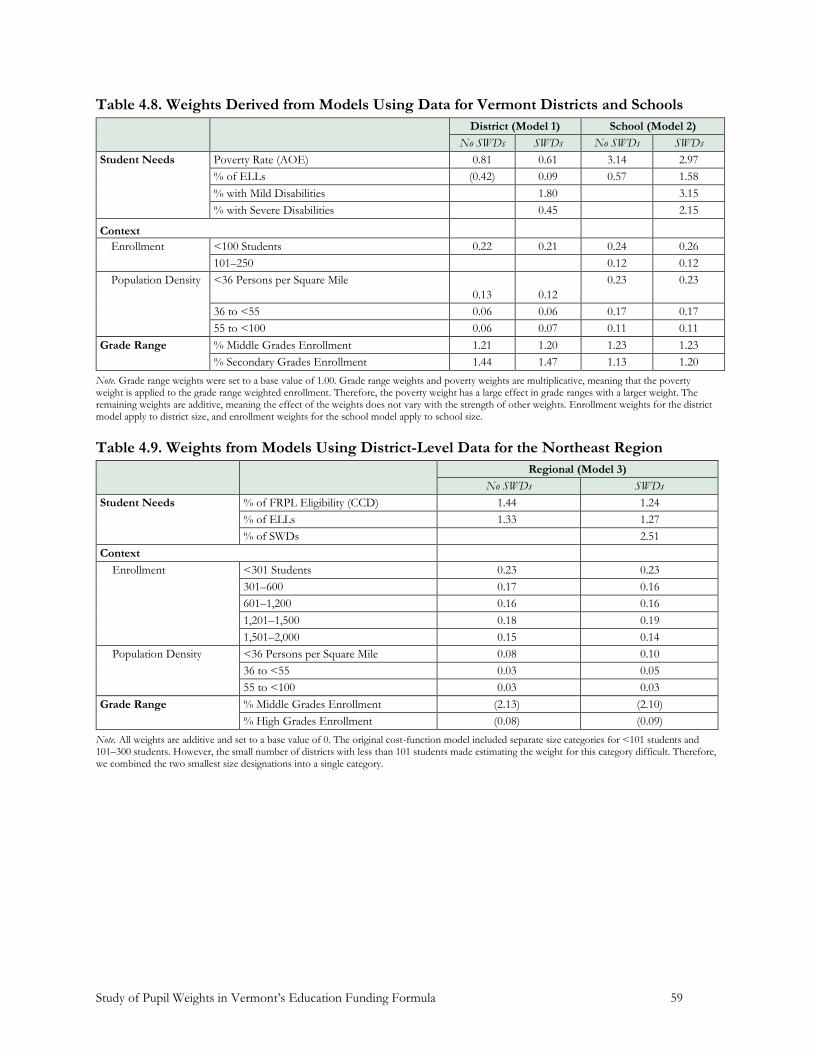
Study of Pupil Weights in Vermont’s Education Funding Formula 59
Table 4.8. Weights Derived from Models Using Data for Vermont Districts and Schools
District (Model 1) School (Model 2)
No SWDs SWDs No SWDs SWDs
Student Needs Poverty Rate (AOE) 0.81 0.61 3.14 2.97
% of ELLs (0.42) 0.09 0.57 1.58
% with Mild Disabilities
1.80
3.15
% with Severe Disabilities
0.45
2.15
Context
Enrollment <100 Students 0.22 0.21 0.24 0.26
101–250
0.12 0.12
Population Density <36 Persons per Square Mile
0.13
0.12
0.23 0.23
36 to <55 0.06 0.06 0.17 0.17
55 to <100 0.06 0.07 0.11 0.11
Grade Range % Middle Grades Enrollment 1.21 1.20 1.23 1.23
% Secondary Grades Enrollment 1.44 1.47 1.13 1.20
Note. Grade range weights were set to a base value of 1.00. Grade range weights and poverty weights are multiplicative, meaning that the poverty weight is applied to the grade range weighted enrollment. Therefore, the poverty weight has a large effect in grade ranges with a larger weight. The remaining weights are additive, meaning the effect of the weights does not vary with the strength of other weights. Enrollment weights for the district model apply to district size, and enrollment weights for the school model apply to school size.
Table 4.9. Weights from Models Using District-Level Data for the Northeast Region
Regional (Model 3)
No SWDs SWDs
Student Needs % of FRPL Eligibility (CCD) 1.44 1.24
% of ELLs 1.33 1.27
% of SWDs
2.51
Context
Enrollment <301 Students 0.23 0.23
301–600 0.17 0.16
601–1,200 0.16 0.16
1,201–1,500 0.18 0.19
1,501–2,000 0.15 0.14
Population Density <36 Persons per Square Mile 0.08 0.10
36 to <55 0.03 0.05
55 to <100 0.03 0.03
Grade Range % Middle Grades Enrollment (2.13) (2.10)
% High Grades Enrollment (0.08) (0.09)
Note. All weights are additive and set to a base value of 0. The original cost-function model included separate size categories for <101 students and 101–300 students. However, the small number of districts with less than 101 students made estimating the weight for this category difficult. Therefore, we combined the two smallest size designations into a single category.
Study of Pupil Weights in Vermont’s Education Funding Formula 60
Interpretation The weight estimation models were developed so that the resulting weights could be readily incorporated into Vermont’s existing school funding formula. As a result, the reported values for the weights must be interpreted in light of how they are used when calculating the number of equalized pupils in a district.
The grade range weights were set to a base value of 1.0, whereas all other weights were set to a base value of 0. Thus, a weight for middle school enrollment of 1.21 (District Model 1, Table 4.8) is interpreted as middle school students counting 21% more than elementary school students when calculating a district’s weighted long-term membership. By contrast, a weight for students who are economically disadvantaged of 0.81 means that these students cost 81% more.
Some weights in the district and school models are multiplicative, whereas others are additive.40 Enrollments by grade range and the poverty rate are multiplicative, resulting in a stronger effect for students who fit into multiple weight categories. In this instance, the weights associated with the poverty rate are effectively stronger for students in the middle and secondary grades. The remaining weights are additive, having the same effect regardless of whether another weight is applied. All weights derived from the regional model were additive (and centered on 0).
The models also used different measures for student economic disadvantage. The regional model used the percentage of students who are FRPL eligible, as reported by the CCD, whereas the district and school models used the poverty rate published by AOE. As a result, the weight for economic disadvantage generated by the regional model was not directly comparable to the weight generated by the district model. The regional and school-level weights for economic disadvantage were somewhat more comparable.
Comparisons Across Models The purpose of generating weights by using different models was to evaluate the consistency of our findings, based on different units of analysis (districts and schools) and data sources (Vermont versus the Northeast region).
Looking across the weights derived from Models 1–3 (Tables 4.8 and 4.9), we found that the weights generated for economic disadvantage were most consistent between the regional and school models (Models 2 and 3, respectively), after taking into account the difference in how the poverty rate (AOE) and percentage of students who are FRPL eligible (CCD) were calculated. The results also suggested that the weights for economic disadvantage may be understated in the Vermont-specific district model.
Weights for the ELL cost factor were less consistent. The Vermont-specific district-level model did not find a cost differential for providing additional support to students who have limited English proficiency. Although the ELL weights derived from the Vermont-specific school-level model and the regional model were similar (when controlling for the share of SWDs in a district or school), the weight derived from the regional model may be viewed as a more reliable estimate. ELLs make up a very small share of most Vermont schools’ enrollment, and, as a result, many schools operate ELL
40 Whether a weight is multiplicative or additive was a function of Vermont’s existing approach to calculating the number of equalized pupils and indicated by statute.
Study of Pupil Weights in Vermont’s Education Funding Formula 61
programs of limited scale and scope. Regionally, districts enroll more ELLs and are likely to have more typical programs and services for students with limited English proficiency.
The weight for Vermont schools with fewer than 100 students mirrored that found for Vermont districts. This makes sense given that, historically, many small Vermont schools have been organized as stand-alone districts. Regionally, districts with fewer than 301 students have a similar cost differential.
Across all models, the weight for different gradients of population density tended to diminish as the population density increased (i.e., the area becomes more populated). The weights derived using the Vermont-specific school model are the largest, and the smallest weights were derived from the regional model. That said, the gradient with which the weights declined as population density increased was most consistent across the sparsity categories in the Vermont-specific school models. For the other models, the weight dropped considerably when moving from the <36 persons per square mile to the 36 to <55 persons per square mile categories, with no appreciable decrease when sparsity increased to 55 to <100 persons per square mile.
Grade-level weights differed between the Vermont-specific and regional models. The regional models suggested that elementary students were more costly to educate. In Vermont, however, both the district and school models suggested that middle and secondary students were more costly to educate than those in elementary schools.
Recommended Weights
The weights estimated for selected cost factors were dependent on the model from which they were derived, including both the underlying data and the cost factors included in the estimation. As a result, for weights to be valid and reliable cost adjustments, recommended weights should be derived from the same model.41
Based on our evaluation of the cost function and the weighting estimation models, we recommend weights derived from the Vermont-specific school-level models. Weights derived from the school-level model were most consistent with those derived using data for districts in the Northeast region, particularly the weights for economic disadvantage and ELLs.
Table 4.10 summarizes our recommendations. The decision to adopt weights derived from models with or without controls for SWDs depends on whether policymakers decide to adjust for differences in special education costs across supervisory unions by adjusting the number of equalized pupils in a district or by revising the formula used to calculate a supervisory union’s census block grant.
Chapter 6 presents a set of simulations that illustrate how the recommended weights might be incorporated into Vermont’s existing education funding formula.
41 The one possible exception is the ELL weight derived from the regional weight estimation model. Because of the limited scale and scope of ELL programs and services in most Vermont schools, the estimated cost differential based on school-specific Vermont data may not be as reliable as the estimate derived from a larger sample of districts in the Northeast region. We included a scenario in our simulations that substituted the regional ELL weights for the ELL weights derived using Vermont-specific data.
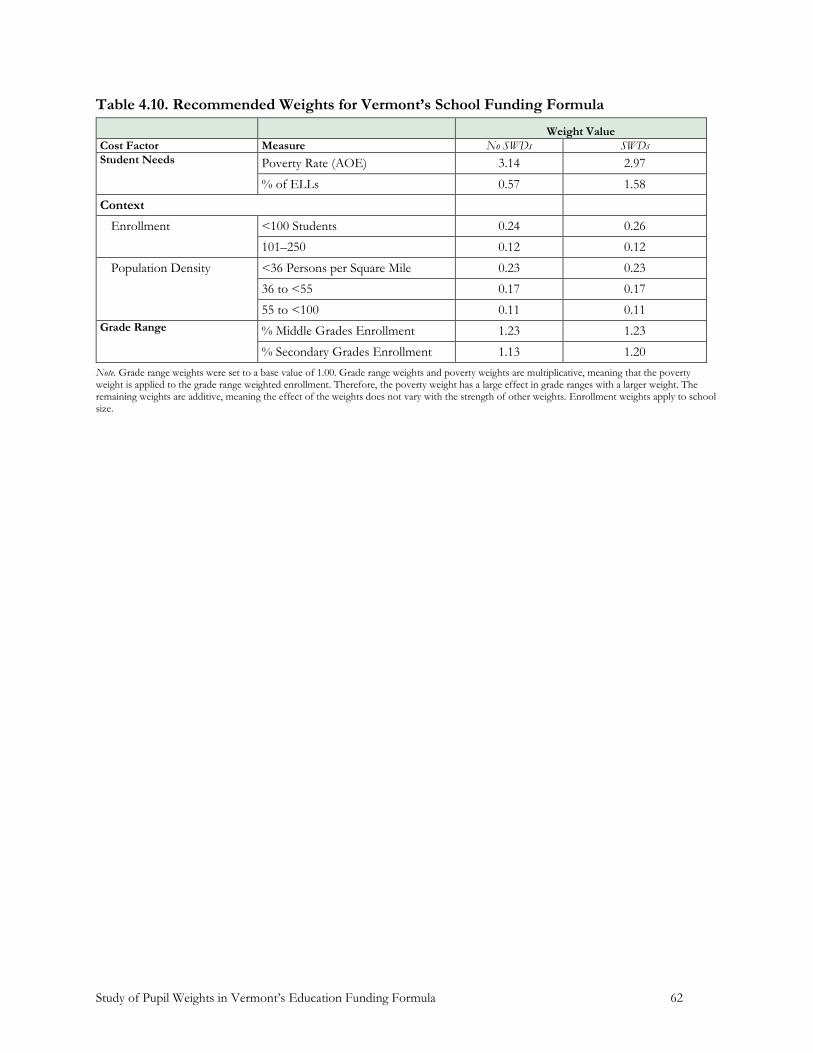
Study of Pupil Weights in Vermont’s Education Funding Formula 62
Table 4.10. Recommended Weights for Vermont’s School Funding Formula
Weight Value
Cost Factor Measure No SWDs SWDs Student Needs Poverty Rate (AOE) 3.14 2.97
% of ELLs 0.57 1.58
Context
Enrollment <100 Students 0.24 0.26
101–250 0.12 0.12
Population Density <36 Persons per Square Mile 0.23 0.23
36 to <55 0.17 0.17
55 to <100 0.11 0.11
Grade Range % Middle Grades Enrollment 1.23 1.23
% Secondary Grades Enrollment 1.13 1.20
Note. Grade range weights were set to a base value of 1.00. Grade range weights and poverty weights are multiplicative, meaning that the poverty weight is applied to the grade range weighted enrollment. Therefore, the poverty weight has a large effect in grade ranges with a larger weight. The remaining weights are additive, meaning the effect of the weights does not vary with the strength of other weights. Enrollment weights apply to school size.
Study of Pupil Weights in Vermont’s Education Funding Formula 63
V. Census-Based Special Education Block Grant
In 2018, Vermont adopted a census-based approach to providing state aid to supervisory unions for their special education programs. This new approach will replace the existing cost-reimbursement funding model and will be implemented beginning in FY2021. Since adopting the new formula, questions have been raised as to whether the formula used to calculate the census grant amount should be revised to include adjustments for differences among supervisory unions in the incidence of SWDs.
Census-based approaches to providing state aid for special education programs assume that the incidence of SWDs, and the extent of their need, is the same across districts. However, this may not be the case because of differences in the prevalence of disability in a community. To the extent that variation in the demand for services is attributable to population-based differences in the demand for services, a census-based system may result in situations where taxpayers in towns with more SWDs are responsible for a greater share of the special education costs than other towns where there is less demand for special education and related services.
The Vermont General Assembly requested a study that would evaluate whether the census grant calculations should be adjusted for supervisory unions that, in any one year, have relatively higher costs than other supervisory unions in supporting students who require additional supports (2018 Acts and Resolves No. 173, Sec. 11).
The analyses presented in this chapter respond to this request by
examining the extent to which the share of SWD varies across Vermont districts, and whether observed variation is related to systematic differences in student need;
evaluating whether state aid allocated by a census-based grant will result in systematically different levels of supplemental support to supervisory unions; and
considering two potential approaches to adjusting the census-based grant for differences in student need across supervisory unions.
Assumptions Underlying Census-Based Funding Mechanisms
Starting in FY2021, the State will allocate aid using a census-based block grant.42 Census-based funding mechanisms allocate state funding for special education on a per-capita (per-pupil) basis rather than the number or percentage of students eligible for special education.
The move away from categorical funding for special education, with strict rules that tie funding to providing services exclusively to students with individualized education programs (IEPs), is aligned with other state policy initiatives that emphasize interventions and flexible groupings among students with and without disabilities (e.g., Multi-Tiered Systems of Support [MTSS]; Kolbe, 2019). For instance, in Vermont and elsewhere, census-based mechanisms allocate supplemental funding in the form of flexible per-capita block grants that can be spent on programs that serve students with and without disabilities. In addition, census-based mechanisms are viewed as improving
42 Before FY2021, Vermont will continue to allocate state special education aid using a cost-reimbursement mechanism, where the State pays for about 60% of districts’ allowable special education expenditures.

Study of Pupil Weights in Vermont’s Education Funding Formula 64
predictability and transparency regarding state funding for special education (Dhuey & Lipscomb, 2013). However, the extent to which a census-based mechanism is an appropriate and fair approach to providing localities with supplemental funding for special education is contingent on several assumptions about the nature and extent of student need across school districts.
First, census-based funding mechanisms provide a flat grant to localities, per resident student. In Vermont, starting in FY2025, the census grant for a supervisory union will be a uniform base amount multiplied by its long-term membership (16 VSA Section 2961(d)(2)).43 However, providing a fixed amount per-capita assumes that proportion of SWDs is the same across districts. In that way, a flat grant equitably distributes funding across jurisdictions; that is, supervisory unions receive similar funding per capita for proportionally similar numbers of SWDs.
Similarly, implicit in a census-based mechanism are assumptions about special education costs across jurisdictions. To the extent that there is similar demand for special education and related services, and the cost of providing those services is equivalent, a fixed amount per capita will proportionally offset special education costs across jurisdictions. However, if the nature and extent of student need differs or the cost of providing special education varies, the local responsibility for funding special education may be larger in some jurisdictions than in others.
That either assumption underlying a census-based funding model may be violated is a legitimate concern. For instance, when studying Pennsylvania’s and New Jersey’s experiences implementing census-based funding mechanisms, Baker and Ramsey (2010) found families of children with disabilities to be nonrandomly and nonuniformly distributed across geographic spaces in those states. Earlier studies in California reached similar conclusions about the uneven distribution of disability rates across districts, particularly when it came to severe and high-cost disabilities (Parrish, Kaleba, Gerber, & McLaughlin, 1998; Parrish, Harr, Kidron, Brock, & Anand, 2003). In Vermont, the recent Study of Vermont State Funding for Special Education described an uneven distribution of SWDs across supervisory unions and districts (Kolbe & Killeen, 2017).
In Vermont and elsewhere, the unequal distribution of SWDs may be caused by local policies and preferences regarding special education eligibility and service delivery. For instance, in the Study of Vermont State Funding for Special Education, Kolbe and Killeen (2017) found that in some districts decisions to identify students for special education were influenced by the State’s cost reimbursement funding formula; identifying students was a source of additional state aid for programs serving students who were struggling (Kolbe & Killeen, 2017). The companion report by the District Management Group (2017) also found considerable variation in special education programs and practices across Vermont districts, as well as different perspectives on how and where SWDs should be educated.
43 Starting in FY2025, the uniform base amount will be equal to the average state appropriation for supplemental aid for local special education programs for FY 2018, 2019, and 2020 (16 VSA Section 2961(d)(2)). Preliminary estimates by the AOE suggest that this amount will be about $1,930 per student. For FY2021, the amount of a census grant for a supervisory union will be the average amount it received in state aid for special education for FY2017-2019. Between FY2022 and FY2024, the base amount for each supervisory union will move gradually from the FY2021 base amount to the FY2025 base amount by prorating the change between the supervisory union’s FY2021 base amount and the FY2025 uniform base amount over the three-year period.

Study of Pupil Weights in Vermont’s Education Funding Formula 65
That said, there also is a sizable research literature that suggests demographic factors outside of schools’ control contribute to differences in special education incidence and need among districts, particularly the extent of economic disadvantage experienced by students and families’ socioeconomic status (e.g., Johnson, Ohlson, & Shope, 2018; Morgan, Farkas, Hillemeier, & Maczuga, 2012; Shifrer, Muller, & Callahan, 2014; Sullivan & Bal, 2013). Poverty creates a high-risk environment that increases the probability of learning problems that lead to learning and socioemotional disabilities (e.g., National Research Council, 2002). For instance, when studying Pennsylvania’s and New Jersey’s census-based funding systems, researchers found that the incidence of high-cost and -need disabilities in a district were associated with the levels of student poverty in a district (Baker & Ramsey, 2010; Pennsylvania Department of Education, 2000).
Evaluating the Assumptions Underlying a Census-Based Funding Formula
In the following sections, we describe the extent of variation in the share of students identified with disabilities across Vermont supervisory unions and evaluate this variation in light of average levels of student poverty and economic disadvantage in communities. We then consider potential differences in the state share of supervisory unions’ total special education spending, assuming that state aid is allocated as a census grant.
Differences in the Percentage of Students with Disabilities Among Vermont Districts During the 2017–18 academic year, approximately 17% of Vermont students in Grades K–12 were identified for special education.44 However, the actual share of enrolled SWDs varied considerably across districts. Figure 5.1 depicts the distribution of Vermont districts, according to the share of enrolled SWDs. At one end of the continuum, there are districts with less than 2% of their student population identified for special education; at the other end, the special education incidence extends beyond 30%.
44 Data collected using the American Community Survey suggests that the overall rate of persons with disabilities in the U.S. population for 2016 was 12.8% (Kraus, Lauer, Coleman, & Houtenville, 2018).
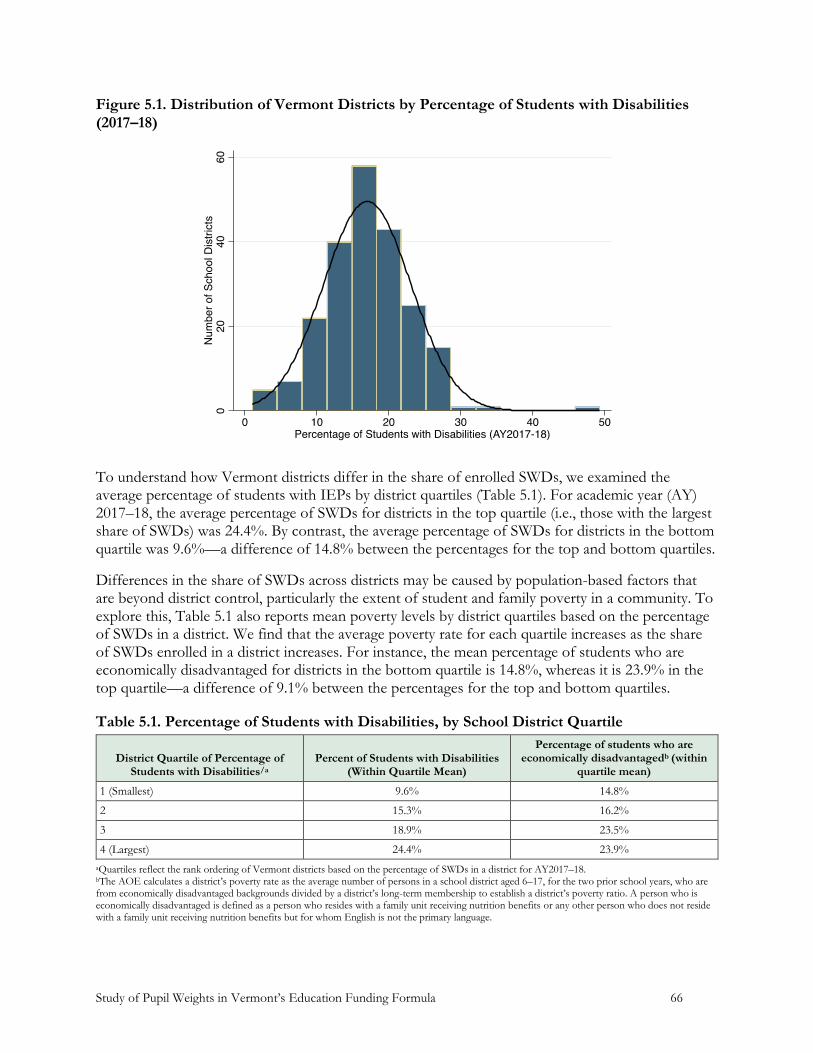
Study of Pupil Weights in Vermont’s Education Funding Formula 66
Figure 5.1. Distribution of Vermont Districts by Percentage of Students with Disabilities (2017–18)
To understand how Vermont districts differ in the share of enrolled SWDs, we examined the average percentage of students with IEPs by district quartiles (Table 5.1). For academic year (AY) 2017–18, the average percentage of SWDs for districts in the top quartile (i.e., those with the largest share of SWDs) was 24.4%. By contrast, the average percentage of SWDs for districts in the bottom quartile was 9.6%—a difference of 14.8% between the percentages for the top and bottom quartiles.
Differences in the share of SWDs across districts may be caused by population-based factors that are beyond district control, particularly the extent of student and family poverty in a community. To explore this, Table 5.1 also reports mean poverty levels by district quartiles based on the percentage of SWDs in a district. We find that the average poverty rate for each quartile increases as the share of SWDs enrolled in a district increases. For instance, the mean percentage of students who are economically disadvantaged for districts in the bottom quartile is 14.8%, whereas it is 23.9% in the top quartile—a difference of 9.1% between the percentages for the top and bottom quartiles.
Table 5.1. Percentage of Students with Disabilities, by School District Quartile
District Quartile of Percentage of Students with Disabilities/a
Percent of Students with Disabilities (Within Quartile Mean)
Percentage of students who are economically disadvantagedb (within
quartile mean)
1 (Smallest) 9.6% 14.8%
2 15.3% 16.2%
3 18.9% 23.5%
4 (Largest) 24.4% 23.9%
aQuartiles reflect the rank ordering of Vermont districts based on the percentage of SWDs in a district for AY2017–18. bThe AOE calculates a district’s poverty rate as the average number of persons in a school district aged 6–17, for the two prior school years, who are from economically disadvantaged backgrounds divided by a district’s long-term membership to establish a district’s poverty ratio. A person who is economically disadvantaged is defined as a person who resides with a family unit receiving nutrition benefits or any other person who does not reside with a family unit receiving nutrition benefits but for whom English is not the primary language.
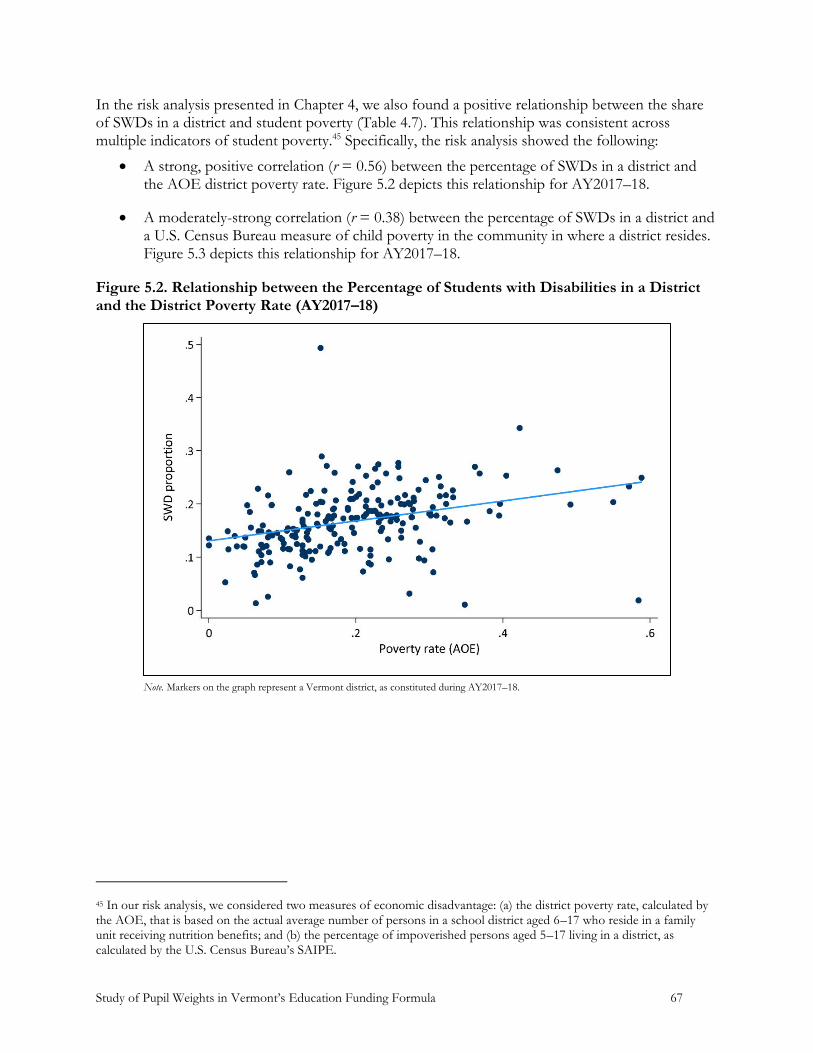
Study of Pupil Weights in Vermont’s Education Funding Formula 67
In the risk analysis presented in Chapter 4, we also found a positive relationship between the share of SWDs in a district and student poverty (Table 4.7). This relationship was consistent across multiple indicators of student poverty.45 Specifically, the risk analysis showed the following:
A strong, positive correlation (r = 0.56) between the percentage of SWDs in a district and the AOE district poverty rate. Figure 5.2 depicts this relationship for AY2017–18.
A moderately-strong correlation (r = 0.38) between the percentage of SWDs in a district and a U.S. Census Bureau measure of child poverty in the community in where a district resides. Figure 5.3 depicts this relationship for AY2017–18.
Figure 5.2. Relationship between the Percentage of Students with Disabilities in a District and the District Poverty Rate (AY2017–18)
Note. Markers on the graph represent a Vermont district, as constituted during AY2017–18.
45 In our risk analysis, we considered two measures of economic disadvantage: (a) the district poverty rate, calculated by the AOE, that is based on the actual average number of persons in a school district aged 6–17 who reside in a family unit receiving nutrition benefits; and (b) the percentage of impoverished persons aged 5–17 living in a district, as calculated by the U.S. Census Bureau’s SAIPE.
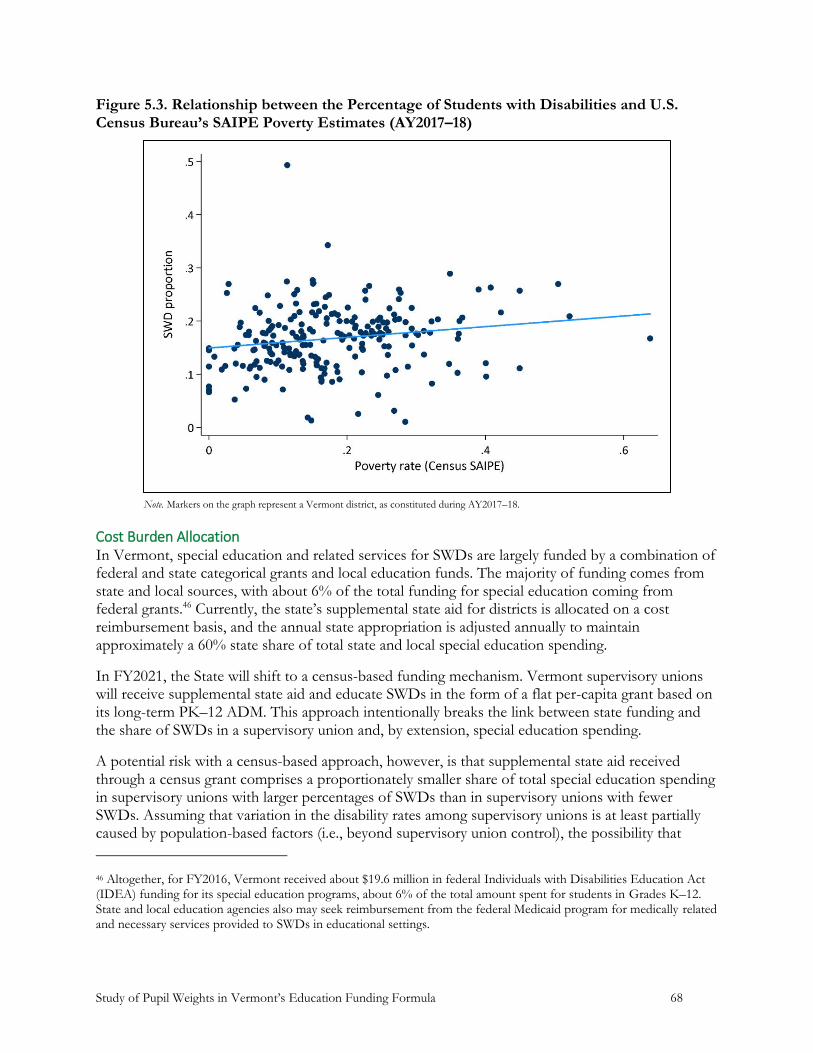
Study of Pupil Weights in Vermont’s Education Funding Formula 68
Figure 5.3. Relationship between the Percentage of Students with Disabilities and U.S. Census Bureau’s SAIPE Poverty Estimates (AY2017–18)
Note. Markers on the graph represent a Vermont district, as constituted during AY2017–18.
Cost Burden Allocation In Vermont, special education and related services for SWDs are largely funded by a combination of federal and state categorical grants and local education funds. The majority of funding comes from state and local sources, with about 6% of the total funding for special education coming from federal grants.46 Currently, the state’s supplemental state aid for districts is allocated on a cost reimbursement basis, and the annual state appropriation is adjusted annually to maintain approximately a 60% state share of total state and local special education spending.
In FY2021, the State will shift to a census-based funding mechanism. Vermont supervisory unions will receive supplemental state aid and educate SWDs in the form of a flat per-capita grant based on its long-term PK–12 ADM. This approach intentionally breaks the link between state funding and the share of SWDs in a supervisory union and, by extension, special education spending.
A potential risk with a census-based approach, however, is that supplemental state aid received through a census grant comprises a proportionately smaller share of total special education spending in supervisory unions with larger percentages of SWDs than in supervisory unions with fewer SWDs. Assuming that variation in the disability rates among supervisory unions is at least partially caused by population-based factors (i.e., beyond supervisory union control), the possibility that
46 Altogether, for FY2016, Vermont received about $19.6 million in federal Individuals with Disabilities Education Act (IDEA) funding for its special education programs, about 6% of the total amount spent for students in Grades K–12. State and local education agencies also may seek reimbursement from the federal Medicaid program for medically related and necessary services provided to SWDs in educational settings.
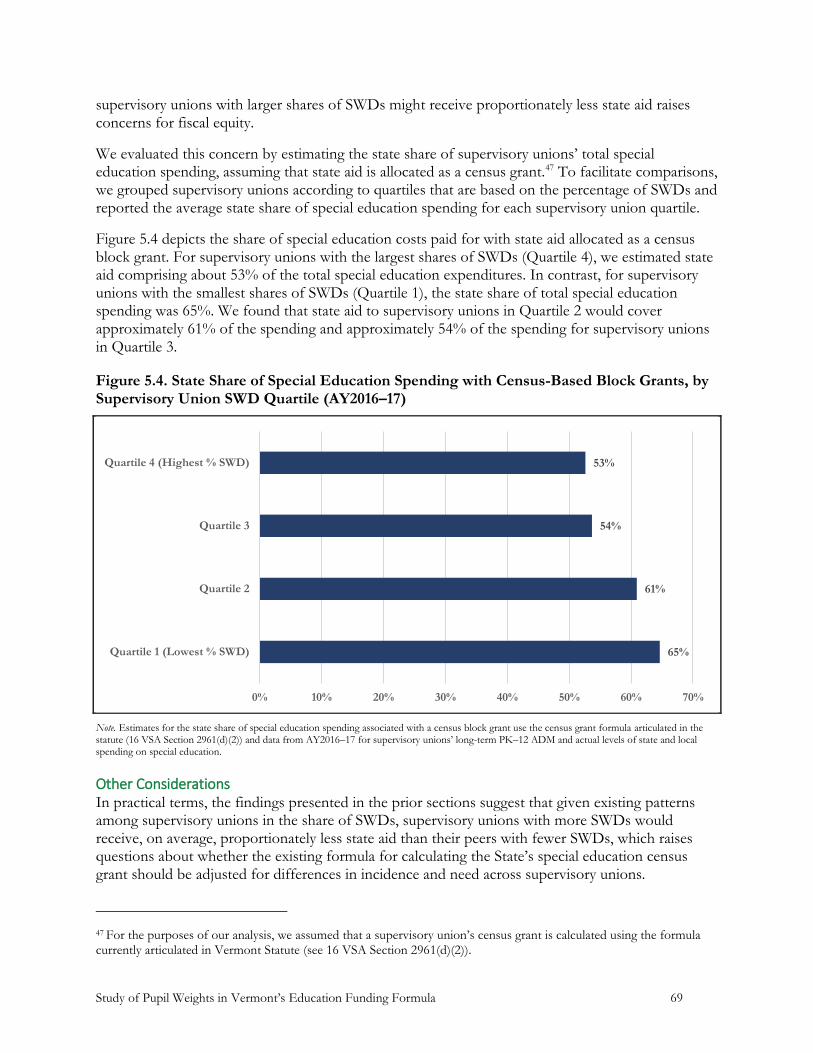
Study of Pupil Weights in Vermont’s Education Funding Formula 69
supervisory unions with larger shares of SWDs might receive proportionately less state aid raises concerns for fiscal equity.
We evaluated this concern by estimating the state share of supervisory unions’ total special education spending, assuming that state aid is allocated as a census grant.47 To facilitate comparisons, we grouped supervisory unions according to quartiles that are based on the percentage of SWDs and reported the average state share of special education spending for each supervisory union quartile.
Figure 5.4 depicts the share of special education costs paid for with state aid allocated as a census block grant. For supervisory unions with the largest shares of SWDs (Quartile 4), we estimated state aid comprising about 53% of the total special education expenditures. In contrast, for supervisory unions with the smallest shares of SWDs (Quartile 1), the state share of total special education spending was 65%. We found that state aid to supervisory unions in Quartile 2 would cover approximately 61% of the spending and approximately 54% of the spending for supervisory unions in Quartile 3.
Figure 5.4. State Share of Special Education Spending with Census-Based Block Grants, by Supervisory Union SWD Quartile (AY2016–17)
Note. Estimates for the state share of special education spending associated with a census block grant use the census grant formula articulated in the statute (16 VSA Section 2961(d)(2)) and data from AY2016–17 for supervisory unions’ long-term PK–12 ADM and actual levels of state and local spending on special education.
Other Considerations In practical terms, the findings presented in the prior sections suggest that given existing patterns among supervisory unions in the share of SWDs, supervisory unions with more SWDs would receive, on average, proportionately less state aid than their peers with fewer SWDs, which raises questions about whether the existing formula for calculating the State’s special education census grant should be adjusted for differences in incidence and need across supervisory unions.
47 For the purposes of our analysis, we assumed that a supervisory union’s census grant is calculated using the formula currently articulated in Vermont Statute (see 16 VSA Section 2961(d)(2)).
65%
61%
54%
53%
0% 10% 20% 30% 40% 50% 60% 70%
Quartile 1 (Lowest % SWD)
Quartile 2
Quartile 3
Quartile 4 (Highest % SWD)

Study of Pupil Weights in Vermont’s Education Funding Formula 70
However, policymakers should consider potential adjustments to the State’s census grant calculation in light of two related concerns. First, evidence presented in this report is descriptive and should not be taken as causal evidence that a link exists between the demand for special education and related services and student poverty. Although extant research suggests that student and family poverty is related to the prevalence of disability in the population, other policies, practices, and resources contribute to differences in incidence and demand for services across districts.
Research suggests that educators may approach identifying students for special education with inherent biases related to socioeconomic status, race/ethnicity, and gender (e.g., Elder, Figlio, Imberman, & Persico, 2019; Losen & Orfield, 2002; Macfarlane & Woolfson, 2013; Morgan & Farkas, 2016). State policies also can influence local decision making, particularly when these policies enable or constrain certain practices or provide fiscal incentives (or disincentives) for educators to identify students or provide services in certain settings. In fact, an impetus for Vermont’s change in policy was long-standing concerns about incentives for overidentification of SWDs that resulted from incentives inherent in the State’s cost-reimbursement funding formula (Kolbe & Killeen, 2017).
Second, inflating the census grant amount for differences among supervisory unions in the demand for special education services implies that an unadjusted census grant will result in localities having insufficient resources to ensure that SWDs access to appropriate special education and related services. But limited evidence exists to support this conclusion. In fact, findings presented in the Study of Vermont State Funding for Special Education found that, on average, the average additional spending (over and above what is spent on general education) was approximately $21,840 per student with an IEP. This is 1.5–2 times greater than other national and state estimates for the average excess cost per student receiving special education services.
Furthermore, the study reported that, based on national and state estimates for special education costs, the expected spending equivalent per K–12 student is between $1,547 and $3,062. Assuming that the State pays 60% of special education costs, the corresponding per-capita grant amount under a census-based funding model would be between $880 and $1,881 per student. Based on the formula articulated in current statute, the AOE estimates that the per-capita grant amount will be $1,930, which will be adjusted upward for inflation prior to implementation in FY2025.
Taken together, the State’s existing spending levels on special education coupled with current estimates for the uniform base amount that will be used to calculate supervisory unions’ census-based grant amount, suggest that state aid may be sufficient to meet student need in most Vermont supervisory unions.
Adjusting the Census-Based Special Education Grant Amount A handful of states use census grants to allocate state aid for special education programs; however, none adjust their grants for differences in incidence and student need across districts. That said, several studies recommend that states consider adjustments based on different levels of student poverty in a district (e.g., Kolbe & Killeen, 2017; Parrish et al., 1998; Parrish, 2000). The logic underlying these recommendations is that student poverty is a commonly accepted and frequently used indicator of student need in a district, one that is correlated with the prevalence of disability in the population.
Broadly, a census grant might be adjusted in two ways for differences in the level of student poverty across districts: (1) increase the uniform base amount (per-capita flat grant) for districts that serve

Study of Pupil Weights in Vermont’s Education Funding Formula 71
greater shares of students who are economically disadvantaged or (2) inflate the count of students to which the per-capita grant amount is applied.
Adjusting the Uniform Base Amount A census-based funding formula can adjust the per-capita flat grant amount that is multiplied by a district’s enrollment using multipliers that correspond to varying levels of economic disadvantage in the school-aged population. For instance, the Study of Vermont Funding for Special Education (Kolbe & Killeen, 2017) recommended that a poverty-based inflation factor be applied to the per-capita grant in a census-based funding formula.48
The adjustment factor was generated using regression models that examined the relationship between IEP incidence and student poverty for a national sample of districts. The models demonstrated a statistically significant relationship between the shares of SWDs and those eligible for FRPL in a district. This model was then rerun to predict how much higher IEP incidence might be in a high-poverty Vermont district, compared with one with an average share of SWDs.
Specifically, the study used the estimated regression equation to predict how much higher IEP incidence would be in a high FRPL district in Vermont (with FRPL equal to 98%) compared with a district with more typical FRPL incidence (at the state average of 41%).49 The calculations showed that the difference in district incidence of FRPL from 41% to 98% is associated with a 2.4 percentage point increase in IEP incidence.
The study then modeled the effect of directing additional funding to Vermont supervisory unions that were at or above the 75th percentile (statewide) for the percentage of students from low-income families, which is equivalent to at least 50% of the students eligible to participate in the FRPL program. Specifically, the models assumed that for supervisory unions above this threshold, the census grant amount would be calculated using the inflated per-capita amount, whereas the census grant for supervisory unions below this threshold would be calculated using the unadjusted per-capita flat grant amount.
This approach met with criticism on the part of policymakers and other stakeholder groups. Specifically, there were concerns that the approach created an arbitrary “cliff” above or below which a supervisory union would qualify for the poverty-adjusted per-capita grant. Alternatively, there was little agreement on how this might be implemented using a sliding scale that corresponded to different levels of poverty in a supervisory union (i.e., no empirical evidence suggested what the inflation factor should be for different thresholds of economic disadvantage in a supervisory union). In addition, policymakers felt that this approach might introduce unpredictability into supervisory union budgets; local educators would not necessarily know year-to-year where the supervisory union ranked (statewide) with respect to the share of students who are economically disadvantaged.
Adjustments to Uniform Base Amount An alternative approach to adjusting the census grant amount for differences in student need is to adjust the number of pupils to which the per-capita amount is applied. That is, rather than calculating a supervisory union’s census grant based on the long-term PK–12 ADM, the grant is
48 See Appendix D in Kolbe and Killeen (2017) for a detailed description of the models and estimation methods. 49 For these predictions, all other continuous variables were held constant (e.g., overall disability incidence and student density).
Study of Pupil Weights in Vermont’s Education Funding Formula 72
calculated on a weighted pupil count that implicitly accounts for differences in student need across districts.
For instance, in Vermont, a supervisory union’s PK–12 ADM is already adjusted for differences in student need using weights that correspond to a district’s poverty rate, and the uniform base amount (as defined in existing statute) could be multiplied by a poverty-weighted PK–12 ADM. This approach to adjusting the census grant preserves the predictability and transparency inherent in a census-based funding model. The census grant calculation is aligned with cost factors and pupil weights incorporated in the general education funding formula. Supervisory unions can easily calculate a weighted student count and apply the per-capita flat grant amount to estimate the amount of supplemental state aid they can expect to receive.
That said, this approach assumes that the pupil weighting factors will generate sufficient additional revenue for supervisory unions with higher levels of need. Although there is no way to empirically test this assumption, in Chapter 6, we present five simulations that show the impact using the poverty-weighted student count and equalized pupil counts when calculating a supervisory union’s census grant amount.
Summary
Whether a census-based funding mechanism is an appropriate and fair approach to providing localities with supplemental funding for special education is contingent on (1) the proportion of SWDs being roughly the same across supervisory unions, and (2) the nature and extent of student need and the cost of providing special education services are similar across jurisdictions.
The share of enrolled SWDs varied considerably across districts, with some districts having less than 2% of their student population identified for special education and others with more than 30%.
Variability in the share of SWDs across districts, is related to a district’s poverty rate. Districts with proportionately larger shares of students who are economically disadvantaged also, on average, have larger shares of students with IEPs.
Assuming that the existing formula for calculating the census grant amount (starting in FY2021), we found that state aid for special education will comprise a proportionately smaller share of total special education spending in supervisory unions with larger percentages of SWDs than in supervisory unions with fewer SWDs.
Differences among supervisory unions in the share of SWDs raise questions about whether the census grant should be adjusted for differences in incidence and need across supervisory unions.
An alternative approach to calculating the census grant amount for differences in student need is to inflate the number of pupils to which the per-capita amount is applied. That is, rather than calculating a supervisory union’s census grant based on the long-term PK–12 ADM, the grant is calculated on a weighted pupil count that implicitly accounts for differences in student need across jurisdictions.

Study of Pupil Weights in Vermont’s Education Funding Formula 73
Possible adjustments to the census grant should be considered in light of other policy objectives, particularly the intent to provide districts with new flexibility in using funding to strengthen early intervening services for students who are struggling and incentives to revamp special education service delivery models. Across time, such changes to local policies and practices may result in fewer students identified for special education and, as a result, less concern about sufficiency and fairness in state special education funding.

Study of Pupil Weights in Vermont’s Education Funding Formula 74
VI. Funding Model Simulation
In this chapter, we simulate how the cost factors and weights derived from our empirical analysis might be integrated into Vermont’s existing school funding formula. We consider two scenarios that apply the weights derived from our cost function models. We also describe three approaches that can be used to adjust the census-based special education block grant to account for differences in special education costs across districts.
Integrating Recommendations
Incorporating new cost factors and weights into Vermont’s school funding formula will require revisions to how the State calculates a school district’s weighted long-term PK12 ADM and supervisory unions’ special education census block grant amount. The simulations model how these changes will impact local districts’ tax rates (assuming current enrollment and spending levels) and the amount of supplemental state aid that a district receives for special education.
Calculating Weighted Long-Term PK–12 ADM Vermont’s school funding formula uses pupil weights to calculate a weighted long-term PK–12 ADM for each district. Figure 6.1 describes how this calculation was revised for the purposes of our simulations. Specifically, we assume the following changes.
Age and Grade-Level Weights. The method used to calculate a district’s weighted long-term membership was revised to include separate grade-level weights for middle-level students (Grades 6–8) and secondary students (Grades 9–12; Table 6.1, Step 2).50 The weight for prekindergarten students remained unchanged from the current statute (i.e., 0.46).
Population Density Adjustment. The simulations apply a population density weight to a district’s weighted long-term membership (Table 6.1, Step 3). Districts are eligible for this adjustment if they are in geographic areas with less than 100 persons per square mile. Our simulations adjust a district’s long-term PK–12 membership using three gradients of population density by applying an additive weight: (1) <36 persons per square mile, (2) 36 to <55 persons, and (3) 55 to <100 persons.
Small Schools Adjustment. A district’s weighted long-term membership is also adjusted for the additional cost of operating small schools in geographically isolated areas of the State (Table 6.1, Step 3). The simulations apply a school size weight to the long-term membership of a school when a district is in a sparsely populated geographic area (i.e., schools with an ADM of less than 250 students and in a district with less than 55 persons per square mile). Appendix B lists the schools that qualified for this adjustment, based on FY2018 enrollment.
Economically Disadvantaged Student Weight. In Chapter 4, we recommended that the weight used to adjust for the number of students who are economically disadvantaged be
50 Grade range weights are considered multipliers to school districts’ long-term membership. By contrast, however, other weights included in the calculations are additive (e.g., geographic cost adjustments). Additive weights result in a fraction of pupils that are subsequently added back to a district’s weighted long-term membership – i.e., they are not multipliers applied to weighted long-term membership. This distinction between multiplicative and additive weights reflects how Vermont currently calculates school districts’ long-term weighted PK12 ADM and impacts how the weights are interpreted (e.g., whether the weights are centered on 1 or 0).

Study of Pupil Weights in Vermont’s Education Funding Formula 75
increased. Our simulations used the recommended weights to calculate a district’s poverty rate, which was then used to calculate a district’s poverty-weighted student count (Table 6.1, Steps 4 and 5).
ELL Student Weight. Similarly, our estimations suggested that the weight used to adjust for the number of ELLs in a district should be increased. Our simulations used the recommended weights to calculate a district’s ELL-weighted student count (Table 6.1, Step 6).
Adjusting for Differences in Special Education Costs The simulations make different assumptions about how policymakers might adjust for differences in the share of SWDs across Vermont districts.51 Specifically, we simulate three options that revise how a supervisory union’s census grant is calculated.
Option 1. Multiply the unified base amount by a district’s equalized pupil count.
Option 2. Multiply the unified base amount by a district’s poverty-adjusted weighted long-term membership.
Option 3. Calculate a district’s long-term weighted PK–12 ADM using weights derived from estimation models that do not control for the share of students receiving special education services in a district.
The first option responds to a theme that emerged from our stakeholder interviews: special education costs vary across districts for a variety of reasons, including differences in the share of students who are economically disadvantaged and ELLs, plus economies of scale in providing special education and related services in larger versus smaller districts and those that are in more and less sparsely populated areas. Calculating the census grant using the number of equalized pupils in a district, versus a district’s long-term PK–12 ADM, implicitly adjusts the census grant for a broad range of cost factors that impact both the incidence of SWDs, as well as service delivery costs across districts.
Option 2 restricts the adjustment made in Option 1 to consider differences in the poverty rate across districts. Here, the assumption is that differences in special education incidence and need are strongly and primarily related to cross-district variation in the share of students who are economically disadvantaged.
The third option does not change how the special education census grant is calculated. Rather, a district’s long-term weighted PK–12 ADM is calculated using weights derived from estimation models that do not control for the share of students receiving special education services in a district. This approach effectively adjusts a district’s equalized pupil count for differences in special education costs and, by extension, the local tax capacity to pay for higher levels of spending for SWDs.
51 See Chapter 5 for a discussion of the logic underlying a potential adjustment to the state’s special education census grant calculation.

Study of Pupil Weights in Vermont’s Education Funding Formula 76
Figure 6.1. Assumptions for Calculating Long-Term Weighted PK–12 ADM Used in Model Simulations
Step Formula Component Description of Changes Calculation
Step 1 Calculate long-term membership (16 VSA § 4010(a) & (b))
No change Long-term membership =
[(PK 12 ADM2017 + PK12 ADM2018)/2] + number state-placed students2017
Step 2 Calculate weighted long-term membership (16 VSA § 4010(c))
The calculation for weighted long-term membership is revised to incorporate new weights for middle and secondary school students. Specifically, long-term membership is adjusted for the following grade range factors:
– Prekindergarten (0.46; unchanged from existing statute)
– Elementary and kindergarten (1.0; unchanged from existing statute)
– Middle school students (new MIDWT, depending on cost function estimation)
– Secondary students (revised SECWT, depending on cost function estimation)
• The PK weight is applied to the actual average number of resident prekindergarten students in a district (as defined by 16 VSA §4001 (1)(B) during the two most recent school years).
• MIDWT is applied to the actual average number of students in Grades 6–8 during the two most recent school years. SECWT is the two-year average, for the prior school years, for count of students in Grades 9–12.
Weighted long-term membership = district long-term membership + {[(PK Students2017+PK Students2018)/2] * 0.46} + {[(MID Students2017+MID Students2018)/2] * MIDWT} + {[(SEC Students2017+SEC Students2018)/2] * SECWT}
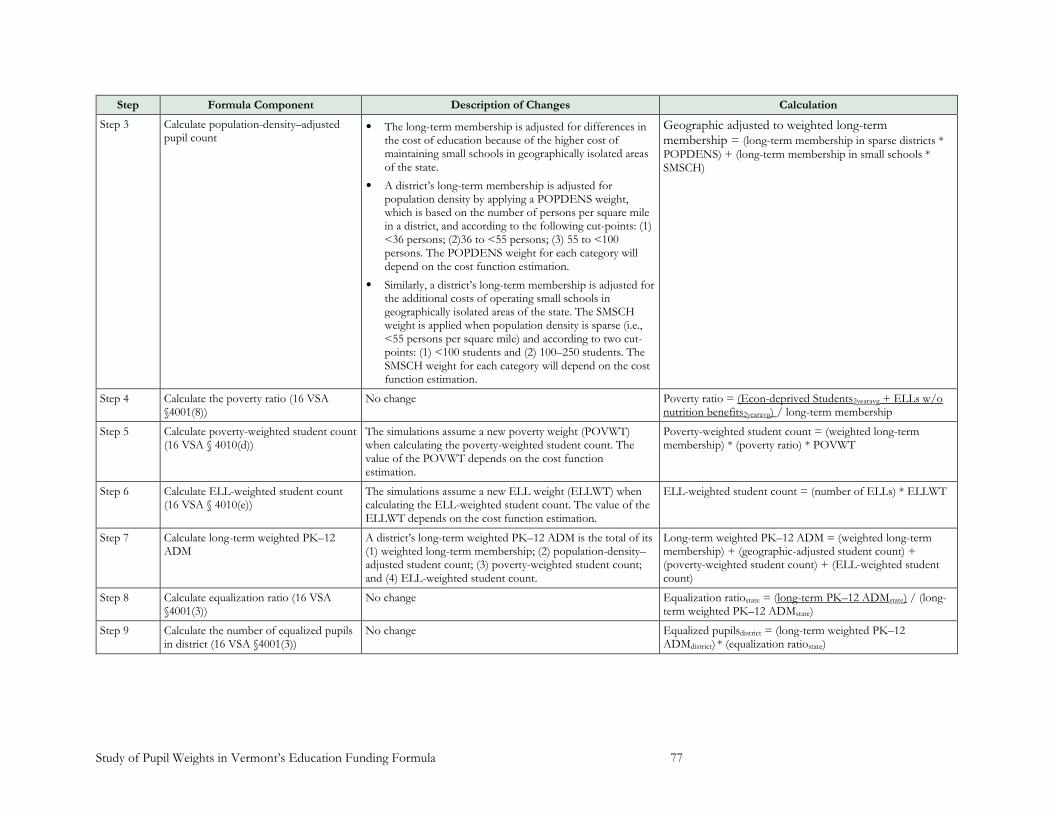
Study of Pupil Weights in Vermont’s Education Funding Formula 77
Step Formula Component Description of Changes Calculation
Step 3 Calculate population-density–adjusted pupil count
• The long-term membership is adjusted for differences in the cost of education because of the higher cost of maintaining small schools in geographically isolated areas of the state.
• A district’s long-term membership is adjusted for population density by applying a POPDENS weight, which is based on the number of persons per square mile in a district, and according to the following cut-points: (1) <36 persons; (2)36 to <55 persons; (3) 55 to <100 persons. The POPDENS weight for each category will depend on the cost function estimation.
• Similarly, a district’s long-term membership is adjusted for the additional costs of operating small schools in geographically isolated areas of the state. The SMSCH weight is applied when population density is sparse (i.e., <55 persons per square mile) and according to two cut-points: (1) <100 students and (2) 100–250 students. The SMSCH weight for each category will depend on the cost function estimation.
Geographic adjusted to weighted long-term membership = (long-term membership in sparse districts *
POPDENS) + (long-term membership in small schools * SMSCH)
Step 4 Calculate the poverty ratio (16 VSA §4001(8))
No change Poverty ratio = (Econ-deprived Students2yearavg + ELLs w/o nutrition benefits2yearavg) / long-term membership
Step 5 Calculate poverty-weighted student count (16 VSA § 4010(d))
The simulations assume a new poverty weight (POVWT) when calculating the poverty-weighted student count. The value of the POVWT depends on the cost function estimation.
Poverty-weighted student count = (weighted long-term membership) * (poverty ratio) * POVWT
Step 6 Calculate ELL-weighted student count (16 VSA § 4010(e))
The simulations assume a new ELL weight (ELLWT) when calculating the ELL-weighted student count. The value of the ELLWT depends on the cost function estimation.
ELL-weighted student count = (number of ELLs) * ELLWT
Step 7 Calculate long-term weighted PK–12 ADM
A district’s long-term weighted PK–12 ADM is the total of its (1) weighted long-term membership; (2) population-density– adjusted student count; (3) poverty-weighted student count; and (4) ELL-weighted student count.
Long-term weighted PK–12 ADM = (weighted long-term membership) + (geographic-adjusted student count) + (poverty-weighted student count) + (ELL-weighted student count)
Step 8 Calculate equalization ratio (16 VSA §4001(3))
No change Equalization ratiostate = (long-term PK–12 ADMstate) / (long-term weighted PK–12 ADMstate)
Step 9 Calculate the number of equalized pupils in district (16 VSA §4001(3))
No change Equalized pupilsdistrict = (long-term weighted PK–12 ADMdistrict) * (equalization ratiostate)

Study of Pupil Weights in Vermont’s Education Funding Formula 78
Simulation Models
We report findings for two sets of simulations: (1) simulations that model the impact of applying the weights derived from our empirical models and (2) options for revising the approach used to calculate districts’ special education census block grant (Table 6.2).
Applying Alternative Cost Factors and Weights The first set of simulations model two scenarios that apply the weights derived from our empirical models. The first scenario applies weights estimated using models without controls for the share of students receiving special education services in a school. The second scenario applies weights from models that do not include controls for the percentage of SWDs.
Appendices C-F provide district-level estimates for changes to equalized pupil counts and homestead property tax rates for each scenario.
Scenario A: Apply Weights Estimated Using Models Without Controls for Special Education The first scenario assumes the cost factors and weights derived from the estimation models do not include controls for the share of SWDs in a school. We simulated two examples for the recommended weights:
Simulation A.1. Uses the Vermont-specific school-level weights derived from estimation models without controls for the share of SWDs (Appendix C).
Simulation A.2. Substitutes the ELL weight derived from the regional model. The weights for the other cost factors are unchanged from what was applied in Simulation A.1 (Appendix E).
Adopting weights derived from estimation models without controls for special education effectively adjusts a district’s equalized pupil count for differences in special education costs by inflating a district’s equalized pupil count by weights that have absorbed some of the variation associated with differences in special education costs across districts or schools. Accordingly, in both examples, there is no need to revise the existing approach to calculating a district’s special education census grant (Table 6.2).52
Scenario B: Apply Weights Estimated Using Models Without Controls for Special Education The second scenario assumes the cost factors and weights derived from the estimation models do include controls for the share of SWDs in a school. We simulated two examples for the recommended weights:
Simulation B.1. Uses the Vermont-specific school-level weights derived from estimation models with controls for the share of SWDs (Appendix D).
Simulation B.2. Substitutes the ELL weight derived from the regional model. The weights for the other cost factors are unchanged from what was applied in Simulation B.1 (Appendix F).
52 Simulations A.1 and A.2 implement Option 3 for adjusting for differences in special education costs across school districts.

Study of Pupil Weights in Vermont’s Education Funding Formula 79
Neither Scenario B.1 nor B.2 includes explicit or implicit cost adjustments for differences in special education costs across districts. Instead, for Scenarios B.1 and B.2, adjusting for special education cost differences requires changes to how a district’s special education census grant is calculated (Table 6.2).

Study of Pupil Weights in Vermont’s Education Funding Formula 80
Table 6.2. Scenarios for Applying Alternative Cost Factors and Weights
Scenario A
Apply Weights Estimated Using Models Without Controls for Special Education
Scenario B
Apply Weights Estimated Using Models With Controls for Special Education
Existing Weightsa
Simulation A.1 (VT Estimation)
Simulation A.2 (Substitute Regional
ELL Weight)
Simulation B.1 (VT Estimation)
Simulation B.2 (Substitute Regional
ELL Weight)
Student Needs
Economically Disadvantaged Student Count 0.25 3.14 3.14 2.97 2.97
ELL Student Count 0.20 0.57 1.33 1.58 1.27
Other Cost Factors
Grade Range
% of Students Enrolled in Grades 6–8 1.23 1.23 1.23 1.23
% of Students Enrolled in Grades 9–12 1.13 1.13 1.13 1.20 1.20
Population Density
<36 persons per square mile .23 .23 .23 .23
36–54 persons per square mile .17 .17 .17 .17
55–100 persons per square mile .11 .11 .11 .11
School Sizeb (conditional on population density)
<100 students .24 .24 .26 .26
101–250 students .12 .12 .12 .12
Prekindergarten Student Countc 0.46 0.46 0.46 0.46 0.46
Adjustments to Special Education Census Grant No adjustment to census grant. Adjustments for special education cost are reflected in a district’s equalized pupil
calculation.
Revise census grant calculation. Change the number of pupils used in the calculation to either (1) the number of equalized pupils (Option 1) or (2) the number of poverty-weighted pupils (Option 2).
aGrade range weights are centered on 1; all other weights are centered on 0. bSchool size weight is applied only when the population density is <55 persons per square mile and when the number of students in a district who attend a school with ≤250 students in a given academic year. cSimulations assume no change to the existing weight used for prekindergarten students (see 16 VSA § 4010(c)).

Study of Pupil Weights in Vermont’s Education Funding Formula 81
Modifying the Special Education Census Grant Calculation The second set of simulations model potential changes to how the State intends to calculate a supervisory union’s special education census grant.
Modifying the formula to account for differences in special education costs across districts is appropriate if
there is no change to the existing formula for calculating a district’s equalized pupil count; or
new weights are selected, they are derived from estimation models that include controls for the share of students receiving special education services in a district or school.
In our simulations, we first estimate a district’s census grant amount, assuming no change to the calculation method currently articulated in statute (see 16 VSA § 2961). We then simulate how this grant amount would change if the calculation method was modified according to the two options discussed earlier (Table 6.3). For Option 1, we calculated the grant amount using a school district’s equalized pupil count, and for Option 2, we calculated the grant using a district’s poverty-adjusted weighted long-term membership.
The assumptions used in our simulations are described after Table 6.3. Appendix G reports the simulated census grant amounts for each school district.
Table 6.3. Simulation Scenarios for Revising Special Education Census Grant Calculation
Simulation Scenarios Student Count Uniform Base Amount
Status Quo FY2018 PK–12 ADM $1,930 per capitaa
Option 1 Equalized Pupil Count $1,930 per capita
Option 2 Poverty-Weighted Pupil Count $1,156b
aAOE’s estimate for the uniform base amount, based on special education spending for FY2017–2019 and FY2018 PK–12 ADM. We used this estimate as a proxy in our simulations. The final calculation for the uniform block grant will be based on a three-year average (FY2018–2020) of state special education appropriations. bFor total state special education appropriations to remain unchanged from what is anticipated by current law, the denominator used when calculating the uniform base amount is modified to be the number of poverty-weighted pupils (not PK–12 ADM).
Status Quo Model Existing policy stipulates that starting in FY2025, Vermont supervisory unions will receive a special education census grant equivalent to the following: 53
Census grantsupervisory union = uniform base amount × long-term membershipsupervisory union
The uniform base amount is a per-pupil flat grant, calculated as follows:
53 The new funding model will be phased in over four years (FY2020–2024). During this phase-in period, a supervisory union’s block grant amount will be based on a historical three-year average of its own special education spending. Specifically, for FY2021 the amount of the census grant for a supervisory union will be the average amount of state aid received for special education for FY2017–2019, divided by a supervisory union’s long-term membership. For FY2022– 2024, the grant amount will be adjusted “gradually” by AOE by prorating the change between the supervisory union’s FY2021 base amount and the uniform base amount calculated for FY2025 (16 VSA § 2961).

Study of Pupil Weights in Vermont’s Education Funding Formula 82
Uniform base amount = (average for statewide special education spending for FY2017–2020) / FY2020 PK–12 ADM
AOE estimates that the uniform base amount will be approximately $1,930 per pupil.54 As a baseline for comparison in our simulations, we multiplied the estimated uniform base amount times each district’s FY2018 PK–12 ADM, which approximates what a supervisory union’s census grant will be assuming no change to current statute.
Option 1: Multiply the Unified Base Amount by a District’s Equalized Pupil Count Option 1 assumes that the uniform base amount is multiplied by the number of equalized pupils in a district versus its long-term membership (as stipulated by current statute). The simulations assume three different equalized pupil counts:
Option 1.1. The actual FY2018 number of equalized pupils in a district, as derived from the State’s existing funding formula.
Option 1.2. The estimated number of equalized pupils in a district, per Simulation B.1, which reflects the new cost factors and weights recommended by our estimation models.
Option 1.3. The estimated number of equalized pupils in a school district, per Simulation B.2, which reflects substitutes the regional ELL weight into the calculation.
Option 2: Multiply the Unified Base Amount by a District’s Poverty-Weighted Pupil Count Option 2 assumes that the uniform base amount is multiplied by the number of poverty-weighted pupils in a district. The number of poverty-weighted pupils is calculated as follows:
Poverty-weighted student countdistrict = (weighted long-term membershipdistrict) * (poverty ratiodistrict) * (economic disadvantage weight)
We used 2.97 as the weight for students who are economically disadvantaged (Table 6.2).
The decision to allocate the census grant according to a district’s poverty-weighted student count necessarily changes the statewide count of students used to calculate the uniform base amount. The poverty-weighted student count is not deflated, as is the case with the number of equalized pupils, to the statewide PK–12 ADM in a given year. As a result, the statewide count for poverty-weighted pupils will be greater than the PK–12 ADM. Accordingly, for total state special education appropriations to remain unchanged from the level anticipated by current law, the denominator used when calculating the uniform base amount is modified to be the number of poverty-weighted pupils (not PK–12 ADM):
Uniform base amountpovertyweighted = (three-year average for statewide special education spending (FY2017–2019) / statewide poverty-weighted student count (FY2018)55
54 AOE’s estimate is based on special education spending for FY2017–2019 and the FY2018 PK–12 ADM. We used this estimate as a proxy in our simulations. 55 For consistency, we used the estimated number of poverty-weighted pupils for FY2018. It is important to note, however, that for FY2025 the actual number of poverty-weighted pupils statewide will depend on (1) the State’s approach to pupil weighting and (2) statewide PK–12 long-term membership. Accordingly, the census grant amount used in Option 2 is a proxy for what the uniform base amount would be given current assumptions.

Study of Pupil Weights in Vermont’s Education Funding Formula 83
Based on the estimates for a district’s FY2018 poverty-weighted student counts, we calculated a revised census-based block grant amount of approximately $1,156 per pupil. For Simulation Option 2, we multiplied this grant amount by a district’s estimated number of poverty-weighted pupils for FY2018.
Summary
Alternative Cost Factors and Weights
We simulated two scenarios to demonstrate how the weights recommended by our estimation models might be incorporated into the state’s school funding formula and the resulting impact on districts’ equalized pupil count and, by extension, homestead property tax rates.
The key distinction between the two scenarios is whether the weights for the cost factors incorporated in the formula account for potential cross-district differences in special education incidence and need (Scenario 1) or are independent of this variation (Scenario 2).
Scenario 1 introduced a new implicit assumption about how the state and local districts pay for special education—specifically, that some portion of the local share of special education costs will be shared by all Vermont districts using revenues from the Education Fund.
Scenario 2 applied the weight recommended by the estimation models, without making assumptions about or adjustments for differences in special education costs across Vermont districts.
Special Education Census Grant
We simulated two options for revising the approach used to calculate supervisory unions’ special education census grant amount. Option 1 assumed that the uniform base amount is multiplied by the number of equalized pupils in a district, whereas Option 2 calculated the grant based on the number of poverty-weighted pupils in a district.
Option 1 will result in a larger census grant amount for districts with higher overall educational costs (i.e., more equalized pupils). Option 2 will result in a larger census grant amount for districts with a higher poverty rate.

Study of Pupil Weights in Vermont’s Education Funding Formula 84
VII. Conclusion
Vermont’s approach to adjusting for differences in educational costs across school districts has remained relatively unchanged for the past 20 years. For the most part, the existing approach to pupil weighting predates the passage of Act 60 in 1997. Likewise, the state’s categorical grant programs for providing state aid for small schools and transportation aid have also not changed.
Stagnation in the State’s education funding policies has been a source of concern. Existing policies are widely viewed as outdated and falling short of equalizing educational costs across school districts and, by extension, opportunities to learn for students across the state. The manner in which the state currently calculates the number of equalized pupils in a school district has been criticized for being out of step with contemporary educational conditions. Student need and other factors that impact the cost of education have changed over time – and yet, the manner in which the funding formula weights pupils has remain unchanged.
Moreover, existing funding programs fail to recognize significant shifts in the State’s educational policies and practices. Vermont’s “Act 46,”, which encourages, and in some instances, requires school districts to consolidate into larger units, has created both opportunities and challenges for the state’s existing school funding mechanisms. In particular, the structure and operations of the Small Schools grant program is poorly aligned with the governance reforms articulated by Act 46. Policies such as the Flexible Pathways Initiative, including ECP, pose new challenges for how the state counts the number of students for which a district is responsible.
Findings from this study suggest that it is time to incorporate new cost factors and weights into Vermont’s education funding formula. The empirical analyses undertaken for this study identify a more comprehensive set of factors that are related to differences in educational costs across school districts, specifically:
1) Percentage of students who are economically disadvantaged
2) Percentage of students who are ELL
3) Percentage of students who are enrolled in the middle- and secondary-grades
4) Indicators for geographically-necessary small schools
5) Population density of the community in which a district is located
Using national, regional, and state data, weights were derived for each cost factor. These weights reflect the actual level of additional spending required to ensure students with different learning needs and schools in varying educational contexts are able to provide similar educational opportunities. In other words, the recommended weights represent the best-available evidence about the cost differentials in educating Vermont students with disparate learning needs in different locations.
Recommended weights for the share of economically-disadvantaged and ELL students in a district are significantly different from those incorporated in current statute. Such differences between current and recommended weights are not entirely surprising. The existing weights predate the passage of Act 60 and had weak, at best, connections to evidence about the additional costs of educating students with disparate learning needs.

Study of Pupil Weights in Vermont’s Education Funding Formula 85
Our findings also reaffirm that cost differentials exist across grade levels and according to where a district is located. While the state’s existing formula includes a weight for secondary-level students (defined as grades 7-12), we recommend splitting this factor into two distinct weights – one for middle-grades students (grades 6-8) and another for secondary-level students (grades 9-12).
We also find clear evidence that districts located in Vermont’s most sparsely populated areas must spend more to provide similar educational opportunities as those found in districts located in more populated areas of the state. We recommend new weights for districts located in rural areas, according to the population density of the community in which a district is located.
Adopting new cost factors and weights, however, may not go far enough to address limitations in how a district’s equalized pupil count is generated. Despite the fact that school districts continue to provide services and supports to students who participate in ECP, these students are excluded from a district’s long-term membership count. There was support for counting ECP students in a district’s weighted long-term membership as a fraction of a full FTE student as opposed to the existing practice of not including them at all.
Stakeholders statewide called for a new approach to adjusting for differences in costs due to limited economies of scale in small schools. The existing Small Schools grant program was widely criticized for working against other policy priorities, particularly those articulated in Act 46. There was a broad base of support to abolish the Small Schools grant program and, instead, to include adjustments for small schools in the equalized pupil calculation. However, a small school weight must be conditioned on the population density of the district in which the school is located. There was agreement that the state should adjust for differences in costs for operating schools that are small, out of geographic necessity, but not local preference. The recommendations for how new weights for small schools and population density might be structured are grounded in the national scan of other states’ policies and results from our empirical analyses.
The simulations presented in this report show the likely impact of changes to the cost factors and weights used in the equalized pupil calculation. What is clear across all models is that any change will impact all communities – that is, assuming FY2018 budgeted spending, for some districts changes to the calculation may cause tax rates to increase, and for others, the rates would decrease. The shift in tax burden among districts is inherent in Vermont’s funding formula, and central to the state’s efforts to break the link between local property tax wealth and education spending. A weakness in the current design, however, is the absence of a clear link between cost adjustments in the funding formula and local decision making. There was a general concern among stakeholders that efforts to update the equalized pupil calculation to better reflect differences in educational costs may not translate to increased levels of spending in districts with higher need. Instead, the additional tax capacity generated by a higher equalized pupil count may be seen as an opportunity to reduce taxes rather than increase spending.
A key task for this study was to consider whether changes should be made to how the state intends to calculate the special education census grant. At issue is whether the census grant amount should reflect differences in student need across districts. In our interviews with stakeholders, we found a mix of perspectives on whether revisions were necessary. Reactions ranged from no concern to significant concern, and still others thought that it was too soon to determine whether changes should be made. If there are adjustments, there was a strong preference among stakeholders to change how the number of pupils in a supervisory union are counted as opposed to adjusting the unified base amount (i.e., per capita grant) for a district’s poverty rate. Our simulations consider several options for how census grants might be modified.

Study of Pupil Weights in Vermont’s Education Funding Formula 86
The study’s findings also describe an emergent condition facing Vermont school districts. What became clear in our interviews with stakeholders is that school districts statewide are struggling to provide appropriate services and supports for students with critical mental health issues and who have experienced childhood trauma. The cost of serving students with complex needs is a significant burden in many school districts, especially those that are located in rural communities that have been most affected by the opioid crisis. Additional financial and programmatic support, in the form of targeted and specific categorical funding, coupled with technical assistance, is a potential policy response to this growing need.
Study of Pupil Weights in Vermont’s Education Funding Formula 87
References
Andrews, M., Duncombe, W., & Yinger, J. (2002). Revisiting economies of size in American education: are we any closer to a consensus? Economics of Education Review, 21(3), pp. 245-62.
Augenblick, Palaich & Associates, Education Commission of the States, & Picus Odden & Associates. (2018) Nevada school finance study. Denver, CO: APA Consulting. Retrieved from https://www.leg.state.nv.us/App/InterimCommittee/REL/Document/12828
Baker, B.; Ramsey, M. (2010). What We Don't Know Can't Hurt Us? Equity Consequences of Financing Special Education on the Untested Assumption of Uniform Needs. Journal of Education Finance, 35(3), pp.245-75.
Baker, B.D., Di Carlo, M., Srikanth, A., Weber, M.A. (2019). Rutgers Graduate School of Education/Albert Shanker Institute: School Finance Indicators Database. Retrieved from: http://www.schoolfinancedata.org.
Baker, B.D. (2018). Education inequality and school finance: Why money matters. Cambridge, MA: Harvard Education Press.
Baker, B.D. (2008). Doing more harm than good? A commentary on the politics of cost adjustments for wage variation in state school finance formulas. Journal of Education Finance, 33(4), pp. 406-440.
Baker, B. D. (2005). The emerging shape of educational adequacy: From theoretical assumptions to empirical evidence. Journal of Education Finance, 30(3), 259-287.
Chambers, J. G. (1995). Public school teacher cost differences across the united states: Introduction to a teacher cost index (TCI). Developments in school finance, 19-32.
Connecticut School Finance Project. (2016). Improving how Connecticut funds special education. Retrieved from http://ctschoolfinance.org/assets/uploads/files/Improving-How-CT-Funds-Special-Education-FINAL.pdf
Dhuey, E. & Lipscomb, S. (2013). “Funding special education by total district enrollment: Advantages, disadvantages, and policy considerations.” Education Finance & Policy, 8(3), pp. 316-331.
District Management Group. (2017). Expanding and strengthening best-practice supports for students who struggle: Preliminary highlights for discussion. Vermont Agency of Education, Barre, VT: Retrieved from https://legislature.vermont.gov/assets/Legislative-Reports/edu-legislative-report-dmg-expanding-and-strengthening-best-practice-supports-for-students-who-struggle.pdf
Downes, T. (2004). “What Is Adequate? Operationalizing the Concept of Adequacy for New York,” in David Monk and Jim Wyckoff, editors, Symposium Proceedings 2004, Education Finance and Organizational Structure in NYS Schools. Albany, NY: Rockefeller College of Public Affairs and Policy.
Study of Pupil Weights in Vermont’s Education Funding Formula 88
Duncombe, W., & Yinger, J. (2005). How much more does a disadvantaged student cost? Economics of Education Review, 24, 513–532.
Duncombe, W. & Yinger, J. (2008). Measurement of Cost Differentials. In Handbook of Research in Education Finance and Policy (Eds. Ladd, H. & Fiske, E.), pp. 238-56. New York, NY: Routledge.
EdBuild. (n.d.) FundEd: State education policies for all 50 states. Retrieved from http://funded.edbuild.org
EdBuild. (n.d.) FundEd: Grade Level Funding, Policies in Each State. Retrieved from http://funded.edbuild.org/reports/issue/grade
Education Commission of the States. (March 2019). 50-State Comparison: K12 Special Education Funding. Retrieved from: https://www.ecs.org/50-state-comparison-k-12-special-education-funding/.
Elder, T., Figlio, D., Imberman, S., & Persico, C. (2019). School segregation and racial aps in special education identification. Working Paper 25829. National Bureau of Economic Research. Retrieved from https://www.nber.org/papers/w25829.
House Fiscal Advisory Staff. (2017). Rhode Island Education Aid. Providence, RI: Author. Retrieved from http://www.rilin.state.ri.us/housefiscalreport/Special%20Publications/2018%20Session/Ed ucation%20Aid%20-%202018%20Edition.pdf
Holcombe, R. (2017). Evaluation of the accuracy of the secondary weight for the equalized pupil count: Recommendation to the House and Senate committees on education. Barre, VT: Vermont Agency of Education. Retrieved from https://education.vermont.gov/sites/aoe/files/documents/edu-legislative-report-secondary-weighting-for-the-equalized-pupil-count-2017.pdf
Huling, K. (2018). Determining eligibility for small school grants. Barre,VT: Vermont State Board of Education. Retrieved from https://education.vermont.gov/documents/sbe-determining-eligibility-small-school-grants
Johnson, J., Ohlson, M. A., & Shope, S. (2018). Demographic Changes in Rural America and the Implications for Special Education Programming: A Descriptive and Comparative Analysis. Rural Special Education Quarterly, 37(3), 140– 149. https://doi.org/10.1177/8756870518771381
Kolbe, T. (2019) Funding special education: Charting a path that confronts complexity and crafts coherence. Boulder, CO: National Education Policy Center. Retrieved from https://nepc.colorado.edu/publication/special-ed
Kolbe, T. & Killeen, K. (2017). Study of special education funding in Vermont. Burlington, VT: College of Education & Social Services, University of Vermont. Retrieved from https://legislature.vermont.gov/Documents/2018/WorkGroups/Senate%20Education/Spe cial%20Education/W~Tammy%20Kolbe~Study%20of%20Vermont%20State%20Funding %20for%20Special%20Education%20Executive%20Summary~1-9-2018.pdf
Study of Pupil Weights in Vermont’s Education Funding Formula 89
Kraus, L., Lauer, E., Coleman, R., and Houtenville, A. (2018). 2017 Disability Statistics Annual Report. Durham, NH: University of New Hampshire. Retrieved from https://disabilitycompendium.org/sites/default/files/user-uploads/2017_AnnualReport_2017_FINAL.pdf
Losen, D. & Orfield, G. (2002). Racial inequity in special education. Cambridge, MA: Harvard Education Press.
Macfarlane, K. & Woolfson, L. M. (2013). Teacher attitudes and behavior toward the inclusion of children with social, emotional, and behavioral difficulties in mainstream schools: An application of the theory of planned behavior. Teaching and Teacher Education, 29, 46-52.
Maine Department of Education. (2017). EPS Special Education Allocation, 2017-18 Step 1: Calculation of Base Component. Augusta, ME: Maine Department of Education.
Maine Department of Education (2016). Essential Programs and Services State Calculation for Funding Public Education (ED 279). Augusta, ME: Maine Department of Education.
Massachusetts Department of Education. (2017). The Massachusetts Foundation Budget. Boston, MA: Author. Retrieved from https://s3.amazonaws.com/2019.funded.edbuild.org/public/citations/176_TheMassachuse ttsFoundationBudget(MassDESE,2017).pdf
Mathis, B. (1998). Finance reform in Vermont: The legislature responds to the Brigham Supreme Court decision. Annual Meetings of the American Education Finance Association. San Diego, CA.
Morgan, P., Farkas, G., Hillemeier, M., & Maczuga, S. (2012). Are Minority Children Disproportionately Represented in Early Intervention and Early Childhood Special Education? Educational Researcher 41:9, 339-351.
Morgan, P. L., & Farkas, G. (2016). Are We Helping All the Children That We Are Supposed to Be Helping? Educational Researcher, 45(3), 226–228.
National Research Council. (2002). Minority students in special and gifted education. Washington, DC: The National Academies Press.
Parrish, T., Kaleba, D., Gerber, M. & McLaughlin, M. (1998). Special Education: Study of Incidence of Disabilities (Final Report). Palo Alto, CA: American Institutes for Research.
Parrish, T. (2000). “Restructuring special education funding in New York to promote the objective of high learning standards for all students.” Economics of Education Review 19(2000), pp. 431-445.
Parrish, T., Harr, J., Kidron, Y., Brock, L., Anand, P. (2003). Study of the incidence adjustment in the special education funding model: Final report. Palo Alto, CA: American Institutes for Research.
Pennsylvania Department of Education. (2000). A report on special education incidence rates. Harrisburg, PA.
Study of Pupil Weights in Vermont’s Education Funding Formula 90
Shifrer, D., Muller, C., & Callahan, R. 2014. Disproportionality and Learning Disabilities: Parsing Apart Race, Socioeconomic Status, and Language. Journal of Learning Disabilities, 44:3, 246-257.
Sullivan, A.L. & Bal, A. 2013. Disproportionality in Special Education: Effects of Individual and School Variables on Disability Risk. Exceptional Children, 79:4, 479-494.
Taylor, L. (2015). Options for updating Wyoming’s regional cost adjustment. The Select Committee on School Finance Recalibration. Retrieved from https://www.wyoleg.gov/InterimCommittee/2015/SSRRpt1001AppendixC-1.pdf
Taylor, L. (2006). Comparable wages, inflation, and school finance equity. Education Finance and Policy, 1(3), 349-371.
Vermont Agency of Education. (2019). FY2020 Budget Recommendations. Barre, VT: Author. Retrieved from https://ljfo.vermont.gov/assets/Uploads/8a7c55b35a/AOE-2020_Budget_Book-v2.pdf
Study of Pupil Weights in Vermont’s Education Funding Formula 91
Appendix A. Translating Cost Function Model Results into Funding
In this Appendix, we discuss how we applied cost function modeling to the task of evaluating the cost factors and weights included in Vermont’s equalized pupil calculation.
Overview of Process
The first step in the process is to fit the statistical models to existing data on schools or districts; their spending and outcomes; and various student, school, and district attributes. In the following section, we begin by discussing those models and the extent to which they (1) conform to theoretical expectations and (2) comply with relevant statistical tests.
The dominant modeling approach in recent peer-reviewed literature for the district-level education cost function is one in which
a) the dependent measure is a measure of current operating expenditures per pupil;
b) student outcome measures are treated as “endogenous” and instrumented using measures of the competitive context within which local public-school districts operate; and
c) attempts are made to control for inefficiencies in the spending measure by including measures of variations in fiscal capacity and local public monitoring.
These issues are statistically complicated but necessary for teasing out the relationship between school district spending and measured student outcomes.
Figure A.1 provides an overview of the issues listed previously. Our goal is to elicit from district or school spending data the “cost” of achieving specific outcome levels. We set up a series of models in which we predict spending levels from educational outcomes (narrowly measured as student achievement in math and language arts) and other factors, rather than predicting outcomes from spending levels.
As such, we must take statistical steps to correct for the fact that spending is influenced by outcomes, while, simultaneously, outcomes also are affected by spending (the circular/feedback loop relationship in the Figure A.1). More spending can lead to better student outcomes; increased funding can be used to reduce class sizes, recruit better-qualified personnel, provide support services, and so on. However, higher outcomes in a community may drive increased spending because homeowners desire to have their schools continue to be perceived as high performing, thus keeping their property values relatively high.
In this case, there is no clear causal direction: the two factors affect each other simultaneously. The relevant statistical approach to isolate the causal effect of outcomes on spending (distinct from the effect of spending on outcomes) is to use a two-stage model in which we use exogenous (outside the loop) measures of each district’s competitive context to correct for endogeneity (inside the loop feedback) in the outcome measure.

Study of Pupil Weights in Vermont’s Education Funding Formula 92
Figure A.1. Estimation of a Cost-Function Model
In general, the main (second-stage) equation of the education cost function is one in which a measure of current operating expenditures is expressed as a function of the outcomes achieved at those expenditure levels; the students served by school districts; a measure of variation in competitive wages (Input Prices) for teachers; the structural characteristics of the school district, such as grade ranges served and the size of the school district (perhaps coupled with other location factors such as sparsity or remoteness); and any factors that might produce inefficiencies in the spending measure. The equation may be expressed as follows:
Spendingdsj = f (Outcomesdsj, Studentsdsj, Input Pricesdsj, Structuredsj, Scaledsj, Inefficiencydsj)
where
spending is a measure of current per pupil operating expenses in district, d, (or school, s) in year, j;
outcomes are the outcome measure(s) of interest;
students is a matrix of student need and demographic characteristics for district (d) in year j;
input Prices is a measure of geographic variation in the prices of key inputs to schooling, such as teacher wages;
Instruments:Competitive
Context
Inefficiency
Spending
CostMeasured Student
Outcomes
Student Population
Input PricesStructural / Geographic Constraints
Efficiency Controls: Fiscal
Capacity, Competition &
Public Monitoring
First Stage Model
Study of Pupil Weights in Vermont’s Education Funding Formula 93
structure is a matrix of district structural characteristics, such as grade ranges served;
scale is a measure of economies of scale usually expressed in terms of student enrollments and, in some cases, also addressing population sparsity; and
inefficiency is a matrix of variables that predicts variation in spending but is not related to commensurate shifts in outcomes.
Another issue we must deal with is the fact that not all school district spending is efficient spending, or by statistical definition here, spending that contributes directly to the measured outcomes. In any given school district, some part of current spending contributes directly to the measured student outcomes used in the model, given the students served; teacher salaries; and the structure, size, and location of the school district. The objective of the cost function is to identify the levels of spending associated with achieving specific outcome levels under different circumstances and across varied student populations, holding factors associated with inefficiency constant.
In the modeling approach used here, we include measures that the research literature identifies as predictors of differences in district spending not directly associated with outcomes (i.e., inefficiencies). These include measures of local district competition density and measures influencing local public monitoring of public expenditures (share of aid coming from nonlocal sources and the proportion of the local population that is school aged).
The next three tables display the results of the education cost function model estimation.
Model 1: District-level model using data on Vermont districts only from 2009 to 2018, primarily sourced from AOE data
Model 2: School-level model using data on Vermont schools from 2009 to 2018, primarily sourced from AOE data
Model 3: District-level model using data on school districts in Vermont from 2009 to 2015, New Hampshire, Maine, and Massachusetts, excluding districts in the Boston Metropolitan Statistical Area, primarily sourced from the School Finance Indicators Database (SFID)
These tables are of the regression model output (coefficients) for the “second-stage” or main cost model equation. The components of the model include costs associated with higher (or lower) outcomes: District Structure, Regional Cost Factors, and Student Needs.
In many ways as discussed in the main text, the district-level Vermont specific model is the weakest model (Table A.1). But even this model produces largely reasonable findings. That is, the model works, in reasonable ways, to characterize the relationships between outcome goals and costs, and various factors affecting the costs of achieving those outcome goals. The model reveals the following:
A $1,535 increase in per pupil spending is associated with a standard deviation of higher student assessment scores in math and reading or, alternatively, achieving a 1 standard deviation increase in outcomes is expected to cost an additional $1,535 per pupil.
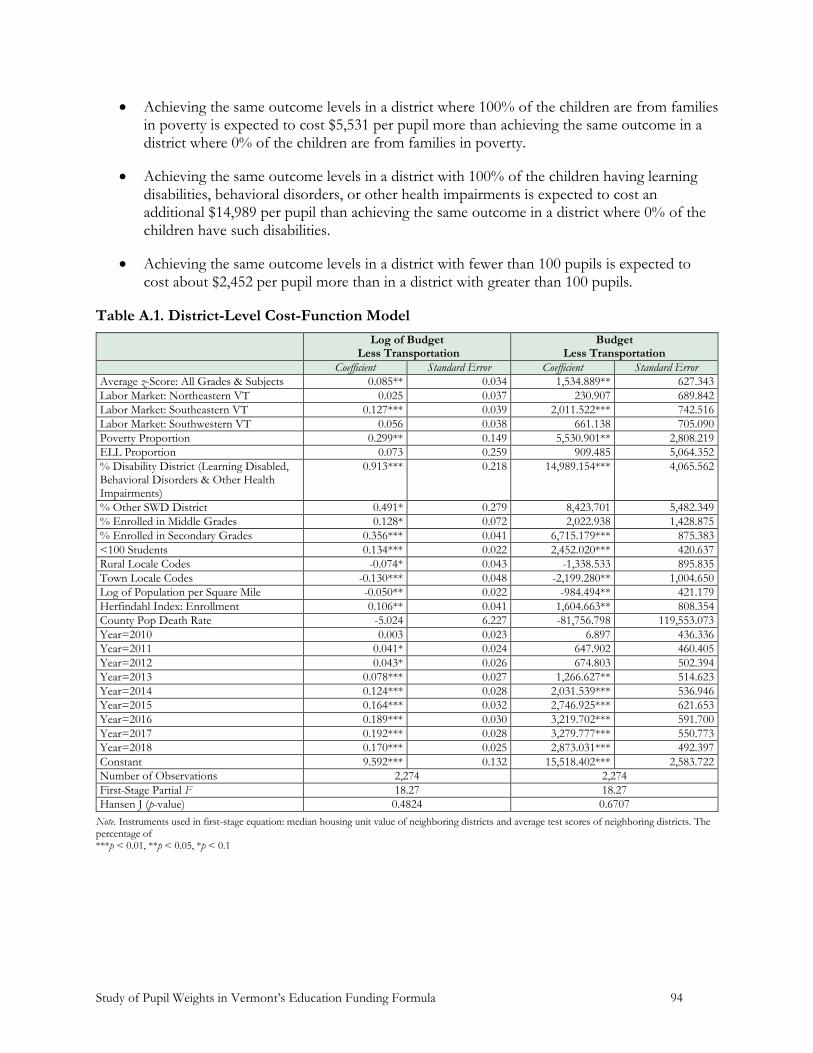
Study of Pupil Weights in Vermont’s Education Funding Formula 94
Achieving the same outcome levels in a district where 100% of the children are from families in poverty is expected to cost $5,531 per pupil more than achieving the same outcome in a district where 0% of the children are from families in poverty.
Achieving the same outcome levels in a district with 100% of the children having learning disabilities, behavioral disorders, or other health impairments is expected to cost an additional $14,989 per pupil than achieving the same outcome in a district where 0% of the children have such disabilities.
Achieving the same outcome levels in a district with fewer than 100 pupils is expected to cost about $2,452 per pupil more than in a district with greater than 100 pupils.
Table A.1. District-Level Cost-Function Model
Log of Budget Less Transportation
Budget Less Transportation
Coefficient Standard Error Coefficient Standard Error
Average z-Score: All Grades & Subjects 0.085** 0.034 1,534.889** 627.343
Labor Market: Northeastern VT 0.025 0.037 230.907 689.842
Labor Market: Southeastern VT 0.127*** 0.039 2,011.522*** 742.516
Labor Market: Southwestern VT 0.056 0.038 661.138 705.090
Poverty Proportion 0.299** 0.149 5,530.901** 2,808.219
ELL Proportion 0.073 0.259 909.485 5,064.352
% Disability District (Learning Disabled, Behavioral Disorders & Other Health Impairments)
0.913*** 0.218 14,989.154*** 4,065.562
% Other SWD District 0.491* 0.279 8,423.701 5,482.349
% Enrolled in Middle Grades 0.128* 0.072 2,022.938 1,428.875
% Enrolled in Secondary Grades 0.356*** 0.041 6,715.179*** 875.383
<100 Students 0.134*** 0.022 2,452.020*** 420.637
Rural Locale Codes -0.074* 0.043 -1,338.533 895.835
Town Locale Codes -0.130*** 0.048 -2,199.280** 1,004.650
Log of Population per Square Mile -0.050** 0.022 -984.494** 421.179
Herfindahl Index: Enrollment 0.106** 0.041 1,604.663** 808.354
County Pop Death Rate -5.024 6.227 -81,756.798 119,553.073
Year=2010 0.003 0.023 6.897 436.336
Year=2011 0.041* 0.024 647.902 460.405
Year=2012 0.043* 0.026 674.803 502.394
Year=2013 0.078*** 0.027 1,266.627** 514.623
Year=2014 0.124*** 0.028 2,031.539*** 536.946
Year=2015 0.164*** 0.032 2,746.925*** 621.653
Year=2016 0.189*** 0.030 3,219.702*** 591.700
Year=2017 0.192*** 0.028 3,279.777*** 550.773
Year=2018 0.170*** 0.025 2,873.031*** 492.397
Constant 9.592*** 0.132 15,518.402*** 2,583.722
Number of Observations 2,274 2,274
First-Stage Partial F 18.27 18.27
Hansen J (p-value) 0.4824 0.6707
Note. Instruments used in first-stage equation: median housing unit value of neighboring districts and average test scores of neighboring districts. The percentage of ***p < 0.01, **p < 0.05, *p < 0.1

Study of Pupil Weights in Vermont’s Education Funding Formula 95
Tables A.2 and A.3 present the results of the school-level model and regional model of district-level data. In the school-level model, we find the following:
A $1,958 increase in per pupil spending is associated with a standard deviation of higher student assessment scores in math and reading or, alternatively, achieving a 1 standard deviation increase in outcomes is expected to cost an additional $1,958 per pupil.
Achieving the same outcome levels in a school where 100% of the children are from families qualifying for free or reduced-priced lunch is expected to cost $3,948 per pupil more than achieving the same outcome in a school where 0% of the children are from families qualifying for free or reduced-priced lunch.
Achieving the same outcome levels in a school with 100% of the children having learning disabilities, behavioral disorders, or other health impairments is expected to cost an additional $12,128 per pupil than achieving the same outcome in a school where 0% of the children have such disabilities or impairments.
Achieving the same outcome levels in a school with fewer than 100 pupils is expected to cost about $1,059 per pupil more than in a school with greater than 100 pupils.
In the regional model, which has the advantage of including districts in neighboring states, under alternative state policy structures and financing schemes, but the disadvantage of less precise and complete data on specific student needs, we find the following:
Achieving the same outcome levels in a district where 100% of the children are from families qualifying for free or reduced-priced lunch is expected to cost $15,509 per pupil more than achieving the same outcome in a district where 0% of the children are from families qualifying for free or reduced-priced lunch.
Achieving the same outcome levels in a district with 101 to 300 students is expected to cost $3,691 per pupil more than in a district with more than 2,000 students.
Achieving the same outcome levels in a district with 301 to 600 students is expected to cost $2,528 per pupil more than in a district with more than 2,000 students.
Achieving the same outcome levels in a district with 601 to 1,200 students is expected to cost $2,430 per pupil more than in a district with more than 2,000 students.
Achieving the same outcome levels in a district with 1,501 to 2,000 students is expected to cost $1,678 per pupil more than in a district with more than 2,000 students.

Study of Pupil Weights in Vermont’s Education Funding Formula 96
Table A.2. School-Level Cost-Function Model
Log of Total Spending Log of Instructional
Spending Total Spending Instructional Spending
Coefficient Standard Error Coefficient Standard Error Coefficient Standard Error Coefficient Standard Error
Average z-Score: All Grades & Subjects 0.173*** 0.047 0.196*** 0.050 1,958.663*** 539.905 1,580.815*** 403.650
Labor Market: Northeastern VT 0.134*** 0.045 0.114** 0.048 1,276.488*** 477.596 736.916** 354.306
Labor Market: Southeastern VT 0.143*** 0.048 0.145*** 0.051 1,500.557*** 504.588 1,081.046*** 381.744
Labor Market: Southwestern VT 0.138*** 0.051 0.139*** 0.054 1,647.238*** 567.835 1,138.921*** 416.061
FRPL Percentage (CCD PSU) 0.350*** 0.133 0.318** 0.147 3,947.743*** 1,507.794 2,602.215** 1,154.458
% ELL 1.526*** 0.320 1.891*** 0.319 16,651.186*** 3,680.005 15,119.380*** 2,591.585
% Disability School (Learning Disabled, Behavioral Disorders & Other Health Impairments)
1.089*** 0.305 1.215*** 0.329 12,127.550*** 3,444.542 9,386.332*** 2,568.204
% Other SWD School 1.314*** 0.426 1.577*** 0.497 13,835.026*** 4,613.161 11,825.464*** 3,698.496
MS Grade Enrollment % (AOE) 0.190*** 0.042 0.197*** 0.045 1,865.577*** 439.117 1,421.753*** 333.103
HS Grade Enrollment % (AOE) 0.248*** 0.046 0.192*** 0.051 2,543.938*** 502.622 1,398.447*** 381.418
<100 Students 0.114*** 0.035 0.059* 0.035 1,059.000** 413.708 374.747 292.088
101 to 250 Students 0.037 0.026 0.001 0.027 323.048 294.888 -0.890 216.758
Rural Locale Codes -0.122** 0.054 -0.181*** 0.055 -1,157.085** 556.860 -1,234.290*** 397.022
Town Locale Codes -0.136** 0.055 -0.195*** 0.058 -1,402.154** 562.140 -1,375.946*** 414.229
Log of Population per Square Mile -0.087*** 0.033 -0.111*** 0.036 -847.073** 364.277 -780.586*** 272.691
Herfindahl Index: Enrollment 0.086 0.082 0.176** 0.087 607.673 882.655 1,065.077* 638.092
County Median Household Income 0.345*** 0.130 0.356** 0.146 3,123.478** 1,476.646 2,246.560** 1,142.053
Year=2010 0.016 0.012 0.020 0.013 36.942 162.040 48.368 122.011
Year=2011 0.030** 0.015 0.032** 0.016 340.452* 182.088 274.361* 144.013
Year=2012 0.000 0.019 0.002 0.020 -111.445 227.959 -70.596 170.577
Year=2013 0.035** 0.018 0.034* 0.019 344.330* 186.427 243.285* 145.011
Year=2014 0.026 0.022 0.022 0.023 313.167 238.353 225.904 182.560
Year=2015 -0.014 0.027 -0.028 0.029 -59.213 290.843 -137.311 223.886
Year=2016 -0.029 0.027 -0.053* 0.030 -206.615 296.445 -308.414 231.209
Year=2017 -0.038 0.031 -0.060* 0.034 -416.691 343.392 -433.956 267.018
Year=2018 -0.059* 0.035 -0.080** 0.038 -594.289 384.193 -561.004* 296.118
Constant 5.412*** 1.377 5.117*** 1.533 -24,555.283 15,513.832 -16,574.569 11,988.432
Number of Observations 2,940 2,940 2,940 2,940
First-Stage Partial F 15.61 15.61 15.61 15.61
Hansen J (p-value) 0.0465 0.0356 0.0227 0.0244
Note. Instruments used in first-stage equation: median household income of neighboring districts, median housing unit value of neighboring districts, and average test scores of neighboring districts. ***p < 0.01, **p < 0.05, *p < 0.1
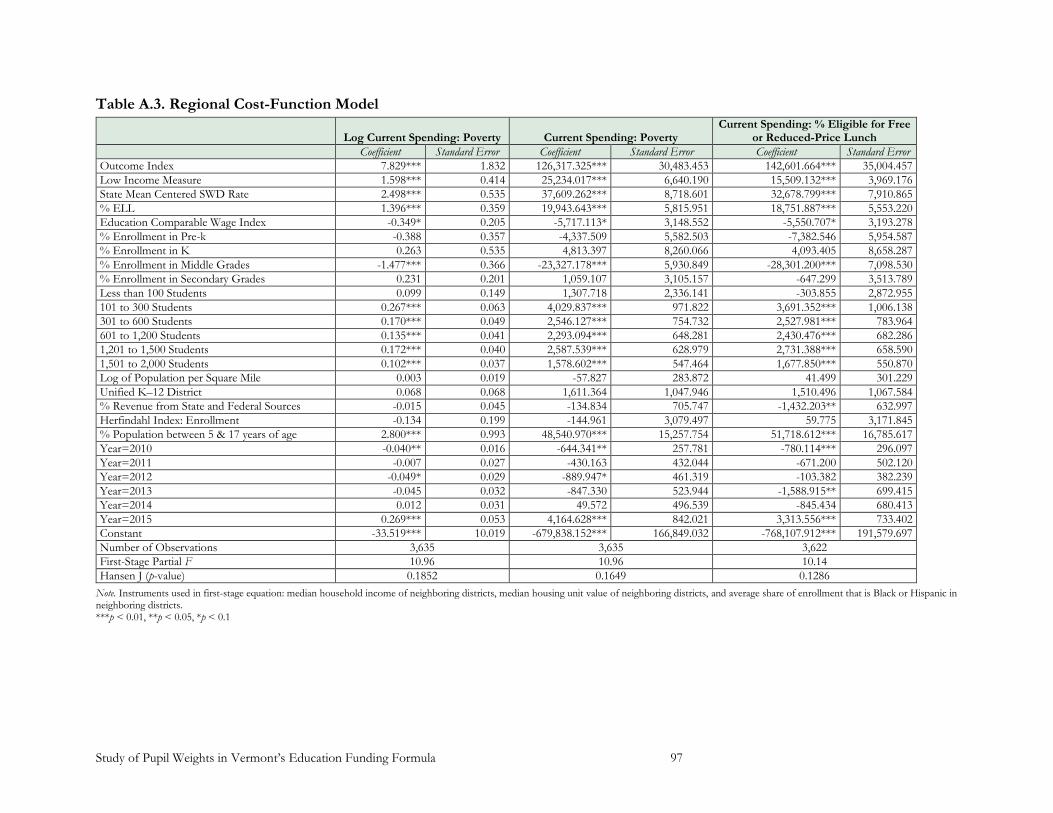
Study of Pupil Weights in Vermont’s Education Funding Formula 97
Table A.3. Regional Cost-Function Model
Log Current Spending: Poverty Current Spending: Poverty Current Spending: % Eligible for Free
or Reduced-Price Lunch
Coefficient Standard Error Coefficient Standard Error Coefficient Standard Error
Outcome Index 7.829*** 1.832 126,317.325*** 30,483.453 142,601.664*** 35,004.457
Low Income Measure 1.598*** 0.414 25,234.017*** 6,640.190 15,509.132*** 3,969.176
State Mean Centered SWD Rate 2.498*** 0.535 37,609.262*** 8,718.601 32,678.799*** 7,910.865
% ELL 1.396*** 0.359 19,943.643*** 5,815.951 18,751.887*** 5,553.220
Education Comparable Wage Index -0.349* 0.205 -5,717.113* 3,148.552 -5,550.707* 3,193.278
% Enrollment in Pre-k -0.388 0.357 -4,337.509 5,582.503 -7,382.546 5,954.587
% Enrollment in K 0.263 0.535 4,813.397 8,260.066 4,093.405 8,658.287
% Enrollment in Middle Grades -1.477*** 0.366 -23,327.178*** 5,930.849 -28,301.200*** 7,098.530
% Enrollment in Secondary Grades 0.231 0.201 1,059.107 3,105.157 -647.299 3,513.789
Less than 100 Students 0.099 0.149 1,307.718 2,336.141 -303.855 2,872.955
101 to 300 Students 0.267*** 0.063 4,029.837*** 971.822 3,691.352*** 1,006.138
301 to 600 Students 0.170*** 0.049 2,546.127*** 754.732 2,527.981*** 783.964
601 to 1,200 Students 0.135*** 0.041 2,293.094*** 648.281 2,430.476*** 682.286
1,201 to 1,500 Students 0.172*** 0.040 2,587.539*** 628.979 2,731.388*** 658.590
1,501 to 2,000 Students 0.102*** 0.037 1,578.602*** 547.464 1,677.850*** 550.870
Log of Population per Square Mile 0.003 0.019 -57.827 283.872 41.499 301.229
Unified K–12 District 0.068 0.068 1,611.364 1,047.946 1,510.496 1,067.584
% Revenue from State and Federal Sources -0.015 0.045 -134.834 705.747 -1,432.203** 632.997
Herfindahl Index: Enrollment -0.134 0.199 -144.961 3,079.497 59.775 3,171.845
% Population between 5 & 17 years of age 2.800*** 0.993 48,540.970*** 15,257.754 51,718.612*** 16,785.617
Year=2010 -0.040** 0.016 -644.341** 257.781 -780.114*** 296.097
Year=2011 -0.007 0.027 -430.163 432.044 -671.200 502.120
Year=2012 -0.049* 0.029 -889.947* 461.319 -103.382 382.239
Year=2013 -0.045 0.032 -847.330 523.944 -1,588.915** 699.415
Year=2014 0.012 0.031 49.572 496.539 -845.434 680.413
Year=2015 0.269*** 0.053 4,164.628*** 842.021 3,313.556*** 733.402
Constant -33.519*** 10.019 -679,838.152*** 166,849.032 -768,107.912*** 191,579.697
Number of Observations 3,635 3,635 3,622
First-Stage Partial F 10.96 10.96 10.14
Hansen J (p-value) 0.1852 0.1649 0.1286
Note. Instruments used in first-stage equation: median household income of neighboring districts, median housing unit value of neighboring districts, and average share of enrollment that is Black or Hispanic in neighboring districts. ***p < 0.01, **p < 0.05, *p < 0.1

Study of Pupil Weights in Vermont’s Education Funding Formula 98
Estimating Weights
Because of the difficultly in directly interpreting coefficients from the cost-function models as weights, we take an extra step to use the cost-function model results and estimate weights. We take the per-pupil cost predictions from the Cost Function Model Estimation, and we evaluate the relationship between these predictions and a more limited set of cost factors that are consistent with those included in the formula we wish to simulate. In this case, we ran the following model:
Predicted Cost Per Pupil = f(Poverty, ELL, SWD, Grade Range, Enrollment Shares,
Enrollment Size, Population Density)
Notably, it is a given that the cost factors are highly associated with the cost predictions. After all, they are the basis for the cost predictions.
This extra step also allows us to calculate weights in a manner that is consistent with how they would be applied in the Vermont context. Specifically, Vermont first applies grade-level weights and calculates a grade-level weighted ADM. To the grade-level weighted ADM, it applies the poverty weight. The ELL weight is directly applied to the number of ELL students not weighted by grade.
Because the poverty weight is applied to the grade-level weighted ADM, this means that the poverty weight and the grade-level weights are multiplicative. In other words, the poverty weight counts for more in districts with more students in grades with higher grade-level weights compared with districts with fewer students in high-weight grades. Other weights, such as ELL are additive, meaning the effect of the weight does not change based on other weights.
To account for the multiplicative nature of the poverty and grade-level weights, we modeled the poverty and grade-level weights as multiplicative by exponentiating them in the model, as follows:
𝑃𝑟𝑒𝑑𝑖𝑐𝑡𝑒𝑑 𝐶𝑜𝑠𝑡 𝑃𝑒𝑟 𝑃𝑢𝑝𝑖𝑙
= 𝑒(𝛽0+𝛽1𝑃𝑜𝑣𝑒𝑟𝑡𝑦+∑ 𝛽𝑘𝐺𝑟𝑎𝑑𝑒 𝑅𝑎𝑛𝑔𝑒𝑘+3 𝑘=2 ∑ 𝛽𝑙𝑌𝑒𝑎𝑟𝑙
12 𝑙=4 ) + 𝛽13𝐸𝐿𝐿
+ 𝛽14𝐿𝑜𝑤𝑆𝑒𝑣𝑒𝑟𝑖𝑡𝑦𝑆𝑊𝐷 + 𝛽15𝐻𝑖𝑔ℎ𝑆𝑒𝑣𝑒𝑟𝑖𝑡𝑦𝑆𝑊𝐷 + ∑ 𝛽𝑚𝑆𝑖𝑧𝑒𝑚
17
𝑚=16
+ ∑ 𝛽𝑛𝑆𝑝𝑎𝑟𝑠𝑖𝑡𝑦𝑛
20
𝑛=18
+ 𝜀
where
Poverty = percentage of students in poverty,
Grade Range = percentage of students in the middle (6–8) and high school (9–12) grades,
Year = indicator of Year (2008–09 through 2017–18),
ELL = percentage of students designated as English language learners,
LowSeverity = percentage of students with low-severity disabilities,
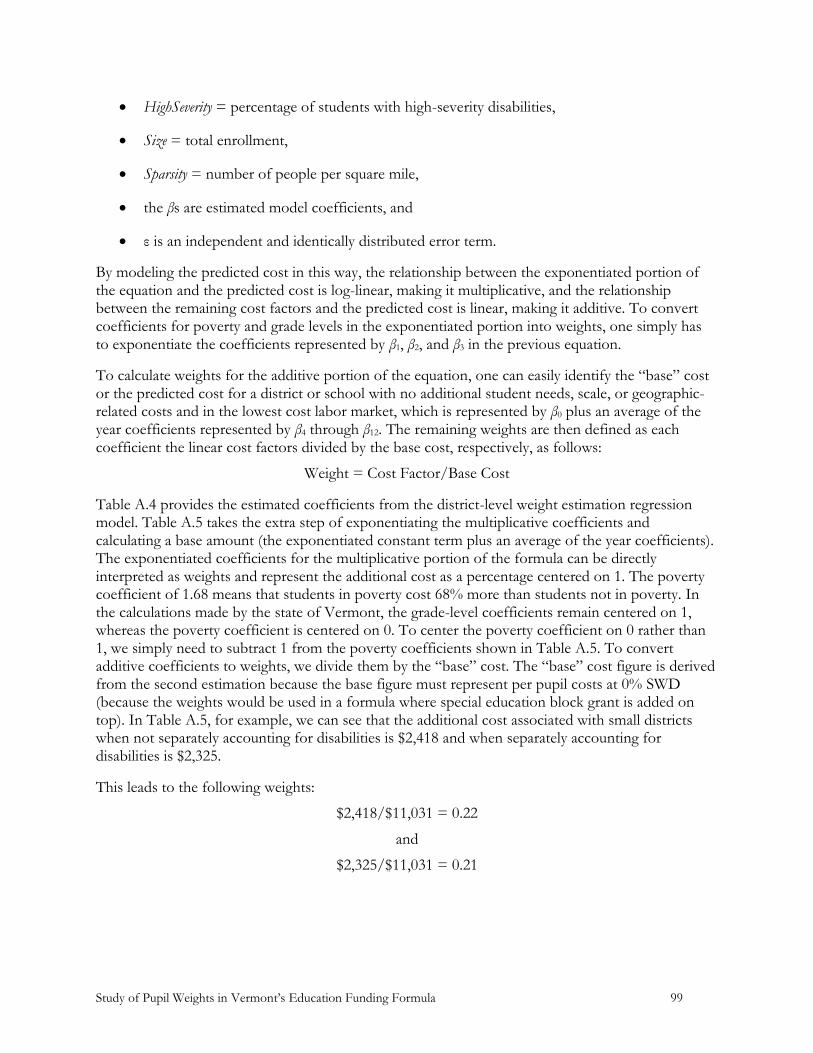
Study of Pupil Weights in Vermont’s Education Funding Formula 99
HighSeverity = percentage of students with high-severity disabilities,
Size = total enrollment,
Sparsity = number of people per square mile,
the βs are estimated model coefficients, and
ε is an independent and identically distributed error term.
By modeling the predicted cost in this way, the relationship between the exponentiated portion of the equation and the predicted cost is log-linear, making it multiplicative, and the relationship between the remaining cost factors and the predicted cost is linear, making it additive. To convert coefficients for poverty and grade levels in the exponentiated portion into weights, one simply has to exponentiate the coefficients represented by β1, β2, and β3 in the previous equation.
To calculate weights for the additive portion of the equation, one can easily identify the “base” cost or the predicted cost for a district or school with no additional student needs, scale, or geographic-related costs and in the lowest cost labor market, which is represented by β0 plus an average of the year coefficients represented by β4 through β12. The remaining weights are then defined as each coefficient the linear cost factors divided by the base cost, respectively, as follows:
Weight = Cost Factor/Base Cost
Table A.4 provides the estimated coefficients from the district-level weight estimation regression model. Table A.5 takes the extra step of exponentiating the multiplicative coefficients and calculating a base amount (the exponentiated constant term plus an average of the year coefficients). The exponentiated coefficients for the multiplicative portion of the formula can be directly interpreted as weights and represent the additional cost as a percentage centered on 1. The poverty coefficient of 1.68 means that students in poverty cost 68% more than students not in poverty. In the calculations made by the state of Vermont, the grade-level coefficients remain centered on 1, whereas the poverty coefficient is centered on 0. To center the poverty coefficient on 0 rather than 1, we simply need to subtract 1 from the poverty coefficients shown in Table A.5. To convert additive coefficients to weights, we divide them by the “base” cost. The “base” cost figure is derived from the second estimation because the base figure must represent per pupil costs at 0% SWD (because the weights would be used in a formula where special education block grant is added on top). In Table A.5, for example, we can see that the additional cost associated with small districts when not separately accounting for disabilities is $2,418 and when separately accounting for disabilities is $2,325.
This leads to the following weights:
$2,418/$11,031 = 0.22
and
$2,325/$11,031 = 0.21
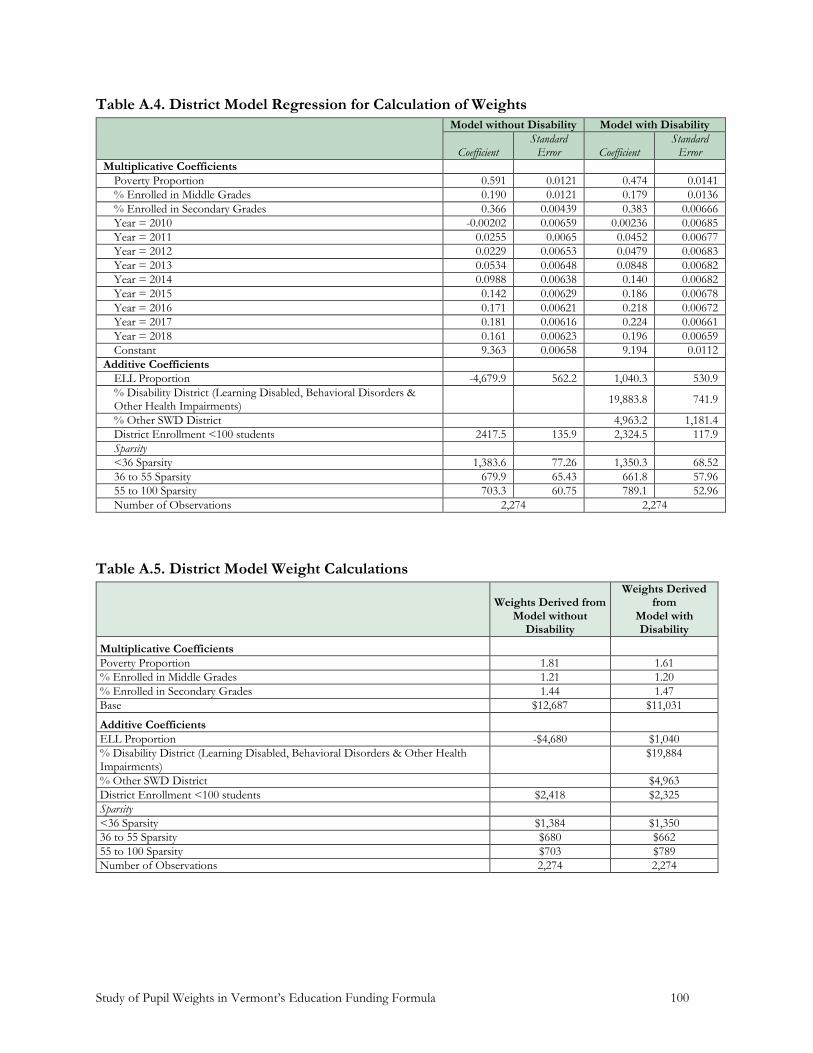
Study of Pupil Weights in Vermont’s Education Funding Formula 100
Table A.4. District Model Regression for Calculation of Weights
Model without Disability Model with Disability
Coefficient Standard
Error Coefficient Standard
Error
Multiplicative Coefficients
Poverty Proportion 0.591 0.0121 0.474 0.0141
% Enrolled in Middle Grades 0.190 0.0121 0.179 0.0136
% Enrolled in Secondary Grades 0.366 0.00439 0.383 0.00666
Year = 2010 -0.00202 0.00659 0.00236 0.00685
Year = 2011 0.0255 0.0065 0.0452 0.00677
Year = 2012 0.0229 0.00653 0.0479 0.00683
Year = 2013 0.0534 0.00648 0.0848 0.00682
Year = 2014 0.0988 0.00638 0.140 0.00682
Year = 2015 0.142 0.00629 0.186 0.00678
Year = 2016 0.171 0.00621 0.218 0.00672
Year = 2017 0.181 0.00616 0.224 0.00661
Year = 2018 0.161 0.00623 0.196 0.00659
Constant 9.363 0.00658 9.194 0.0112
Additive Coefficients
ELL Proportion -4,679.9 562.2 1,040.3 530.9
% Disability District (Learning Disabled, Behavioral Disorders & Other Health Impairments)
19,883.8 741.9
% Other SWD District 4,963.2 1,181.4
District Enrollment <100 students 2417.5 135.9 2,324.5 117.9
Sparsity
<36 Sparsity 1,383.6 77.26 1,350.3 68.52
36 to 55 Sparsity 679.9 65.43 661.8 57.96
55 to 100 Sparsity 703.3 60.75 789.1 52.96
Number of Observations 2,274 2,274
Table A.5. District Model Weight Calculations
Weights Derived from Model without
Disability
Weights Derived from
Model with Disability
Multiplicative Coefficients
Poverty Proportion 1.81 1.61
% Enrolled in Middle Grades 1.21 1.20
% Enrolled in Secondary Grades 1.44 1.47
Base $12,687 $11,031
Additive Coefficients
ELL Proportion -$4,680 $1,040
% Disability District (Learning Disabled, Behavioral Disorders & Other Health Impairments)
$19,884
% Other SWD District $4,963
District Enrollment <100 students $2,418 $2,325
Sparsity
<36 Sparsity $1,384 $1,350
36 to 55 Sparsity $680 $662
55 to 100 Sparsity $703 $789
Number of Observations 2,274 2,274

Study of Pupil Weights in Vermont’s Education Funding Formula 101
Table A.6 summarizes all the weights from the Vermont-specific district-level model relying on AOE data. A few weights here are suspect. Certainly, it does not cost less per pupil as ELL shares climb. Previous cost modeling studies have found it difficult to isolate ELL-related costs. Notably, this negative effect disappears when accounting for SWD, implying a relationship between these two populations across Vermont school districts. In addition, it is not entirely logical that the weight on higher need disabilities is lower than the weight on lower need disabilities. But this may be a function of some of the expenses associated with higher need children being fully reimbursed by the State and not fully revealed in district-level expenditure data.
Table A.6. Final District Model Weights
Weights Derived from Model without Disability
Weights Derived from Model with Disability
Weights Calculations
Multiplicative Weights
Poverty (centered on 0) 0.81 0.61
Middle School Students (centered on 1) 1.21 1.20
High School Students (centered on 1) 1.44 1.47
Additive Weights (All centered on 0)
ELL -0.42 0.09
% Disability District (Learning Disabled, Behavioral Disorders & Other Health Impairments)
1.80
% Other SWD District 0.45
District Enrollment <100 students 0.22 0.21
Sparsity Category 1 (<36 per square mile) 0.13 0.12
Sparsity Category 2 (36 to 54.9 per square mile) 0.06 0.06
Sparsity Category 3 (55 to 99.9 per square mile) 0.06 0.07
Because the school-level measures for economic disadvantage at the school level are measures of FRPL eligibility and Vermont’s preference is to use a measure of poverty for weighting, we took an extra step to predict a school-level measure of poverty. We first aggregated all school-level variables to the district. Using the most recent available data (fiscal year 2018 [FY2018]), we then used regression to predict district poverty based on aggregated school-level variables. Using these regression results, we then predicted school-level poverty. Table A.7 shows the regression used to estimate poverty at the school level.
Table A.7. Regression to Predict School-Level Poverty
Coefficient Standard Error
FRPL % (from AOE) 0.309 0.0400
FRPL % (from CCD) 0.194 0.0487
Middle School % 0.0381 0.0394
High School % 0.116 0.0218
ELL % 0.459 0.143
School Enrollment <100 -0.00173 0.0143
School Enrollment 100 to <250 -0.0114 0.0109
% Disability District (Learning Disabled, Behavioral Disorders & Other Health Impairments)
-0.188 0.116
% Other SWD District 0.179 0.166
Sparsity Category 1 (<36 per square mile) 0.0200 0.014
Sparsity Category 2 (36 to 54.9 per square mile) -0.0127 0.0118
Sparsity Category 3 (55 to 99.9 per square mile) -0.00228 0.0137
Constant -0.0543 0.0191
N 218
R squared 0.718

Study of Pupil Weights in Vermont’s Education Funding Formula 102
Table A.8 presents the school weight estimation model, Table A.9 shows the values used for calculating weights, and Table A.10 displays the weights calculated from the school model. Like the district model, the school model has a larger dollar value weight for economically disadvantaged students when children with disabilities are not included in the model. Table A.10 shows that this leads to a weight of 3.01 when children with disabilities are not separately included and 2.79 for economically-disadvantaged students when they are. Other weights fall in line with expectations and are generally consistent with the district-level cost models.
Table A.8. School Model Regression for Calculation of Weights
Weights Derived from Model without
Disability
Weights Derived from
Model with Disability
Coefficient Standard Error Coefficien
t
Standard
Error
Multiplicative Coefficients
Poverty Proportion 1.422 0.0221 1.378 0.0239
% Enrolled in Middle Grades 0.208 0.00701 0.204 0.00917
% Enrolled in Secondary Grades 0.125 0.00511 0.186 0.00717
Year = 2010 0.00476 0.0081 0.0142 0.00857
Year = 2011 0.0149 0.00804 0.0271 0.00851
Year = 2012 -0.0200 0.00816 -0.0145 0.00866
Year = 2013 0.0122 0.00801 0.0263 0.00849
Year = 2014 0.00723 0.00805 0.0165 0.00854
Year = 2015 -0.0426 0.00825 -0.0495 0.00883
Year = 2016 -0.0641 0.00835 -0.0769 0.00898
Year = 2017 -0.0639 0.00836 -0.0867 0.00906
Year = 2018 -0.0661 0.00837 -0.101 0.00918
Constant 8.832 0.00798 8.570 0.0123
Additive Coefficients
ELL Proportion 2,920.7 492.0 8,126.6 433.1
% Disability (Learning Disabled, Behavioral Disorders & Other Health Impairments)
16,208.
6 484.9
% Other SWD District
11,076. 6
657.6
<100 Students enrolled 1,245.5 100.6 1,345.4 83.44
100-250 Students enrolled 641.7 49.52 606.9 41.07
Sparsity
<36 Sparsity 1,170.3 68.85 1,207.4 57.31
36 to 55 Sparsity 858.8 53.59 856.8 44.59
55 to 100 Sparsity 562.6 47.31 568.4 39.26
Number of Observations 2,940 2,940
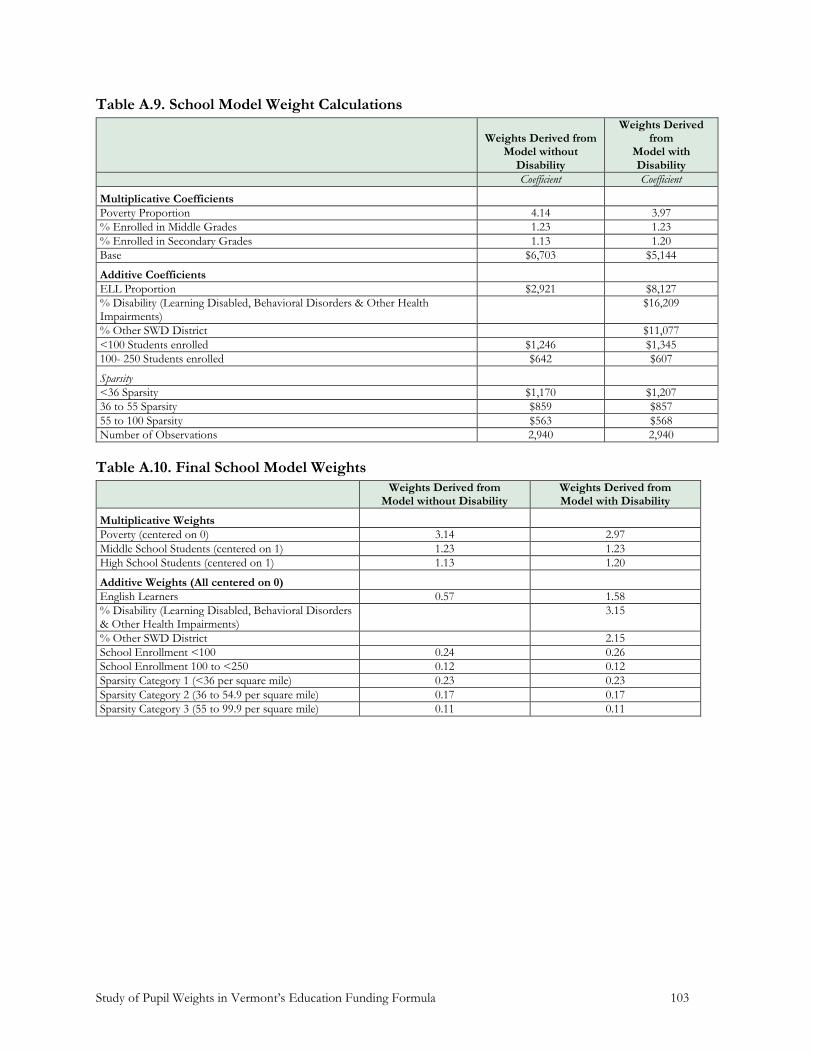
Study of Pupil Weights in Vermont’s Education Funding Formula 103
Table A.9. School Model Weight Calculations
Weights Derived from Model without
Disability
Weights Derived from
Model with Disability
Coefficient Coefficient
Multiplicative Coefficients
Poverty Proportion 4.14 3.97
% Enrolled in Middle Grades 1.23 1.23
% Enrolled in Secondary Grades 1.13 1.20
Base $6,703 $5,144
Additive Coefficients
ELL Proportion $2,921 $8,127
% Disability (Learning Disabled, Behavioral Disorders & Other Health Impairments)
$16,209
% Other SWD District $11,077
<100 Students enrolled $1,246 $1,345
100- 250 Students enrolled $642 $607
Sparsity
<36 Sparsity $1,170 $1,207
36 to 55 Sparsity $859 $857
55 to 100 Sparsity $563 $568
Number of Observations 2,940 2,940
Table A.10. Final School Model Weights
Weights Derived from Model without Disability
Weights Derived from Model with Disability
Multiplicative Weights
Poverty (centered on 0) 3.14 2.97
Middle School Students (centered on 1) 1.23 1.23
High School Students (centered on 1) 1.13 1.20
Additive Weights (All centered on 0)
English Learners 0.57 1.58
% Disability (Learning Disabled, Behavioral Disorders & Other Health Impairments)
3.15
% Other SWD District 2.15
School Enrollment <100 0.24 0.26
School Enrollment 100 to <250 0.12 0.12
Sparsity Category 1 (<36 per square mile) 0.23 0.23
Sparsity Category 2 (36 to 54.9 per square mile) 0.17 0.17
Sparsity Category 3 (55 to 99.9 per square mile) 0.11 0.11
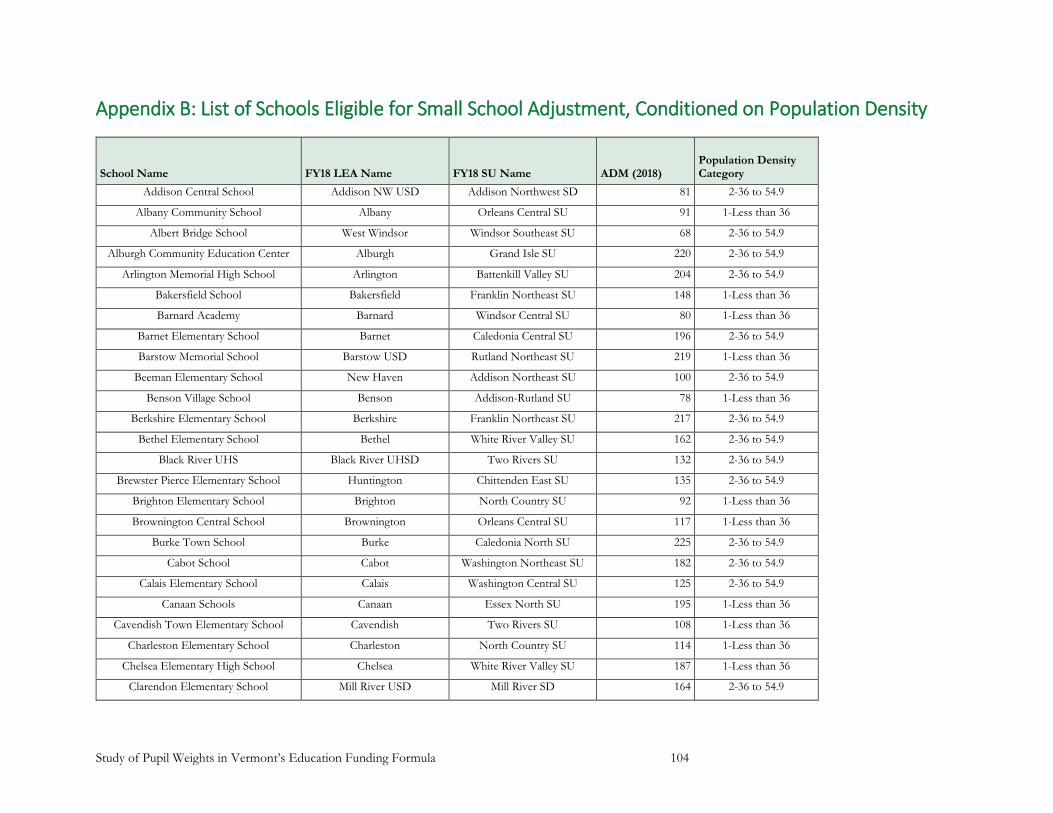
Study of Pupil Weights in Vermont’s Education Funding Formula 104
Appendix B: List of Schools Eligible for Small School Adjustment, Conditioned on Population Density
School Name FY18 LEA Name FY18 SU Name ADM (2018) Population Density Category
Addison Central School Addison NW USD Addison Northwest SD 81 2-36 to 54.9
Albany Community School Albany Orleans Central SU 91 1-Less than 36
Albert Bridge School West Windsor Windsor Southeast SU 68 2-36 to 54.9
Alburgh Community Education Center Alburgh Grand Isle SU 220 2-36 to 54.9
Arlington Memorial High School Arlington Battenkill Valley SU 204 2-36 to 54.9
Bakersfield School Bakersfield Franklin Northeast SU 148 1-Less than 36
Barnard Academy Barnard Windsor Central SU 80 1-Less than 36
Barnet Elementary School Barnet Caledonia Central SU 196 2-36 to 54.9
Barstow Memorial School Barstow USD Rutland Northeast SU 219 1-Less than 36
Beeman Elementary School New Haven Addison Northeast SU 100 2-36 to 54.9
Benson Village School Benson Addison-Rutland SU 78 1-Less than 36
Berkshire Elementary School Berkshire Franklin Northeast SU 217 2-36 to 54.9
Bethel Elementary School Bethel White River Valley SU 162 2-36 to 54.9
Black River UHS Black River UHSD Two Rivers SU 132 2-36 to 54.9
Brewster Pierce Elementary School Huntington Chittenden East SU 135 2-36 to 54.9
Brighton Elementary School Brighton North Country SU 92 1-Less than 36
Brownington Central School Brownington Orleans Central SU 117 1-Less than 36
Burke Town School Burke Caledonia North SU 225 2-36 to 54.9
Cabot School Cabot Washington Northeast SU 182 2-36 to 54.9
Calais Elementary School Calais Washington Central SU 125 2-36 to 54.9
Canaan Schools Canaan Essex North SU 195 1-Less than 36
Cavendish Town Elementary School Cavendish Two Rivers SU 108 1-Less than 36
Charleston Elementary School Charleston North Country SU 114 1-Less than 36
Chelsea Elementary High School Chelsea White River Valley SU 187 1-Less than 36
Clarendon Elementary School Mill River USD Mill River SD 164 2-36 to 54.9
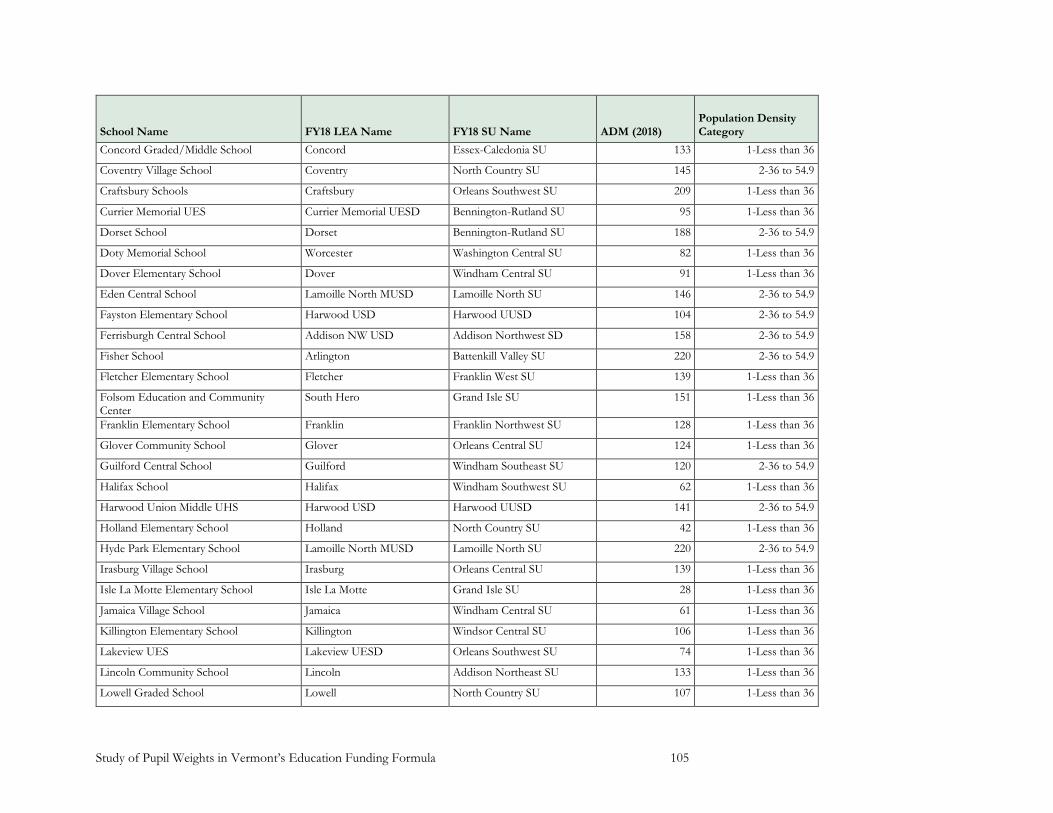
Study of Pupil Weights in Vermont’s Education Funding Formula 105
School Name FY18 LEA Name FY18 SU Name ADM (2018) Population Density Category
Concord Graded/Middle School Concord Essex-Caledonia SU 133 1-Less than 36
Coventry Village School Coventry North Country SU 145 2-36 to 54.9
Craftsbury Schools Craftsbury Orleans Southwest SU 209 1-Less than 36
Currier Memorial UES Currier Memorial UESD Bennington-Rutland SU 95 1-Less than 36
Dorset School Dorset Bennington-Rutland SU 188 2-36 to 54.9
Doty Memorial School Worcester Washington Central SU 82 1-Less than 36
Dover Elementary School Dover Windham Central SU 91 1-Less than 36
Eden Central School Lamoille North MUSD Lamoille North SU 146 2-36 to 54.9
Fayston Elementary School Harwood USD Harwood UUSD 104 2-36 to 54.9
Ferrisburgh Central School Addison NW USD Addison Northwest SD 158 2-36 to 54.9
Fisher School Arlington Battenkill Valley SU 220 2-36 to 54.9
Fletcher Elementary School Fletcher Franklin West SU 139 1-Less than 36
Folsom Education and Community Center
South Hero Grand Isle SU 151 1-Less than 36
Franklin Elementary School Franklin Franklin Northwest SU 128 1-Less than 36
Glover Community School Glover Orleans Central SU 124 1-Less than 36
Guilford Central School Guilford Windham Southeast SU 120 2-36 to 54.9
Halifax School Halifax Windham Southwest SU 62 1-Less than 36
Harwood Union Middle UHS Harwood USD Harwood UUSD 141 2-36 to 54.9
Holland Elementary School Holland North Country SU 42 1-Less than 36
Hyde Park Elementary School Lamoille North MUSD Lamoille North SU 220 2-36 to 54.9
Irasburg Village School Irasburg Orleans Central SU 139 1-Less than 36
Isle La Motte Elementary School Isle La Motte Grand Isle SU 28 1-Less than 36
Jamaica Village School Jamaica Windham Central SU 61 1-Less than 36
Killington Elementary School Killington Windsor Central SU 106 1-Less than 36
Lakeview UES Lakeview UESD Orleans Southwest SU 74 1-Less than 36
Lincoln Community School Lincoln Addison Northeast SU 133 1-Less than 36
Lowell Graded School Lowell North Country SU 107 1-Less than 36

Study of Pupil Weights in Vermont’s Education Funding Formula 106
School Name FY18 LEA Name FY18 SU Name ADM (2018) Population Density Category
Lunenburg/Gilman Schools Lunenburg Essex-Caledonia SU 146 1-Less than 36
Marlboro Elementary School Marlboro Windham Central SU 83 1-Less than 36
Mettawee Community UES Mettawee Community Sch UESD 47
Bennington-Rutland SU 190 1-Less than 36
Middletown Springs Elementary School Middletown Springs Rutland Southwest SU 70 1-Less than 36
Millers Run USD Millers Run USD Caledonia North SU 122 1-Less than 36
Monkton Central School Monkton Addison Northeast SU 156 2-36 to 54.9
Montgomery Elementary School Montgomery Franklin Northeast SU 154 1-Less than 36
Moretown Elementary School Harwood USD Harwood UUSD 144 2-36 to 54.9
Mt Holly School Mt. Holly Two Rivers SU 111 1-Less than 36
Newark School Newark Caledonia North SU 61 1-Less than 36
Newbury Elementary School Newbury Orange East SU 145 1-Less than 36
Newport Town School Newport Town North Country SU 109 2-36 to 54.9
Newton School Strafford White River Valley SU 110 1-Less than 36
North Hero School North Hero Grand Isle SU 65 1-Less than 36
Orange Center School Orange Orange North SU 104 1-Less than 36
Orwell Village School Orwell Addison-Rutland SU 142 1-Less than 36
Peacham Elementary School Peacham Caledonia Central SU 63 1-Less than 36
Reading Elementary School Reading Windsor Central SU 61 1-Less than 36
Readsboro Elementary School Readsboro Windham Southwest SU 56 1-Less than 36
Richford Elementary School Richford Franklin Northeast SU 197 2-36 to 54.9
Richford Jr/Sr High School Richford Franklin Northeast SU 227 2-36 to 54.9
Robinson Elementary School Starksboro Addison Northeast SU 157 2-36 to 54.9
Rochester School Rochester White River Valley SU 120 1-Less than 36
Roxbury Village School Roxbury Washington South SU 53 1-Less than 36
Rumney Memorial School Middlesex Washington Central SU 176 2-36 to 54.9
Samuel Morey Elementary School Rivendell UHSD Rivendell Interstate SD 169 1-Less than 36
Sharon Elementary School Sharon White River Valley SU 154 2-36 to 54.9

Study of Pupil Weights in Vermont’s Education Funding Formula 107
School Name FY18 LEA Name FY18 SU Name ADM (2018) Population Density Category
Shrewsbury Mountain School Mill River USD Mill River SD 81 2-36 to 54.9
Stamford Elementary School Stamford Windham Southwest SU 75 1-Less than 36
Stockbridge Central School Stockbridge White River Valley SU 52 1-Less than 36
Sunderland Elementary School Sunderland Bennington-Rutland SU 93 1-Less than 36
Sutton Village School Sutton Caledonia North SU 105 1-Less than 36
Tinmouth Elementary School Tinmouth Rutland Southwest SU 55 2-36 to 54.9
Townshend Village School Townshend Windham Central SU 81 1-Less than 36
Troy Elementary School Troy North Country SU 167 2-36 to 54.9
Tunbridge Central School Tunbridge White River Valley SU 133 1-Less than 36
Waitsfield Elementary School Harwood USD Harwood UUSD 136 2-36 to 54.9
Walden School Walden Caledonia Central SU 79 1-Less than 36
Wallingford Village School Mill River USD Mill River SD 159 2-36 to 54.9
Wardsboro Central School Wardsboro Windham Central SU 44 1-Less than 36
Warren Elementary School Harwood USD Harwood UUSD 168 2-36 to 54.9
Washington Village School Washington Orange North SU 92 1-Less than 36
Waterford Elementary School Waterford Essex-Caledonia SU 142 1-Less than 36
Waterville Elementary School Lamoille North MUSD Lamoille North SU 92 2-36 to 54.9
Wells Village School Wells Rutland Southwest SU 93 2-36 to 54.9
Westshire School Rivendell UHSD Rivendell Interstate SD 112 1-Less than 36
Whitcomb Jr/Sr High School Bethel White River Valley SU 97 2-36 to 54.9
Windham Elementary School Windham Windham Central SU 22 1-Less than 36
Wolcott Elementary School Wolcott Orleans Southwest SU 143 2-36 to 54.9
Woodbury Elementary School Woodbury Orleans Southwest SU 57 1-Less than 36
Woodford Hollow School Woodford Southwest Vermont SU 25 1-Less than 36
Woodstock Union Middle School Woodstock UHSD Windsor Central SU 146 1-Less than 36

Study of Pupil Weights in Vermont’s Education Funding Formula 108
Appendix C. Simulation A.1
Simulation A.1 uses the Vermont-specific school-level weights derived from estimation models, without controls for the share of SWDs.
Local Education Agency (LEA) Name
Supervisory Union (SU) Name
Long-Term Unweighted
ADM (FY2018)
Equalized Pupils (FY2018) Equalized Homestead Tax (FY2018)
Actual Estimated
Difference (Estimated vs. Actual)
Based on Actual
Spending and Actual
Equalized Pupils
Based on Actual Spending and
Estimated Equalized Pupils
Difference (Estimated vs. Actual)
Albany Orleans Central SU 86 83 108 30% 1.64 1.26 -0.38
Alburgh Grand Isle SU 293 301 373 24% 1.56 1.26 -0.30
Arlington Battenkill Valley SU 346 352 427 21% 1.70 1.40 -0.30
Athens Windham Northeast SU 63 63 85 36% 1.34 0.98 -0.35
Bakersfield Franklin Northeast SU 211 203 197 -3% 1.41 1.46 0.04
Baltimore Two Rivers SU 47 46 43 -8% 1.60 1.73 0.13
Barnard Windsor Central SU 70 59 62 5% 1.53 1.46 -0.07
Barnet Caledonia Central SU 291 284 299 5% 1.61 1.53 -0.08
Barre City Barre SU 891 873 1,076 23% 1.23 0.99 -0.23
Barre Town Barre SU 848 790 658 -17% 1.18 1.42 0.24
Barton ID Orleans Central SU 162 165 262 59% 1.36 0.85 -0.50
Bennington ID Southwest Vermont SU 966 895 1,083 21% 1.36 1.12 -0.24
Benson Addison-Rutland SU 86 83 114 37% 1.46 1.07 -0.39
Berkshire Franklin Northeast SU 311 304 295 -3% 1.36 1.40 0.04
Berlin Washington Central SU 209 187 153 -18% 1.72 2.11 0.38
Bethel White River Valley SU 273 272 347 27% 1.72 1.35 -0.37
Bloomfield Essex North SU 23 23 19 -17% 1.91 2.31 0.40
Bradford ID Orange East SU 264 244 267 9% 1.44 1.32 -0.12
Brattleboro Windham Southeast SU 734 748 941 26% 1.76 1.40 -0.36
Bridgewater Windsor Central SU 35 31 37 19% 1.72 1.45 -0.28
Brighton North Country SU 96 94 144 53% 1.57 1.03 -0.54
Bristol Addison Northeast SU 317 281 275 -2% 1.51 1.54 0.03
Brookline Windham Central SU 48 44 43 -2% 1.49 1.51 0.02
Brownington Orleans Central SU 114 112 141 26% 1.19 0.94 -0.24
Brunswick Essex North SU 10 10 9 -15% 1.85 2.18 0.33
Burke Caledonia North SU 281 287 312 9% 1.60 1.47 -0.13
Burlington Burlington SD 3,999 4,101 4,715 15% 1.48 1.28 -0.19
Cabot Washington Northeast SU 180 175 203 16% 1.74 1.49 -0.24
Calais Washington Central SU 123 111 103 -8% 1.61 1.74 0.13
Cambridge Lamoille North SU 372 332 319 -4% 1.46 1.51 0.06
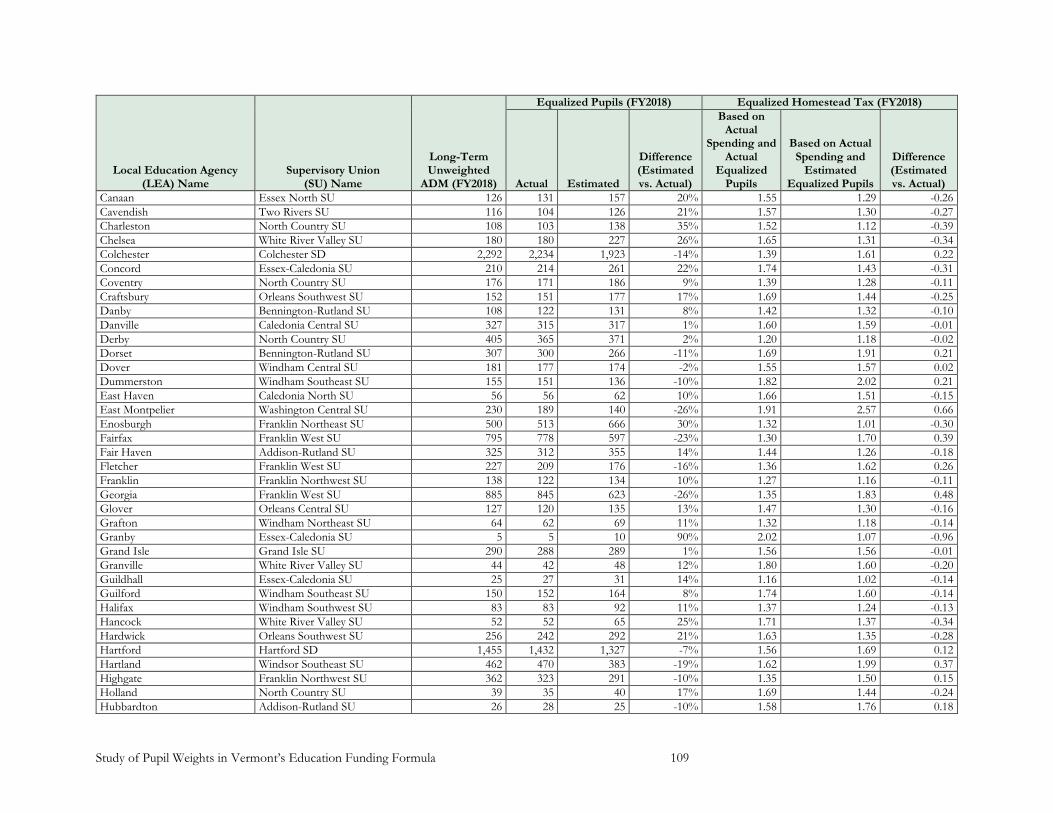
Study of Pupil Weights in Vermont’s Education Funding Formula 109
Local Education Agency (LEA) Name
Supervisory Union (SU) Name
Long-Term Unweighted
ADM (FY2018)
Equalized Pupils (FY2018) Equalized Homestead Tax (FY2018)
Actual Estimated
Difference (Estimated vs. Actual)
Based on Actual
Spending and Actual
Equalized Pupils
Based on Actual Spending and
Estimated Equalized Pupils
Difference (Estimated vs. Actual)
Canaan Essex North SU 126 131 157 20% 1.55 1.29 -0.26
Cavendish Two Rivers SU 116 104 126 21% 1.57 1.30 -0.27
Charleston North Country SU 108 103 138 35% 1.52 1.12 -0.39
Chelsea White River Valley SU 180 180 227 26% 1.65 1.31 -0.34
Colchester Colchester SD 2,292 2,234 1,923 -14% 1.39 1.61 0.22
Concord Essex-Caledonia SU 210 214 261 22% 1.74 1.43 -0.31
Coventry North Country SU 176 171 186 9% 1.39 1.28 -0.11
Craftsbury Orleans Southwest SU 152 151 177 17% 1.69 1.44 -0.25
Danby Bennington-Rutland SU 108 122 131 8% 1.42 1.32 -0.10
Danville Caledonia Central SU 327 315 317 1% 1.60 1.59 -0.01
Derby North Country SU 405 365 371 2% 1.20 1.18 -0.02
Dorset Bennington-Rutland SU 307 300 266 -11% 1.69 1.91 0.21
Dover Windham Central SU 181 177 174 -2% 1.55 1.57 0.02
Dummerston Windham Southeast SU 155 151 136 -10% 1.82 2.02 0.21
East Haven Caledonia North SU 56 56 62 10% 1.66 1.51 -0.15
East Montpelier Washington Central SU 230 189 140 -26% 1.91 2.57 0.66
Enosburgh Franklin Northeast SU 500 513 666 30% 1.32 1.01 -0.30
Fairfax Franklin West SU 795 778 597 -23% 1.30 1.70 0.39
Fair Haven Addison-Rutland SU 325 312 355 14% 1.44 1.26 -0.18
Fletcher Franklin West SU 227 209 176 -16% 1.36 1.62 0.26
Franklin Franklin Northwest SU 138 122 134 10% 1.27 1.16 -0.11
Georgia Franklin West SU 885 845 623 -26% 1.35 1.83 0.48
Glover Orleans Central SU 127 120 135 13% 1.47 1.30 -0.16
Grafton Windham Northeast SU 64 62 69 11% 1.32 1.18 -0.14
Granby Essex-Caledonia SU 5 5 10 90% 2.02 1.07 -0.96
Grand Isle Grand Isle SU 290 288 289 1% 1.56 1.56 -0.01
Granville White River Valley SU 44 42 48 12% 1.80 1.60 -0.20
Guildhall Essex-Caledonia SU 25 27 31 14% 1.16 1.02 -0.14
Guilford Windham Southeast SU 150 152 164 8% 1.74 1.60 -0.14
Halifax Windham Southwest SU 83 83 92 11% 1.37 1.24 -0.13
Hancock White River Valley SU 52 52 65 25% 1.71 1.37 -0.34
Hardwick Orleans Southwest SU 256 242 292 21% 1.63 1.35 -0.28
Hartford Hartford SD 1,455 1,432 1,327 -7% 1.56 1.69 0.12
Hartland Windsor Southeast SU 462 470 383 -19% 1.62 1.99 0.37
Highgate Franklin Northwest SU 362 323 291 -10% 1.35 1.50 0.15
Holland North Country SU 39 35 40 17% 1.69 1.44 -0.24
Hubbardton Addison-Rutland SU 26 28 25 -10% 1.58 1.76 0.18

Study of Pupil Weights in Vermont’s Education Funding Formula 110
Local Education Agency (LEA) Name
Supervisory Union (SU) Name
Long-Term Unweighted
ADM (FY2018)
Equalized Pupils (FY2018) Equalized Homestead Tax (FY2018)
Actual Estimated
Difference (Estimated vs. Actual)
Based on Actual
Spending and Actual
Equalized Pupils
Based on Actual Spending and
Estimated Equalized Pupils
Difference (Estimated vs. Actual)
Huntington Chittenden East SU 148 121 116 -5% 1.53 1.60 0.07
Ira Rutland Southwest SU 45 44 36 -17% 1.39 1.69 0.29
Irasburg Orleans Central SU 138 130 158 21% 1.28 1.06 -0.22
Isle La Motte Grand Isle SU 60 62 83 34% 1.54 1.15 -0.39
Jamaica Windham Central SU 61 55 72 31% 1.67 1.27 -0.40
Jay North Country SU 53 49 57 17% 1.66 1.41 -0.24
Kirby Essex-Caledonia SU 87 86 75 -13% 1.56 1.80 0.24
Lemington Essex North SU 16 16 13 -17% 2.08 2.51 0.43
Lincoln Addison Northeast SU 139 121 117 -3% 1.67 1.73 0.06
Lowell North Country SU 113 108 141 30% 1.27 0.98 -0.29
Ludlow Two Rivers SU 116 102 102 -1% 1.71 1.72 0.01
Lunenburg Essex-Caledonia SU 181 185 231 25% 1.39 1.11 -0.28
Lyndon Caledonia North SU 694 681 665 -2% 1.50 1.54 0.04
Maidstone Essex-Caledonia SU 14 14 17 20% 1.32 1.10 -0.22
Manchester Bennington-Rutland SU 612 601 480 -20% 1.66 2.08 0.42
Marlboro Windham Central SU 135 135 156 16% 1.66 1.43 -0.23
Middlesex Washington Central SU 197 169 149 -12% 1.73 1.97 0.24
Middletown Springs Rutland Southwest SU 123 121 133 10% 1.55 1.41 -0.14
Milton Milton SD 1,636 1,607 1,396 -13% 1.44 1.65 0.22
Monkton Addison Northeast SU 181 155 137 -12% 1.57 1.79 0.21
Montgomery Franklin Northeast SU 193 188 210 12% 1.27 1.13 -0.14
Montpelier Montpelier SD 1,127 1,079 971 -10% 1.53 1.70 0.17
Morgan North Country SU 39 35 38 8% 1.18 1.09 -0.09
Mt. Holly Two Rivers SU 101 84 87 4% 1.58 1.52 -0.06
Mt. Tabor Bennington-Rutland SU 12 13 11 -14% 0.99 1.15 0.15
Newark Caledonia North SU 78 78 83 6% 1.63 1.53 -0.09
Newbury Orange East SU 147 142 175 23% 1.27 1.03 -0.24
Newfane Windham Central SU 101 89 105 18% 1.49 1.26 -0.23
New Haven Addison Northeast SU 115 104 99 -5% 1.40 1.47 0.07
Newport City North Country SU 354 330 399 21% 1.38 1.14 -0.24
Newport Town North Country SU 140 135 156 16% 1.56 1.35 -0.21
North Bennington ID Southwest Vermont SU 162 140 141 1% 1.68 1.67 -0.02
Northfield Washington South SU 560 578 557 -4% 1.52 1.58 0.06
North Hero Grand Isle SU 126 105 103 -1% 1.21 1.23 0.02
Norton Essex North SU 12 12 13 11% 1.92 1.72 -0.20
Norwich Dresden Interstate SD 623 601 400 -33% 1.80 2.70 0.90
Orange Orange North SU 167 164 162 -1% 1.37 1.39 0.01

Study of Pupil Weights in Vermont’s Education Funding Formula 111
Local Education Agency (LEA) Name
Supervisory Union (SU) Name
Long-Term Unweighted
ADM (FY2018)
Equalized Pupils (FY2018) Equalized Homestead Tax (FY2018)
Actual Estimated
Difference (Estimated vs. Actual)
Based on Actual
Spending and Actual
Equalized Pupils
Based on Actual Spending and
Estimated Equalized Pupils
Difference (Estimated vs. Actual)
Orleans ID Orleans Central SU 111 99 89 -10% 1.27 1.41 0.14
Orwell Addison-Rutland SU 136 127 134 5% 1.35 1.29 -0.06
Pawlet Bennington-Rutland SU 116 129 129 0% 1.00 1.00 0.00
Peacham Caledonia Central SU 95 91 88 -4% 1.84 1.92 0.08
Pittsfield Windsor Central SU 70 70 70 0% 1.35 1.35 0.00
Plymouth Two Rivers SU 49 48 40 -17% 1.78 2.14 0.36
Pomfret Windsor Central SU 56 50 43 -14% 1.41 1.63 0.22
Poultney Rutland Southwest SU 394 388 404 4% 1.50 1.44 -0.06
Pownal Southwest Vermont SU 260 251 284 13% 1.56 1.38 -0.18
Proctor Rutland Central SU 279 275 248 -10% 1.63 1.81 0.18
Putney Windham Southeast SU 178 169 193 14% 1.76 1.54 -0.22
Reading Windsor Central SU 53 46 55 18% 1.70 1.45 -0.26
Readsboro Windham Southwest SU 71 75 108 44% 1.52 1.06 -0.47
Richford Franklin Northeast SU 392 414 621 50% 1.29 0.86 -0.43
Rochester White River Valley SU 97 93 114 23% 2.10 1.70 -0.40
Rockingham Windham Northeast SU 558 532 597 12% 1.70 1.52 -0.18
Roxbury Washington South SU 91 86 94 9% 1.77 1.63 -0.14
Royalton White River Valley SU 352 346 335 -3% 1.45 1.50 0.05
Rupert Bennington-Rutland SU 35 37 28 -24% 1.08 1.41 0.34
Rutland City Rutland City SD 1,918 2,105 2,643 26% 1.48 1.18 -0.30
Rutland Town Rutland Central SU 504 503 405 -19% 1.45 1.81 0.35
St. Johnsbury St. Johnsbury SD 1,108 1,138 1,280 12% 1.30 1.16 -0.14
Sandgate Battenkill Valley SU 64 58 51 -13% 1.61 1.85 0.23
Searsburg Windham Southwest SU 22 24 36 51% 1.34 0.89 -0.45
Shaftsbury Southwest Vermont SU 270 248 239 -3% 1.39 1.44 0.05
Sharon White River Valley SU 258 250 248 -1% 1.53 1.54 0.01
Sheldon Franklin Northwest SU 399 389 362 -7% 1.29 1.39 0.09
Killington Windsor Central SU 52 52 59 13% 1.73 1.53 -0.20
South Burlington South Burlington SD 2,474 2,417 2,054 -15% 1.52 1.78 0.27
South Hero Grand Isle SU 208 205 203 -1% 1.52 1.54 0.01
Springfield Springfield SD 1,304 1,314 1,438 9% 1.63 1.49 -0.14
Stamford Windham Southwest SU 108 109 112 3% 1.30 1.26 -0.04
Stannard Orleans Southwest SU 27 26 22 -16% 1.43 1.71 0.28
Starksboro Addison Northeast SU 183 162 166 3% 1.54 1.51 -0.04
Stockbridge White River Valley SU 89 89 97 9% 1.65 1.52 -0.13
Stowe Lamoille South SU 775 745 594 -20% 1.48 1.85 0.38
Strafford White River Valley SU 180 179 172 -4% 1.61 1.67 0.07
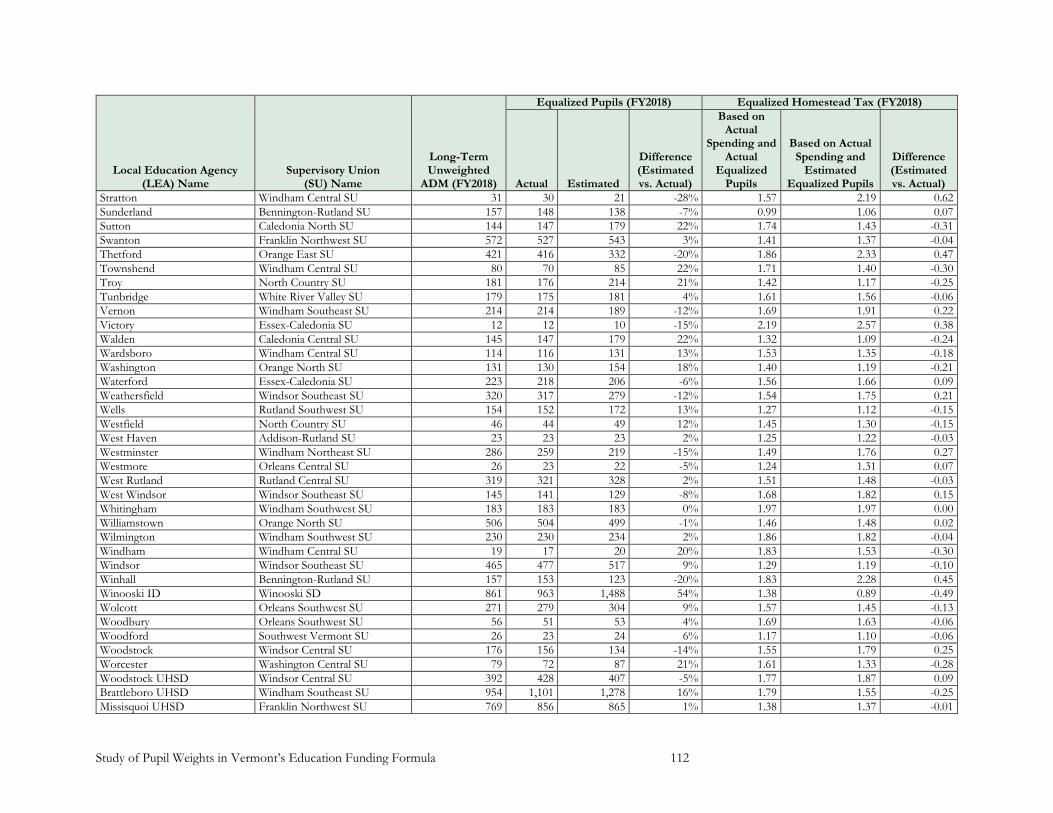
Study of Pupil Weights in Vermont’s Education Funding Formula 112
Local Education Agency (LEA) Name
Supervisory Union (SU) Name
Long-Term Unweighted
ADM (FY2018)
Equalized Pupils (FY2018) Equalized Homestead Tax (FY2018)
Actual Estimated
Difference (Estimated vs. Actual)
Based on Actual
Spending and Actual
Equalized Pupils
Based on Actual Spending and
Estimated Equalized Pupils
Difference (Estimated vs. Actual)
Stratton Windham Central SU 31 30 21 -28% 1.57 2.19 0.62
Sunderland Bennington-Rutland SU 157 148 138 -7% 0.99 1.06 0.07
Sutton Caledonia North SU 144 147 179 22% 1.74 1.43 -0.31
Swanton Franklin Northwest SU 572 527 543 3% 1.41 1.37 -0.04
Thetford Orange East SU 421 416 332 -20% 1.86 2.33 0.47
Townshend Windham Central SU 80 70 85 22% 1.71 1.40 -0.30
Troy North Country SU 181 176 214 21% 1.42 1.17 -0.25
Tunbridge White River Valley SU 179 175 181 4% 1.61 1.56 -0.06
Vernon Windham Southeast SU 214 214 189 -12% 1.69 1.91 0.22
Victory Essex-Caledonia SU 12 12 10 -15% 2.19 2.57 0.38
Walden Caledonia Central SU 145 147 179 22% 1.32 1.09 -0.24
Wardsboro Windham Central SU 114 116 131 13% 1.53 1.35 -0.18
Washington Orange North SU 131 130 154 18% 1.40 1.19 -0.21
Waterford Essex-Caledonia SU 223 218 206 -6% 1.56 1.66 0.09
Weathersfield Windsor Southeast SU 320 317 279 -12% 1.54 1.75 0.21
Wells Rutland Southwest SU 154 152 172 13% 1.27 1.12 -0.15
Westfield North Country SU 46 44 49 12% 1.45 1.30 -0.15
West Haven Addison-Rutland SU 23 23 23 2% 1.25 1.22 -0.03
Westminster Windham Northeast SU 286 259 219 -15% 1.49 1.76 0.27
Westmore Orleans Central SU 26 23 22 -5% 1.24 1.31 0.07
West Rutland Rutland Central SU 319 321 328 2% 1.51 1.48 -0.03
West Windsor Windsor Southeast SU 145 141 129 -8% 1.68 1.82 0.15
Whitingham Windham Southwest SU 183 183 183 0% 1.97 1.97 0.00
Williamstown Orange North SU 506 504 499 -1% 1.46 1.48 0.02
Wilmington Windham Southwest SU 230 230 234 2% 1.86 1.82 -0.04
Windham Windham Central SU 19 17 20 20% 1.83 1.53 -0.30
Windsor Windsor Southeast SU 465 477 517 9% 1.29 1.19 -0.10
Winhall Bennington-Rutland SU 157 153 123 -20% 1.83 2.28 0.45
Winooski ID Winooski SD 861 963 1,488 54% 1.38 0.89 -0.49
Wolcott Orleans Southwest SU 271 279 304 9% 1.57 1.45 -0.13
Woodbury Orleans Southwest SU 56 51 53 4% 1.69 1.63 -0.06
Woodford Southwest Vermont SU 26 23 24 6% 1.17 1.10 -0.06
Woodstock Windsor Central SU 176 156 134 -14% 1.55 1.79 0.25
Worcester Washington Central SU 79 72 87 21% 1.61 1.33 -0.28
Woodstock UHSD Windsor Central SU 392 428 407 -5% 1.77 1.87 0.09
Brattleboro UHSD Windham Southeast SU 954 1,101 1,278 16% 1.79 1.55 -0.25
Missisquoi UHSD Franklin Northwest SU 769 856 865 1% 1.38 1.37 -0.01

Study of Pupil Weights in Vermont’s Education Funding Formula 113
Local Education Agency (LEA) Name
Supervisory Union (SU) Name
Long-Term Unweighted
ADM (FY2018)
Equalized Pupils (FY2018) Equalized Homestead Tax (FY2018)
Actual Estimated
Difference (Estimated vs. Actual)
Based on Actual
Spending and Actual
Equalized Pupils
Based on Actual Spending and
Estimated Equalized Pupils
Difference (Estimated vs. Actual)
Mt. Anthony UHSD Southwest Vermont SU 1,479 1,681 1,971 17% 1.43 1.22 -0.21
Fair Haven UHSD Addison-Rutland SU 414 466 504 8% 1.48 1.37 -0.11
Blue Mountain USD Blue Mountain Union SD 405 402 435 8% 1.60 1.48 -0.12
North Country Jr UHSD North Country SU 227 257 301 17% 1.48 1.26 -0.22
North Country Sr UHSD North Country SU 712 804 890 11% 1.47 1.33 -0.14
Currier Memorial UESD Bennington-Rutland SU 104 94 120 28% 1.61 1.25 -0.35
Lake Region UHSD Orleans Central SU 324 370 444 20% 1.46 1.22 -0.24
Hazen UHSD Orleans Southwest SU 317 360 422 17% 1.69 1.44 -0.25
Bellows Falls UHSD Windham Northeast SU 363 408 428 5% 1.59 1.52 -0.07
Mt. Abraham UHSD Addison Northeast SU 650 709 649 -9% 1.71 1.87 0.16
Chester-Andover UESD Two Rivers SU 195 194 219 13% 1.64 1.45 -0.19
Oxbow UHSD Orange East SU 273 307 341 11% 1.57 1.42 -0.15
U-32 UHSD Washington Central SU 683 736 601 -18% 1.71 2.09 0.38
Twinfield USD Washington Northeast SU 368 375 416 11% 1.73 1.55 -0.17
Leland & Gray UHSD Windham Central SU 247 276 296 7% 1.85 1.72 -0.13
Green Mt. Union UHSD Two Rivers SU 293 331 369 12% 1.48 1.33 -0.16
Waits River Valley USD Orange East SU 343 352 404 15% 1.49 1.30 -0.19
Millers Run USD Caledonia North SU 178 178 202 14% 1.73 1.52 -0.21
Black River UHSD Two Rivers SU 161 177 183 3% 1.69 1.65 -0.05
Spaulding HSUD Barre SU 675 761 758 0% 1.31 1.32 0.01
Castleton-Hubbardton UESD Addison-Rutland SU 355 344 358 4% 1.59 1.53 -0.06
Lakeview UESD Orleans Southwest SU 73 74 99 34% 1.70 1.27 -0.43
Mettawee Community Sch UESD 47
Bennington-Rutland SU 200 175 192 10% 1.59 1.45 -0.14
Barstow USD Rutland Northeast SU 319 309 298 -4% 1.50 1.55 0.06
Elmore-Morristown USD Lamoille South SU 905 892 911 2% 1.42 1.39 -0.03
Essex Westford EC USD Essex Westford SD 3,831 3,748 3,011 -20% 1.60 1.99 0.39
Mill River USD Mill River SD 813 791 810 2% 1.58 1.54 -0.04
Otter Valley USD Rutland Northeast SU 1,295 1,288 1,444 12% 1.46 1.30 -0.16
Addison NW USD Addison Northwest SD 1,004 996 983 -1% 1.77 1.80 0.02
Addison Central USD Addison Central SD 1,764 1,764 1,627 -8% 1.70 1.84 0.14
Champlain Valley USD Champlain Valley SD 4,221 4,056 3,058 -25% 1.52 2.01 0.50
Maple Run USD Maple Run USD 2,545 2,529 2,484 -2% 1.48 1.50 0.03
Lamoille North MUSD Lamoille North SU 741 672 786 17% 1.56 1.33 -0.23
Lamoille North MUSD Lamoille North SU 708 790 842 7% 1.54 1.45 -0.09
Orange Southwest USD Orange Southwest USD 835 874 958 10% 1.53 1.39 -0.13
Harwood USD Harwood UUSD 1,929 1,828 1,596 -13% 1.65 1.89 0.24

Study of Pupil Weights in Vermont’s Education Funding Formula 114
Local Education Agency (LEA) Name
Supervisory Union (SU) Name
Long-Term Unweighted
ADM (FY2018)
Equalized Pupils (FY2018) Equalized Homestead Tax (FY2018)
Actual Estimated
Difference (Estimated vs. Actual)
Based on Actual
Spending and Actual
Equalized Pupils
Based on Actual Spending and
Estimated Equalized Pupils
Difference (Estimated vs. Actual)
Rivendell UHSD Rivendell Interstate SD 319 306 329 7% 1.87 1.74 -0.13
Mountain Towns Red USD Bennington-Rutland SU 473 456 413 -9% 1.43 1.58 0.15
Mt. Mansfield MUSD #401A Chittenden East SU 951 784 631 -20% 1.54 1.91 0.37
Mt. Mansfield MUSD #401B Chittenden East SU 1,526 1,590 1,207 -24% 1.51 1.98 0.48

Study of Pupil Weights in Vermont’s Education Funding Formula 115
Appendix D. Simulation B.1
Simulation B.1 uses the Vermont-specific school-level weights derived from estimation models, with controls for the share of SWDs.
Local Education Agency (LEA) Name
Supervisory Union (SU) Name
Long-Term Unweighted
ADM (FY2018)
Equalized Pupils (FY2018) Equalized Homestead Tax (FY2018)
Actual Estimated
Difference (Estimated vs. Actual)
Based on Actual
Spending and Actual
Equalized Pupils
Based on Actual Spending and
Estimated Equalized Pupils
Difference (Estimated vs. Actual)
Albany Orleans Central SU 86 83 106 28% 1.64 1.28 -0.36
Alburgh Grand Isle SU 293 301 362 20% 1.56 1.29 -0.26
Arlington Battenkill Valley SU 346 352 422 20% 1.70 1.42 -0.28
Athens Windham Northeast SU 63 63 84 33% 1.34 1.00 -0.33
Bakersfield Franklin Northeast SU 211 203 193 -5% 1.41 1.48 0.07
Baltimore Two Rivers SU 47 46 42 -8% 1.60 1.74 0.14
Barnard Windsor Central SU 70 59 62 5% 1.53 1.47 -0.07
Barnet Caledonia Central SU 291 284 292 3% 1.61 1.57 -0.05
Barre City Barre SU 891 873 1,047 20% 1.23 1.02 -0.20
Barre Town Barre SU 848 790 648 -18% 1.18 1.44 0.26
Barton ID Orleans Central SU 162 165 251 52% 1.36 0.89 -0.47
Bennington ID Southwest Vermont SU 966 895 1,045 17% 1.36 1.17 -0.20
Benson Addison-Rutland SU 86 83 112 34% 1.46 1.09 -0.37
Berkshire Franklin Northeast SU 311 304 290 -5% 1.36 1.42 0.07
Berlin Washington Central SU 209 187 150 -19% 1.72 2.14 0.41
Bethel White River Valley SU 273 272 343 26% 1.72 1.37 -0.35
Bloomfield Essex North SU 23 23 19 -17% 1.91 2.31 0.40
Bradford ID Orange East SU 264 244 259 6% 1.44 1.36 -0.08
Brattleboro Windham Southeast SU 734 748 918 23% 1.76 1.43 -0.33
Bridgewater Windsor Central SU 35 31 37 18% 1.72 1.46 -0.26
Brighton North Country SU 96 94 140 49% 1.57 1.05 -0.51
Bristol Addison Northeast SU 317 281 268 -5% 1.51 1.58 0.07
Brookline Windham Central SU 48 44 43 -2% 1.49 1.52 0.03
Brownington Orleans Central SU 114 112 137 22% 1.19 0.97 -0.22
Brunswick Essex North SU 10 10 9 -16% 1.85 2.19 0.34
Burke Caledonia North SU 281 287 305 7% 1.60 1.50 -0.10
Burlington Burlington SD 3,999 4,101 4,943 21% 1.48 1.22 -0.25
Cabot Washington Northeast SU 180 175 201 15% 1.74 1.51 -0.23
Calais Washington Central SU 123 111 101 -9% 1.61 1.77 0.16
Cambridge Lamoille North SU 372 332 311 -6% 1.46 1.55 0.10

Study of Pupil Weights in Vermont’s Education Funding Formula 116
Local Education Agency (LEA) Name
Supervisory Union (SU) Name
Long-Term Unweighted
ADM (FY2018)
Equalized Pupils (FY2018) Equalized Homestead Tax (FY2018)
Actual Estimated
Difference (Estimated vs. Actual)
Based on Actual
Spending and Actual
Equalized Pupils
Based on Actual Spending and
Estimated Equalized Pupils
Difference (Estimated vs. Actual)
Canaan Essex North SU 126 131 156 19% 1.55 1.30 -0.25
Cavendish Two Rivers SU 116 104 123 18% 1.57 1.33 -0.24
Charleston North Country SU 108 103 134 31% 1.52 1.16 -0.36
Chelsea White River Valley SU 180 180 226 25% 1.65 1.32 -0.33
Colchester Colchester SD 2,292 2,234 1,949 -13% 1.39 1.59 0.20
Concord Essex-Caledonia SU 210 214 253 18% 1.74 1.47 -0.27
Coventry North Country SU 176 171 181 6% 1.39 1.31 -0.08
Craftsbury Orleans Southwest SU 152 151 177 17% 1.69 1.44 -0.25
Danby Bennington-Rutland SU 108 122 129 6% 1.42 1.34 -0.08
Danville Caledonia Central SU 327 315 315 0% 1.60 1.60 0.00
Derby North Country SU 405 365 361 -1% 1.20 1.22 0.01
Dorset Bennington-Rutland SU 307 300 263 -12% 1.69 1.93 0.24
Dover Windham Central SU 181 177 173 -2% 1.55 1.58 0.03
Dummerston Windham Southeast SU 155 151 133 -12% 1.82 2.07 0.25
East Haven Caledonia North SU 56 56 61 9% 1.66 1.53 -0.13
East Montpelier Washington Central SU 230 189 138 -27% 1.91 2.61 0.69
Enosburgh Franklin Northeast SU 500 513 663 29% 1.32 1.02 -0.30
Fairfax Franklin West SU 795 778 600 -23% 1.30 1.69 0.39
Fair Haven Addison-Rutland SU 325 312 344 10% 1.44 1.30 -0.14
Fletcher Franklin West SU 227 209 174 -17% 1.36 1.64 0.28
Franklin Franklin Northwest SU 138 122 131 7% 1.27 1.19 -0.09
Georgia Franklin West SU 885 845 617 -27% 1.35 1.85 0.50
Glover Orleans Central SU 127 120 132 10% 1.47 1.33 -0.13
Grafton Windham Northeast SU 64 62 68 10% 1.32 1.20 -0.12
Granby Essex-Caledonia SU 5 5 10 84% 2.02 1.10 -0.92
Grand Isle Grand Isle SU 290 288 282 -2% 1.56 1.60 0.03
Granville White River Valley SU 44 42 47 11% 1.80 1.62 -0.18
Guildhall Essex-Caledonia SU 25 27 30 12% 1.16 1.03 -0.13
Guilford Windham Southeast SU 150 152 160 6% 1.74 1.64 -0.09
Halifax Windham Southwest SU 83 83 91 9% 1.37 1.26 -0.12
Hancock White River Valley SU 52 52 64 23% 1.71 1.39 -0.31
Hardwick Orleans Southwest SU 256 242 283 17% 1.63 1.40 -0.23
Hartford Hartford SD 1,455 1,432 1,330 -7% 1.56 1.68 0.12
Hartland Windsor Southeast SU 462 470 375 -20% 1.62 2.03 0.41
Highgate Franklin Northwest SU 362 323 287 -11% 1.35 1.52 0.17
Holland North Country SU 39 35 40 15% 1.69 1.46 -0.23
Hubbardton Addison-Rutland SU 26 28 25 -11% 1.58 1.77 0.19

Study of Pupil Weights in Vermont’s Education Funding Formula 117
Local Education Agency (LEA) Name
Supervisory Union (SU) Name
Long-Term Unweighted
ADM (FY2018)
Equalized Pupils (FY2018) Equalized Homestead Tax (FY2018)
Actual Estimated
Difference (Estimated vs. Actual)
Based on Actual
Spending and Actual
Equalized Pupils
Based on Actual Spending and
Estimated Equalized Pupils
Difference (Estimated vs. Actual)
Huntington Chittenden East SU 148 121 113 -6% 1.53 1.63 0.10
Ira Rutland Southwest SU 45 44 36 -17% 1.39 1.69 0.29
Irasburg Orleans Central SU 138 130 154 18% 1.28 1.09 -0.20
Isle La Motte Grand Isle SU 60 62 81 31% 1.54 1.17 -0.36
Jamaica Windham Central SU 61 55 71 29% 1.67 1.29 -0.38
Jay North Country SU 53 49 56 16% 1.66 1.43 -0.23
Kirby Essex-Caledonia SU 87 86 74 -14% 1.56 1.81 0.25
Lemington Essex North SU 16 16 13 -17% 2.08 2.51 0.43
Lincoln Addison Northeast SU 139 121 116 -5% 1.67 1.75 0.08
Lowell North Country SU 113 108 136 26% 1.27 1.01 -0.26
Ludlow Two Rivers SU 116 102 100 -2% 1.71 1.75 0.04
Lunenburg Essex-Caledonia SU 181 185 224 21% 1.39 1.14 -0.25
Lyndon Caledonia North SU 694 681 648 -5% 1.50 1.58 0.08
Maidstone Essex-Caledonia SU 14 14 17 18% 1.32 1.12 -0.20
Manchester Bennington-Rutland SU 612 601 473 -21% 1.66 2.11 0.45
Marlboro Windham Central SU 135 135 154 14% 1.66 1.46 -0.21
Middlesex Washington Central SU 197 169 148 -12% 1.73 1.98 0.25
Middletown Springs Rutland Southwest SU 123 121 131 8% 1.55 1.43 -0.12
Milton Milton SD 1,636 1,607 1,393 -13% 1.44 1.66 0.22
Monkton Addison Northeast SU 181 155 135 -13% 1.57 1.81 0.23
Montgomery Franklin Northeast SU 193 188 205 9% 1.27 1.16 -0.11
Montpelier Montpelier SD 1,127 1,079 983 -9% 1.53 1.68 0.15
Morgan North Country SU 39 35 38 7% 1.18 1.10 -0.08
Mt. Holly Two Rivers SU 101 84 86 3% 1.58 1.54 -0.04
Mt. Tabor Bennington-Rutland SU 12 13 11 -14% 0.99 1.15 0.16
Newark Caledonia North SU 78 78 82 5% 1.63 1.55 -0.08
Newbury Orange East SU 147 142 171 20% 1.27 1.06 -0.22
Newfane Windham Central SU 101 89 104 17% 1.49 1.28 -0.21
New Haven Addison Northeast SU 115 104 97 -6% 1.40 1.50 0.10
Newport City North Country SU 354 330 384 17% 1.38 1.18 -0.20
Newport Town North Country SU 140 135 151 12% 1.56 1.39 -0.17
North Bennington ID Southwest Vermont SU 162 140 139 0% 1.68 1.68 0.00
Northfield Washington South SU 560 578 552 -4% 1.52 1.59 0.07
North Hero Grand Isle SU 126 105 105 0% 1.21 1.21 0.00
Norton Essex North SU 12 12 13 10% 1.92 1.75 -0.17
Norwich Dresden Interstate SD 623 601 396 -34% 1.80 2.73 0.93
Orange Orange North SU 167 164 159 -3% 1.37 1.42 0.04

Study of Pupil Weights in Vermont’s Education Funding Formula 118
Local Education Agency (LEA) Name
Supervisory Union (SU) Name
Long-Term Unweighted
ADM (FY2018)
Equalized Pupils (FY2018) Equalized Homestead Tax (FY2018)
Actual Estimated
Difference (Estimated vs. Actual)
Based on Actual
Spending and Actual
Equalized Pupils
Based on Actual Spending and
Estimated Equalized Pupils
Difference (Estimated vs. Actual)
Orleans ID Orleans Central SU 111 99 87 -12% 1.27 1.45 0.17
Orwell Addison-Rutland SU 136 127 131 3% 1.35 1.31 -0.04
Pawlet Bennington-Rutland SU 116 129 127 -1% 1.00 1.01 0.01
Peacham Caledonia Central SU 95 91 87 -4% 1.84 1.93 0.08
Pittsfield Windsor Central SU 70 70 69 -1% 1.35 1.36 0.01
Plymouth Two Rivers SU 49 48 40 -17% 1.78 2.14 0.37
Pomfret Windsor Central SU 56 50 44 -11% 1.41 1.58 0.17
Poultney Rutland Southwest SU 394 388 399 3% 1.50 1.46 -0.04
Pownal Southwest Vermont SU 260 251 275 10% 1.56 1.42 -0.14
Proctor Rutland Central SU 279 275 246 -11% 1.63 1.82 0.19
Putney Windham Southeast SU 178 169 187 11% 1.76 1.59 -0.17
Reading Windsor Central SU 53 46 54 16% 1.70 1.46 -0.24
Readsboro Windham Southwest SU 71 75 105 40% 1.52 1.09 -0.44
Richford Franklin Northeast SU 392 414 610 47% 1.29 0.88 -0.42
Rochester White River Valley SU 97 93 112 21% 2.10 1.73 -0.36
Rockingham Windham Northeast SU 558 532 578 9% 1.70 1.57 -0.13
Roxbury Washington South SU 91 86 93 8% 1.77 1.65 -0.13
Royalton White River Valley SU 352 346 332 -4% 1.45 1.51 0.06
Rupert Bennington-Rutland SU 35 37 28 -24% 1.08 1.41 0.34
Rutland City Rutland City SD 1,918 2,105 2,615 24% 1.48 1.19 -0.29
Rutland Town Rutland Central SU 504 503 396 -21% 1.45 1.85 0.39
St. Johnsbury St. Johnsbury SD 1,108 1,138 1,234 8% 1.30 1.20 -0.10
Sandgate Battenkill Valley SU 64 58 51 -13% 1.61 1.85 0.23
Searsburg Windham Southwest SU 22 24 35 48% 1.34 0.91 -0.43
Shaftsbury Southwest Vermont SU 270 248 233 -6% 1.39 1.48 0.09
Sharon White River Valley SU 258 250 242 -3% 1.53 1.58 0.05
Sheldon Franklin Northwest SU 399 389 356 -9% 1.29 1.41 0.12
Killington Windsor Central SU 52 52 57 11% 1.73 1.56 -0.17
South Burlington South Burlington SD 2,474 2,417 2,155 -11% 1.52 1.70 0.18
South Hero Grand Isle SU 208 205 199 -3% 1.52 1.57 0.04
Springfield Springfield SD 1,304 1,314 1,424 8% 1.63 1.50 -0.13
Stamford Windham Southwest SU 108 109 111 3% 1.30 1.27 -0.03
Stannard Orleans Southwest SU 27 26 22 -17% 1.43 1.71 0.28
Starksboro Addison Northeast SU 183 162 163 1% 1.54 1.53 -0.01
Stockbridge White River Valley SU 89 89 95 7% 1.65 1.53 -0.11
Stowe Lamoille South SU 775 745 597 -20% 1.48 1.84 0.37
Strafford White River Valley SU 180 179 169 -6% 1.61 1.71 0.10

Study of Pupil Weights in Vermont’s Education Funding Formula 119
Local Education Agency (LEA) Name
Supervisory Union (SU) Name
Long-Term Unweighted
ADM (FY2018)
Equalized Pupils (FY2018) Equalized Homestead Tax (FY2018)
Actual Estimated
Difference (Estimated vs. Actual)
Based on Actual
Spending and Actual
Equalized Pupils
Based on Actual Spending and
Estimated Equalized Pupils
Difference (Estimated vs. Actual)
Stratton Windham Central SU 31 30 22 -28% 1.57 2.17 0.60
Sunderland Bennington-Rutland SU 157 148 138 -7% 0.99 1.06 0.07
Sutton Caledonia North SU 144 147 173 18% 1.74 1.47 -0.27
Swanton Franklin Northwest SU 572 527 528 0% 1.41 1.41 0.00
Thetford Orange East SU 421 416 325 -22% 1.86 2.38 0.52
Townshend Windham Central SU 80 70 84 20% 1.71 1.42 -0.29
Troy North Country SU 181 176 208 18% 1.42 1.20 -0.22
Tunbridge White River Valley SU 179 175 177 1% 1.61 1.59 -0.02
Vernon Windham Southeast SU 214 214 187 -12% 1.69 1.92 0.23
Victory Essex-Caledonia SU 12 12 10 -15% 2.19 2.58 0.39
Walden Caledonia Central SU 145 147 176 20% 1.32 1.11 -0.22
Wardsboro Windham Central SU 114 116 129 11% 1.53 1.37 -0.16
Washington Orange North SU 131 130 151 16% 1.40 1.21 -0.20
Waterford Essex-Caledonia SU 223 218 202 -7% 1.56 1.68 0.12
Weathersfield Windsor Southeast SU 320 317 272 -14% 1.54 1.79 0.25
Wells Rutland Southwest SU 154 152 169 11% 1.27 1.14 -0.13
Westfield North Country SU 46 44 48 10% 1.45 1.31 -0.13
West Haven Addison-Rutland SU 23 23 23 2% 1.25 1.23 -0.02
Westminster Windham Northeast SU 286 259 216 -17% 1.49 1.79 0.30
Westmore Orleans Central SU 26 23 22 -5% 1.24 1.31 0.07
West Rutland Rutland Central SU 319 321 323 1% 1.51 1.50 -0.01
West Windsor Windsor Southeast SU 145 141 129 -8% 1.68 1.83 0.15
Whitingham Windham Southwest SU 183 183 181 -1% 1.97 1.98 0.02
Williamstown Orange North SU 506 504 496 -2% 1.46 1.49 0.03
Wilmington Windham Southwest SU 230 230 228 -1% 1.86 1.87 0.02
Windham Windham Central SU 19 17 20 18% 1.83 1.55 -0.28
Windsor Windsor Southeast SU 465 477 513 8% 1.29 1.20 -0.09
Winhall Bennington-Rutland SU 157 153 123 -20% 1.83 2.28 0.45
Winooski ID Winooski SD 861 963 1,595 66% 1.38 0.83 -0.54
Wolcott Orleans Southwest SU 271 279 296 6% 1.57 1.48 -0.09
Woodbury Orleans Southwest SU 56 51 52 3% 1.69 1.64 -0.05
Woodford Southwest Vermont SU 26 23 24 5% 1.17 1.11 -0.05
Woodstock Windsor Central SU 176 156 133 -15% 1.55 1.82 0.27
Worcester Washington Central SU 79 72 86 20% 1.61 1.35 -0.26
Woodstock UHSD Windsor Central SU 392 428 415 -3% 1.77 1.83 0.06
Brattleboro UHSD Windham Southeast SU 954 1,101 1,298 18% 1.79 1.52 -0.27
Missisquoi UHSD Franklin Northwest SU 769 856 875 2% 1.38 1.35 -0.03

Study of Pupil Weights in Vermont’s Education Funding Formula 120
Local Education Agency (LEA) Name
Supervisory Union (SU) Name
Long-Term Unweighted
ADM (FY2018)
Equalized Pupils (FY2018) Equalized Homestead Tax (FY2018)
Actual Estimated
Difference (Estimated vs. Actual)
Based on Actual
Spending and Actual
Equalized Pupils
Based on Actual Spending and
Estimated Equalized Pupils
Difference (Estimated vs. Actual)
Mt. Anthony UHSD Southwest Vermont SU 1,479 1,681 1,974 17% 1.43 1.22 -0.21
Fair Haven UHSD Addison-Rutland SU 414 466 517 11% 1.48 1.34 -0.15
Blue Mountain USD Blue Mountain Union SD 405 402 433 8% 1.60 1.48 -0.12
North Country Jr UHSD North Country SU 227 257 291 13% 1.48 1.31 -0.18
North Country Sr UHSD North Country SU 712 804 912 13% 1.47 1.30 -0.17
Currier Memorial UESD Bennington-Rutland SU 104 94 118 26% 1.61 1.28 -0.33
Lake Region UHSD Orleans Central SU 324 370 454 23% 1.46 1.19 -0.27
Hazen UHSD Orleans Southwest SU 317 360 425 18% 1.69 1.43 -0.26
Bellows Falls UHSD Windham Northeast SU 363 408 440 8% 1.59 1.48 -0.11
Mt. Abraham UHSD Addison Northeast SU 650 709 659 -7% 1.71 1.84 0.13
Chester-Andover UESD Two Rivers SU 195 194 213 10% 1.64 1.50 -0.15
Oxbow UHSD Orange East SU 273 307 344 12% 1.57 1.40 -0.17
U-32 UHSD Washington Central SU 683 736 615 -16% 1.71 2.05 0.34
Twinfield USD Washington Northeast SU 368 375 412 10% 1.73 1.57 -0.16
Leland & Gray UHSD Windham Central SU 247 276 299 8% 1.85 1.71 -0.14
Green Mt. Union UHSD Two Rivers SU 293 331 373 13% 1.48 1.31 -0.17
Waits River Valley USD Orange East SU 343 352 392 12% 1.49 1.34 -0.15
Millers Run USD Caledonia North SU 178 178 197 11% 1.73 1.56 -0.17
Black River UHSD Two Rivers SU 161 177 186 5% 1.69 1.62 -0.08
Spaulding HSUD Barre SU 675 761 785 3% 1.31 1.27 -0.04
Castleton-Hubbardton UESD Addison-Rutland SU 355 344 349 1% 1.59 1.57 -0.02
Lakeview UESD Orleans Southwest SU 73 74 97 32% 1.70 1.28 -0.41
Mettawee Community Sch UESD 47
Bennington-Rutland SU 200 175 188 7% 1.59 1.48 -0.11
Barstow USD Rutland Northeast SU 319 309 293 -5% 1.50 1.58 0.08
Elmore-Morristown USD Lamoille South SU 905 892 906 1% 1.42 1.40 -0.02
Essex Westford EC USD Essex Westford SD 3,831 3,748 3,089 -18% 1.60 1.94 0.34
Mill River USD Mill River SD 813 791 817 3% 1.58 1.53 -0.05
Otter Valley USD Rutland Northeast SU 1,295 1,288 1,441 12% 1.46 1.30 -0.15
Addison NW USD Addison Northwest SD 1,004 996 983 -1% 1.77 1.80 0.02
Addison Central USD Addison Central SD 1,764 1,764 1,630 -8% 1.70 1.84 0.14
Champlain Valley USD Champlain Valley SD 4,221 4,056 3,113 -23% 1.52 1.98 0.46
Maple Run USD Maple Run USD 2,545 2,529 2,470 -2% 1.48 1.51 0.04
Lamoille North MUSD Lamoille North SU 741 672 766 14% 1.56 1.37 -0.19
Lamoille North MUSD Lamoille North SU 708 790 846 7% 1.54 1.44 -0.10
Orange Southwest USD Orange Southwest USD 835 874 947 8% 1.53 1.41 -0.12
Harwood USD Harwood UUSD 1,929 1,828 1,596 -13% 1.65 1.89 0.24

Study of Pupil Weights in Vermont’s Education Funding Formula 121
Local Education Agency (LEA) Name
Supervisory Union (SU) Name
Long-Term Unweighted
ADM (FY2018)
Equalized Pupils (FY2018) Equalized Homestead Tax (FY2018)
Actual Estimated
Difference (Estimated vs. Actual)
Based on Actual
Spending and Actual
Equalized Pupils
Based on Actual Spending and
Estimated Equalized Pupils
Difference (Estimated vs. Actual)
Rivendell UHSD Rivendell Interstate SD 319 306 322 5% 1.87 1.78 -0.09
Mountain Towns Red USD Bennington-Rutland SU 473 456 406 -11% 1.43 1.61 0.18
Mt. Mansfield MUSD #401A Chittenden East SU 951 784 623 -21% 1.54 1.94 0.40
Mt. Mansfield MUSD #401B Chittenden East SU 1,526 1,590 1,258 -21% 1.51 1.90 0.40
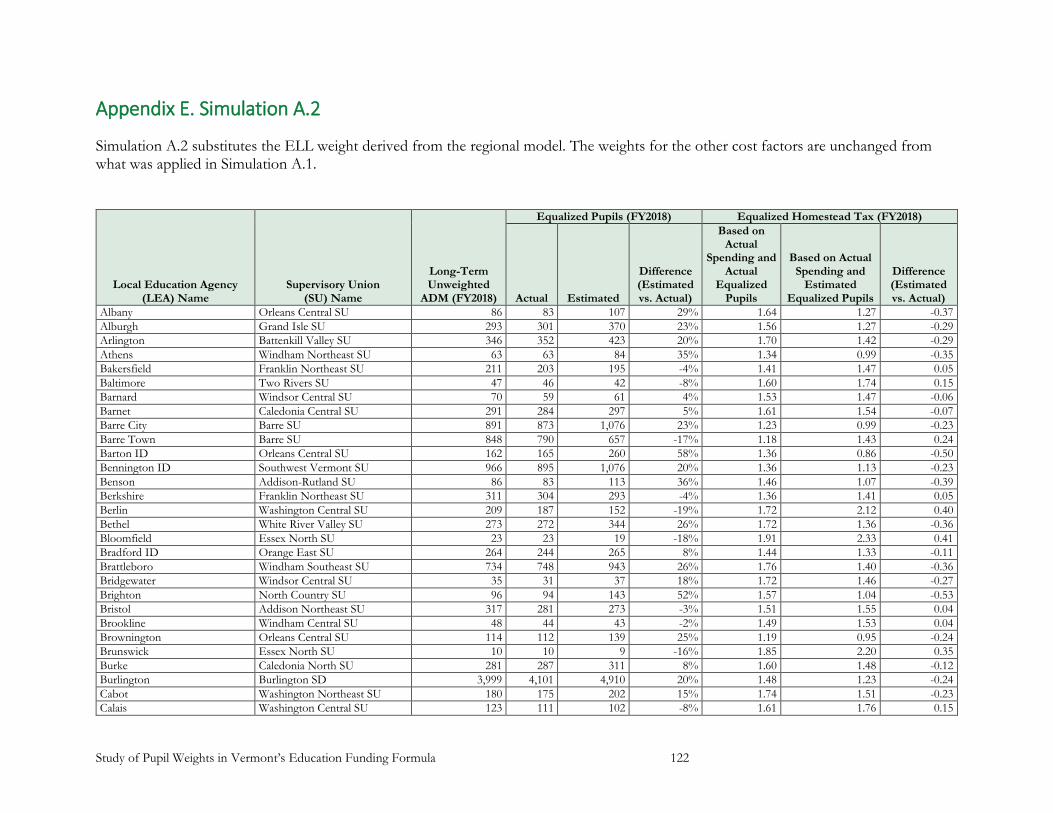
Study of Pupil Weights in Vermont’s Education Funding Formula 122
Appendix E. Simulation A.2
Simulation A.2 substitutes the ELL weight derived from the regional model. The weights for the other cost factors are unchanged from what was applied in Simulation A.1.
Local Education Agency (LEA) Name
Supervisory Union (SU) Name
Long-Term Unweighted
ADM (FY2018)
Equalized Pupils (FY2018) Equalized Homestead Tax (FY2018)
Actual Estimated
Difference (Estimated vs. Actual)
Based on Actual
Spending and Actual
Equalized Pupils
Based on Actual Spending and
Estimated Equalized Pupils
Difference (Estimated vs. Actual)
Albany Orleans Central SU 86 83 107 29% 1.64 1.27 -0.37
Alburgh Grand Isle SU 293 301 370 23% 1.56 1.27 -0.29
Arlington Battenkill Valley SU 346 352 423 20% 1.70 1.42 -0.29
Athens Windham Northeast SU 63 63 84 35% 1.34 0.99 -0.35
Bakersfield Franklin Northeast SU 211 203 195 -4% 1.41 1.47 0.05
Baltimore Two Rivers SU 47 46 42 -8% 1.60 1.74 0.15
Barnard Windsor Central SU 70 59 61 4% 1.53 1.47 -0.06
Barnet Caledonia Central SU 291 284 297 5% 1.61 1.54 -0.07
Barre City Barre SU 891 873 1,076 23% 1.23 0.99 -0.23
Barre Town Barre SU 848 790 657 -17% 1.18 1.43 0.24
Barton ID Orleans Central SU 162 165 260 58% 1.36 0.86 -0.50
Bennington ID Southwest Vermont SU 966 895 1,076 20% 1.36 1.13 -0.23
Benson Addison-Rutland SU 86 83 113 36% 1.46 1.07 -0.39
Berkshire Franklin Northeast SU 311 304 293 -4% 1.36 1.41 0.05
Berlin Washington Central SU 209 187 152 -19% 1.72 2.12 0.40
Bethel White River Valley SU 273 272 344 26% 1.72 1.36 -0.36
Bloomfield Essex North SU 23 23 19 -18% 1.91 2.33 0.41
Bradford ID Orange East SU 264 244 265 8% 1.44 1.33 -0.11
Brattleboro Windham Southeast SU 734 748 943 26% 1.76 1.40 -0.36
Bridgewater Windsor Central SU 35 31 37 18% 1.72 1.46 -0.27
Brighton North Country SU 96 94 143 52% 1.57 1.04 -0.53
Bristol Addison Northeast SU 317 281 273 -3% 1.51 1.55 0.04
Brookline Windham Central SU 48 44 43 -2% 1.49 1.53 0.04
Brownington Orleans Central SU 114 112 139 25% 1.19 0.95 -0.24
Brunswick Essex North SU 10 10 9 -16% 1.85 2.20 0.35
Burke Caledonia North SU 281 287 311 8% 1.60 1.48 -0.12
Burlington Burlington SD 3,999 4,101 4,910 20% 1.48 1.23 -0.24
Cabot Washington Northeast SU 180 175 202 15% 1.74 1.51 -0.23
Calais Washington Central SU 123 111 102 -8% 1.61 1.76 0.15

Study of Pupil Weights in Vermont’s Education Funding Formula 123
Local Education Agency (LEA) Name
Supervisory Union (SU) Name
Long-Term Unweighted
ADM (FY2018)
Equalized Pupils (FY2018) Equalized Homestead Tax (FY2018)
Actual Estimated
Difference (Estimated vs. Actual)
Based on Actual
Spending and Actual
Equalized Pupils
Based on Actual Spending and
Estimated Equalized Pupils
Difference (Estimated vs. Actual)
Cambridge Lamoille North SU 372 332 316 -5% 1.46 1.53 0.07
Canaan Essex North SU 126 131 155 19% 1.55 1.30 -0.25
Cavendish Two Rivers SU 116 104 125 21% 1.57 1.30 -0.27
Charleston North Country SU 108 103 137 34% 1.52 1.13 -0.38
Chelsea White River Valley SU 180 180 227 26% 1.65 1.31 -0.34
Colchester Colchester SD 2,292 2,234 1,936 -13% 1.39 1.60 0.21
Concord Essex-Caledonia SU 210 214 259 21% 1.74 1.44 -0.30
Coventry North Country SU 176 171 184 8% 1.39 1.29 -0.10
Craftsbury Orleans Southwest SU 152 151 177 17% 1.69 1.44 -0.24
Danby Bennington-Rutland SU 108 122 130 7% 1.42 1.33 -0.09
Danville Caledonia Central SU 327 315 314 0% 1.60 1.60 0.00
Derby North Country SU 405 365 368 1% 1.20 1.19 -0.01
Dorset Bennington-Rutland SU 307 300 265 -12% 1.69 1.92 0.23
Dover Windham Central SU 181 177 173 -2% 1.55 1.59 0.04
Dummerston Windham Southeast SU 155 151 135 -11% 1.82 2.04 0.22
East Haven Caledonia North SU 56 56 61 9% 1.66 1.52 -0.14
East Montpelier Washington Central SU 230 189 139 -26% 1.91 2.60 0.68
Enosburgh Franklin Northeast SU 500 513 661 29% 1.32 1.02 -0.29
Fairfax Franklin West SU 795 778 594 -24% 1.30 1.71 0.40
Fair Haven Addison-Rutland SU 325 312 353 13% 1.44 1.27 -0.17
Fletcher Franklin West SU 227 209 175 -17% 1.36 1.64 0.27
Franklin Franklin Northwest SU 138 122 133 9% 1.27 1.17 -0.10
Georgia Franklin West SU 885 845 620 -27% 1.35 1.85 0.49
Glover Orleans Central SU 127 120 134 12% 1.47 1.31 -0.15
Grafton Windham Northeast SU 64 62 69 11% 1.32 1.19 -0.13
Granby Essex-Caledonia SU 5 5 10 88% 2.02 1.08 -0.95
Grand Isle Grand Isle SU 290 288 288 0% 1.56 1.57 0.00
Granville White River Valley SU 44 42 47 11% 1.80 1.61 -0.18
Guildhall Essex-Caledonia SU 25 27 30 13% 1.16 1.03 -0.14
Guilford Windham Southeast SU 150 152 163 8% 1.74 1.61 -0.12
Halifax Windham Southwest SU 83 83 91 10% 1.37 1.25 -0.12
Hancock White River Valley SU 52 52 65 24% 1.71 1.38 -0.33
Hardwick Orleans Southwest SU 256 242 290 20% 1.63 1.36 -0.27
Hartford Hartford SD 1,455 1,432 1,325 -7% 1.56 1.69 0.13
Hartland Windsor Southeast SU 462 470 380 -19% 1.62 2.00 0.39
Highgate Franklin Northwest SU 362 323 290 -10% 1.35 1.50 0.15
Holland North Country SU 39 35 40 16% 1.69 1.46 -0.23

Study of Pupil Weights in Vermont’s Education Funding Formula 124
Local Education Agency (LEA) Name
Supervisory Union (SU) Name
Long-Term Unweighted
ADM (FY2018)
Equalized Pupils (FY2018) Equalized Homestead Tax (FY2018)
Actual Estimated
Difference (Estimated vs. Actual)
Based on Actual
Spending and Actual
Equalized Pupils
Based on Actual Spending and
Estimated Equalized Pupils
Difference (Estimated vs. Actual)
Hubbardton Addison-Rutland SU 26 28 25 -11% 1.58 1.78 0.19
Huntington Chittenden East SU 148 121 115 -5% 1.53 1.61 0.09
Ira Rutland Southwest SU 45 44 36 -18% 1.39 1.70 0.31
Irasburg Orleans Central SU 138 130 157 20% 1.28 1.07 -0.22
Isle La Motte Grand Isle SU 60 62 82 33% 1.54 1.16 -0.38
Jamaica Windham Central SU 61 55 71 30% 1.67 1.28 -0.39
Jay North Country SU 53 49 57 16% 1.66 1.42 -0.23
Kirby Essex-Caledonia SU 87 86 74 -14% 1.56 1.82 0.26
Lemington Essex North SU 16 16 13 -18% 2.08 2.53 0.45
Lincoln Addison Northeast SU 139 121 117 -4% 1.67 1.74 0.07
Lowell North Country SU 113 108 139 29% 1.27 0.99 -0.28
Ludlow Two Rivers SU 116 102 101 -1% 1.71 1.73 0.01
Lunenburg Essex-Caledonia SU 181 185 229 24% 1.39 1.12 -0.27
Lyndon Caledonia North SU 694 681 662 -3% 1.50 1.54 0.04
Maidstone Essex-Caledonia SU 14 14 17 19% 1.32 1.11 -0.21
Manchester Bennington-Rutland SU 612 601 479 -20% 1.66 2.08 0.42
Marlboro Windham Central SU 135 135 155 15% 1.66 1.45 -0.21
Middlesex Washington Central SU 197 169 149 -12% 1.73 1.97 0.24
Middletown Springs Rutland Southwest SU 123 121 132 9% 1.55 1.42 -0.13
Milton Milton SD 1,636 1,607 1,389 -14% 1.44 1.66 0.22
Monkton Addison Northeast SU 181 155 136 -12% 1.57 1.80 0.22
Montgomery Franklin Northeast SU 193 188 209 11% 1.27 1.14 -0.13
Montpelier Montpelier SD 1,127 1,079 977 -9% 1.53 1.69 0.16
Morgan North Country SU 39 35 38 7% 1.18 1.10 -0.08
Mt. Holly Two Rivers SU 101 84 87 4% 1.58 1.52 -0.06
Mt. Tabor Bennington-Rutland SU 12 13 11 -14% 0.99 1.16 0.16
Newark Caledonia North SU 78 78 82 5% 1.63 1.55 -0.08
Newbury Orange East SU 147 142 175 23% 1.27 1.04 -0.24
Newfane Windham Central SU 101 89 104 17% 1.49 1.27 -0.22
New Haven Addison Northeast SU 115 104 98 -5% 1.40 1.48 0.08
Newport City North Country SU 354 330 396 20% 1.38 1.15 -0.23
Newport Town North Country SU 140 135 155 15% 1.56 1.36 -0.20
North Bennington ID Southwest Vermont SU 162 140 140 0% 1.68 1.68 0.00
Northfield Washington South SU 560 578 554 -4% 1.52 1.59 0.07
North Hero Grand Isle SU 126 105 104 -1% 1.21 1.23 0.01
Norton Essex North SU 12 12 13 10% 1.92 1.74 -0.18
Norwich Dresden Interstate SD 623 601 397 -34% 1.80 2.73 0.93

Study of Pupil Weights in Vermont’s Education Funding Formula 125
Local Education Agency (LEA) Name
Supervisory Union (SU) Name
Long-Term Unweighted
ADM (FY2018)
Equalized Pupils (FY2018) Equalized Homestead Tax (FY2018)
Actual Estimated
Difference (Estimated vs. Actual)
Based on Actual
Spending and Actual
Equalized Pupils
Based on Actual Spending and
Estimated Equalized Pupils
Difference (Estimated vs. Actual)
Orange Orange North SU 167 164 161 -2% 1.37 1.40 0.03
Orleans ID Orleans Central SU 111 99 89 -10% 1.27 1.42 0.15
Orwell Addison-Rutland SU 136 127 133 4% 1.35 1.30 -0.05
Pawlet Bennington-Rutland SU 116 129 128 -1% 1.00 1.01 0.01
Peacham Caledonia Central SU 95 91 87 -5% 1.84 1.93 0.09
Pittsfield Windsor Central SU 70 70 70 -1% 1.35 1.36 0.01
Plymouth Two Rivers SU 49 48 40 -18% 1.78 2.16 0.38
Pomfret Windsor Central SU 56 50 44 -12% 1.41 1.60 0.20
Poultney Rutland Southwest SU 394 388 401 3% 1.50 1.45 -0.05
Pownal Southwest Vermont SU 260 251 282 12% 1.56 1.39 -0.17
Proctor Rutland Central SU 279 275 246 -11% 1.63 1.82 0.19
Putney Windham Southeast SU 178 169 192 14% 1.76 1.54 -0.21
Reading Windsor Central SU 53 46 54 17% 1.70 1.46 -0.24
Readsboro Windham Southwest SU 71 75 107 43% 1.52 1.07 -0.46
Richford Franklin Northeast SU 392 414 616 49% 1.29 0.87 -0.42
Rochester White River Valley SU 97 93 113 22% 2.10 1.71 -0.38
Rockingham Windham Northeast SU 558 532 593 11% 1.70 1.53 -0.17
Roxbury Washington South SU 91 86 93 8% 1.77 1.64 -0.13
Royalton White River Valley SU 352 346 332 -4% 1.45 1.51 0.06
Rupert Bennington-Rutland SU 35 37 28 -25% 1.08 1.43 0.35
Rutland City Rutland City SD 1,918 2,105 2,630 25% 1.48 1.19 -0.30
Rutland Town Rutland Central SU 504 503 402 -20% 1.45 1.82 0.36
St. Johnsbury St. Johnsbury SD 1,108 1,138 1,269 11% 1.30 1.17 -0.13
Sandgate Battenkill Valley SU 64 58 50 -13% 1.61 1.86 0.25
Searsburg Windham Southwest SU 22 24 36 50% 1.34 0.89 -0.44
Shaftsbury Southwest Vermont SU 270 248 237 -4% 1.39 1.45 0.06
Sharon White River Valley SU 258 250 246 -2% 1.53 1.55 0.03
Sheldon Franklin Northwest SU 399 389 361 -7% 1.29 1.39 0.10
Killington Windsor Central SU 52 52 58 13% 1.73 1.53 -0.20
South Burlington South Burlington SD 2,474 2,417 2,115 -12% 1.52 1.73 0.22
South Hero Grand Isle SU 208 205 201 -2% 1.52 1.55 0.03
Springfield Springfield SD 1,304 1,314 1,430 9% 1.63 1.50 -0.13
Stamford Windham Southwest SU 108 109 111 2% 1.30 1.27 -0.03
Stannard Orleans Southwest SU 27 26 22 -17% 1.43 1.72 0.30
Starksboro Addison Northeast SU 183 162 165 2% 1.54 1.51 -0.03
Stockbridge White River Valley SU 89 89 96 8% 1.65 1.53 -0.12
Stowe Lamoille South SU 775 745 591 -21% 1.48 1.86 0.39

Study of Pupil Weights in Vermont’s Education Funding Formula 126
Local Education Agency (LEA) Name
Supervisory Union (SU) Name
Long-Term Unweighted
ADM (FY2018)
Equalized Pupils (FY2018) Equalized Homestead Tax (FY2018)
Actual Estimated
Difference (Estimated vs. Actual)
Based on Actual
Spending and Actual
Equalized Pupils
Based on Actual Spending and
Estimated Equalized Pupils
Difference (Estimated vs. Actual)
Strafford White River Valley SU 180 179 171 -5% 1.61 1.69 0.08
Stratton Windham Central SU 31 30 21 -29% 1.57 2.21 0.64
Sunderland Bennington-Rutland SU 157 148 137 -7% 0.99 1.07 0.08
Sutton Caledonia North SU 144 147 177 21% 1.74 1.44 -0.30
Swanton Franklin Northwest SU 572 527 540 2% 1.41 1.37 -0.03
Thetford Orange East SU 421 416 329 -21% 1.86 2.35 0.49
Townshend Windham Central SU 80 70 85 21% 1.71 1.42 -0.29
Troy North Country SU 181 176 212 20% 1.42 1.18 -0.24
Tunbridge White River Valley SU 179 175 179 3% 1.61 1.57 -0.04
Vernon Windham Southeast SU 214 214 190 -11% 1.69 1.90 0.21
Victory Essex-Caledonia SU 12 12 10 -16% 2.19 2.59 0.40
Walden Caledonia Central SU 145 147 177 21% 1.32 1.10 -0.23
Wardsboro Windham Central SU 114 116 130 12% 1.53 1.36 -0.17
Washington Orange North SU 131 130 152 17% 1.40 1.20 -0.20
Waterford Essex-Caledonia SU 223 218 204 -6% 1.56 1.67 0.11
Weathersfield Windsor Southeast SU 320 317 276 -13% 1.54 1.77 0.23
Wells Rutland Southwest SU 154 152 171 12% 1.27 1.13 -0.14
Westfield North Country SU 46 44 48 11% 1.45 1.31 -0.14
West Haven Addison-Rutland SU 23 23 23 2% 1.25 1.23 -0.02
Westminster Windham Northeast SU 286 259 218 -16% 1.49 1.77 0.28
Westmore Orleans Central SU 26 23 22 -6% 1.24 1.32 0.08
West Rutland Rutland Central SU 319 321 325 1% 1.51 1.49 -0.02
West Windsor Windsor Southeast SU 145 141 128 -9% 1.68 1.84 0.16
Whitingham Windham Southwest SU 183 183 181 -1% 1.97 1.98 0.02
Williamstown Orange North SU 506 504 495 -2% 1.46 1.49 0.03
Wilmington Windham Southwest SU 230 230 232 1% 1.86 1.84 -0.02
Windham Windham Central SU 19 17 20 19% 1.83 1.54 -0.29
Windsor Windsor Southeast SU 465 477 513 8% 1.29 1.20 -0.09
Winhall Bennington-Rutland SU 157 153 122 -20% 1.83 2.30 0.47
Winooski ID Winooski SD 861 963 1,584 64% 1.38 0.84 -0.54
Wolcott Orleans Southwest SU 271 279 302 8% 1.57 1.46 -0.12
Woodbury Orleans Southwest SU 56 51 52 3% 1.69 1.65 -0.04
Woodford Southwest Vermont SU 26 23 24 5% 1.17 1.11 -0.05
Woodstock Windsor Central SU 176 156 134 -14% 1.55 1.80 0.25
Worcester Washington Central SU 79 72 87 20% 1.61 1.34 -0.27
Woodstock UHSD Windsor Central SU 392 428 405 -5% 1.77 1.88 0.10
Brattleboro UHSD Windham Southeast SU 954 1,101 1,277 16% 1.79 1.55 -0.25

Study of Pupil Weights in Vermont’s Education Funding Formula 127
Local Education Agency (LEA) Name
Supervisory Union (SU) Name
Long-Term Unweighted
ADM (FY2018)
Equalized Pupils (FY2018) Equalized Homestead Tax (FY2018)
Actual Estimated
Difference (Estimated vs. Actual)
Based on Actual
Spending and Actual
Equalized Pupils
Based on Actual Spending and
Estimated Equalized Pupils
Difference (Estimated vs. Actual)
Missisquoi UHSD Franklin Northwest SU 769 856 860 0% 1.38 1.37 -0.01
Mt. Anthony UHSD Southwest Vermont SU 1,479 1,681 1,957 16% 1.43 1.23 -0.20
Fair Haven UHSD Addison-Rutland SU 414 466 500 7% 1.48 1.38 -0.10
Blue Mountain USD Blue Mountain Union SD 405 402 434 8% 1.60 1.48 -0.12
North Country Jr UHSD North Country SU 227 257 298 16% 1.48 1.27 -0.21
North Country Sr UHSD North Country SU 712 804 883 10% 1.47 1.34 -0.13
Currier Memorial UESD Bennington-Rutland SU 104 94 119 27% 1.61 1.27 -0.34
Lake Region UHSD Orleans Central SU 324 370 440 19% 1.46 1.23 -0.23
Hazen UHSD Orleans Southwest SU 317 360 420 16% 1.69 1.45 -0.24
Bellows Falls UHSD Windham Northeast SU 363 408 425 4% 1.59 1.53 -0.06
Mt. Abraham UHSD Addison Northeast SU 650 709 645 -9% 1.71 1.88 0.17
Chester-Andover UESD Two Rivers SU 195 194 218 12% 1.64 1.46 -0.18
Oxbow UHSD Orange East SU 273 307 338 10% 1.57 1.43 -0.14
U-32 UHSD Washington Central SU 683 736 598 -19% 1.71 2.11 0.40
Twinfield USD Washington Northeast SU 368 375 413 10% 1.73 1.57 -0.16
Leland & Gray UHSD Windham Central SU 247 276 294 7% 1.85 1.74 -0.11
Green Mt. Union UHSD Two Rivers SU 293 331 367 11% 1.48 1.33 -0.15
Waits River Valley USD Orange East SU 343 352 401 14% 1.49 1.31 -0.18
Millers Run USD Caledonia North SU 178 178 201 13% 1.73 1.53 -0.20
Black River UHSD Two Rivers SU 161 177 182 3% 1.69 1.65 -0.04
Spaulding HSUD Barre SU 675 761 757 -1% 1.31 1.32 0.01
Castleton-Hubbardton UESD Addison-Rutland SU 355 344 356 3% 1.59 1.54 -0.05
Lakeview UESD Orleans Southwest SU 73 74 98 34% 1.70 1.27 -0.43
Mettawee Community Sch UESD 47
Bennington-Rutland SU 200 175 191 9% 1.59 1.46 -0.13
Barstow USD Rutland Northeast SU 319 309 296 -4% 1.50 1.56 0.07
Elmore-Morristown USD Lamoille South SU 905 892 905 1% 1.42 1.40 -0.02
Essex Westford EC USD Essex Westford SD 3,831 3,748 3,050 -19% 1.60 1.97 0.37
Mill River USD Mill River SD 813 791 803 2% 1.58 1.55 -0.02
Otter Valley USD Rutland Northeast SU 1,295 1,288 1,432 11% 1.46 1.31 -0.15
Addison NW USD Addison Northwest SD 1,004 996 978 -2% 1.77 1.81 0.03
Addison Central USD Addison Central SD 1,764 1,764 1,623 -8% 1.70 1.85 0.15
Champlain Valley USD Champlain Valley SD 4,221 4,056 3,072 -24% 1.52 2.00 0.49
Maple Run USD Maple Run USD 2,545 2,529 2,471 -2% 1.48 1.51 0.03
Lamoille North MUSD Lamoille North SU 741 672 780 16% 1.56 1.34 -0.22
Lamoille North MUSD Lamoille North SU 708 790 835 6% 1.54 1.46 -0.08
Orange Southwest USD Orange Southwest USD 835 874 952 9% 1.53 1.40 -0.12
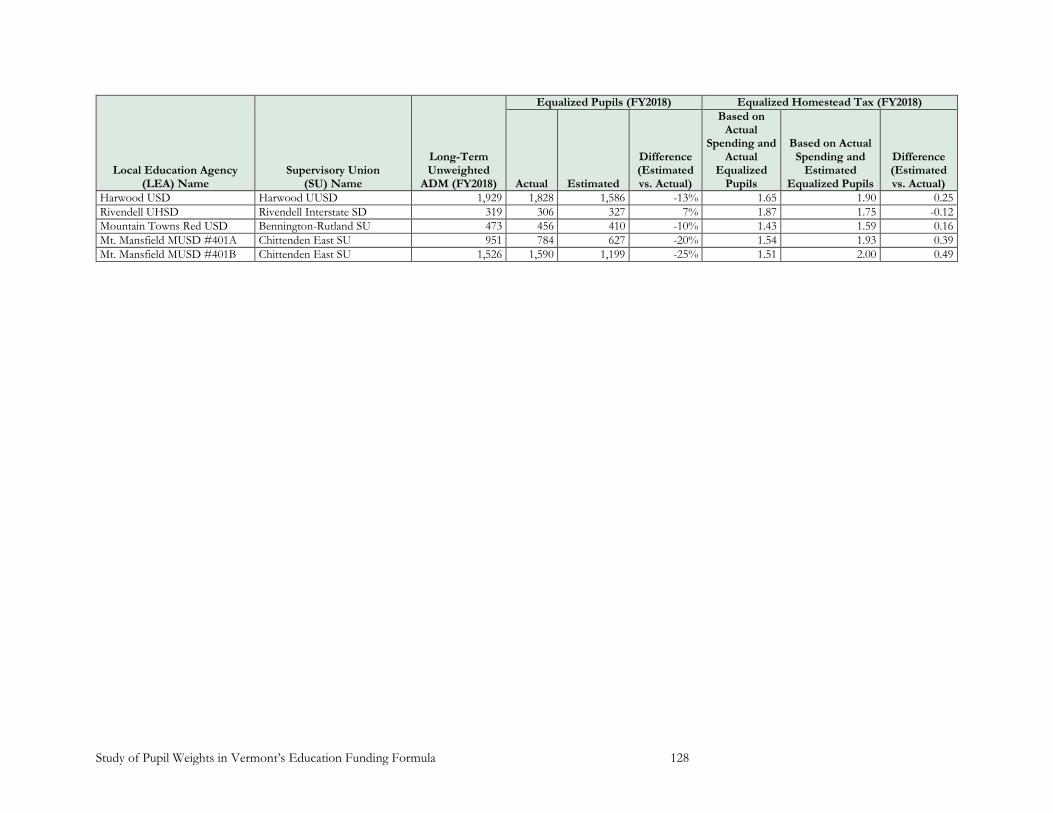
Study of Pupil Weights in Vermont’s Education Funding Formula 128
Local Education Agency (LEA) Name
Supervisory Union (SU) Name
Long-Term Unweighted
ADM (FY2018)
Equalized Pupils (FY2018) Equalized Homestead Tax (FY2018)
Actual Estimated
Difference (Estimated vs. Actual)
Based on Actual
Spending and Actual
Equalized Pupils
Based on Actual Spending and
Estimated Equalized Pupils
Difference (Estimated vs. Actual)
Harwood USD Harwood UUSD 1,929 1,828 1,586 -13% 1.65 1.90 0.25
Rivendell UHSD Rivendell Interstate SD 319 306 327 7% 1.87 1.75 -0.12
Mountain Towns Red USD Bennington-Rutland SU 473 456 410 -10% 1.43 1.59 0.16
Mt. Mansfield MUSD #401A Chittenden East SU 951 784 627 -20% 1.54 1.93 0.39
Mt. Mansfield MUSD #401B Chittenden East SU 1,526 1,590 1,199 -25% 1.51 2.00 0.49
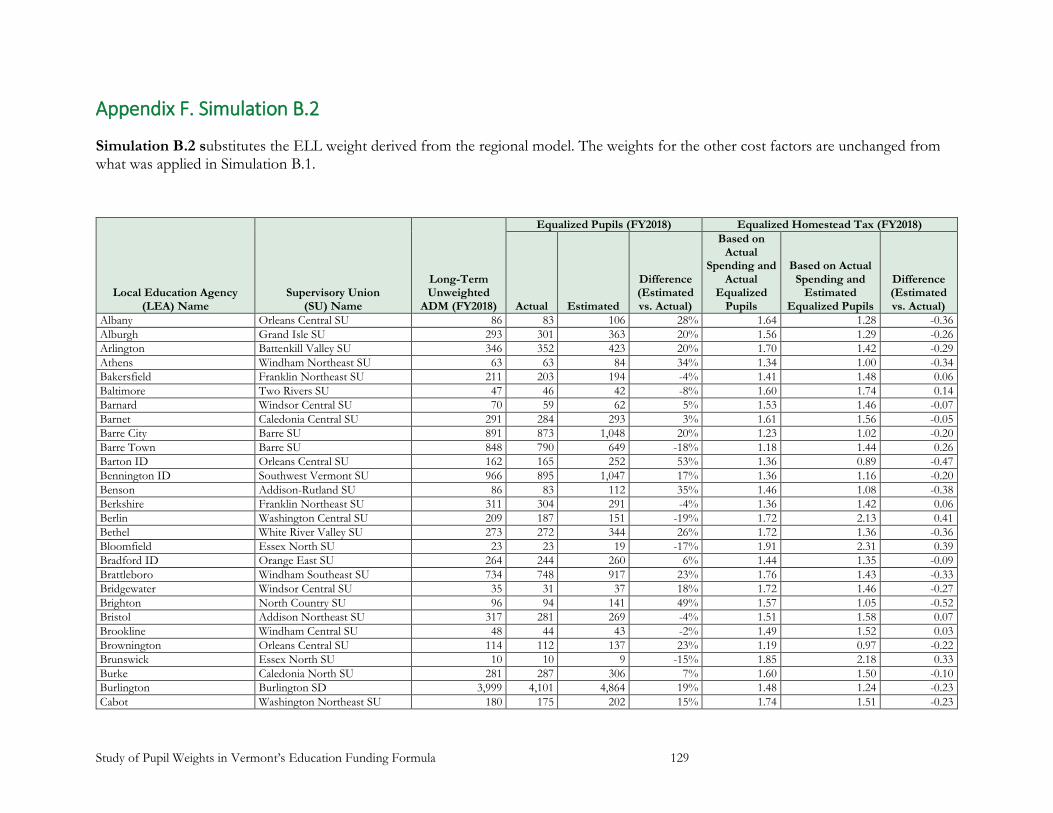
Study of Pupil Weights in Vermont’s Education Funding Formula 129
Appendix F. Simulation B.2
Simulation B.2 substitutes the ELL weight derived from the regional model. The weights for the other cost factors are unchanged from what was applied in Simulation B.1.
Local Education Agency (LEA) Name
Supervisory Union (SU) Name
Long-Term Unweighted
ADM (FY2018)
Equalized Pupils (FY2018) Equalized Homestead Tax (FY2018)
Actual Estimated
Difference (Estimated vs. Actual)
Based on Actual
Spending and Actual
Equalized Pupils
Based on Actual Spending and
Estimated Equalized Pupils
Difference (Estimated vs. Actual)
Albany Orleans Central SU 86 83 106 28% 1.64 1.28 -0.36
Alburgh Grand Isle SU 293 301 363 20% 1.56 1.29 -0.26
Arlington Battenkill Valley SU 346 352 423 20% 1.70 1.42 -0.29
Athens Windham Northeast SU 63 63 84 34% 1.34 1.00 -0.34
Bakersfield Franklin Northeast SU 211 203 194 -4% 1.41 1.48 0.06
Baltimore Two Rivers SU 47 46 42 -8% 1.60 1.74 0.14
Barnard Windsor Central SU 70 59 62 5% 1.53 1.46 -0.07
Barnet Caledonia Central SU 291 284 293 3% 1.61 1.56 -0.05
Barre City Barre SU 891 873 1,048 20% 1.23 1.02 -0.20
Barre Town Barre SU 848 790 649 -18% 1.18 1.44 0.26
Barton ID Orleans Central SU 162 165 252 53% 1.36 0.89 -0.47
Bennington ID Southwest Vermont SU 966 895 1,047 17% 1.36 1.16 -0.20
Benson Addison-Rutland SU 86 83 112 35% 1.46 1.08 -0.38
Berkshire Franklin Northeast SU 311 304 291 -4% 1.36 1.42 0.06
Berlin Washington Central SU 209 187 151 -19% 1.72 2.13 0.41
Bethel White River Valley SU 273 272 344 26% 1.72 1.36 -0.36
Bloomfield Essex North SU 23 23 19 -17% 1.91 2.31 0.39
Bradford ID Orange East SU 264 244 260 6% 1.44 1.35 -0.09
Brattleboro Windham Southeast SU 734 748 917 23% 1.76 1.43 -0.33
Bridgewater Windsor Central SU 35 31 37 18% 1.72 1.46 -0.27
Brighton North Country SU 96 94 141 49% 1.57 1.05 -0.52
Bristol Addison Northeast SU 317 281 269 -4% 1.51 1.58 0.07
Brookline Windham Central SU 48 44 43 -2% 1.49 1.52 0.03
Brownington Orleans Central SU 114 112 137 23% 1.19 0.97 -0.22
Brunswick Essex North SU 10 10 9 -15% 1.85 2.18 0.33
Burke Caledonia North SU 281 287 306 7% 1.60 1.50 -0.10
Burlington Burlington SD 3,999 4,101 4,864 19% 1.48 1.24 -0.23
Cabot Washington Northeast SU 180 175 202 15% 1.74 1.51 -0.23

Study of Pupil Weights in Vermont’s Education Funding Formula 130
Local Education Agency (LEA) Name
Supervisory Union (SU) Name
Long-Term Unweighted
ADM (FY2018)
Equalized Pupils (FY2018) Equalized Homestead Tax (FY2018)
Actual Estimated
Difference (Estimated vs. Actual)
Based on Actual
Spending and Actual
Equalized Pupils
Based on Actual Spending and
Estimated Equalized Pupils
Difference (Estimated vs. Actual)
Calais Washington Central SU 123 111 102 -9% 1.61 1.77 0.16
Cambridge Lamoille North SU 372 332 312 -6% 1.46 1.55 0.09
Canaan Essex North SU 126 131 156 20% 1.55 1.30 -0.25
Cavendish Two Rivers SU 116 104 123 19% 1.57 1.32 -0.25
Charleston North Country SU 108 103 135 31% 1.52 1.16 -0.36
Chelsea White River Valley SU 180 180 226 26% 1.65 1.31 -0.34
Colchester Colchester SD 2,292 2,234 1,944 -13% 1.39 1.59 0.21
Concord Essex-Caledonia SU 210 214 254 19% 1.74 1.46 -0.27
Coventry North Country SU 176 171 182 6% 1.39 1.31 -0.08
Craftsbury Orleans Southwest SU 152 151 177 17% 1.69 1.44 -0.25
Danby Bennington-Rutland SU 108 122 129 6% 1.42 1.34 -0.08
Danville Caledonia Central SU 327 315 316 0% 1.60 1.59 -0.01
Derby North Country SU 405 365 362 -1% 1.20 1.21 0.01
Dorset Bennington-Rutland SU 307 300 263 -12% 1.69 1.93 0.24
Dover Windham Central SU 181 177 174 -2% 1.55 1.58 0.03
Dummerston Windham Southeast SU 155 151 133 -12% 1.82 2.06 0.24
East Haven Caledonia North SU 56 56 61 9% 1.66 1.52 -0.14
East Montpelier Washington Central SU 230 189 139 -26% 1.91 2.60 0.69
Enosburgh Franklin Northeast SU 500 513 664 29% 1.32 1.02 -0.30
Fairfax Franklin West SU 795 778 601 -23% 1.30 1.69 0.39
Fair Haven Addison-Rutland SU 325 312 345 11% 1.44 1.30 -0.14
Fletcher Franklin West SU 227 209 174 -17% 1.36 1.64 0.27
Franklin Franklin Northwest SU 138 122 132 8% 1.27 1.18 -0.09
Georgia Franklin West SU 885 845 618 -27% 1.35 1.85 0.50
Glover Orleans Central SU 127 120 132 10% 1.47 1.33 -0.14
Grafton Windham Northeast SU 64 62 69 10% 1.32 1.20 -0.13
Granby Essex-Caledonia SU 5 5 10 85% 2.02 1.09 -0.93
Grand Isle Grand Isle SU 290 288 283 -2% 1.56 1.59 0.03
Granville White River Valley SU 44 42 47 11% 1.80 1.62 -0.18
Guildhall Essex-Caledonia SU 25 27 30 13% 1.16 1.03 -0.13
Guilford Windham Southeast SU 150 152 161 6% 1.74 1.64 -0.10
Halifax Windham Southwest SU 83 83 91 10% 1.37 1.25 -0.12
Hancock White River Valley SU 52 52 64 23% 1.71 1.39 -0.32
Hardwick Orleans Southwest SU 256 242 284 17% 1.63 1.40 -0.24
Hartford Hartford SD 1,455 1,432 1,331 -7% 1.56 1.68 0.12
Hartland Windsor Southeast SU 462 470 376 -20% 1.62 2.02 0.40
Highgate Franklin Northwest SU 362 323 287 -11% 1.35 1.52 0.17
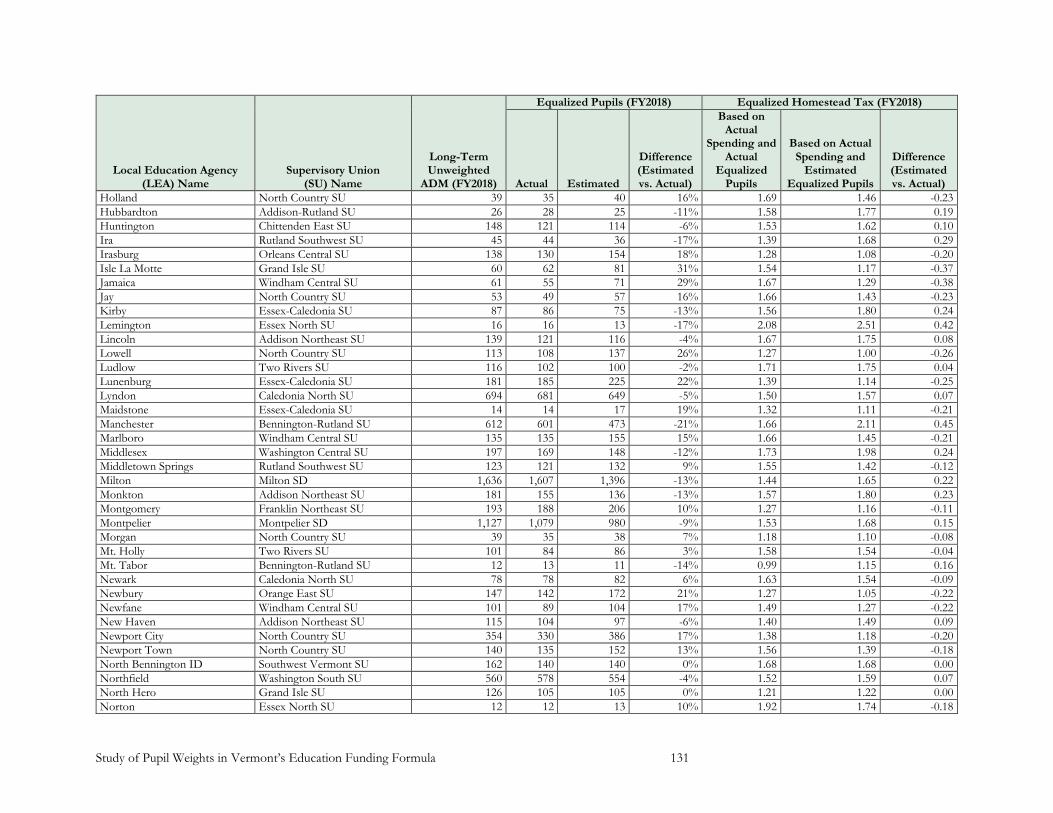
Study of Pupil Weights in Vermont’s Education Funding Formula 131
Local Education Agency (LEA) Name
Supervisory Union (SU) Name
Long-Term Unweighted
ADM (FY2018)
Equalized Pupils (FY2018) Equalized Homestead Tax (FY2018)
Actual Estimated
Difference (Estimated vs. Actual)
Based on Actual
Spending and Actual
Equalized Pupils
Based on Actual Spending and
Estimated Equalized Pupils
Difference (Estimated vs. Actual)
Holland North Country SU 39 35 40 16% 1.69 1.46 -0.23
Hubbardton Addison-Rutland SU 26 28 25 -11% 1.58 1.77 0.19
Huntington Chittenden East SU 148 121 114 -6% 1.53 1.62 0.10
Ira Rutland Southwest SU 45 44 36 -17% 1.39 1.68 0.29
Irasburg Orleans Central SU 138 130 154 18% 1.28 1.08 -0.20
Isle La Motte Grand Isle SU 60 62 81 31% 1.54 1.17 -0.37
Jamaica Windham Central SU 61 55 71 29% 1.67 1.29 -0.38
Jay North Country SU 53 49 57 16% 1.66 1.43 -0.23
Kirby Essex-Caledonia SU 87 86 75 -13% 1.56 1.80 0.24
Lemington Essex North SU 16 16 13 -17% 2.08 2.51 0.42
Lincoln Addison Northeast SU 139 121 116 -4% 1.67 1.75 0.08
Lowell North Country SU 113 108 137 26% 1.27 1.00 -0.26
Ludlow Two Rivers SU 116 102 100 -2% 1.71 1.75 0.04
Lunenburg Essex-Caledonia SU 181 185 225 22% 1.39 1.14 -0.25
Lyndon Caledonia North SU 694 681 649 -5% 1.50 1.57 0.07
Maidstone Essex-Caledonia SU 14 14 17 19% 1.32 1.11 -0.21
Manchester Bennington-Rutland SU 612 601 473 -21% 1.66 2.11 0.45
Marlboro Windham Central SU 135 135 155 15% 1.66 1.45 -0.21
Middlesex Washington Central SU 197 169 148 -12% 1.73 1.98 0.24
Middletown Springs Rutland Southwest SU 123 121 132 9% 1.55 1.42 -0.12
Milton Milton SD 1,636 1,607 1,396 -13% 1.44 1.65 0.22
Monkton Addison Northeast SU 181 155 136 -13% 1.57 1.80 0.23
Montgomery Franklin Northeast SU 193 188 206 10% 1.27 1.16 -0.11
Montpelier Montpelier SD 1,127 1,079 980 -9% 1.53 1.68 0.15
Morgan North Country SU 39 35 38 7% 1.18 1.10 -0.08
Mt. Holly Two Rivers SU 101 84 86 3% 1.58 1.54 -0.04
Mt. Tabor Bennington-Rutland SU 12 13 11 -14% 0.99 1.15 0.16
Newark Caledonia North SU 78 78 82 6% 1.63 1.54 -0.09
Newbury Orange East SU 147 142 172 21% 1.27 1.05 -0.22
Newfane Windham Central SU 101 89 104 17% 1.49 1.27 -0.22
New Haven Addison Northeast SU 115 104 97 -6% 1.40 1.49 0.09
Newport City North Country SU 354 330 386 17% 1.38 1.18 -0.20
Newport Town North Country SU 140 135 152 13% 1.56 1.39 -0.18
North Bennington ID Southwest Vermont SU 162 140 140 0% 1.68 1.68 0.00
Northfield Washington South SU 560 578 554 -4% 1.52 1.59 0.07
North Hero Grand Isle SU 126 105 105 0% 1.21 1.22 0.00
Norton Essex North SU 12 12 13 10% 1.92 1.74 -0.18

Study of Pupil Weights in Vermont’s Education Funding Formula 132
Local Education Agency (LEA) Name
Supervisory Union (SU) Name
Long-Term Unweighted
ADM (FY2018)
Equalized Pupils (FY2018) Equalized Homestead Tax (FY2018)
Actual Estimated
Difference (Estimated vs. Actual)
Based on Actual
Spending and Actual
Equalized Pupils
Based on Actual Spending and
Estimated Equalized Pupils
Difference (Estimated vs. Actual)
Norwich Dresden Interstate SD 623 601 397 -34% 1.80 2.72 0.92
Orange Orange North SU 167 164 160 -3% 1.37 1.41 0.04
Orleans ID Orleans Central SU 111 99 87 -12% 1.27 1.44 0.17
Orwell Addison-Rutland SU 136 127 131 3% 1.35 1.31 -0.04
Pawlet Bennington-Rutland SU 116 129 128 -1% 1.00 1.01 0.01
Peacham Caledonia Central SU 95 91 88 -4% 1.84 1.92 0.08
Pittsfield Windsor Central SU 70 70 70 -1% 1.35 1.35 0.01
Plymouth Two Rivers SU 49 48 40 -17% 1.78 2.14 0.36
Pomfret Windsor Central SU 56 50 44 -11% 1.41 1.59 0.18
Poultney Rutland Southwest SU 394 388 401 3% 1.50 1.45 -0.05
Pownal Southwest Vermont SU 260 251 276 10% 1.56 1.42 -0.14
Proctor Rutland Central SU 279 275 246 -10% 1.63 1.82 0.19
Putney Windham Southeast SU 178 169 187 11% 1.76 1.58 -0.18
Reading Windsor Central SU 53 46 54 17% 1.70 1.46 -0.24
Readsboro Windham Southwest SU 71 75 106 41% 1.52 1.08 -0.44
Richford Franklin Northeast SU 392 414 612 48% 1.29 0.87 -0.42
Rochester White River Valley SU 97 93 112 21% 2.10 1.73 -0.37
Rockingham Windham Northeast SU 558 532 579 9% 1.70 1.57 -0.14
Roxbury Washington South SU 91 86 93 8% 1.77 1.64 -0.13
Royalton White River Valley SU 352 346 334 -4% 1.45 1.51 0.06
Rupert Bennington-Rutland SU 35 37 29 -24% 1.08 1.41 0.33
Rutland City Rutland City SD 1,918 2,105 2,621 25% 1.48 1.19 -0.29
Rutland Town Rutland Central SU 504 503 397 -21% 1.45 1.84 0.39
St. Johnsbury St. Johnsbury SD 1,108 1,138 1,239 9% 1.30 1.20 -0.11
Sandgate Battenkill Valley SU 64 58 51 -12% 1.61 1.84 0.23
Searsburg Windham Southwest SU 22 24 35 48% 1.34 0.90 -0.43
Shaftsbury Southwest Vermont SU 270 248 234 -5% 1.39 1.47 0.08
Sharon White River Valley SU 258 250 243 -3% 1.53 1.57 0.04
Sheldon Franklin Northwest SU 399 389 356 -8% 1.29 1.41 0.12
Killington Windsor Central SU 52 52 58 11% 1.73 1.55 -0.18
South Burlington South Burlington SD 2,474 2,417 2,130 -12% 1.52 1.72 0.20
South Hero Grand Isle SU 208 205 199 -3% 1.52 1.56 0.04
Springfield Springfield SD 1,304 1,314 1,428 9% 1.63 1.50 -0.13
Stamford Windham Southwest SU 108 109 112 3% 1.30 1.27 -0.04
Stannard Orleans Southwest SU 27 26 22 -16% 1.43 1.71 0.28
Starksboro Addison Northeast SU 183 162 163 1% 1.54 1.53 -0.02
Stockbridge White River Valley SU 89 89 96 8% 1.65 1.53 -0.12

Study of Pupil Weights in Vermont’s Education Funding Formula 133
Local Education Agency (LEA) Name
Supervisory Union (SU) Name
Long-Term Unweighted
ADM (FY2018)
Equalized Pupils (FY2018) Equalized Homestead Tax (FY2018)
Actual Estimated
Difference (Estimated vs. Actual)
Based on Actual
Spending and Actual
Equalized Pupils
Based on Actual Spending and
Estimated Equalized Pupils
Difference (Estimated vs. Actual)
Stowe Lamoille South SU 775 745 598 -20% 1.48 1.84 0.36
Strafford White River Valley SU 180 179 170 -5% 1.61 1.70 0.09
Stratton Windham Central SU 31 30 22 -28% 1.57 2.17 0.60
Sunderland Bennington-Rutland SU 157 148 138 -6% 0.99 1.06 0.07
Sutton Caledonia North SU 144 147 174 19% 1.74 1.47 -0.28
Swanton Franklin Northwest SU 572 527 529 0% 1.41 1.40 0.00
Thetford Orange East SU 421 416 326 -22% 1.86 2.37 0.51
Townshend Windham Central SU 80 70 84 21% 1.71 1.42 -0.29
Troy North Country SU 181 176 209 18% 1.42 1.20 -0.22
Tunbridge White River Valley SU 179 175 178 2% 1.61 1.59 -0.03
Vernon Windham Southeast SU 214 214 187 -13% 1.69 1.93 0.24
Victory Essex-Caledonia SU 12 12 10 -15% 2.19 2.57 0.38
Walden Caledonia Central SU 145 147 176 20% 1.32 1.10 -0.22
Wardsboro Windham Central SU 114 116 129 12% 1.53 1.37 -0.16
Washington Orange North SU 131 130 152 17% 1.40 1.20 -0.20
Waterford Essex-Caledonia SU 223 218 203 -7% 1.56 1.68 0.12
Weathersfield Windsor Southeast SU 320 317 273 -14% 1.54 1.79 0.25
Wells Rutland Southwest SU 154 152 170 12% 1.27 1.13 -0.13
Westfield North Country SU 46 44 48 11% 1.45 1.31 -0.14
West Haven Addison-Rutland SU 23 23 23 2% 1.25 1.22 -0.02
Westminster Windham Northeast SU 286 259 216 -16% 1.49 1.79 0.29
Westmore Orleans Central SU 26 23 22 -5% 1.24 1.31 0.07
West Rutland Rutland Central SU 319 321 324 1% 1.51 1.49 -0.02
West Windsor Windsor Southeast SU 145 141 129 -8% 1.68 1.83 0.15
Whitingham Windham Southwest SU 183 183 182 -1% 1.97 1.98 0.01
Williamstown Orange North SU 506 504 497 -1% 1.46 1.48 0.02
Wilmington Windham Southwest SU 230 230 228 -1% 1.86 1.87 0.01
Windham Windham Central SU 19 17 20 19% 1.83 1.54 -0.29
Windsor Windsor Southeast SU 465 477 515 8% 1.29 1.19 -0.09
Winhall Bennington-Rutland SU 157 153 123 -19% 1.83 2.27 0.44
Winooski ID Winooski SD 861 963 1,556 62% 1.38 0.85 -0.52
Wolcott Orleans Southwest SU 271 279 297 6% 1.57 1.48 -0.10
Woodbury Orleans Southwest SU 56 51 53 3% 1.69 1.64 -0.05
Woodford Southwest Vermont SU 26 23 24 5% 1.17 1.11 -0.06
Woodstock Windsor Central SU 176 156 133 -15% 1.55 1.82 0.27
Worcester Washington Central SU 79 72 87 20% 1.61 1.34 -0.27
Woodstock UHSD Windsor Central SU 392 428 415 -3% 1.77 1.83 0.06
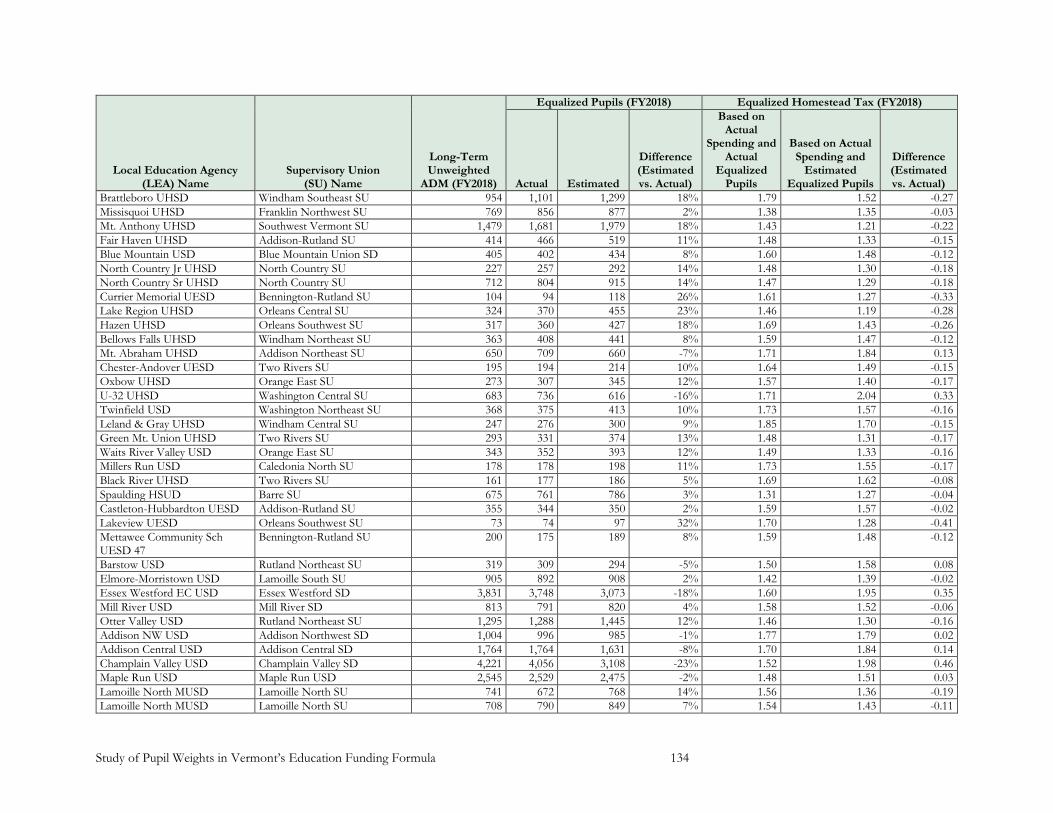
Study of Pupil Weights in Vermont’s Education Funding Formula 134
Local Education Agency (LEA) Name
Supervisory Union (SU) Name
Long-Term Unweighted
ADM (FY2018)
Equalized Pupils (FY2018) Equalized Homestead Tax (FY2018)
Actual Estimated
Difference (Estimated vs. Actual)
Based on Actual
Spending and Actual
Equalized Pupils
Based on Actual Spending and
Estimated Equalized Pupils
Difference (Estimated vs. Actual)
Brattleboro UHSD Windham Southeast SU 954 1,101 1,299 18% 1.79 1.52 -0.27
Missisquoi UHSD Franklin Northwest SU 769 856 877 2% 1.38 1.35 -0.03
Mt. Anthony UHSD Southwest Vermont SU 1,479 1,681 1,979 18% 1.43 1.21 -0.22
Fair Haven UHSD Addison-Rutland SU 414 466 519 11% 1.48 1.33 -0.15
Blue Mountain USD Blue Mountain Union SD 405 402 434 8% 1.60 1.48 -0.12
North Country Jr UHSD North Country SU 227 257 292 14% 1.48 1.30 -0.18
North Country Sr UHSD North Country SU 712 804 915 14% 1.47 1.29 -0.18
Currier Memorial UESD Bennington-Rutland SU 104 94 118 26% 1.61 1.27 -0.33
Lake Region UHSD Orleans Central SU 324 370 455 23% 1.46 1.19 -0.28
Hazen UHSD Orleans Southwest SU 317 360 427 18% 1.69 1.43 -0.26
Bellows Falls UHSD Windham Northeast SU 363 408 441 8% 1.59 1.47 -0.12
Mt. Abraham UHSD Addison Northeast SU 650 709 660 -7% 1.71 1.84 0.13
Chester-Andover UESD Two Rivers SU 195 194 214 10% 1.64 1.49 -0.15
Oxbow UHSD Orange East SU 273 307 345 12% 1.57 1.40 -0.17
U-32 UHSD Washington Central SU 683 736 616 -16% 1.71 2.04 0.33
Twinfield USD Washington Northeast SU 368 375 413 10% 1.73 1.57 -0.16
Leland & Gray UHSD Windham Central SU 247 276 300 9% 1.85 1.70 -0.15
Green Mt. Union UHSD Two Rivers SU 293 331 374 13% 1.48 1.31 -0.17
Waits River Valley USD Orange East SU 343 352 393 12% 1.49 1.33 -0.16
Millers Run USD Caledonia North SU 178 178 198 11% 1.73 1.55 -0.17
Black River UHSD Two Rivers SU 161 177 186 5% 1.69 1.62 -0.08
Spaulding HSUD Barre SU 675 761 786 3% 1.31 1.27 -0.04
Castleton-Hubbardton UESD Addison-Rutland SU 355 344 350 2% 1.59 1.57 -0.02
Lakeview UESD Orleans Southwest SU 73 74 97 32% 1.70 1.28 -0.41
Mettawee Community Sch UESD 47
Bennington-Rutland SU 200 175 189 8% 1.59 1.48 -0.12
Barstow USD Rutland Northeast SU 319 309 294 -5% 1.50 1.58 0.08
Elmore-Morristown USD Lamoille South SU 905 892 908 2% 1.42 1.39 -0.02
Essex Westford EC USD Essex Westford SD 3,831 3,748 3,073 -18% 1.60 1.95 0.35
Mill River USD Mill River SD 813 791 820 4% 1.58 1.52 -0.06
Otter Valley USD Rutland Northeast SU 1,295 1,288 1,445 12% 1.46 1.30 -0.16
Addison NW USD Addison Northwest SD 1,004 996 985 -1% 1.77 1.79 0.02
Addison Central USD Addison Central SD 1,764 1,764 1,631 -8% 1.70 1.84 0.14
Champlain Valley USD Champlain Valley SD 4,221 4,056 3,108 -23% 1.52 1.98 0.46
Maple Run USD Maple Run USD 2,545 2,529 2,475 -2% 1.48 1.51 0.03
Lamoille North MUSD Lamoille North SU 741 672 768 14% 1.56 1.36 -0.19
Lamoille North MUSD Lamoille North SU 708 790 849 7% 1.54 1.43 -0.11

Study of Pupil Weights in Vermont’s Education Funding Formula 135
Local Education Agency (LEA) Name
Supervisory Union (SU) Name
Long-Term Unweighted
ADM (FY2018)
Equalized Pupils (FY2018) Equalized Homestead Tax (FY2018)
Actual Estimated
Difference (Estimated vs. Actual)
Based on Actual
Spending and Actual
Equalized Pupils
Based on Actual Spending and
Estimated Equalized Pupils
Difference (Estimated vs. Actual)
Orange Southwest USD Orange Southwest USD 835 874 949 9% 1.53 1.40 -0.12
Harwood USD Harwood UUSD 1,929 1,828 1,600 -13% 1.65 1.89 0.24
Rivendell UHSD Rivendell Interstate SD 319 306 323 5% 1.87 1.78 -0.10
Mountain Towns Red USD Bennington-Rutland SU 473 456 407 -11% 1.43 1.60 0.17
Mt. Mansfield MUSD #401A Chittenden East SU 951 784 625 -20% 1.54 1.93 0.39
Mt. Mansfield MUSD #401B Chittenden East SU 1,526 1,590 1,262 -21% 1.51 1.90 0.39

Study of Pupil Weights in Vermont’s Education Funding Formula 136
Appendix G. Actual and Simulated State Special Education Aid Under Scenarios 1 Through 5
Supervisory Union (SU) Name
Actual State Special
Education Aid Fiscal Year 2018
Simulation Scenarios Difference Between Simulation Scenarios and Actual State
Special Education Aid
Scenario 1 (Status Quo) Scenario 2 Scenario 3 Scenario 4 Scenario 5
Scenario 1 (Status Quo) Scenario 2 Scenario 3 Scenario 4 Scenario 5
Addison Northeast SU $2,492,968 $3,057,332 $2,958,709 $2,775,566 $2,782,942 $2,624,133 $564,364 $465,741 $282,598 $289,974 $131,165
Addison Northwest SD $2,624,614 $1,936,794 $1,922,570 $1,896,517 $1,900,302 $1,771,464 -$687,820 -$702,045 -$728,097 -$724,312 -$853,150
Addison Central SD $2,469,904 $3,404,694 $3,405,060 $3,145,619 $3,148,765 $3,098,671 $934,790 $935,156 $675,715 $678,861 $628,767
Addison-Rutland SU $2,465,410 $2,632,308 $2,669,730 $2,894,821 $2,903,563 $2,872,078 $166,898 $204,320 $429,411 $438,153 $406,668
Southwest Vermont SU $9,276,499 $6,103,741 $6,246,966 $7,122,764 $7,142,788 $7,619,669 -$3,172,758 -$3,029,533 -$2,153,735 -$2,133,711 -$1,656,830
Bennington-Rutland SU $6,452,295 $4,401,944 $4,299,056 $3,867,425 $3,877,498 $3,678,498 -$2,050,351 -$2,153,239 -$2,584,870 -$2,574,797 -$2,773,797
Colchester SD $4,360,382 $4,422,672 $4,312,296 $3,761,424 $3,751,186 $3,949,528 $62,290 -$48,087 -$598,958 -$609,196 -$410,854
Caledonia North SU $3,268,735 $2,761,598 $2,752,026 $2,829,571 $2,836,485 $2,834,090 -$507,137 -$516,709 -$439,164 -$432,250 -$434,645
Caledonia Central SU $1,462,682 $1,656,094 $1,615,449 $1,679,134 $1,684,765 $1,529,022 $193,412 $152,767 $216,452 $222,083 $66,340
Milton SD $3,878,425 $3,157,519 $3,101,028 $2,688,449 $2,693,602 $2,868,479 -$720,906 -$777,398 -$1,189,976 -$1,184,823 -$1,009,946
St. Johnsbury SD $2,348,493 $2,137,842 $2,197,112 $2,382,364 $2,390,353 $2,634,042 -$210,651 -$151,381 $33,871 $41,860 $285,549
Chittenden East SU $5,421,578 $5,066,578 $4,815,852 $3,850,489 $3,861,793 $3,659,852 -$355,000 -$605,726 -$1,571,089 -$1,559,785 -$1,761,726
Champlain Valley SD $6,851,430 $8,146,086 $7,827,752 $6,008,939 $5,997,870 $6,270,782 $1,294,656 $976,322 -$842,491 -$853,560 -$580,648
Burlington SD $10,075,374 $7,717,298 $7,915,277 $9,539,851 $9,386,776 $9,446,303 -$2,358,076 -$2,160,097 -$535,523 -$688,598 -$629,071
South Burlington SD $5,204,428 $4,774,241 $4,664,598 $4,159,420 $4,111,251 $4,145,226 -$430,187 -$539,830 -$1,045,008 -$1,093,177 -$1,059,202
Winooski SD $2,349,124 $1,661,074 $1,859,130 $3,079,280 $3,003,993 $2,930,069 -$688,050 -$489,994 $730,156 $654,869 $580,945
Essex-Caledonia SU $1,348,382 $1,459,447 $1,469,444 $1,584,386 $1,589,700 $1,447,046 $111,065 $121,062 $236,004 $241,318 $98,664
Essex North SU $679,769 $357,976 $370,946 $405,265 $406,624 $363,838 -$321,793 -$308,823 -$274,504 -$273,145 -$315,931
Franklin Northeast SU $2,567,482 $3,099,426 $3,129,553 $3,783,781 $3,795,504 $3,669,591 $531,944 $562,071 $1,216,299 $1,228,022 $1,102,109
Franklin Northwest SU $5,093,972 $4,321,695 $4,279,293 $4,200,141 $4,209,077 $4,283,437 -$772,277 -$814,680 -$893,831 -$884,895 -$810,535
Franklin West SU $2,867,014 $3,680,510 $3,536,957 $2,683,101 $2,689,523 $2,687,661 $813,496 $669,943 -$183,913 -$177,491 -$179,353
Maple Run USD $5,098,426 $4,912,120 $4,881,028 $4,767,799 $4,777,351 $5,126,678 -$186,306 -$217,398 -$330,627 -$321,075 $28,252
Grand Isle SU $1,857,958 $1,884,606 $1,853,784 $1,986,183 $1,990,912 $1,881,322 $26,648 -$4,174 $128,225 $132,954 $23,364
Lamoille North SU $4,149,691 $3,514,048 $3,462,304 $3,711,531 $3,723,334 $3,636,496 -$635,644 -$687,387 -$438,160 -$426,357 -$513,195
Lamoille South SU $3,100,360 $3,241,975 $3,161,128 $2,900,126 $2,907,276 $2,892,475 $141,615 $60,768 -$200,234 -$193,084 -$207,885
Orange East SU $2,891,426 $2,795,721 $2,820,097 $2,877,985 $2,886,670 $2,860,649 -$95,705 -$71,329 -$13,441 -$4,756 -$30,777
Orange Southwest USD $1,292,518 $1,611,511 $1,686,627 $1,827,372 $1,832,212 $1,836,615 $318,993 $394,109 $534,854 $539,694 $544,097
Orange North SU $1,712,464 $1,552,164 $1,541,375 $1,556,249 $1,561,468 $1,484,147 -$160,300 -$171,089 -$156,215 -$150,996 -$228,317
White River Valley SU $3,363,540 $3,286,539 $3,240,123 $3,488,745 $3,499,478 $3,262,670 -$77,001 -$123,417 $125,205 $135,938 -$100,870
North Country SU $5,496,105 $5,187,956 $5,220,611 $5,948,156 $5,968,103 $5,888,117 -$308,149 -$275,494 $452,051 $471,998 $392,012
Washington Central SU $2,968,484 $2,935,028 $2,825,288 $2,391,642 $2,397,409 $2,208,197 -$33,456 -$143,196 -$576,842 -$571,075 -$760,287
Mill River SD $1,619,341 $1,569,148 $1,526,321 $1,576,428 $1,581,714 $1,430,700 -$50,193 -$93,020 -$42,913 -$37,627 -$188,641
Orleans Central SU $2,249,006 $2,097,756 $2,125,200 $2,589,660 $2,598,022 $2,505,514 -$151,250 -$123,806 $340,654 $349,016 $256,508
Orleans Southwest SU $2,799,219 $2,222,511 $2,284,927 $2,612,368 $2,618,943 $2,495,757 -$576,708 -$514,292 -$186,851 -$180,276 -$303,462
Rutland Northeast SU $3,635,284 $3,114,962 $3,083,117 $3,345,687 $3,356,584 $3,279,990 -$520,322 -$552,167 -$289,597 -$278,700 -$355,294
Rutland Central SU $1,809,685 $2,125,953 $2,119,835 $1,861,973 $1,867,896 $2,009,742 $316,268 $310,150 $52,288 $58,211 $200,057

Study of Pupil Weights in Vermont’s Education Funding Formula 137
Supervisory Union (SU) Name
Actual State Special
Education Aid Fiscal Year 2018
Simulation Scenarios Difference Between Simulation Scenarios and Actual State
Special Education Aid
Scenario 1 (Status Quo) Scenario 2 Scenario 3 Scenario 4 Scenario 5
Scenario 1 (Status Quo) Scenario 2 Scenario 3 Scenario 4 Scenario 5
Rutland Southwest SU $1,338,743 $1,382,806 $1,359,704 $1,420,572 $1,425,336 $1,359,179 $44,063 $20,961 $81,829 $86,593 $20,436
Rutland City SD $5,298,476 $3,702,570 $4,061,917 $5,047,675 $5,057,843 $5,339,422 -$1,595,906 -$1,236,559 -$250,801 -$240,633 $40,946
Washington Northeast SU $1,113,234 $1,057,486 $1,060,767 $1,182,836 $1,186,803 $1,148,833 -$55,748 -$52,467 $69,602 $73,569 $35,599
Harwood UUSD $4,204,562 $3,722,738 $3,528,677 $3,079,646 $3,087,399 $2,862,512 -$481,824 -$675,885 -$1,124,916 -$1,117,163 -$1,342,050
Washington South SU $1,766,287 $1,257,646 $1,281,443 $1,245,206 $1,248,416 $1,275,259 -$508,641 -$484,844 -$521,081 -$517,871 -$491,028
Montpelier SD $2,116,049 $2,174,203 $2,083,088 $1,896,982 $1,891,757 $2,010,752 $58,154 -$32,961 -$219,067 -$224,292 -$105,297
Windham Central SU $2,444,379 $1,966,767 $1,944,398 $2,118,658 $2,125,763 $1,881,086 -$477,613 -$499,981 -$325,721 -$318,616 -$563,293
Windham Northeast SU $3,591,905 $2,572,980 $2,555,610 $2,674,054 $2,681,412 $2,791,046 -$1,018,926 -$1,036,296 -$917,851 -$910,493 -$800,859
Windham Southeast SU $6,702,487 $4,602,027 $4,889,887 $5,565,907 $5,566,548 $5,798,668 -$2,100,460 -$1,812,600 -$1,136,580 -$1,135,939 -$903,819
Windham Southwest SU $1,775,089 $1,346,329 $1,356,944 $1,450,093 $1,454,956 $1,353,251 -$428,760 -$418,145 -$324,996 -$320,133 -$421,838
Windsor Central SU $1,457,992 $1,742,616 $1,722,004 $1,680,963 $1,683,381 $1,499,180 $284,624 $264,012 $222,971 $225,389 $41,188
Windsor Southeast SU $3,311,971 $2,686,328 $2,710,280 $2,487,690 $2,496,033 $2,516,993 -$625,643 -$601,691 -$824,281 -$815,938 -$794,978
Hartford SD $3,389,992 $2,808,613 $2,764,629 $2,566,442 $2,567,968 $2,731,233 -$581,379 -$625,364 -$823,550 -$822,024 -$658,759
Dresden Interstate SD $721,963 $1,203,104 $1,160,258 $764,201 $766,764 $770,600 $481,141 $438,295 $42,238 $44,801 $48,637
Springfield SD $3,796,566 $2,517,511 $2,536,367 $2,749,203 $2,755,847 $2,973,822 -$1,279,055 -$1,260,199 -$1,047,363 -$1,040,719 -$822,744
Blue Mountain Union SD $849,151 $781,901 $774,934 $835,987 $836,860 $787,337 -$67,250 -$74,217 -$13,164 -$12,291 -$61,814
Battenkill Valley SU $787,951 $790,451 $790,489 $911,449 $914,505 $858,019 $2,500 $2,538 $123,498 $126,554 $70,068
Barre SU $6,061,119 $4,658,576 $4,678,552 $4,788,206 $4,791,067 $5,128,226 -$1,402,543 -$1,382,567 -$1,272,913 -$1,270,052 -$932,893
Two Rivers SU $2,631,184 $2,079,614 $2,096,520 $2,243,991 $2,248,687 $2,127,390 -$551,570 -$534,664 -$387,193 -$382,497 -$503,794
Rivendell Interstate SD $835,710 $615,844 $590,619 $621,168 $622,608 $577,219 -$219,866 -$245,091 -$214,542 -$213,102 -$258,491
Essex Westford SD $8,298,634 $7,393,618 $7,233,177 $5,961,449 $5,930,909 $6,100,018 -$905,016 -$1,065,457 -$2,337,185 -$2,367,725 -$2,198,616
(this page intentionally left blank)