publication i - universitylib.tkk.fi/diss/2012/isbn9789526046204/article1.pdf · jaakko...
TRANSCRIPT
Publication I
Kauramäki, J., Jääskeläinen, I. P., and Sams, M. Selective attentionincreases both gain and feature selectivity of the human auditory cortex.PLoS ONE, 2(9): e909, September 2007.
© 2007 Authors.Reprinted with permission.
69

Selective Attention Increases Both Gain and FeatureSelectivity of the Human Auditory CortexJaakko Kauramaki*, Iiro P. Jaaskelainen, Mikko Sams
Laboratory of Computational Engineering, Helsinki University of Technology, Espoo, Finland
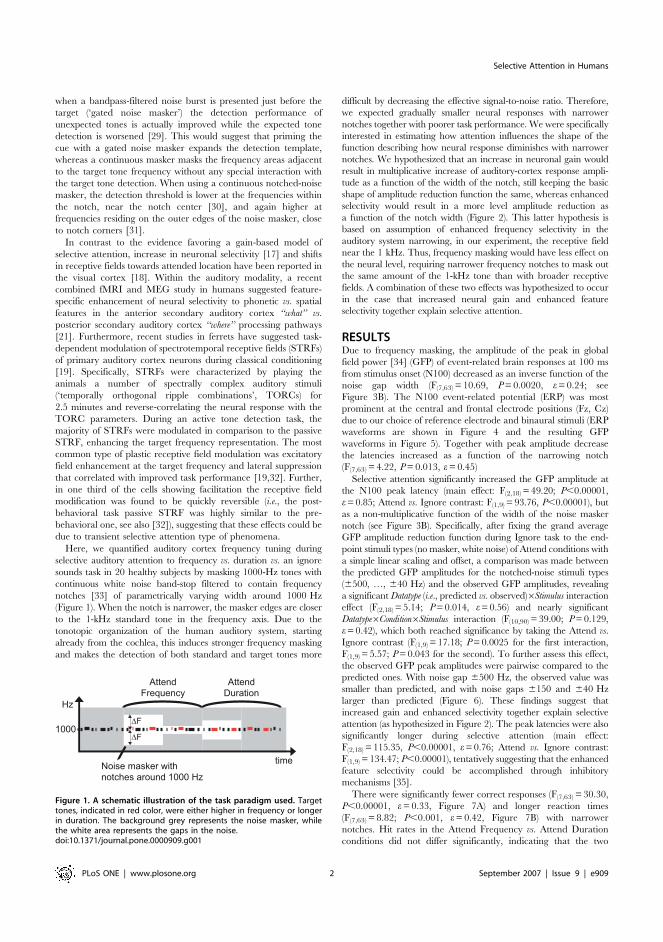
Background. An experienced car mechanic can often deduce what’s wrong with a car by carefully listening to the sound of theailing engine, despite the presence of multiple sources of noise. Indeed, the ability to select task-relevant sounds forawareness, whilst ignoring irrelevant ones, constitutes one of the most fundamental of human faculties, but the underlyingneural mechanisms have remained elusive. While most of the literature explains the neural basis of selective attention bymeans of an increase in neural gain, a number of papers propose enhancement in neural selectivity as an alternative ora complementary mechanism. Methodology/Principal Findings. Here, to address the question whether pure gain increasealone can explain auditory selective attention in humans, we quantified the auditory cortex frequency selectivity in 20 healthysubjects by masking 1000-Hz tones by continuous noise masker with parametrically varying frequency notches around thetone frequency (i.e., a notched-noise masker). The task of the subjects was, in different conditions, to selectively attend toeither occasionally occurring slight increments in tone frequency (1020 Hz), tones of slightly longer duration, or ignore thesounds. In line with previous studies, in the ignore condition, the global field power (GFP) of event-related brain responses at100 ms from the stimulus onset to the 1000-Hz tones was suppressed as a function of the narrowing of the notch width. Duringthe selective attention conditions, the suppressant effect of the noise notch width on GFP was decreased, but as a functionsignificantly different from a multiplicative one expected on the basis of simple gain model of selective attention.Conclusions/Significance. Our results suggest that auditory selective attention in humans cannot be explained by a gainmodel, where only the neural activity level is increased, but rather that selective attention additionally enhances auditorycortex frequency selectivity.
Citation: Kauramaki J, Jaaskelainen IP, Sams M (2007) Selective Attention Increases Both Gain and Feature Selectivity of the Human AuditoryCortex. PLoS ONE 2(9): e909. doi:10.1371/journal.pone.0000909
INTRODUCTIONThe neural basis of selective attention constitutes one of the most
fundamental questions in cognitive neuroscience and psychology.
Based on previous studies in sensory systems, two alternative neural
mechanisms, multiplicative increase in neural gain [1–16] vs.enhanced feature selectivity of the neurons in sensory cortices [17–
21], have been suggested to underlie selective attention. Additionally,
there are theories according to which selective attention activates
neural populations separate from those processing the stimuli [15,22].
When referring to increase in response gain in the literature, terms
like ‘higher’ or ‘increased’ activity are typically used to describe the
observed attentional enhancement in the modality-specific sensory
cortices in human neuroimaging studies. Few studies so far have
addressed the issue of whether this is simple gain change
(amplification) in respective sensory areas [23] or whether there
are some selective changes as well. For example, increase in activity
level has been reported in functional Magnetic Resonance Imaging
(fMRI) [7,11,15,16], positron emission tomography (PET)
[9,10,12,13], electroencephalography (EEG) [1,2,4,6], and magne-
toencephalography (MEG) [3,5,8,14] studies in humans, but the
issue of whether there is a ‘bias’ mechanism in addition to the
attentional gain control has been only recently raised [20].
Typically auditory selective attention studies have employed
a dichotic listening task, instructing subjects to listen to one ear and
ignore the sounds coming from the other (‘attend towards’ vs.‘attend away’). This way, selective attention has been found to
modulate neurophysiological responses to tones 70–80 ms after
the stimulus onset using EEG [1,6] and electrocorticography
(ECoG) [24], and at later latency of 150 ms using MEG [25].
Even earlier attentional modulation between 20–50 ms has been
observed both in EEG and MEG [2,5]. Notably, the N100
response (N100m in MEG) at ,100 ms from stimulus onset,
generated at least partly in the primary auditory cortex [5,8], was
increased in amplitude during selective attention in all of these
studies. Similarly with PET, selectively attending to left and right-
ear tones was found to increase the overall activity in the
contralateral auditory cortices and in frontal cortex [9], while the
visual control task increased signal measured from the occipital
visual areas. However, the dichotic listening task has some features
making inference about the neurophysiological attentional mech-
anisms problematic, for instance, because of interaction between
left and right side of the brain during binaural vs. monaural
listening (see, e.g., [26]).
When subjects are led to expect tones of a certain frequency,
they tend to detect the expected frequency tones better than the
ones with an unexpected frequency when using a continuous noise
masker [27,28]. The frequency range where perception is
enhanced, ‘attentional band’, resembles the critical band and
auditory filter measures obtained psychophysically [27]. However,
Academic Editor: Justin Harris, University of Sydney, Australia
Received April 20, 2007; Accepted August 23, 2007; Published September 19,2007
Copyright: � 2007 Kauramaki et al. This is an open-access article distributedunder the terms of the Creative Commons Attribution License, which permitsunrestricted use, distribution, and reproduction in any medium, provided theoriginal author and source are credited.
Funding: This study was financially supported by the Academy of Finland (grantnos. 206368, 212261, 213470) and by the National Institutes of Health (grantno. RO1-HD040712).
Competing Interests: The authors have declared that no competing interestsexist.
* To whom correspondence should be addressed. E-mail: [email protected]
PLoS ONE | www.plosone.org 1 September 2007 | Issue 9 | e909
when a bandpass-filtered noise burst is presented just before the
target (‘gated noise masker’) the detection performance of
unexpected tones is actually improved while the expected tone
detection is worsened [29]. This would suggest that priming the
cue with a gated noise masker expands the detection template,
whereas a continuous masker masks the frequency areas adjacent
to the target tone frequency without any special interaction with
the target tone detection. When using a continuous notched-noise
masker, the detection threshold is lower at the frequencies within
the notch, near the notch center [30], and again higher at
frequencies residing on the outer edges of the noise masker, close
to notch corners [31].
In contrast to the evidence favoring a gain-based model of
selective attention, increase in neuronal selectivity [17] and shifts
in receptive fields towards attended location have been reported in
the visual cortex [18]. Within the auditory modality, a recent
combined fMRI and MEG study in humans suggested feature-
specific enhancement of neural selectivity to phonetic vs. spatial
features in the anterior secondary auditory cortex ‘‘what’’ vs.
posterior secondary auditory cortex ‘‘where’’ processing pathways
[21]. Furthermore, recent studies in ferrets have suggested task-
dependent modulation of spectrotemporal receptive fields (STRFs)
of primary auditory cortex neurons during classical conditioning
[19]. Specifically, STRFs were characterized by playing the
animals a number of spectrally complex auditory stimuli
(‘temporally orthogonal ripple combinations’, TORCs) for
2.5 minutes and reverse-correlating the neural response with the
TORC parameters. During an active tone detection task, the
majority of STRFs were modulated in comparison to the passive
STRF, enhancing the target frequency representation. The most
common type of plastic receptive field modulation was excitatory
field enhancement at the target frequency and lateral suppression
that correlated with improved task performance [19,32]. Further,
in one third of the cells showing facilitation the receptive field
modification was found to be quickly reversible (i.e., the post-
behavioral task passive STRF was highly similar to the pre-
behavioral one, see also [32]), suggesting that these effects could be
due to transient selective attention type of phenomena.
Here, we quantified auditory cortex frequency tuning during
selective auditory attention to frequency vs. duration vs. an ignore
sounds task in 20 healthy subjects by masking 1000-Hz tones with
continuous white noise band-stop filtered to contain frequency
notches [33] of parametrically varying width around 1000 Hz
(Figure 1). When the notch is narrower, the masker edges are closer
to the 1-kHz standard tone in the frequency axis. Due to the
tonotopic organization of the human auditory system, starting
already from the cochlea, this induces stronger frequency masking
and makes the detection of both standard and target tones more
difficult by decreasing the effective signal-to-noise ratio. Therefore,
we expected gradually smaller neural responses with narrower
notches together with poorer task performance. We were specifically
interested in estimating how attention influences the shape of the
function describing how neural response diminishes with narrower
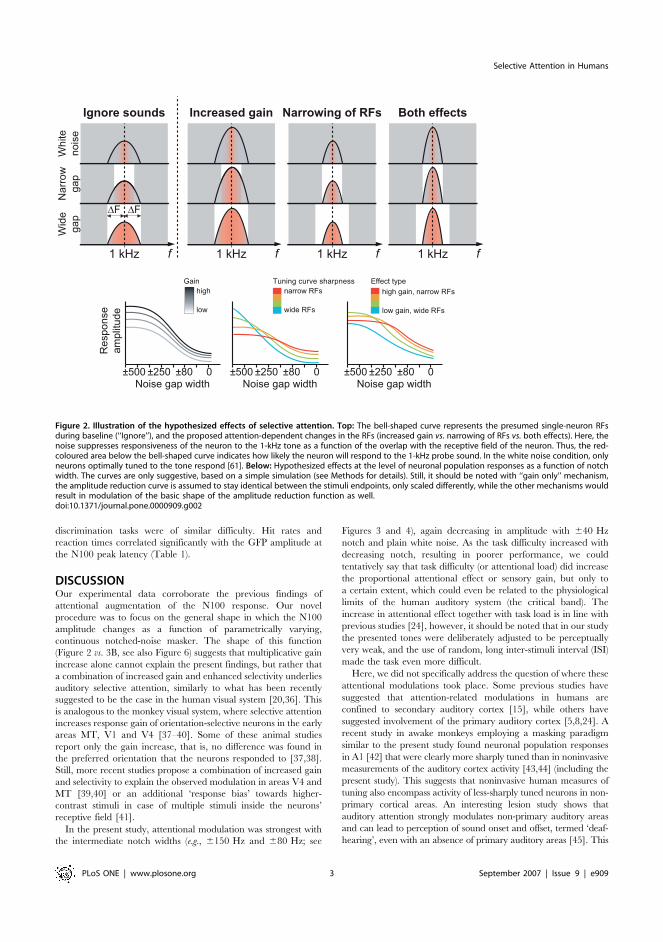
notches. We hypothesized that an increase in neuronal gain would
result in multiplicative increase of auditory-cortex response ampli-
tude as a function of the width of the notch, still keeping the basic
shape of amplitude reduction function the same, whereas enhanced
selectivity would result in a more level amplitude reduction as
a function of the notch width (Figure 2). This latter hypothesis is
based on assumption of enhanced frequency selectivity in the
auditory system narrowing, in our experiment, the receptive field
near the 1 kHz. Thus, frequency masking would have less effect on
the neural level, requiring narrower frequency notches to mask out
the same amount of the 1-kHz tone than with broader receptive
fields. A combination of these two effects was hypothesized to occur
in the case that increased neural gain and enhanced feature
selectivity together explain selective attention.
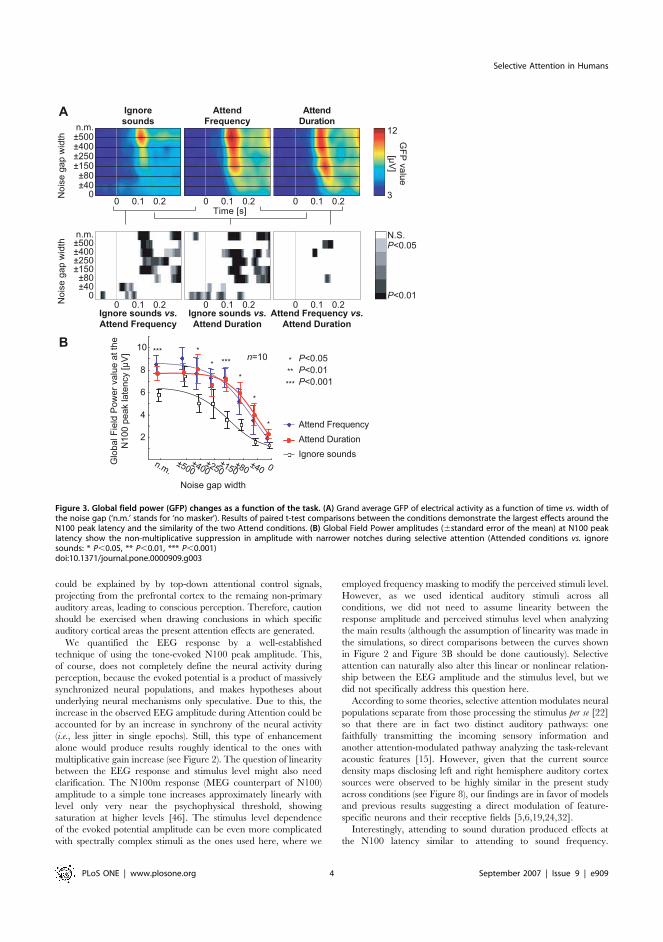
RESULTSDue to frequency masking, the amplitude of the peak in global
field power [34] (GFP) of event-related brain responses at 100 ms
from stimulus onset (N100) decreased as an inverse function of the
noise gap width (F(7,63) = 10.69, P=0.0020, e=0.24; see
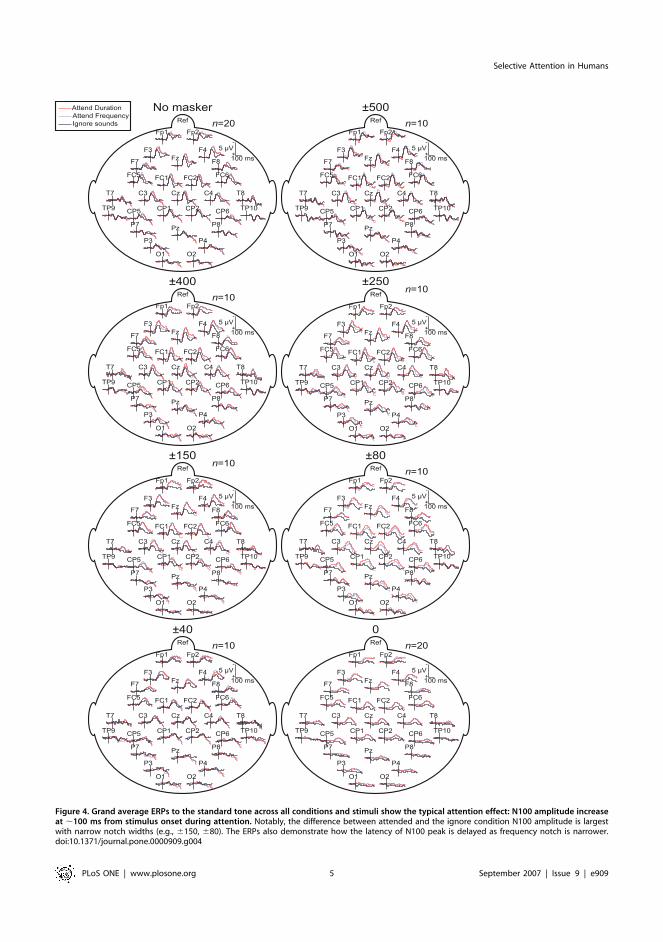
Figure 3B). The N100 event-related potential (ERP) was most
prominent at the central and frontal electrode positions (Fz, Cz)
due to our choice of reference electrode and binaural stimuli (ERP
waveforms are shown in Figure 4 and the resulting GFP
waveforms in Figure 5). Together with peak amplitude decrease
the latencies increased as a function of the narrowing notch
(F(7,63) = 4.22, P=0.013, e=0.45)
Selective attention significantly increased the GFP amplitude at
the N100 peak latency (main effect: F(2,18) = 49.20; P,0.00001,
e=0.85; Attend vs. Ignore contrast: F(1,9) = 93.76, P,0.00001), but
as a non-multiplicative function of the width of the noise masker
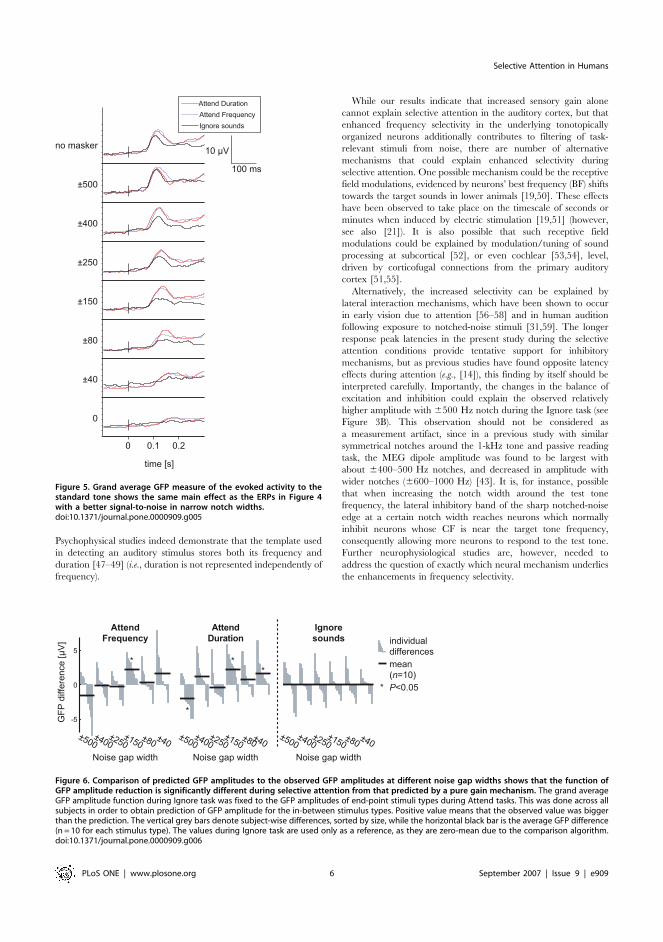
notch (see Figure 3B). Specifically, after fixing the grand average
GFP amplitude reduction function during Ignore task to the end-
point stimuli types (no masker, white noise) of Attend conditions with
a simple linear scaling and offset, a comparison was made between
the predicted GFP amplitudes for the notched-noise stimuli types
(6500, …, 640 Hz) and the observed GFP amplitudes, revealing
a significant Datatype (i.e., predicted vs. observed)6Stimulus interactioneffect (F(2,18) = 5.14; P=0.014, e=0.56) and nearly significant
Datatype6Condition6Stimulus interaction (F(10,90) = 39.00; P=0.129,
e=0.42), which both reached significance by taking the Attend vs.Ignore contrast (F(1,9) = 17.18; P=0.0025 for the first interaction,
F(1,9) = 5.57; P=0.043 for the second). To further assess this effect,
the observed GFP peak amplitudes were pairwise compared to the
predicted ones. With noise gap 6500 Hz, the observed value was
smaller than predicted, and with noise gaps 6150 and 640 Hz
larger than predicted (Figure 6). These findings suggest that
increased gain and enhanced selectivity together explain selective
attention (as hypothesized in Figure 2). The peak latencies were also
significantly longer during selective attention (main effect:
F(2,18) = 115.35, P,0.00001, e=0.76; Attend vs. Ignore contrast:
F(1,9) = 134.47; P,0.00001), tentatively suggesting that the enhanced
feature selectivity could be accomplished through inhibitory
mechanisms [35].
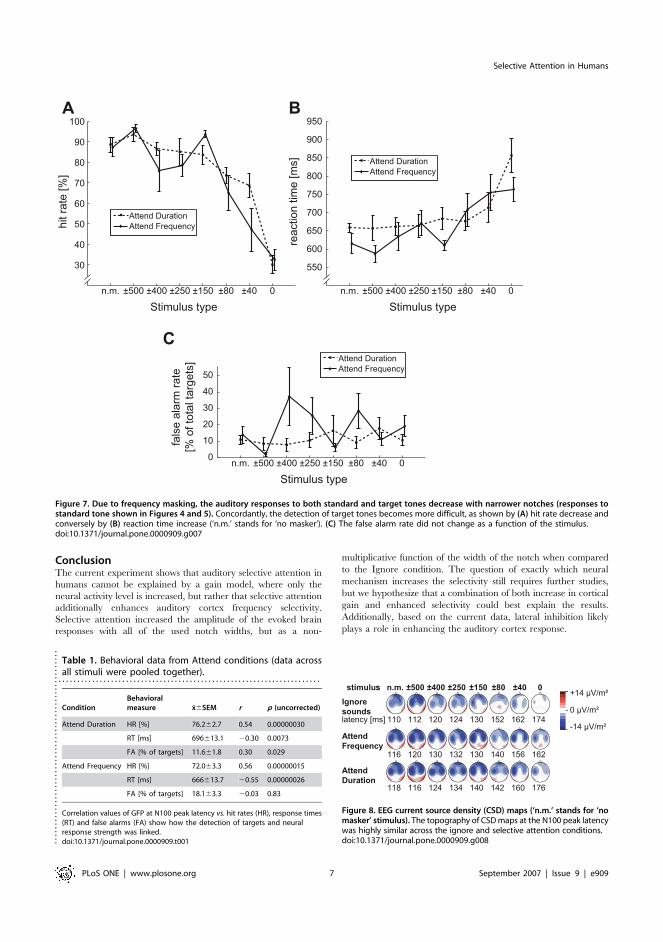
There were significantly fewer correct responses (F(7,63) = 30.30,
P,0.00001, e=0.33, Figure 7A) and longer reaction times
(F(7,63) = 8.82; P,0.001, e=0.42, Figure 7B) with narrower
notches. Hit rates in the Attend Frequency vs. Attend Duration
conditions did not differ significantly, indicating that the two
Attend
Frequency
Noise masker with
notches around 1000 Hz
Attend
Duration
1000
Hz
time
ΔF
ΔF
Figure 1. A schematic illustration of the task paradigm used. Targettones, indicated in red color, were either higher in frequency or longerin duration. The background grey represents the noise masker, whilethe white area represents the gaps in the noise.doi:10.1371/journal.pone.0000909.g001
Selective Attention in Humans
PLoS ONE | www.plosone.org 2 September 2007 | Issue 9 | e909
discrimination tasks were of similar difficulty. Hit rates and
reaction times correlated significantly with the GFP amplitude at
the N100 peak latency (Table 1).
DISCUSSIONOur experimental data corroborate the previous findings of
attentional augmentation of the N100 response. Our novel
procedure was to focus on the general shape in which the N100
amplitude changes as a function of parametrically varying,
continuous notched-noise masker. The shape of this function
(Figure 2 vs. 3B, see also Figure 6) suggests that multiplicative gain
increase alone cannot explain the present findings, but rather that
a combination of increased gain and enhanced selectivity underlies
auditory selective attention, similarly to what has been recently
suggested to be the case in the human visual system [20,36]. This
is analogous to the monkey visual system, where selective attention
increases response gain of orientation-selective neurons in the early
areas MT, V1 and V4 [37–40]. Some of these animal studies
report only the gain increase, that is, no difference was found in
the preferred orientation that the neurons responded to [37,38].
Still, more recent studies propose a combination of increased gain
and selectivity to explain the observed modulation in areas V4 and
MT [39,40] or an additional ‘response bias’ towards higher-
contrast stimuli in case of multiple stimuli inside the neurons’
receptive field [41].
In the present study, attentional modulation was strongest with
the intermediate notch widths (e.g., 6150 Hz and 680 Hz; see
Figures 3 and 4), again decreasing in amplitude with 640 Hz
notch and plain white noise. As the task difficulty increased with
decreasing notch, resulting in poorer performance, we could
tentatively say that task difficulty (or attentional load) did increase
the proportional attentional effect or sensory gain, but only to
a certain extent, which could even be related to the physiological
limits of the human auditory system (the critical band). The
increase in attentional effect together with task load is in line with
previous studies [24], however, it should be noted that in our study
the presented tones were deliberately adjusted to be perceptually
very weak, and the use of random, long inter-stimuli interval (ISI)
made the task even more difficult.
Here, we did not specifically address the question of where these
attentional modulations took place. Some previous studies have
suggested that attention-related modulations in humans are
confined to secondary auditory cortex [15], while others have
suggested involvement of the primary auditory cortex [5,8,24]. A
recent study in awake monkeys employing a masking paradigm
similar to the present study found neuronal population responses
in A1 [42] that were clearly more sharply tuned than in noninvasive
measurements of the auditory cortex activity [43,44] (including the
present study). This suggests that noninvasive human measures of
tuning also encompass activity of less-sharply tuned neurons in non-
primary cortical areas. An interesting lesion study shows that
auditory attention strongly modulates non-primary auditory areas
and can lead to perception of sound onset and offset, termed ‘deaf-
hearing’, even with an absence of primary auditory areas [45]. This
Ignore sounds
f1 kHz
ΔFΔF
Increased gain
f1 kHz
Narrowing of RFs
f1 kHz
Both effects
f1 kHz
Re
sp
on
se
am
plit
ud
e
Noise gap width±500 ±250 ±80 0
high
low
Gain
wide RFs
narrow RFs
Tuning curve sharpness
±500 ±250 ±80 0Noise gap width
high gain, narrow RFs
low gain, wide RFs
Effect type
±500 ±250 ±80 0Noise gap width
Wh
ite
no
ise
Wid
e
ga
p
Na
rro
w
ga
p
Figure 2. Illustration of the hypothesized effects of selective attention. Top: The bell-shaped curve represents the presumed single-neuron RFsduring baseline (‘‘Ignore’’), and the proposed attention-dependent changes in the RFs (increased gain vs. narrowing of RFs vs. both effects). Here, thenoise suppresses responsiveness of the neuron to the 1-kHz tone as a function of the overlap with the receptive field of the neuron. Thus, the red-coloured area below the bell-shaped curve indicates how likely the neuron will respond to the 1-kHz probe sound. In the white noise condition, onlyneurons optimally tuned to the tone respond [61]. Below: Hypothesized effects at the level of neuronal population responses as a function of notchwidth. The curves are only suggestive, based on a simple simulation (see Methods for details). Still, it should be noted with ‘‘gain only’’ mechanism,the amplitude reduction curve is assumed to stay identical between the stimuli endpoints, only scaled differently, while the other mechanisms wouldresult in modulation of the basic shape of the amplitude reduction function as well.doi:10.1371/journal.pone.0000909.g002
Selective Attention in Humans
PLoS ONE | www.plosone.org 3 September 2007 | Issue 9 | e909
could be explained by by top-down attentional control signals,
projecting from the prefrontal cortex to the remaing non-primary
auditory areas, leading to conscious perception. Therefore, caution
should be exercised when drawing conclusions in which specific
auditory cortical areas the present attention effects are generated.
We quantified the EEG response by a well-established
technique of using the tone-evoked N100 peak amplitude. This,
of course, does not completely define the neural activity during
perception, because the evoked potential is a product of massively
synchronized neural populations, and makes hypotheses about
underlying neural mechanisms only speculative. Due to this, the
increase in the observed EEG amplitude during Attention could be
accounted for by an increase in synchrony of the neural activity
(i.e., less jitter in single epochs). Still, this type of enhancement
alone would produce results roughly identical to the ones with
multiplicative gain increase (see Figure 2). The question of linearity
between the EEG response and stimulus level might also need
clarification. The N100m response (MEG counterpart of N100)
amplitude to a simple tone increases approximately linearly with
level only very near the psychophysical threshold, showing
saturation at higher levels [46]. The stimulus level dependence
of the evoked potential amplitude can be even more complicated
with spectrally complex stimuli as the ones used here, where we
employed frequency masking to modify the perceived stimuli level.
However, as we used identical auditory stimuli across all
conditions, we did not need to assume linearity between the
response amplitude and perceived stimulus level when analyzing
the main results (although the assumption of linearity was made in
the simulations, so direct comparisons between the curves shown
in Figure 2 and Figure 3B should be done cautiously). Selective
attention can naturally also alter this linear or nonlinear relation-
ship between the EEG amplitude and the stimulus level, but we
did not specifically address this question here.
According to some theories, selective attention modulates neural
populations separate from those processing the stimulus per se [22]so that there are in fact two distinct auditory pathways: one
faithfully transmitting the incoming sensory information and
another attention-modulated pathway analyzing the task-relevant
acoustic features [15]. However, given that the current source
density maps disclosing left and right hemisphere auditory cortex
sources were observed to be highly similar in the present study
across conditions (see Figure 8), our findings are in favor of models
and previous results suggesting a direct modulation of feature-
specific neurons and their receptive fields [5,6,19,24,32].
Interestingly, attending to sound duration produced effects at
the N100 latency similar to attending to sound frequency.
Attend
Frequency
Attend
Duration
Time [s]
n.m.±500±400±250±150±80±40
0
n.m.±500±400±250±150±80±40
0
0 0.1 0.2
Ignore sounds vs.
Attend Frequency
Ignore sounds vs.
Attend Duration
Attend Frequency vs.
Attend Duration
0 0.1 0.2 0 0.1 0.2
0 0.1 0.2 0 0.1 0.2 0 0.1 0.2
No
ise
ga
p w
idth
No
ise
ga
p w
idth
3
12
GF
P v
alu
e
[μV
]
Ignore
soundsA
N.S.P<0.05
P<0.01
B
Glo
ba
l F
ield
Po
we
r va
lue
at
the
N1
00
pe
ak la
ten
cy [
μV
]
*
*** *
***
*
*
* Attend Frequency
Attend Duration
Ignore sounds
P<0.05
P<0.01
P<0.001
*
**
***
Noise gap width
2
4
6
8
10n=10
±500±400
±250±150
±80±40
n.m.0
Figure 3. Global field power (GFP) changes as a function of the task. (A) Grand average GFP of electrical activity as a function of time vs. width ofthe noise gap (‘n.m.’ stands for ‘no masker’). Results of paired t-test comparisons between the conditions demonstrate the largest effects around theN100 peak latency and the similarity of the two Attend conditions. (B) Global Field Power amplitudes (6standard error of the mean) at N100 peaklatency show the non-multiplicative suppression in amplitude with narrower notches during selective attention (Attended conditions vs. ignoresounds: * P,0.05, ** P,0.01, *** P,0.001)doi:10.1371/journal.pone.0000909.g003
Selective Attention in Humans
PLoS ONE | www.plosone.org 4 September 2007 | Issue 9 | e909
Attend Duration
Attend Frequency
Ignore sounds
100 ms
5 μV
Ref
No masker
-
+
n=20
n=10 n=10
n=10 n=10
n=10 n=20
n=10
100 ms
5 μV
Ref
±500
-
+
100 ms
5 μV
Ref
±400
-
+100 ms
5 μV
Ref
±250
-
+
100 ms
5 μV
Ref
±150
-
+100 ms
5 μV
Ref
±80
-
+
100 ms
5 μV
Ref
±40
-
+100 ms
5 μV
Ref
0
-
+
Fp1 Fp2
F3 F4
C3 C4
P3 P4
O1 O2
F7 F8
T7 T8
P7 P8
Fz
Cz
Pz
FC1 FC2
CP1 CP2
FC5 FC6
CP5 CP6TP9 TP10
Fp1 Fp2
F3 F4
C3 C4
P3 P4
O1 O2
F7 F8
T7 T8
P7 P8
Fz
Cz
Pz
FC1 FC2
CP1 CP2
FC5 FC6
CP5 CP6TP9 TP10
Fp1 Fp2
F3 F4
C3 C4
P3 P4
O1 O2
F7 F8
T7 T8
P7 P8
Fz
Cz
Pz
FC1 FC2
CP1 CP2
FC5 FC6
CP5 CP6TP9 TP10
Fp1 Fp2
F3 F4
C3 C4
P3 P4
O1 O2
F7 F8
T7 T8
P7 P8
Fz
Cz
Pz
FC1 FC2
CP1 CP2
FC5 FC6
CP5 CP6TP9 TP10
Fp1 Fp2
F3 F4
C3 C4
P3 P4
O1 O2
F7 F8
T7 T8
P7 P8
Fz
Cz
Pz
FC1 FC2
CP1 CP2
FC5 FC6
CP5 CP6TP9 TP10
Fp1 Fp2
F3 F4
C3 C4
P3 P4
O1 O2
F7 F8
T7 T8
P7 P8
Fz
Cz
Pz
FC1 FC2
CP1 CP2
FC5 FC6
CP5 CP6TP9 TP10
Fp1 Fp2
F3 F4
C3 C4
P3 P4
O1 O2
F7 F8
T7 T8
P7 P8
Fz
Cz
Pz
FC1 FC2
CP1 CP2
FC5 FC6
CP5 CP6TP9 TP10
Fp1 Fp2
F3 F4
C3 C4
P3 P4
O1 O2
F7 F8
T7 T8
P7 P8
Fz
Cz
Pz
FC1 FC2
CP1 CP2
FC5 FC6
CP5 CP6TP9 TP10
Figure 4. Grand average ERPs to the standard tone across all conditions and stimuli show the typical attention effect: N100 amplitude increaseat ,100 ms from stimulus onset during attention. Notably, the difference between attended and the ignore condition N100 amplitude is largestwith narrow notch widths (e.g., 6150, 680). The ERPs also demonstrate how the latency of N100 peak is delayed as frequency notch is narrower.doi:10.1371/journal.pone.0000909.g004
Selective Attention in Humans
PLoS ONE | www.plosone.org 5 September 2007 | Issue 9 | e909
Psychophysical studies indeed demonstrate that the template used
in detecting an auditory stimulus stores both its frequency and
duration [47–49] (i.e., duration is not represented independently of
frequency).
While our results indicate that increased sensory gain alone
cannot explain selective attention in the auditory cortex, but that
enhanced frequency selectivity in the underlying tonotopically
organized neurons additionally contributes to filtering of task-
relevant stimuli from noise, there are number of alternative
mechanisms that could explain enhanced selectivity during
selective attention. One possible mechanism could be the receptive
field modulations, evidenced by neurons’ best frequency (BF) shifts
towards the target sounds in lower animals [19,50]. These effects
have been observed to take place on the timescale of seconds or
minutes when induced by electric stimulation [19,51] (however,
see also [21]). It is also possible that such receptive field
modulations could be explained by modulation/tuning of sound
processing at subcortical [52], or even cochlear [53,54], level,
driven by corticofugal connections from the primary auditory
cortex [51,55].
Alternatively, the increased selectivity can be explained by
lateral interaction mechanisms, which have been shown to occur
in early vision due to attention [56–58] and in human audition
following exposure to notched-noise stimuli [31,59]. The longer
response peak latencies in the present study during the selective
attention conditions provide tentative support for inhibitory
mechanisms, but as previous studies have found opposite latency
effects during attention (e.g., [14]), this finding by itself should be
interpreted carefully. Importantly, the changes in the balance of
excitation and inhibition could explain the observed relatively
higher amplitude with 6500 Hz notch during the Ignore task (see
Figure 3B). This observation should not be considered as
a measurement artifact, since in a previous study with similar
symmetrical notches around the 1-kHz tone and passive reading
task, the MEG dipole amplitude was found to be largest with
about 6400–500 Hz notches, and decreased in amplitude with
wider notches (6600–1000 Hz) [43]. It is, for instance, possible
that when increasing the notch width around the test tone
frequency, the lateral inhibitory band of the sharp notched-noise
edge at a certain notch width reaches neurons which normally
inhibit neurons whose CF is near the target tone frequency,
consequently allowing more neurons to respond to the test tone.
Further neurophysiological studies are, however, needed to
address the question of exactly which neural mechanism underlies
the enhancements in frequency selectivity.
Attend Duration
Attend Frequency
Ignore sounds
no masker
±500
±400
±250
±150
±80
±40
0
0 0.1 0.2
time [s]
100 ms
10 μV
Figure 5. Grand average GFP measure of the evoked activity to thestandard tone shows the same main effect as the ERPs in Figure 4with a better signal-to-noise in narrow notch widths.doi:10.1371/journal.pone.0000909.g005
±500±400
±250±150
±80±40
±500±400
±250±150
±80±40
±500±400
±250±150
±80±40
-5
0
5
GF
P d
iffe
ren
ce
[μ
V]
Attend
Frequency
Attend
Duration
Ignore
sounds
Noise gap width
*
*
**
*
Noise gap width Noise gap width
individual
differences
P<0.05
mean
(n=10)
Figure 6. Comparison of predicted GFP amplitudes to the observed GFP amplitudes at different noise gap widths shows that the function ofGFP amplitude reduction is significantly different during selective attention from that predicted by a pure gain mechanism. The grand averageGFP amplitude function during Ignore task was fixed to the GFP amplitudes of end-point stimuli types during Attend tasks. This was done across allsubjects in order to obtain prediction of GFP amplitude for the in-between stimulus types. Positive value means that the observed value was biggerthan the prediction. The vertical grey bars denote subject-wise differences, sorted by size, while the horizontal black bar is the average GFP difference(n = 10 for each stimulus type). The values during Ignore task are used only as a reference, as they are zero-mean due to the comparison algorithm.doi:10.1371/journal.pone.0000909.g006
Selective Attention in Humans
PLoS ONE | www.plosone.org 6 September 2007 | Issue 9 | e909
ConclusionThe current experiment shows that auditory selective attention in
humans cannot be explained by a gain model, where only the
neural activity level is increased, but rather that selective attention
additionally enhances auditory cortex frequency selectivity.
Selective attention increased the amplitude of the evoked brain
responses with all of the used notch widths, but as a non-
multiplicative function of the width of the notch when compared
to the Ignore condition. The question of exactly which neural
mechanism increases the selectivity still requires further studies,
but we hypothesize that a combination of both increase in cortical
gain and enhanced selectivity could best explain the results.
Additionally, based on the current data, lateral inhibition likely
plays a role in enhancing the auditory cortex response.
C
BA
n.m. ±500 ±400 ±250 ±150 ±80 ±40 0
30
40
50
60
70
80
90
100
Stimulus type
n.m. ±500 ±400 ±250 ±150 ±80 ±40 0
Stimulus type
n.m. ±500 ±400 ±250 ±150 ±80 ±40 0
Stimulus type
fals
e a
larm
rate
[% o
f to
tal ta
rgets
]
Attend Duration
Attend Frequency
Attend Duration
Attend Frequency
Attend Duration
Attend Frequency
550
600
650
700
750
800
850
900
950
reaction tim
e [m
s]
hit r
ate
[%
]
0
10
20
30
40
50
Figure 7. Due to frequency masking, the auditory responses to both standard and target tones decrease with narrower notches (responses tostandard tone shown in Figures 4 and 5). Concordantly, the detection of target tones becomes more difficult, as shown by (A) hit rate decrease andconversely by (B) reaction time increase (‘n.m.’ stands for ‘no masker’). (C) The false alarm rate did not change as a function of the stimulus.doi:10.1371/journal.pone.0000909.g007
Table 1. Behavioral data from Attend conditions (data acrossall stimuli were pooled together).. . . . . . . . . . . . . . . . . . . . . . . . . . . . . . . . . . . . . . . . . . . . . . . . . . . . . . . . . . . . . . . . . . . . . .
ConditionBehavioralmeasure x6SEM r p (uncorrected)
Attend Duration HR [%] 76.262.7 0.54 0.00000030
RT [ms] 696613.1 20.30 0.0073
FA [% of targets] 11.661.8 0.30 0.029
Attend Frequency HR [%] 72.063.3 0.56 0.00000015
RT [ms] 666613.7 20.55 0.00000026
FA [% of targets] 18.163.3 20.03 0.83
Correlation values of GFP at N100 peak latency vs. hit rates (HR), response times(RT) and false alarms (FA) show how the detection of targets and neuralresponse strength was linked.doi:10.1371/journal.pone.0000909.t001..
..................................................
Ignoresounds
AttendFrequency
Attend Duration
stimulus: n.m. ±500 ±400 ±250 ±150 ±80 ±40 0
latency [ms]
+14 μV/m²
0 μV/m²
-14 μV/m²110 112 120 124 130 152 162 174
118 116 124 134 140 142 160 176
116 120 130 132 130 140 156 162
Figure 8. EEG current source density (CSD) maps (‘n.m.’ stands for ‘nomasker’ stimulus). The topography of CSDmaps at the N100 peak latencywas highly similar across the ignore and selective attention conditions.doi:10.1371/journal.pone.0000909.g008
Selective Attention in Humans
PLoS ONE | www.plosone.org 7 September 2007 | Issue 9 | e909
MATERIALS AND METHODS
Subjects and stimuli20 healthy right-handed volunteers (13 males and 7 females, age 18–
28 years) with normal hearing participated in the study. The studies
were carried out in accordance with the Helsinki Declaration, ethical
approval was obtained from the Coordinating Ethics Committee of
the Hospital District of Helsinki and Uusimaa and a written
voluntary consent was obtained from each subject prior to
participation. The stimulus paradigm used was highly similar to
one that we have previously used to quantify auditory-cortex sound
frequency tuning [43]. Within a given block, repetitive 100 ms
1000 Hz sine wave tones (65 dB SPL, inter-stimulus interval (ISI)
1.5–2.5 s) were presented either in silence, during continuous white
noise, or during white noise band-stop filtered (120 dB/Hz) with one
of six different notch widths6DF (6500,6400,6250,6150,680,
and 640 Hz) centered at 1000 Hz. The SPL of the noise maskers
was adjusted before the experiment in 1-dB steps [60] so that the
1000-Hz tones were at 50% hearing threshold with the white noise
masker (range: 47–53 dB SPL). To keep the length of the sessions
within reasonable limits, half of the notched-noise maskers (6500,
6150, and 640 Hz) were presented to 10 of the subjects, and the
rest of the noise maskers (6400,6250 and680) to the remaining 10
subjects. Occasionally, the 1000 Hz tones were replaced by
infrequent target tones either higher in frequency (5%, 1020 Hz),
longer in duration (5%, 150 ms), or both higher in frequency and of
longer duration (5%). All tones had 5-ms linear rise and fall times.
The auditory stimuli were presented using a PC and Presentation
Software (Neurobehavioral Systems Inc., Albany, CA, USA). All of
the sound files used in the experiment were created using Matlab
(R12.1, MathWorks Inc., Natick, MA, USA) with 44.1-kHz
sampling frequency and 16-bit precision. The sounds were presented
binaurally through two high-quality speakers (Roland Stereo Micro
Monitor MA-8), which were located symmetrically on both sides of
the computer monitor (distance from subjects’ head one meter).
In addition to the baseline condition, where the subjects were
instructed to watch a silent movie and ignore the auditory stimuli,
there were two discrimination conditions, where the subjects had
to press a button with their right index finger in response to
detection of frequency deviants (Attend Frequency), and duration
deviants (Attend Duration). During these tasks, a small fixation
cross was displayed on the computer screen. Identical auditory
stimuli were presented during all three tasks. A hit was defined as
a button press before the onset of the next stimulus. Late responses
and responses to non-target stimuli were regarded as false alarms.
Data acquisition and analysisThe 32-channel EEG was recorded (0.1–225 Hz passband, 500 Hz
sampling rate; Brain Products GmbH, Germany) in a sound-
attenuated and electrically shielded room. 800-ms epochs with 200-
ms pre-stimulus baseline were filtered with a 0.5–40 Hz passband
and averaged relative to the onset of the 1000-Hz sounds, with
responses exceeding675 mV at any channel rejected due to possible
extra-cerebral artifacts. The number of accepted epochs per stimulus
type and condition (e.g., a given noise-masker type during Attend
Frequency condition) was on average 108 (out of 119).
After averaging and obtaining the event-related potential (ERP),
the Global Field Power (GFP) measure [34] was calculated for
each epoch with a formula
GFP(tk)~
ffiffiffiffiffiffiffiffiffiffiffiffiffiffiffiffiffiffiffiffiffiffiffiffiffiffiffiffiffiffiffiffiffiffiffiffiffiffiffiffiffiffiffiffiffiffiffiffiffiffiffiffiffiXni~1
Xnj~1
ui(tk){uj(tk)� ��
2n
vuut , ð1Þ
where ui,uj are the evoked potentials from channel numbers i,j ateach time point tk, and n is the number of electrodes used. The
GFP peak latencies for N100 response at around 100 ms were
determined for each stimulus type and condition from the grand
averaged GFP. Mean GFP amplitude of 620-ms time window
around this grand average peak latency was then used as the N100
peak value for each subject. The mean GFP value during pre-
stimulus period (100–0 ms) did not differ significantly across
stimuli or conditions, so it was subtracted from the N100 peak; the
resulting value was used as the individual GFP value in further
analysis. Scalp current densities were also calculated for each
stimulus type and condition, to reveal possible changes in source
configuration across conditions. Behavioral and neurophysiolog-
ical data were analyzed using a two-way, repeated measures
analysis of variance (ANOVA), with Condition (Attend frequency,
Attend duration, Ignore sounds) and Stimulus (no masker, 6500,
…, 0) as within-subjects factors. To test the hypothesis that
function of amplitude reduction was modified during attention, an
additional Datatype (observed data vs. predicted data) within-
subject factor was used. The reported p-values from the ANOVA
were corrected using Greenhouse-Geisser correction for degrees of
freedom, but are reported with original, uncorrected degrees of
freedom.
Simulation of hypothesized effectsThe simulation of different effects of attention to the neural
response amplitude (depicted in Figure 2) was done in Matlab
(R12.1, MathWorks Inc., Natick, MA, USA). There, an array of
neuron-like elements was created, each with own characteristic
frequency (CF) and tuning curve around it. The basic shape of the
tuning curve was a single-parameter rounded-exponential Roex(p)filter
W (g)~(1zpg)e{pg, ð2Þ
where p is the steepness of the filter and g the relative width of the
frequency notch. Here, the Roex(p) filter shape was chosen only for
simplicity and g was used as a factor of difference between each
neurons CF and the 1-kHz probe sound. Neurons’ firing
probability at each time point during stimulus presentation was
inversely proportional to the tuning curve shape. The time course
of this hypothetical ‘neural population’ was calculated in 1-ms
steps, during which each neuron was either ‘on’ or ‘off’, and the
population response amplitude was defined as number of active
neurons during stimulus presentation vs. baseline.The effect of multiplicative gain was simulated by increasing the
firing probability for each neuron (i.e., lower threshold of
activation for all the simulated neurons). The tuning curve
sharpness change was simulated by changing the p parameter in
Roex(p) auditory filter, uniformly across all simulated CFs (higher p,sharper tuning curve). In addition to the isolated changes,
a combination of effects was simulated by both increasing the
gain and sharpness.
ACKNOWLEDGMENTSWe thank M. Andermann for comments.
Author Contributions
Conceived and designed the experiments: JK IJ MS. Performed the
experiments: JK. Analyzed the data: JK. Wrote the paper: JK IJ MS.
Selective Attention in Humans
PLoS ONE | www.plosone.org 8 September 2007 | Issue 9 | e909
REFERENCES1. Hillyard SA, Hink RF, Schwent VL, Picton TW (1973) Electrical Signs of
Selective Attention in the Human Brain. Science 182: 177–180. 10.1126/
science.182.4108.177.
2. Woldorff MG, Hillyard SA (1991) Modulation of early auditory processing
during selective listening to rapidly presented tones. Electroencephalogr ClinNeurophysiol 79: 170–191. 10.1016/0013-4694(91)90136-R.
3. Rif J, Hari R, Hamalainen MS, Sams M (1991) Auditory attention affects twodifferent areas in the human supratemporal cortex. Electroencephalogr Clin
Neurophysiol 79: 464–472. 10.1016/0013-4694(91)90166-2.
4. Tiitinen H, Sinkkonen J, Reinikainen K, Alho K, Lavikainen J, et al. (1993)
Selective attention enhances the auditory 40-Hz transient response in humans.Nature 364: 59–60. 10.1038/364059a0.
5. Woldorff MG, Gallen CC, Hampson SA, Hillyard SA, Pantev C, et al. (1993)Modulation of Early Sensory Processing in Human Auditory Cortex During
Auditory Selective Attention. Proc Natl Acad Sci USA 90: 8722–8726. 10.1073/
pnas.90.18.8722.
6. Alcaini M, Giard MH, Echallier JF, Pernier J (1994) Selective auditory attention
effects in tonotopically organized cortical areas: A topographic ERP study. HumBrain Mapp 2: 159–169. 10.1002/hbm.460020305.
7. Grady C, Van Meter JW, Maisog JM, Pietrini P, Krasuski J, et al. (1997)Attention-related modulation of activity in primary and secondary auditory
cortex. NeuroReport 8: 2511–2516.
8. Fujiwara N, Nagamine T, Imai M, Tanaka T, Shibasaki H (1998) Role of the
primary auditory cortex in auditory selective attention studied by whole-headneuromagnetometer. Cogn Brain Res 7: 99–109. 10.1016/S0926-6410
(98)00014-7.
9. Alho K, Medvedev SV, Pakhomov SV, Roudas MS, Tervaniemi M, et al. (1999)
Selective tuning of the left and right auditory cortices during spatially directed
attention. Cogn Brain Res 7: 335–341. 10.1016/S0926-6410(98)00036-6.
10. Hugdahl K, Bronnick K, Kyllingsbrk S, Law I, Gade A, et al. (1999) Brain
activation during dichotic presentations of consonant-vowel and musicalinstrument stimuli: a 15O-PET study. Neuropsychologia 37: 431–440.
10.1016/S0028-3932(98)00101-8.
11. Jancke L, Mirzazade S, Joni Shah N (1999) Attention modulates activity in the
primary and the secondary auditory cortex: a functional magnetic resonanceimaging study in human subjects. Neurosci Lett 266: 125–128. 10.1016/S0304-
3940(99)00288-8.
12. Zatorre RJ, Mondor TA, Evans AC (1999) Auditory attention to space and
frequency activates similar cerebral systems. NeuroImage 10: 544–554.10.1006/nimg.1999.0491.
13. Alho K, Vorobyev VA, Medvedev SV, Pakhomov SV, Roudas MS, et al. (2003)Hemispheric lateralization of cerebral blood-flow changes during selective
listening to dichotically presented continuous speech. Cogn Brain Res 17:
201–211. 10.1016/S0926-6410(03)00091-0.
14. Ozaki I, Jin CY, Suzuki Y, Baba M, Matsunaga M, et al. (2004) Rapid change of
tonotopic maps in the human auditory cortex during pitch discrimination. ClinNeurophysiol 115: 1592–1604. 10.1016/j.clinph.2004.02.011.
15. Petkov CI, Kang X, Alho K, Bertrand O, Yund EW, et al. (2004) Attentionalmodulation of human auditory cortex. Nat Neurosci 7: 658–663. 10.1038/
nn1256.
16. Rinne T, Pekkola J, Degerman A, Autti T, Jaaskelainen IP, et al. (2005)
Modulation of auditory cortex activation by sound presentation rate andattention. Hum Brain Mapp 26: 94–99. 10.1002/hbm.20123.
17. Spitzer H, Desimone R, Moran J (1988) Increased attention enhances bothbehavioral and neuronal performance. Science 240: 338–340. 10.1126/science.
3353728.
18. Connor CE, Gallant JL, Preddie DC, Van Essen DC (1996) Responses in area
V4 depend on the spatial relationship between stimulus and attention.J Neurophysiol 75: 1306–1308.
19. Fritz J, Shamma S, Elhilali M, Klein D (2003) Rapid task-related plasticity ofspectrotemporal receptive fields in primary auditory cortex. Nat Neurosci 6:
1216–1223. 10.1038/nn1141.
20. Huang L, Dobkins KR (2005) Attentional effects on contrast discrimination in
humans: evidence for both contrast gain and response gain. Vision Research 45:
1201–1212. 10.1016/j.visres.2004.10.024.
21. Ahveninen J, Jaaskelainen IP, Raij T, Bonmassar G, Devore S, et al. (2006)
Task-modulated ‘‘what’’ and ‘‘where’’ pathways in human auditory cortex. ProcNatl Acad Sci USA 103: 14608–14613. 10.1073/pnas.0510480103.
22. Naatanen R (1992) Attention and Brain Function. Hillsdale, NJ: LawrenceErlbaum.
23. Hillyard SA, Vogel EK, Luck SJ (1998) Sensory gain control (amplification) asa mechanism of selective attention: Electrophysiological and neuroimaging
evidence. Phil Trans Biol Sci 393: 1257–1270. 10.1098/rstb.1998.0281.
24. Neelon MF, Williams J, Garell PC (2006) The effects of attentional load on
auditory ERPs recorded from human cortex. Brain Res 1118: 94–105. 10.1016/j.brainres.2006.08.006.
25. Arthur DL, Lewis PS, Medvick PA, Flynn ER (1991) A neuromagnetic study ofselective auditory attention. Electroencephalogr Clin Neurophysiol 78: 348–350.
10.1016/0013-4694(91)90097-N.
26. Fujiki N, Jousmaki V, Hari R (2002) Neuromagnetic Responses to Frequency-
Tagged Sounds: A New Method to Follow Inputs from Each Ear to the HumanAuditory Cortex during Binaural Hearing. J Neurosci 22:RC205: 1–4.
27. Dai H, Scharf B, Buus S (1991) Effective attenuation of signals in noise underfocused attention. J Acoust Soc Am 89: 2837–2842. 10.1121/1.400721.
28. Wright BA, Dai H (1994) Detection of unexpected tones in gated and continuous
maskers. J Acoust Soc Am 95: 939–948. 10.1121/1.410011.
29. Dai H, Buus S (1991) Effect of gating the masker on frequency-selective listening.J Acoust Soc Am 89: 1816–1818. 10.1121/1.401015.
30. Wiegrebe L, Kossl M, Schmidt S (1996) Auditory enhancement at the absolute
threshold of hearing and its relationship to the zwicker tone. Hear Res 100:171–180. 10.1016/0378-5955(96)00111-6.
31. Norena A, Micheyl C, Chery-Croze S (2000) An auditory negative after-image
as a human model of tinnitus. Hear Res 149: 24–32. 10.1016/S0378-5955(00)00158-1.
32. Fritz JB, Elhilali M, David SV, Shamma SA (2007) Does attention play a role in
dynamic receptive field adaptation to changing acoustic salience in A1? HearRes; In press.
33. Patterson RD (1976) Auditory filter shapes derived with noise stimuli. J Acoust
Soc Am 59: 640–654. 10.1121/1.380914.
34. Lehmann D, Skrandies W (1980) Reference-free identification of components ofcheckerboard-evoked multichannel potential fields. Electroencephalogr Clin
Neurophysiol 48: 609–621. 10.1016/0013-4694(80)90419-8.
35. Jaaskelainen IP, Ahveninen J, Bonmassar G, Dale AM, Ilmoniemi RJ, et al.(2004) Human posterior auditory cortex gates novel sounds to consciousness.
Proc Natl Acad Sci USA 101: 6809–6814. 10.1073/pnas.0303760101.
36. Murray SO, Wojciulik E (2004) Attention increases neural selectivity in thehuman lateral occipital complex. Nat Neurosci 7: 70–74. 10.1038/nn1161.
37. Treue S, Martınez-Trujillo JC (1999) Feature-based attention influences motion
processing gain in macaque visual cortex. Nature 399: 575–579. 10.1038/
21176.
38. McAdams CJ, Maunsell JHR (1999) Effects of attention on orientation-tuning
functions of single neurons in macaque cortical area V4. J Neurosci 19: 431–441.
39. Reynolds JH, Pasternak T, Desimone R (2000) Attention increases sensitivity ofV4 neurons. Neuron 26: 703–714. 10.1016/S0896-6273(00)81206-4.
40. Martınez-Trujillo JC, Treue S (2002) Attentional modulation strength in cortical
area MT depends on stimulus contrast. Neuron 35: 365–370. 10.1016/S0896-6273(02)00778-X.
41. Reynolds JH, Desimone R (2003) Interacting roles of attention and visual
salience in V4. Neuron 37: 853–863. 10.1016/S0896-6273(03)00097-7.
42. Fishman YI, Steinschneider M (2006) Spectral Resolution of Monkey PrimaryAuditory Cortex (A1) Revealed With Two-Noise Masking. J Neurophysiol 96:
1105–1115. 10.1152/jn.00124.2006.
43. Sams M, Salmelin R (1994) Evidence of sharp frequency tuning in the humanauditory cortex. Hear Res 75: 67–74. 10.1016/0378-5955(94)90057-4.
44. Naatanen R, Sams M, Alho K, Paavilainen P, Reinikainen K, et al. (1988)
Frequency and location specificify of the human vertex N1 wave. Electro-
encephalogr Clin Neurophysiol 69: 523–531. 10.1016/0013-4694(88)90164-2.
45. Engelien A, Huber W, Silbersweig D, Stern E, Frith CD, et al. (2000) The neural
correlates of ‘deaf-hearing’ in man: Conscious sensory awareness enabled by
attentional modulation. Brain 123: 532–545. 10.1093/brain/123.3.532.
46. Lutkenhoner B, Klein JS (2007) Auditory evoked field at threshold. Hear Res
228: 188–200. 10.1016/j.heares.2007.02.011.
47. Wright BA, Dai H (1994) Detection of unexpected tones with short and longdurations. J Acoust Soc Am 95: 931–938. 10.1121/1.410010.
48. Wright BA, Fitzgerald MB (2004) The time course of attention in a simple
auditory detection task. Percept Psychophys 66: 508–516.
49. Wright BA (2005) Combined representations for frequency and duration indetection templates for expected signals. J Acoust Soc Am 117: 1299–1304.
10.1121/1.1855771.
50. Bakin JS, Weinberger NM (1990) Classical conditioning induces CS-specificreceptive field plasticity in the auditory cortex of the guinea pig. Brain Res 536:
271–286. 10.1016/0006-8993(90)90035-A.
51. Xiao Z, Suga N (2002) Modulation of cochlear hair cells by the auditory cortexin the mustached bat. Nat Neurosci 5: 57–63. 10.1038/nn786.
52. Suga N, Zhang Y, Yan J (1997) Sharpening of Frequency Tuning by Inhibition
in the Thalamic Auditory Nucleus of the Mustached Bat. J Neurophysiol 77:
2098–2114.
53. Liberman MC, Gao J, He DZZ, Wu X, Jia S, et al. (2002) Prestin is required for
electromotility of the outer hair cell and for the cochlear amplifier. Nature 419:
300–304. 10.1038/nature01059.
54. Delano PH, Elgueda D, Hamame CM, Robles L (2007) Selective attention to
visual stimuli reduces cochlear sensitivity in chinchillas. J Neurosci 27:
4146–4153. 10.1523/JNEUROSCI.3702-06.2007.
55. Perrot X, Ryvlin P, Isnard J, Guenot M, Catenoix H, et al. (2006) Evidence for
Corticofugal Modulation of Peripheral Auditory Activity in Humans. Cereb
Cortex 16: 941–948. 10.1093/cercor/bhj035.
56. Freeman E, Sagi D, Driver J (2001) Lateral interactions between targets andflankers in low-level vision depend on attention to the flankers. Nat Neurosci 4:
1032–1036. 10.1038/nn728.
57. Freeman E, Driver J, Sagi D, Zhaoping L (2003) Top-down modulation oflateral interactions in early vision: Does attention affect integration of the whole
or just perception of the parts? Curr Biol 13: 985–989. 10.1016/S0960-9822(03)00333-6.
Selective Attention in Humans
PLoS ONE | www.plosone.org 9 September 2007 | Issue 9 | e909
58. Slotnick SD, Schwarzbach J, Yantis S (2003) Attentional inhibition of visual
processing in human striate and extrastriate cortex. NeuroImage 19: 1602–1611.10.1016/S1053-8119(03)00187-3.
59. Pantev C, Wollbrink A, Roberts LE, Engelien A, Lutkenhoner B (1999) Short-
term plasticity of the human auditory cortex. Brain Res 842: 192–199. 10.1016/S0006-8993(99)01835-1.
60. Levitt H (1971) Transformed up-down methods in psychoacoustics. J Acoust Soc
Am 49: 467–477. 10.1121/1.1912375.
61. Wang X, Lu T, Snider RK, Liang L (2005) Sustained firing in auditory cortex
evoked by preferred stimuli. Nature 435: 341–346. 10.1038/nature03565.
Selective Attention in Humans
PLoS ONE | www.plosone.org 10 September 2007 | Issue 9 | e909