public works - national treasury. chapter 8... · one of the roles of public works is to provide...
TRANSCRIPT

133
8 Public works
Introduction
Public works encompasses engineering, construction and related activities
carried out by government for the benefit of citizens. This includes the
acquisition, leasing, maintenance and disposal of immovable assets held
by the state. Public works is a concurrent function and is a shared
responsibility of national, provincial and local government.
Public works contributes to government’s New Growth Path, National
Development Plan and Outcome 4: Decent employment through inclusive
growth. The construction and maintenance of economic infrastructure and
social infrastructure (schools, community libraries, hospitals and clinics)
create opportunities for labour-intensive and technical or professional
employment. This directly addresses several outputs of Outcome 4,
including faster, sustainable and labour-absorbing growth, increased
competitiveness and accelerated implementation of the Expanded Public
Works Programme (EPWP).
One of the roles of public works is to provide office and institutional
accommodation for national and provincial departments and in this way to
assist them to function effectively. It also provides residential
accommodation for members of parliament and of provincial legislatures.
The size of government’s portfolio of immovable assets makes it a
significant player in the built environment. The national Department of
Public Works (DPW) develops and enforces rules and regulations for the
built environment and the use of fixed assets in the public sector.
Public works is also mandated to support transformation of the
construction industry and to develop small, medium and micro enterprises,
cooperatives and non-profit organisations. In doing so, it helps to empower
individuals and communities from historically disadvantaged backgrounds.
Public works contributes
directly to government’s
economic growth and
employment-creation
priorities
Public works goals include
transforming the
construction industry and
supporting small business

PROVINCIAL BUDGETS AND EXPENDITURE REVIEW: 2010/11 – 2016/17
134
This chapter reviews the current public works landscape, budget and
expenditure trends and service-delivery achievements.
Current landscape
The Constitution defines the roles and responsibilities of national,
provincial and local government in relation to public works.
National
The national DPW provides the broad policy and legislative framework for
the sector. This is generally done on a consultative basis, with key inputs
from provincial and local government. To ensure that policy formulation is
underpinned by consensus, the Minister of Public Works meets regularly
with members of provincial Executive Committees in this portfolio.
The national department coordinates the implementation of the EPWP,
supports transformation within the construction sector through the
Construction Industry Development Board (CIDB) and provides and
manages accommodation for national departments.
National public entities
Four main public entities support the sector directly or through regulatory
processes:
The CIDB provides strategic direction for sustainable growth and
reform of the construction sector and its role in the economy. It
promotes best practices in relation to the performance of public and
private sector clients, contractors and other participants in the
construction sector.
The Council for the Built Environment presides over various
professional councils. It reviews the legislation governing the councils
and has in place a skills development programme.
The Independent Development Trust helps to implement the EPWP and
other infrastructure projects and programmes.
The Property Management Trading Entity, on a cost-recovery basis,
finances the purchase, construction, refurbishment and maintenance of
nationally owned government properties as well as the leasing of
private-sector-owned properties by national government. On a
commission and full-cost recovery basis, the entity also pays for
municipal services on behalf of national departments.
Provincial
The Constitution assigns concurrent powers to provinces for the
construction, maintenance and management of fixed (or immovable)
assets. These functions are fulfilled in support of services delivered by
other provincial departments. Provincial public works departments have
significant levels of responsibility for infrastructure in social and economic
sectors areas such as health, education, community safety and agriculture.
As Table 8.1 shows, provincial public works departments are often
combined with roads and transport departments, and generally have two
broad spending programmes: public works infrastructure and expanded
The national Department of
Public Works operates in
partnership with the
provincial departments
Four main entities
support public works
delivery and
regulation: the
Construction Industry
Development Board,
the Council for the
Built Environment, the
Independent
Development Trust
and the Property
Management Trading
Entity
Provinces have a growing
responsibility to provide
infrastructure in the social
and economic sectors

CHAPTER 8: PUBLIC WORKS
135
public works (known as community-based programmes in some
provinces).
Public Works,
Roads and
Transport
Transport and
Public Works
Roads and Public
Works
Public Works
Mpumalanga Western Cape Eastern Cape Free State
North West Northern Cape
Gauteng
(Infrastructure
Development)
KwaZulu-Natal
Limpopo
Source: National Treasury provincial database
Table 8.1 Public works, roads and transport functions per
province, 2013/14
Public works infrastructure
Through the public works infrastructure programme, provincial public
works departments support the planning, design, construction and
maintenance of provincial buildings, and provide accommodation for
provincial departments.
This aspect of the public works sector was enhanced by the Government
Immovable Asset Management Act (GIAMA) (2007), which became
applicable to provinces in April 2010. The Act provides a uniform
framework for the efficient management of immovable assets, and
coordinates the use of such assets with service-delivery objectives.
Public works reforms
Decentralisation of infrastructure budgets
Until 2002, national departments’ capital or infrastructure requirements were budgeted for directly within the vote of the national DPW. However, in line with the Public Finance Management Act (1999), expenditure associated with a department’s operations or activities must be accounted for directly through that department’s vote. As a result, capital budgets were devolved from the national public works vote to individual departments’ budgets. Departments’ infrastructure requirements are therefore now met by using the national and provincial departments of public works as implementing agents, with funding from the capital budgets of the departments concerned.
Devolution of property rates
In 2008/09, the function and budget for property rates on provincially owned properties was devolved from the national DPW to its provincial counterparts. The Devolution of Property Rates Fund grant was established to provide funding for the function shift and to ensure that by the time funds were included in the equitable share, budget requirements for property rates were relatively stable and predictable for better planning and accountability. Provincial public works departments were then invoiced directly by municipalities for property rates. Total grant allocations were R889 million in 2008/09, R1.5 billion in 2009/10, R2.0 billion in 2010/11, R2.0 billion in 2011/12 and R2.0 billion in 2012/13, a total of R8.2 billion. However, provinces were able to spend only R5.3 billion, or 64 per cent, on the 53 346 properties transferred to them. The grant allocation ended in 2012/13; however, funds will continue to be transferred to provinces as an add-on to the equitable share until 2015/16. From 2016/17, provincial departments are expected to provide for the property rates costs within their budgets.
PROVINCIAL BUDGETS AND EXPENDITURE REVIEW: 2010/11 – 2016/17
136
Public works departments acquire, manage and dispose of immovable
assets subject to relevant provincial land administration laws and GIAMA.
They also provide accommodation for provincial departments through
government owned properties or by leasing from the private sector. As
custodians, public works departments act as caretakers of government
properties and are required to have in place custodian asset management
plans (C-AMPs) for the whole life cycle of all immovable assets in their
custody.
As part of their facilities management function, public works departments
are also responsible for paying municipal property rates for provincially
owned properties including those transferred from the national DPW. The
property rates for the transferred properties were funded through the
Devolution of Property Rates Fund grant, a national conditional grant
which ended in 2012/13 when it was phased into the provincial equitable
share.
Expanded Public Works Programme
The EPWP provides work for unemployed persons, many of whom lack
skills, in urban and rural areas. The programme also aims to empower
communities and contractors with historically disadvantaged backgrounds.
Job creation through the EPWP is based on two approaches: the use of
labour-intensive processes to provide infrastructure and community-based
public works; and the use of government expenditure as a tool to create
work opportunities for the unemployed. The model’s key features include
labour intensity, training, participation by community and non-
governmental organisations, appropriate contract documentation and
linking payment to performance.
The national DPW is responsible for coordinating and monitoring the
programme. It operates in four sectors: infrastructure, environment and
culture, social and non-state. Each sector is encouraged to create labour-
intensive work opportunities as one of its mechanisms for service delivery.
Based on the number of full-time equivalent (FTE) jobs created, provincial
departments can become eligible for the Expanded Public Works
Programme Integrated grant for provinces and the Social Sector Expanded
Public Works Programme Incentive grant which provide provinces with
incentives to create more jobs.
Municipalities
The Constitution gives concurrent functions to municipalities for
municipal public works, with either national or provincial government able
to regulate how they exercise these functions in line with applicable norms
and standards. Most municipalities carry out their own infrastructure
planning and delivery functions in relation to the services they provide,
such as water, sanitation, municipal roads and electricity distribution.
Municipal planning, which includes spatial, economic and social planning,
is supported through five-year integrated development plans.
The Expanded Public Works Programme Integrated grant for
municipalities, managed nationally, encourages local government to
increase labour-intensive employment through infrastructure programmes
Provincial departments of
public works manage
property portfolios and
provide accommodation
Labour-intensive and
community-based projects
are at the core of the EPWP
The EPWP Integrated grant
for municipalities
encourages labour-intensive
employment

CHAPTER 8: PUBLIC WORKS
137
that maximise job creation and skills development. The grant is allocated
by the national Department of Public Works through a formula based on
past performance on jobs created and an extra weighting to give
allocations to poor, rural municipalities.
Budget and expenditure trends
Provincial public works infrastructure
Expenditure per province
Expenditure on the Public Works Infrastructure programme increased from
R6.3 billion in 2010/11 to R8.1 billion in 2013/14, at an annual average
growth rate of 8.6 per cent as shown in Table 8.2 below. This is budgeted
to increase to R10.8 billion in 2016/17, growing by an annual average rate
of 10.2 per cent. Northern Cape’s expenditure declined sharply between
2013/14 and 2014/15 due to the completion of work on the Big Hole
Conference Centre in Kimberley. Budget growth between 2013/14 and
2016/17 in North West, KwaZulu-Natal and Western Cape is due to the
planned acquisition of additional office accommodation for provincial
departments, while Mpumalanga will be spending R373 million in
2014/15 for the maintenance of the Riverside government complex which
houses the provincial administration.
Table 8.2 Provincial public works infrastructure expenditure by province, 2010/11 – 2016/17
2010/11 2011/12 2012/13 2013/14 2014/15 2015/16 2016/17
R millionOutcome Outcome Medium-term estimates
Eastern Cape 866 960 1 041 1 143 1 173 1 237 1 304
Free State 882 974 1 018 1 107 1 131 1 207 1 257
Gauteng 935 919 1 035 1 052 1 256 1 367 1 475
Kw aZulu-Natal 1 114 1 182 1 133 1 270 1 369 1 373 2 046
Limpopo 476 523 510 596 639 667 702
Mpumalanga 416 439 525 593 633 848 894
Northern Cape 164 210 125 138 120 130 136
North West 577 729 616 814 1 245 1 090 1 173
Western Cape 884 1 058 1 257 1 368 1 500 2 028 1 831
Total 6 315 6 994 7 261 8 080 9 066 9 947 10 819
Eastern Cape 9.7% 2.6% 4.5%
Free State 7.9% 2.2% 4.3%
Gauteng 4.0% 19.4% 11.9%
Kw aZulu-Natal 4.5% 7.8% 17.2%
Limpopo 7.8% 7.1% 5.6%
Mpumalanga 12.5% 6.8% 14.7%
Northern Cape -5.7% -12.9% -0.3%
North West 12.1% 53.0% 13.0%
Western Cape 15.7% 9.6% 10.2%
Total 8.6% 12.2% 10.2%
Source: National Treasury provincial database
Percentage growth
(average annual)
2010/11–
2013/14
2013/14–
2014/15
2013/14 –
2016/17
Provincial public works
spending on infrastructure is
expected to reach
R10.8 billion in 2016/17
PROVINCIAL BUDGETS AND EXPENDITURE REVIEW: 2010/11 – 2016/17
138
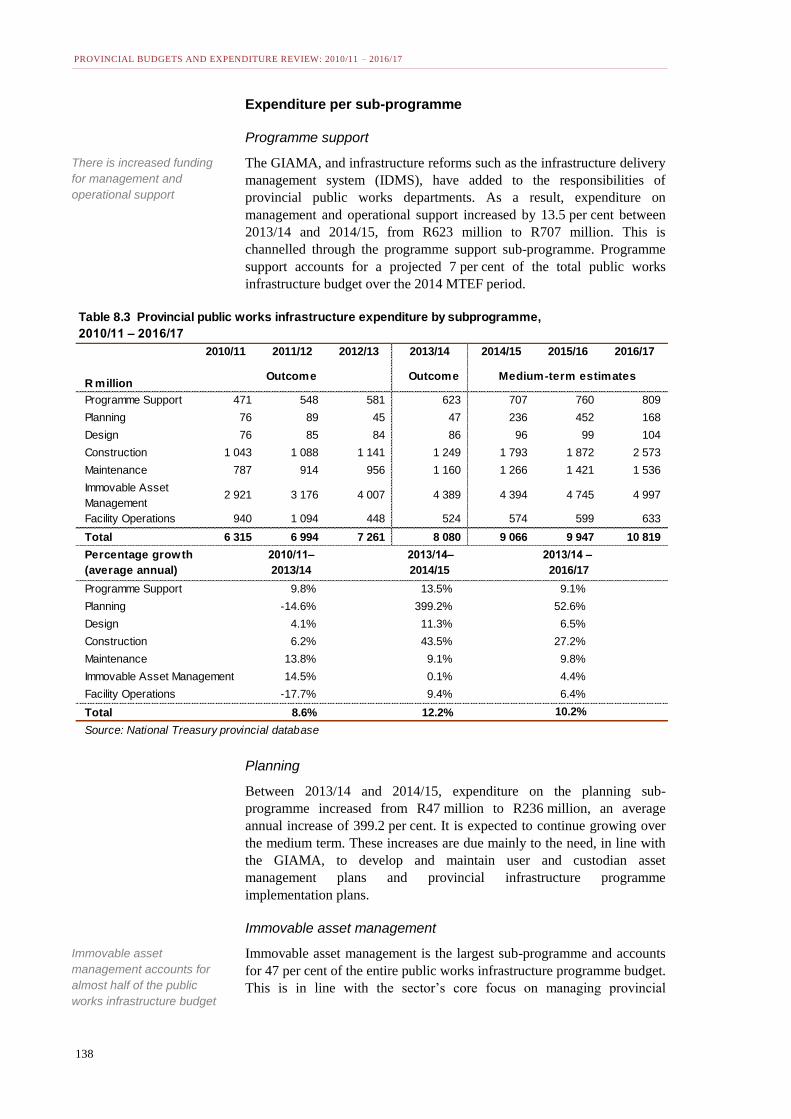
Expenditure per sub-programme
Programme support
The GIAMA, and infrastructure reforms such as the infrastructure delivery
management system (IDMS), have added to the responsibilities of
provincial public works departments. As a result, expenditure on
management and operational support increased by 13.5 per cent between
2013/14 and 2014/15, from R623 million to R707 million. This is
channelled through the programme support sub-programme. Programme
support accounts for a projected 7 per cent of the total public works
infrastructure budget over the 2014 MTEF period.
2010/11 2011/12 2012/13 2013/14 2014/15 2015/16 2016/17
R millionOutcome Outcome Medium-term estimates
Programme Support 471 548 581 623 707 760 809
Planning 76 89 45 47 236 452 168
Design 76 85 84 86 96 99 104
Construction 1 043 1 088 1 141 1 249 1 793 1 872 2 573
Maintenance 787 914 956 1 160 1 266 1 421 1 536
Immovable Asset
Management2 921 3 176 4 007 4 389 4 394 4 745 4 997
Facility Operations 940 1 094 448 524 574 599 633
Total 6 315 6 994 7 261 8 080 9 066 9 947 10 819
Programme Support 9.8% 13.5% 9.1%
Planning -14.6% 399.2% 52.6%
Design 4.1% 11.3% 6.5%
Construction 6.2% 43.5% 27.2%
Maintenance 13.8% 9.1% 9.8%
Immovable Asset Management 14.5% 0.1% 4.4%
Facility Operations -17.7% 9.4% 6.4%
Total 8.6% 12.2% 10.2%
Source: National Treasury provincial database
Table 8.3 Provincial public works infrastructure expenditure by subprogramme,
2010/11 – 2016/17
Percentage growth
(average annual)
2010/11–
2013/14
2013/14–
2014/15
2013/14 –
2016/17
Planning
Between 2013/14 and 2014/15, expenditure on the planning sub-
programme increased from R47 million to R236 million, an average
annual increase of 399.2 per cent. It is expected to continue growing over
the medium term. These increases are due mainly to the need, in line with
the GIAMA, to develop and maintain user and custodian asset
management plans and provincial infrastructure programme
implementation plans.
Immovable asset management
Immovable asset management is the largest sub-programme and accounts
for 47 per cent of the entire public works infrastructure programme budget.
This is in line with the sector’s core focus on managing provincial
There is increased funding
for management and
operational support
Immovable asset
management accounts for
almost half of the public
works infrastructure budget

CHAPTER 8: PUBLIC WORKS
139
portfolios of owned and leased properties and managing provincial
strategic and infrastructure plans and delivery.
Accommodation for provincial departments and institutions is budgeted
for under this sub-programme. Between 2010/11 and 2013/14, expenditure
increased by an annual average of 14.5 per cent and between 2013/14 and
2016/17 is expected to have increased by an annual average of
4.4 per cent, from R4.4 billion to almost R5.0 billion.
Leased property
Demand for accommodation, and particularly for office space, always
exceeds the capacity of government-owned properties. There is thus a need
to lease private property. While some provinces, such as Mpumalanga,
own a government complex housing all provincial departments’
headquarters, provinces such Eastern Cape and Northern Cape operate
within leased properties. Western Cape, North West and KwaZulu-Natal
have earmarked funds over the MTEF to acquire office accommodation
either through construction or from the private sector.
Provinces’ public works departments are also responsible for providing
residential accommodation for members of provincial legislatures (MPLs).
This is done through building houses and creating parliamentary villages
or by leasing from the private sector.
A significant problem is the lack of regulations, processes, systems, and
requisite property management skills to manage leased portfolios within
the public sector. This can result in flawed procurement and supply chain
management processes contributing to government paying rental fees
above the market price.
ProvinceEC FS GT KZN LIM MPU NC NW WC
Education 9 21 13 32 15 10 2 9 13
Health 18 11 19 59 8 5 107 16 6
Social Development 27 20 28 5 8 5 35 16 26
Office of the Premier 7 3 - 4 3 - 2 2 3
Provincial Legislature - - - - 1 1 5 - -
Provincial Treasury 5 - 2 3 5 4 6 - 2
Cooperative Governance and Traditional
Affairs7 4 - 10 4 3 6 - 9
Agriculture, Rural Development and Land
Administration25 23 11 21 23 5 13 18 29
Economic Development, Environment and
Tourism3 3 9 16 14 4 5 2
Public Works, Roads and Transport 10 22 6 6 10 4 3 3 10
Safety, Security and Liaison 2 - 2 - 6 18 6 10
Arts, Culture Sport and Recreation 6 7 1 8 1 1 3 18 -
Human Settlements 5 - 9 5 - 1 1 -
Envronment and Nature Conservation - - - - - - 8 - -
Cape Nature - - - - - - - - 7
Total 124 114 98 171 92 49 213 89 117
Source: National Department of Public Works
Table 8.4 Number of leased properties per department per province, 2012/13
Flawed procurement and
supply chain management
processes contribute to the
high cost of office space
leasing.

PROVINCIAL BUDGETS AND EXPENDITURE REVIEW: 2010/11 – 2016/17
140
As shown in the table, at 213 (or 19 per cent of the total of 1 067 for all
provinces), Northern Cape had the highest number of privately leased
properties in 2012/13, followed by KwaZulu-Natal at 16 per cent and
Eastern Cape at 11 per cent. However, in terms of spending in that year,
Limpopo paid the highest figure of R210 million for 92 properties
followed by Eastern Cape at R192 million. In 2013, Limpopo, in
collaboration with intervention teams from the national DPW and the
National Treasury, appointed a service provider to review its leased office
property portfolio to identify the root cause of excessive costs and to
propose a long term solution. This may include the option of buying
properties. Problems associated with managing leases consistently and
efficiently have led provinces to consider the option of buying or building
their own properties as an economical alternative to leasing.
Expanded Public Works Programme
Expenditure per province
The budget for the programme consists of the conditional grant from the
national DPW and the equitable share allocated to provinces by the
National Treasury. Provinces are encouraged to supplement the grant with
their equitable share in order to maximise job creation opportunities.
2010/11 2011/12 2012/13 2013/14 2014/15 2015/16 2016/17
R millionOutcome Outcome Medium-term estimates
Eastern Cape 403 287 393 454 478 411 425
Free State 48 194 152 198 179 175 177
Gauteng 134 201 175 273 423 287 305
Kw aZulu-Natal 56 41 53 42 44 45 47
Limpopo 412 467 91 254 571 644 613
Mpumalanga 37 60 39 68 54 43 45
Northern Cape 63 50 76 125 75 75 80
North West 75 89 45 176 180 107 113
Western Cape 42 47 45 44 51 58 61
Total 1 270 1 436 1 069 1 633 2 055 1 844 1 865
Eastern Cape 4.1% 5.2% -2.2%
Free State 60.3% -9.8% -3.7%
Gauteng 26.7% 55.2% 3.8%
Kw aZulu-Natal -8.7% 4.6% 3.2%
Limpopo -14.9% 124.9% 34.2%
Mpumalanga 21.8% -20.4% -12.6%
Northern Cape 25.6% -39.8% -13.9%
North West 32.9% 2.6% -13.8%
Western Cape 1.7% 17.0% 12.0%
Total 8.8% 25.8% 4.5%
Source: National Treasury provincial database
Table 8.5 Provincial expenditure on the expanded public works programme by province,
2010/11 – 2016/17
Percentage growth
(average annual)
2010/11–
2013/14
2013/14–
2014/15
2013/14 –
2015/16
As the table above shows, provincial public works departments spent
R1.6 billion on the EPWP in 2013/14 compared with R1.3 billion in
Spending on the EPWP is
growing strongly in line with
job-creation targets

CHAPTER 8: PUBLIC WORKS
141
2010/11, an average annual growth rate of 8.8 per cent. Spending is
expected to decrease from R2.1 billion in 2014/15 to R1.9 billion in
2016/17; the EPWP funds will be kept as unallocated at the National
Treasury and distributed to provinces based on the number of FTE jobs
created and the duration of work opportunities in the preceding year.
Expenditure per sub-programme
Community Development
The aim of the community development sub-programme is to develop and
empower impoverished communities. Departments are encouraged to
create jobs and to support these communities through the incentive-based
EPWP grant allocation. As reflected in Table 8.6 below, expenditure on
the sub-programme increased by 100.5 per cent between 2010/11 and
2013/14. It declines by 8.2 per cent over the MTEF period.
2010/11 2011/12 2012/13 2013/14 2014/15 2015/16 2016/17
R millionOutcome Outcome Medium-term estimates
Programme Support
Community Based/EPWP
149 104 151 144 155 220 234
Community Development 118 425 394 947 1 073 709 733
Innovation and Empow erment 830 594 233 407 697 779 751
Co-ordination and Compliance
Monitoring173 313 291 135 131 136 147
Total 1 270 1 436 1 069 1 633 2 055 1 844 1 865
Programme Support
Community Based/EPWP
-1.2% 7.8% 17.7%
Community Development 100.5% 13.3% -8.2%
Innovation and Empow erment -21.1% 71.1% 22.6%
Co-ordination and Compliance
Monitoring-7.9% -3.4% 2.8%
Total 8.8% 25.8% 4.5%
Source: National Treasury provincial database
Table 8.6 Provincial expenditure on the expanded public works programme by sub-programme,
2010/11 – 2016/17
Percentage growth
(average annual)
2010/11–
2013/14
2013/14–
2014/15
2013/14 –
2016/17
Innovation and empowerment
The innovation and empowerment sub-programme supports contractor
development, training and learnership programmes. Expenditure under this
programme declined from R830 million in 2010/11 to R407 million in
2013/14. At 21.1 per cent, this was the greatest annual average rate of
decline of all the sub-programmes. The decline in expenditure is mainly
due to unavailability of funds which led to low learnership intake.
Service-delivery achievements
Provincial public works infrastructure
One of the key intended outcomes of the public works infrastructure
programme is to ensure that construction and maintenance projects of
social sector facilities such as schools, hospitals and clinics are completed
on time and within budget. Table 8.7 gives information about the
Expenditure on the
community development
sub-programme increased
sharply between 2010/11
and 2013/14

PROVINCIAL BUDGETS AND EXPENDITURE REVIEW: 2010/11 – 2016/17
142
provinces’ performance in 2013/14. It shows that KwaZulu-Natal
completed 271 out of 346 construction projects on time and within budget.
ProvinceTarget Actual Target Actual Target Actual Target Actual
Eastern Cape 65 24 65 39 60 47 60 48
Free State 5 15 5 15 4 4 4 4
Gauteng 96 111 96 115 3 3 5 5
KwaZulu-Natal 346 276 346 276 43 33 43 33
Limpopo 17 15 17 15 0 0 0 0
Mpumalanga 72 71 72 90 0 0 0 0
Northern Cape 11 9 41 20 18 58 60 107
North West 7 2 6 2 74 10 74 13
Western Cape 123 79 123 16 560 262 560 283
Total 742 602 771 588 762 417 806 493
Source: National treasury provincial database
Table 8.7 Public works Infrastructure Projects, 2013/14Construction
Number of projects
completed within budget
Number of projects
completed within the
contract period
Maintenance
Number of projects
completed within the
contract period
Number of projects
completed within budget
While most provinces utilise other institutions as implementing agents for
their infrastructure projects, in the Western Cape the provincial public
works department is the sole implementing agent for all construction and
infrastructure-maintenance related projects.
As indicated in Table 8.7 above, in general provincial public works
departments completed on time and within budget a higher percentage of
their construction projects than of their maintenance projects. A shortage
of engineering and related professionals, artisan, electrical and electronics
engineering technician skills is the main reason for under-performance in
respect of infrastructure projects.
EPWP
As described earlier in this chapter, the national DPW coordinates and
monitors all EPWP projects across government and NPOs. This section
looks at the jobs created per province within various sectors. The sectors
are required to identify the number of EPWP related jobs for every labour
intensive project that they implement.

CHAPTER 8: PUBLIC WORKS
143
Figure 8.1 EPWP work opportunities per sector, 2013/14
Source: Public Works EPWP reporting system
39%
20%
19%
17%
5%
Infrastructure
Environmental and Culture
Social Sector
Community Works(Department of CooperativeGovernance)
Non-State
Figure 8.1 above shows that in 2013/14 the largest percentage
(39 per cent) of EPWP work opportunities was in the infrastructure sector;
the second largest, at 20 per cent, in the environmental and culture sector;
and the third largest, at 19 per cent, in the social sector. Among the best-
performing programmes in respect of work opportunities are:
Facilities and infrastructure development: these programmes equip
young people with technical infrastructure skills through their
involvement with road maintenance, upgrading and construction; and
the construction of health, education and sporting facilities and
electrification projects.
ECD centres and school feeding schemes: these programmes,
implemented by provincial education departments, benefit day care and
Grade R practitioners in community centres and food handlers at
schools.
HIV counselling and community home based care: these social sector
programmes create full time work opportunities, mostly for women.
In 2013/14, across a range of sectors there were 1 017 265 provincial
EPWP work opportunities, equating to 278 725 full time equivalent (FTE)
jobs. Figure 8.2 below shows the relationship between work opportunities
and full-time equivalent jobs, and the distribution of these across the
provinces. KwaZulu-Natal created the most FTE jobs (68250, or
24.5 per cent of the total), followed by Eastern Cape (51581, or
18.5 per cent of the total). The largest numbers of jobs in KwaZulu-Natal
were created through the Zibambele and Vukuzakhe road infrastructure
programmes.
The largest percentage of
EPWP work opportunities
are in the infrastructure,
environment and culture
and social sectors
In 2013/14, there were over
1 million work opportunities
in various sectors within the
provinces

PROVINCIAL BUDGETS AND EXPENDITURE REVIEW: 2010/11 – 2016/17
144
Source: Public Works EPWP reporting system
Figure 8.2 Work opportunities compared with full-time equivalent jobs per province, 2013/14
0
25000
50000
75000
100000
125000
150000
175000
200000
225000
250000
Work opportunities
Full time equivalents
Medium-term outlook
Over the medium term, a priority is to promote job creation by increasing
labour-intensive public works projects. Government will continue to use
the Expanded Public Works Programme Integrated grant, which is paid to
provincial departments that meet or exceed their full-time equivalent job
targets. To access the grant, departments need to improve their reporting
and their rate of job creation. They must also expand the number of built
environment learnerships and form relationships with relevant
organisations such as higher education institutions.
Another major objective is to continue with the implementation of the
turnaround strategy introduced by the national DPW in 2012 to address
inefficiencies within the sector. Provinces’ asset management practices
tend to be poor and this has resulted in audit findings in many of them.
Public works departments must improve their asset management, including
their ability to compile and implement C-AMPs, which are the basis for
condition assessments of existing facilities and for planning and budgeting
properly for maintenance.
Although public works departments are responsible for compiling
infrastructure programme implementation plans and for providing
infrastructure for provincial line departments, they often do not have
adequate capacity to carry out this function. They therefore need
increasingly to work with provincial treasuries to increase their relevant
capacities and skills; and need to recruit the necessary skilled personnel
including engineers, architects, quantity surveyors and project managers.
The DPW’s turnaround
strategy aims to improve
service and reduce the cost
of delivery.

CHAPTER 8: PUBLIC WORKS
145
Conclusion
As custodians of provinces’ immovable assets and with the responsibility
for implementing a wide range of infrastructure projects, provincial DPWs
play a key role in infrastructure planning. Approaches to reform and
improvement include the national turnaround strategy and implementation
of the IDMS. The increased skills in budgeting, planning and
implementation which should result from this will lead to greater ability to
make decisions about many critical issues, including whether it is more
cost-effective to lease or buy public property such as office space or
housing for provincial officials.

PROVINCIAL BUDGETS AND EXPENDITURE REVIEW: 2010/11 – 2016/17
146