public interest energy research program (pier)
TRANSCRIPT

0
Public Interest Energy Research Program (PIER)
Presented to ACS Committee on Environmental Improvement
September 9, 2006
Martha Krebs, Ph.D.Deputy Director
Energy R & D Division
California Energy Commission

1
California produces16% of its natural gas42% of its petroleum77% of its electricity
California ranks 3rd in crude oil production, 11th in natural gas production, 3rd in net hydroelectric power, 6th in nuclear power.
California ranks 2nd in total energy consumed, 1st in energy use in residential, commercial and transportation sectors and 3rd in the industrial sector.
California is 2nd in the use of natural gas, petroleum and electricity after Texas.
California’s Energy Picture

2
California - Electricity Overview
• Population: 34 million,
1.1% per year growth
• Multiple Utility Service Territories
• 2004 Electricity Use:
262,000 GWH
• 2004 Peak Demand:
54,500 MW
• Annual growth:
Consumption - 1.4%
Peak - 1.65%

3
California Electricity Production 2004
Large Hydroelectric
15%
Natural Gas41%
Nuclear13%
Renewable11%
Coal20%
Relevant Policy Goals• The Loading Order – Efficiency,
Renewables, Clean Fossil
• Renewable Portfolio Standard
• GHG Reduction
• Critical Peak Management and Demand Response
4
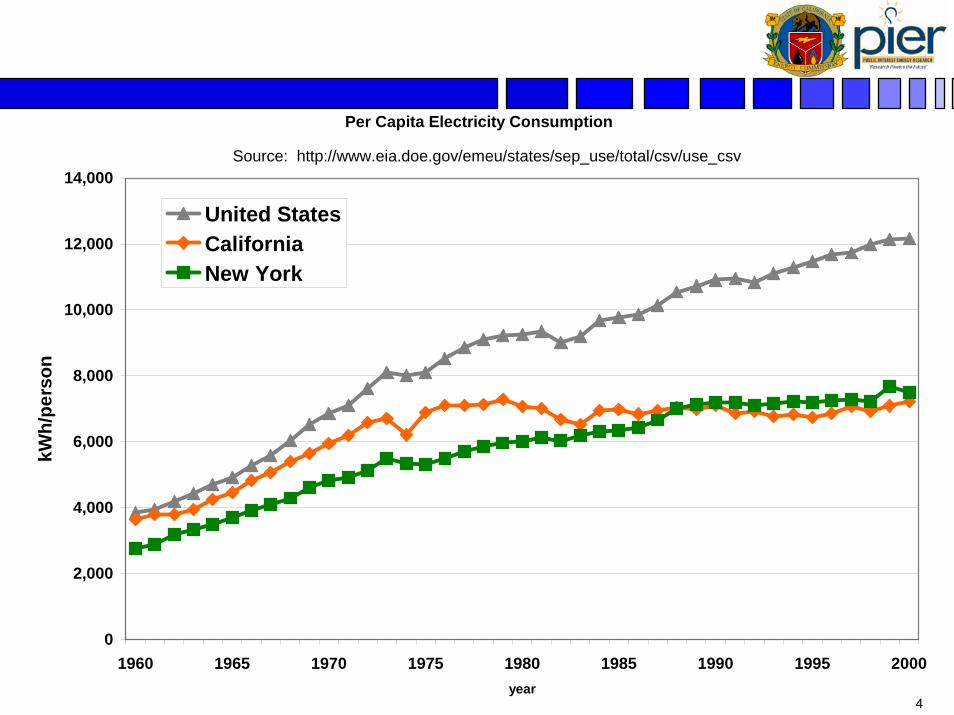
Per Capita Electricity Consumption
0
2,000
4,000
6,000
8,000
10,000
12,000
14,000
1960 1965 1970 1975 1980 1985 1990 1995 2000year
kWh/
pers
on
United StatesCaliforniaNew York
Source: http://www.eia.doe.gov/emeu/states/sep_use/total/csv/use_csv

5
Projected California Gasoline and Diesel Demand
• Technology advances in petroleum use efficiencies have been driven by air emission standards
• California’s 28 million vehicles use about 16 billion gallons of gasoline and 3 billion gallons of diesel annually.
• Ethanol from biomass contributes close to 6% of California’s gasoline supply by volume. Total annual usage is about 1 billion gallons.[– ~25 million gallons, about 1%, are
produced in state from corn, cheese whey and reject sugars; the bulk of ethanol is imported from out of state.
– 100 million gallons of capacity under construction or in development to produce ethanol from imported corn.
• Biodiesel derived mostly from soybeans, along with other oil seeds, waste vegetable oil, cooking oil, animal fats and trap grease,– ~4 million gallons per year are being
used or 0.1% of California’s diesel usage
• Recent policy direction is AB1493 (PavleyBill) which would require 30% reduction GHG emissions in new light duty vehicles by 2016

6
• 2/3 of Precipitation in North
• 2/3 Demand in the South
• Water Demand: 43 maf
• 9 maf Urban
• 34 maf Agricultural
• Energy Use:
48,000 GWh – 20% of electricity
4,300 MTh – 30% of natural gas
• Population by 2030:
48 million
• 2030 Water Demand:
43-50 maf
California- Water Overview

7
Regional Differences
Source: California Energy Commission, 2005 Integrated Energy Policy Report
Northern SouthernCalifornia CaliforniakWh/MG kWh/MG
Supply & Conveyance 150 8,900Water Treatment 100 100Distribution 1,200 1,200Wastewater Treatment 2,500 2,500Regional Total 3,950 12,700

8
Water-Energy Relationship Synergies
End-User Water and Energy ConservationSaving water can save energySaving energy can save water
Improve Price SignalsTime of use water rates and metersTime of use electric rates and meters
Water and Wastewater Utility Operational EfficiencyIncreasing water and wastewater system efficiency reduces energy in the water use cycle
Water StorageIncreased water storage and more flexible water storage shifts peak energy requirementsPumped storage increases peak electric generation and improves electric system efficiency
Renewable Generation by Water and Wastewater UtilitiesIncrease generation from in-conduit hydro and biogas. Add generation from solar and wind.Assist in meeting California’s renewable generation goals

9
California Greenhouse Gas Emissions
Industrial Facilities (Over 40% Petroleum Refineries), 23%
In-State Electricity
Generation, 10%
Out-of-State Generation, 10%
Other, 16%Transportation,
41%
The total GHG emissions for 2004 are ~500 million tons of CO2 equivalent

10
California Climate Change Emissions and TargetsAfter Implementing Emission Reduction Strategies
By 2020, California will need to remove ~180 million tons of CO2equivalent per year and it will have to continue to grow to meet 2050 goals.
11
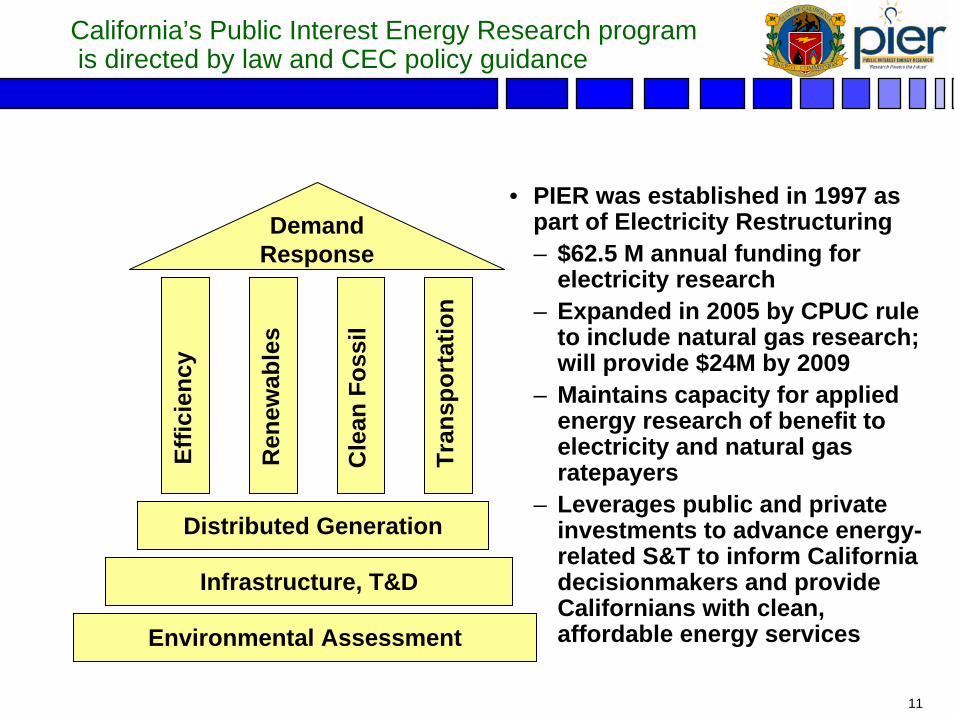
California’s Public Interest Energy Research programis directed by law and CEC policy guidance
Effic
ienc
y
Ren
ewab
les
Cle
an F
ossi
l
DemandResponse
Distributed Generation
Infrastructure, T&D
Environmental Assessment
Tran
spor
tatio
n
• PIER was established in 1997 as part of Electricity Restructuring– $62.5 M annual funding for
electricity research – Expanded in 2005 by CPUC rule
to include natural gas research; will provide $24M by 2009
– Maintains capacity for applied energy research of benefit to electricity and natural gas ratepayers
– Leverages public and private investments to advance energy-related S&T to inform California decisionmakers and provide Californians with clean, affordable energy services

12
Improving Buildings with Green Building Studio (GBS)
GBS gives architects the tools then need to include energy efficiency early in design
2500 users - 840 projects done since service launch
Links directly to all computer design programsImproves information sharing Allows for comparison of design alternatives

13
Wine Industry Adopts New Technology Saves 88 % Electricity in a Critical Wine Making Process
• Tartrate removal, using refrigeration, requires 80 kWh/1000 gallons. New technology does it in 10 kWh. California has over 1100 wineries producing 500 million gallons a year.
• PIER funded technology modification for California needs and demonstrations. Technology increasingly embraced by wine makers in California.
• Federal agency published acceptance of technology in the Federal Register. PG&E accepts technology as eligible for rebate.
• 2005 Flex-Your- Power Award Winner .
PIER Developed & Demonstrated Electro-dialysis Eliminates Refrigeration Need
New Rule

14
Gas Driven Heat PumpSaves Electricity & Natural Gas.
• Technology uses low-quality heat or waste heat to produce cooling without compression and provides heat for on-site processes.
• First 10 ton demonstration system installed in April 2004 at a chicken processing plant in Modesto.
• Recent Independent Test Results: From Nov 1 05 through Jan 31 06 (Approx 12 weeks) the system averaged 28% savings per week in natural gas and 69% in electricity use.
• In Dec 05 Foster Farms installed a 100 ton system. Other possible users: fruit, vegetable & meat processors, dairies and breweries. Utilities interested in technology to meet energy saving goals.
15
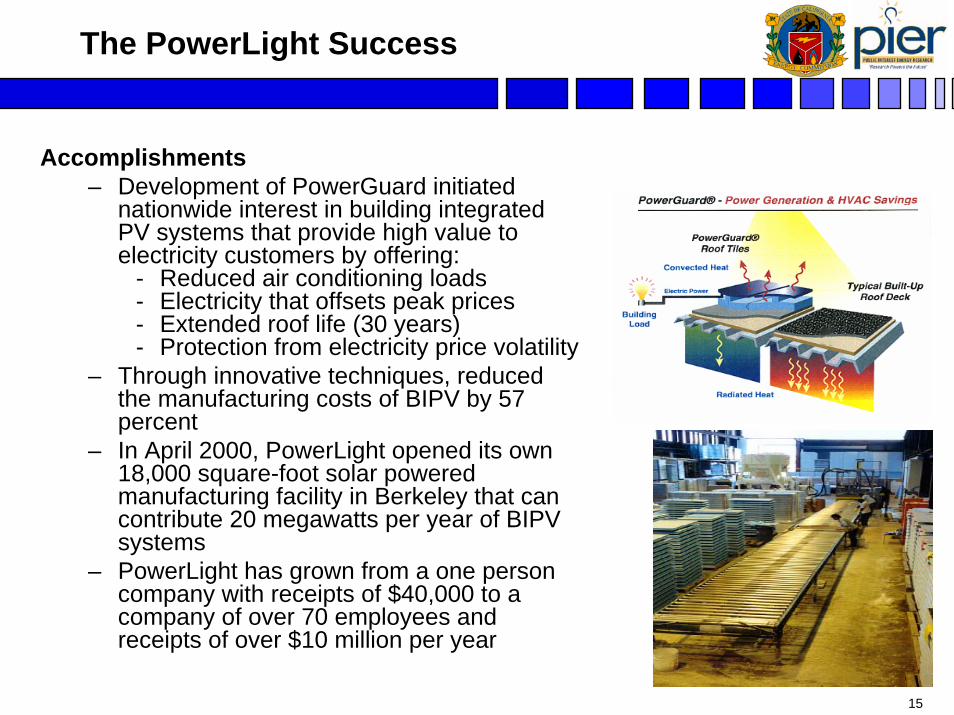
The PowerLight Success
Accomplishments– Development of PowerGuard initiated
nationwide interest in building integrated PV systems that provide high value to electricity customers by offering:
- Reduced air conditioning loads- Electricity that offsets peak prices- Extended roof life (30 years)- Protection from electricity price volatility
– Through innovative techniques, reduced the manufacturing costs of BIPV by 57 percent
– In April 2000, PowerLight opened its own 18,000 square-foot solar powered manufacturing facility in Berkeley that can contribute 20 megawatts per year of BIPV systems
– PowerLight has grown from a one person company with receipts of $40,000 to a company of over 70 employees and receipts of over $10 million per year

16
The Yolo County’s Bioreactor LandfillSuccess
Accomplishments– Is opening the way for landfill gas
electricity systems to be more widely used in California
- Accelerates gas production from over 30 years to less than 10 years making landfill electricity competitive. Methane gas production is 4 to 7-fold than dry landfills
- Reduces volume of landfill which can extend landfill life by 20 percent
- Significantly reduces the chance for groundwater pollution from leachate release
– Has become the leading bioreactor project within EPA’s Excel Program and will strongly influence landfill regulations across the country
Enhanced bioreactor cell

17
Integrated Combined Cooling, Heating and Power (CCHP) Module
• Integrated HVAC system for commercial and light industrial applications
• Generates electricity and manages engine heat to meet thermal loads and optimize absorption chiller performance
• 60% system efficiency
• Emissions below 2007 CARB limits
• Standardized factory assembly reduces cost
• Powered by 260 kW natural gas internal combustion engine (ICE)
• Field testing at Normandie Casino in Los Angeles

18
Zero-Emission Gas-Fired 5 MW Power Plant
• Grid-connected demonstration power plant near Bakersfield
• Breakthrough combustor technology based on rocket engine design
• No criteria pollutants – no NOx, SOx, CO, VOCs
• CO2 economically separated out for sequestration or enhanced oil recovery (EOR)
• A “climate neutral” base load generation technology – no greenhouse gas emissions

19
Aggregated Demand Saving, Sept 8th
0
1000
2000
3000
4000
5000
6000
7000
0:00
1:00
2:00
3:00
4:00
5:00
6:00
7:00
8:00
9:00
10:0
0
11:0
0
12:0
0
13:0
0
14:0
0
15:0
0
16:0
0
17:0
0
18:0
0
19:0
0
20:0
0
21:0
0
22:0
0
23:0
0
Dem
and
[kW
]
Albertsons B of A (B) OFB Roche USCB Total Savings Baseline
• Near-term research benefits attainable• Critical step to attaining EAP goal of 5%
peak load reduction by 2007• Research Results
– 23 sites participated in load shedding
– Established capabilities of current controls and communications
– Demonstrated large sheds can take place without complaints
– Demonstrated range of strategies to produce sheds and capabilities needed
– Average reduction 8% - Ranged up to 42% reduction
• All 3 IOUs engaged in early deployment of this technology
Demand Response Research Providing Successes
Implementation of automated demand response in large facilities showing great promise. Integrates building to utility load reduction control.
20
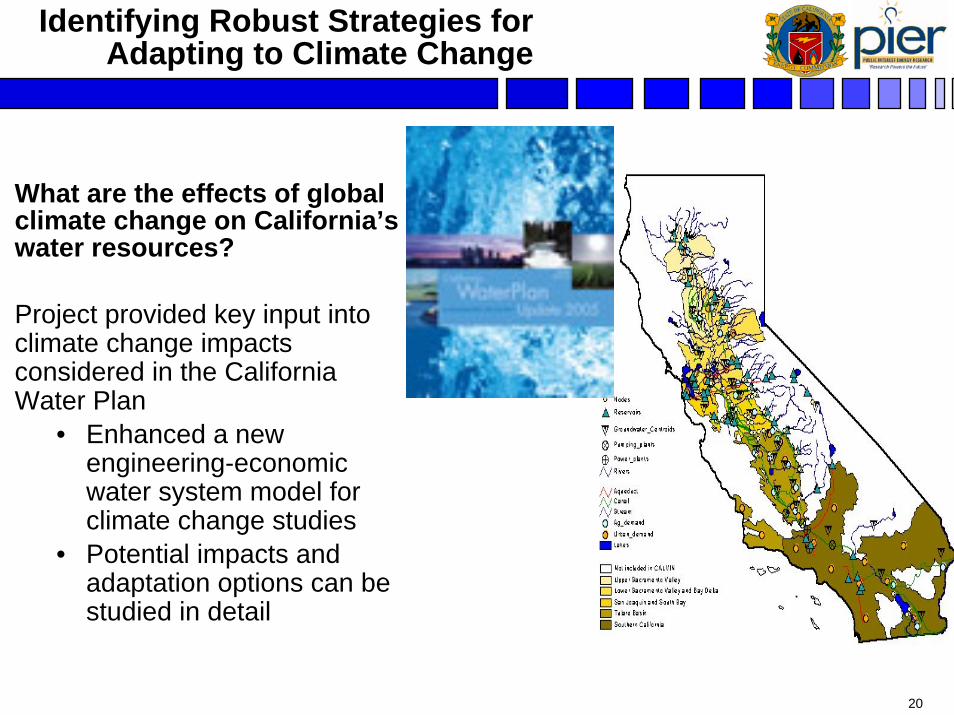
Identifying Robust Strategies forAdapting to Climate Change
What are the effects of global climate change on California’s water resources?
Project provided key input into climate change impacts considered in the California Water Plan
• Enhanced a new engineering-economic water system model for climate change studies
• Potential impacts and adaptation options can be studied in detail
