public disclosure authorized - · gmi guaranteed minimum income ... pom project operational manual...
TRANSCRIPT

Document of The World Bank
FOR OFFICIAL USE ONLY
Report No: 58280-RO
PROJECT APPRAISAL DOCUMENT
ON A
PROPOSED LOAN
IN THE AMOUNT OF EURO 500 MILLION
(US$710.4 MILLION EQUIVALENT)
TO
ROMANIA
FOR A
SOCIAL ASSISTANCE SYSTEM MODERNIZATION PROJECT
April 28, 2011 This document has a restricted distribution and may be used by recipients only in the performance of their official duties. Its contents may not otherwise be disclosed without World Bank authorization.
Pub
lic D
iscl
osur
e A
utho
rized
Pub
lic D
iscl
osur
e A
utho
rized
Pub
lic D
iscl
osur
e A
utho
rized
Pub
lic D
iscl
osur
e A
utho
rized
Pub
lic D
iscl
osur
e A
utho
rized
Pub
lic D
iscl
osur
e A
utho
rized
Pub
lic D
iscl
osur
e A
utho
rized
Pub
lic D
iscl
osur
e A
utho
rized

CURRENCY EQUIVALENTS
(Exchange Rate Effective March 31, 2011)
Currency Unit = New Romanian Lei (RON) Euro 1US$ 1US$ 1
= = =
RON 4.1157 RON 2.8966 Euro 0.7038
FISCAL YEAR
January 1 – December 31
ABBREVIATIONS AND ACRONYMS
AAA Analytical and Advisory Services ADePT Standardized Statistical Software for Social Assistance Analysis ANAF National Agency for Fiscal Administration CAS Country Assistance Strategy CASB County Agencies for Social Benefits CBDA Complementary Budget for Disabled Adult CFA Complementary Family Allowance CFAA Country Financial Accountability Assessment CoA Court of Accounts CPS Country Partnership Strategy CRB Child Raising Benefit DLI Disbursement Linked Indicator DP Disbursement Projection DPL Development Policy Loan DPO Development Policy Operation EC European Commission ECA Europe and Central Asia EEP Eligible Expenditure Program EF&C Error, Fraud, and Corruption EU European Union FA Family Allowance FM Financial Management FMS Financial Management System GDP Gross Domestic Product GET Global Expert Team GMI Guaranteed Minimum Income GOR Government of Romania HB Heating Benefits HBS Household Budget Survey ICR Indemnity for Child Raising IDA Indemnity for Disabled Adult IFI International Financial Institution
IFR Interim Financial Report IMF International Monetary Fund IT Information Technology LIH Low-income Households M&E Monitoring and Evaluation MoLFSP Ministry of Labor, Family and Social Protection MoPF Ministry of Public Finance MSII Minimum Social Insertion Income Program NBR National Bank of Romania NASB National Agency for Social Benefits NEA National Employment Agency NEETD Not employment, education, training of disabled NIS National Institute for Statistics OBI Open Budget Index ORAF Operational Risk Assessment Framework PAD Project Appraisal Document PCN Project Concept Note PDI Project Development Indicator PDO Project Development Objective PFM Public Financial Management PFS Program Financial Statements PMU Project Management Unit POM Project Operational Manual RBF Results Based Financing RON New Romanian Lei SAFIR Integrated Information System for Administration of Social Benefits SASM Social Assistance System Modernization SCA State Child Allowance SDP Strategic Development Plan SI Social Inspection SIL Specific Investment Loan SIP Social Inclusion Project SPA Single Parent Allowance TA Technical Assistance TOR Terms of Reference WB World Bank
Regional Vice President: Philippe Le Houérou Country Director: Peter Harrold Sector Manager: Kathy Lindert Task Team Leaders: Emil Tesliuc, Richard Florescu, Penny Williams


Table of Contents
I. Strategic Context ........................................................................................................................... 1
A. Country Context .................................................................................................................... 1
B. Sectoral and Institutional Context ......................................................................................... 4
C. Higher Level Objectives to which the Project Contributes ................................................. 11
II. Project Development Objectives ................................................................................................. 13
A. Project Development Objectives ......................................................................................... 13
1. Project Beneficiaries ........................................................................................................... 13
2. PDO Level Results Indicators ............................................................................................. 14
III. Project Description ...................................................................................................................... 14
A. Project Financing ................................................................................................................. 22
1. Lending Instrument ............................................................................................................. 22
2. Project Cost and Financing ................................................................................................. 25
B. Alternatives Considered and Lessons Learned and Reflected in the Project Design .......... 25
IV. Implementation ............................................................................................................................ 28
A. Institutional and Implementation Arrangements ................................................................. 28
B. Results Monitoring and Evaluation ..................................................................................... 28
C. Sustainability ....................................................................................................................... 29
V. Key Risks and Mitigation Measures ............................................................................................ 31
VI. Appraisal Summary ..................................................................................................................... 32
A. Economic and Financial Analysis ....................................................................................... 32
B. Technical ............................................................................................................................. 35
C. Financial Management ........................................................................................................ 36
D. Procurement ........................................................................................................................ 37
E. Social (including safeguards) .............................................................................................. 37
F. Environment (including safeguards) ................................................................................... 37
Annex 1: Results Framework and Monitoring .................................................................................... 38
Annex 2: Detailed Project Description ............................................................................................... 43
Annex 3: Implementation Arrangements ............................................................................................ 66
Annex 4: Operational Risk Assessment Framework (ORAF) ............................................................ 82
Annex 5: Implementation Support Plan .............................................................................................. 85
Annex 6: Team Composition .............................................................................................................. 87
Annex 7: Sectoral Context: Description of Romania’s Social Assistance System ............................. 88
Annex 8: Economic Analysis of the Estimated Impacts of the Social Assistance Reform program 114
Annex 9: Political Economy and Strategic Communication for Sustainable Reforms ..................... 135


PAD DATA SHEET
Romania Social Assistance System Modernization Project
PROJECT APPRAISAL DOCUMENT
Europe and Central Asia
Human Development Department Date: April 28, 2011 Country Director: Peter Harrold Sector Manager: Kathy Lindert Team Leaders: Emil Tesliuc, Richard Florescu, Penny Williams Project ID: P121673 Lending Instrument: Specific Investment Loan
Sector: Human Development Theme: Social Assistance EA Category: C
Project Financing Data: Proposed terms: [ X] Loan [ ] Credit [ ] Grant [ ] Guarantee [ ] Other: Source Total Amount (US$710.4 M) Total Project Cost:
Cofinancing: Borrower: Total Bank Financing:
IBRD: IDA:
Euro 500m (US$710.4m) 0 0 Euro 500m (US$710.4m) Euro 500m (US$710.4m) 0
Borrower: Government of Romania Implementing Agency: Ministry of Labor, Family and Social Protection (MoLFSP)
Contact Person: Ms. Lacramioara Corches, General Director, General Directorate for Social Assistance Telephone No.: +40 21 31 57143 Fax No.: +40 21 31 00 599 Email: [email protected]
Estimated Disbursements (Bank FY/US$ m) FY FY12 FY13 FY14 Annual US$319.7; Euro 225m US$106.6; Euro 75m US$284.1; Euro 200m Cumulative US$319.7; Euro 225m US$426.3; Euro 300m US$710.4; Euro 500m
Project Implementation Period: October 2011 – September 2014 Expected effectiveness date: October 2011 Expected closing date: September 30, 2014

Does the project depart from the CAS in content or other significant respects?
○ Yes X No
Although not envisaged in the CPS, the Project is fully consistent with the objectives and pillars of the CPS.
Does the project require any exceptions from Bank policies? Have these been approved/endorsed (as appropriate by Bank management) Is approval for any policy exception sought from the Board?
○ Yes X No ○ Yes ○ No ○ Yes X No
If yes, please explain:
Does the project meet the Regional criteria for readiness for implementation?
X Yes ○ No
If no, please explain:
Project Development Objective: Improve the overall performance of Romania’s social assistance system by strengthening performance management, improving equity, improving administrative efficiency and reducing error and fraud.
The proposed project aims at improving the performance of Romania's social assistance system, with a focus on the Government’s main programs for low-income households, the disabled, and families with children. It is organized around four key results areas, each contributing to the PDO:
1. Strengthened Performance Management: Romania’s social assistance reform is implemented following a results-oriented strategy and action plan and is supported by a performance management M&E system;
2. Improved Equity: The share of social assistance funds going to the first poorest quintile of the population increases to 45 percent from 37.7 percent at baseline (in 2009);
3. Improved Administrative Efficiency: Reduction in administrative and client costs for means-tested programs by 15 percent from baseline value; and
4. Reduced Error and Fraud: Programs for low-income households, disability benefits and family policy programs have strengthened information systems, and oversight and control procedures including detection of error and fraud using risk-based investigation, data matching, data quality audits, and consolidated beneficiary registries.
Safeguard policies triggered? Environmental Assessment (OP/BP 4.01)
○ Yes X No

Natural Habitats (OP/BP 4.04) Forests (OP/BP 4.36) Pest Management (OP 4.09) Physical Cultural Resources (OP/BP 4.11) Indigenous Peoples (OP/BP 4.10) Involuntary Resettlement (OP/BP 4.12) Safety of Dams (OP/BP 4.37) Projects on International Waters (OP/BP 7.50) Projects in Disputed Areas (OP/BP 7.60)
○ Yes X No ○ Yes X No ○ Yes X No ○ Yes X No ○ Yes X No ○ Yes X No ○ Yes X No ○ Yes X No ○ Yes X No
Conditions and Legal Covenants: Loan Agreement Reference Description of
Condition/Covenant Date Due
Article IV, Section 4.01 Article IV, Section 4.02
The Additional Events of Suspension consist of the following: (a) The Borrower’s Social
Assistance Reform Strategy and Action Plan have been amended, suspended, abrogated, repealed or waived, without the Bank’s prior consent, so as to affect materially and adversely the ability of the Borrower to carry out the Project or to perform any of its obligations under this Agreement.
(b) The Borrower’s Legislation
regulating Social Assistance Programs has been amended, suspended, abrogated, repealed or waived so as to affect materially and adversely the ability of the Borrower to effectively implement the Social Assistance Reform Strategy to carry out the Project.
The Additional Events of Acceleration consist of the following, namely that any event specified in Section 4.01 of this Agreement occurs and is continuing for a period of 60 days after notice of the event has been given by the Bank to the

Borrower.Article V, Section 5.01 The Borrower, through MoLFSP,
has adopted the Project Operational Manual (POM) satisfactory to the Bank.
Effectiveness Condition
Schedule 2, Section I.A.1 Schedule 2, Section I.A.2 Schedule 2, Section I.A.3
The Borrower, through MoLFSP, shall: (a) take all necessary measures to effectively implement the Social Reform Assistance Strategy and Action Plan; and (b) carry out the Project in accordance with the provisions of the POM and shall not amend, waive or abrogate any provisions of the POM without the Bank’s prior approval. The Borrower, through the General Directorate for Social Assistance (GDSA) within the MoLFSP, shall ensure coordination of Project’s implementation and shall be responsible for: (a) monitoring the achievement of the DLIs; (b) compiling and delivering the documentary evidence of achievement of respective DLIs to the Bank; and (c) coordinating with the MoPF in preparation and submitting to the Bank of withdrawal applications under the Project. The Borrower, through MoPF, MoLFSP and NASB, shall ensure the Project’s financial management implementation. The MoPF, MoLFSP and NASB will continue to execute the budget payments related to the EEP through the existing channels and procedures, while the county branches of NASB, i.e. the CASB, shall regularly report on the receipt of payments and utilization of budget funds. In this respect, the MoLFSP and NASB shall ensure that the EEP reporting is
Recurrent Recurrent Recurrent

Schedule 2, Section I.A.4 Schedule 2, Section I.A.5
regular, timely and is in compliance with statutory reporting requirements.
The Borrower, through MoLFSP, shall take all necessary measures to strengthen the institutional capacity for strategic planning, performance monitoring and performance management of the GDSA, the Social Inspection and NASB and the National Institute for Medical Expertise and Work Capacity Recovery, in accordance with the Stand-by Arrangement between Romania and IMF and the MoU and the Loan Agreement between Romania and the EC, respectively.
The Borrower shall ensure that appropriate budget allocations are made available yearly for the Project implementation purposes, throughout the Project duration.
Recurrent Recurrent
Schedule 2, Section II.A.1
The Borrower, through MoLFSP, shall monitor and evaluate the progress of the Project and prepare Project Reports in accordance with the provisions of Section 5.08 of the General Conditions and on the basis of the indicators acceptable to the Bank. Each Project Report shall cover the period of six months, and shall include, inter alia: (a) expenditure data for the Social Assistance Program included in the EEP in compliance with the Borrower’s national economic budget classification; (b) Project’s implementation reports in a format and content as described in the POM. Such reports shall be furnished to the Bank not later
Recurrent

Schedule 2, Section II.A.2 Schedule 2, Section II.A.3 Schedule 2, Section II.A.4
than forty five (45) days after the end of the period covered by such report. Without limitation upon provisions of paragraph 1 of this Section, the Borrower shall, through MoLFSP, NASB and CASBs, retain all detailed expenditure information with respect to payments to beneficiaries under the Social Assistance Programs included in the EEP within their jurisdiction, which may be requested by the Bank for post review. During Project implementation, the Borrower, through the Court of Accounts, shall carry out annual audits of the Social Assistance Programs included in the EEP, and shall provide such audit reports to the Bank not later than twelve (12) months after the end of the calendar year, starting with the audit of 2011. During Project implementation, the Borrower, through MoLFSP, shall cause the Social Inspection to carry out sample based thematic inspections of the implementation of the Social Assistance Programs included in the EEP (except the State Child Allowance Program), in such scope and regularity as defined in the POM and covering, without limitation, the level of irregularities and errors occurring in administering social benefits, their causes and remedial actions taken. The reports of the thematic inspections carried out in a respective year shall be provided for the Bank’s review not later
Recurrent Recurrent Recurrent

than ninety (90) days from the end of thematic inspection of each year during Project implementation starting with the calendar year of 2012. The Borrower, through MoLFSP, shall provide the Bank an opportunity to discuss and comment on said reports and shall promptly carry out the agreed recommendations provided by the Bank upon such reviews.
Schedule 2, Section II.B.1 Schedule 2, Section II.B.2 Schedule 2, Section II.B.3
The Borrower, through MoLFSP and NASB, shall maintain or cause to be maintained a financial management system in accordance with the provisions of Section 5.09 of the General Conditions. Without limitation on the provisions of Part A of this Section, the Borrower, through MoLFSP and NASB, shall prepare and furnish to the Bank as part of the Project Report not later than forty five (45) after the end of each calendar quarter, interim unaudited financial reports for the Project covering the quarter, in form and substance satisfactory to the Bank. The Borrower, through MoLFSP and NASB, shall have Program Financial Statements relating to the EEP audited by the Court of Accounts in accordance with the provisions of Section 5.09 (b) of the General Conditions. Each audit of the Program Financial Statements shall cover the period of one fiscal year of the Borrower, shall be carried out in accordance with the terms of reference acceptable to the Bank. The
Recurrent Recurrent Recurrent
audited Program Financial Statements for each such period shall be furnished to the Bank not later than twelve (12) months after the end of such period.
Schedule 2, Section III.B.2.b) If, at any time, the Bank determines that any portion of the amount disbursed by the Bank to the Borrower under Category (1) was made for reimbursement of expenditures which are not eligible under the EEP or not in compliance with the provisions of Section III.B.1 (b) of this Schedule and the provisions in the POM, the Borrower shall promptly refund any such amount to the Bank as the Bank shall specify by notice to the Borrower.

1
I. Strategic Context
A. Country Context
1. Romania experienced several years of strong economic growth that was accompanied by a rapid increase in government spending. Economic growth exceeded 6.5 percent during the period from 2003-08. Public spending also accelerated during the above period, against the backdrop of Parliamentary and Presidential elections. The public wage bill and social protection transfers increased from 51 percent in 2005 to almost three quarters of tax revenues in 2009, which hovered around 32 percent of GDP throughout the period. Between 2005 and 2009, the public wage bill increased by 2.1 percent of GDP, from 7.4 to 9.5 percent, as both the real wages and the number of employees went up. Social protection spending, including social assistance, increased its burden on the budget. Pension spending went up by almost 3 percent of GDP from 2005 to 2009, from 5.3 percent to eight percent. Social assistance spending doubled its relative size during the period, from 1.4 percent to 2.9 percent of GDP.
2. The global financial and economic crisis hit economic activity in Romania quite strongly, compelling the country to implement a demanding fiscal consolidation program during 2010-12. Following the pre-crisis increases in public spending, budget revenues fell due to the decline in economic activity in the crisis, resulting in an expansion in the fiscal deficit to 7.4 percent of GDP in 2009. On the onset of the economic crisis in 2009, the Government introduced measures to protect the poor and vulnerable groups. To restore Romania’s medium-term macroeconomic viability, the Government implemented an austerity package in the second half of 2010, including reducing public wages by 25 percent, reducing certain non-contributory pensions and other benefits by 15 percent and increasing the VAT rate by five percentage points, from 19 percent to 24 percent. The country’s fiscal consolidation program, supported by the IMF, EC and World Bank through financial support (€20 billion) and extensive technical assistance, includes measures to contain the fiscal deficit to 6.8 percent of GDP in 2010, 4.4 percent in 2011 and 3 percent in 2012.
3. Romania’s overall macroeconomic framework has improved considerably in 2010, but the medium term outlook continues to be subject to uncertainties and risks, especially on the fiscal side. Supported by the multilateral program with the IMF, the EC and the Bank, the economy shows clear signs of stabilization. Fiscal consolidation has advanced, placing the budget deficit on a downward medium term path, internal and external imbalances have been reduced and the markets confidence has been reinstated, opening the room for the resumption of economic growth after two years of contraction. Measures taken in 2010 have put the government finances firmly on path to reach the Maastricht deficit target of 3 percent of GDP in 2012. Financial sector measures ensured adequate capitalization of banks and liquidity in domestic markets, securing banking sector stability and preventing excessive capital outflow.
4. Growth is expected to resume in 2011 though at low rates, and to pick-up further in 2012. Economic growth would resume in 2011 at 1.5 percent, accelerate in 2012 to 4.4 percent of GDP, and continue at 4.0-4.5 percent per annum over the medium term, driven by the recovery of the global economic environment, renewed investor confidence, and steady increase in domestic demand at 4-5 percent per annum as of 2012. The output gap due to the crisis would close by 2015. Year-end inflation would gradually decline to 3.7 percent in 2011 and 3 percent in 2012.
5. The resumption of growth in 2011 hinges on the pace of recovery in Western Europe and successful implementation of the reform program. Risks include a more protracted than expected downturn in the Romanian economy with consequences for government’s fiscal

2
position and a negative impact on bank balance sheets, and exchange rate volatility. The reform agenda is still ongoing and, as the crisis subsides, the government needs to turn its attention to promoting long term measures to enhance economic growth, productivity and competitiveness.
Table 1. Key economic indicators 2007 2008 2009 2010 2011 2012Real GDP growth (%) 6 7.8 -7.1 -1.9 1.5 4.4Domestic demand (%) 7.2 -12.8 -3.8 1.3 5.1Consumer price index (%, average) 7.8 5.6 5.9 5.2 3.0Fiscal balance (% of GDP) -3.1 -4.8 -7.4 -6.8 -4.4 -3.0Structural fiscal balance (% of GDP) -8.8 -6.7 -4.4 -1.9 -1.3Current account balance (% of GDP) -13.8 -11.9 -4.5 -5.1 -5.4 -5.1Foreign direct investment balance (% of GDP) 5.8 6.7 3.8 3.0 4.2 4.5 Gross external debt (% of GDP) 47.1 52.6 69.2 72.3 70.8 63.2
Source: IMF
6. Reducing the fiscal deficit in a sustainable way, while ensuring a resumption of growth, remains the principal medium term challenge for the Government. While the policies currently in place should enable Romania to meet both the 2011 and 2012 fiscal deficit targets, there are significant implementation challenges to key elements of the reform program. The containment of current spending in the medium term depends on several important factors (see Table 2):
the ability of the government to retain the bulk of the wage cuts throughout 2011 and advance with the gradual implementation of the unitary pay law over the medium term;
a continued reduction in public employment and redeployment of staffing to areas of need, such as to enhance the absorption of EU funds;
the implementation of the new pension law as planned; healthcare reforms to address the formidable pressures for expenditure overruns as in the
past; promoting revenue-enhancing measures to address the capacity constraints of tax
administration; and implementing the rationalization of the social assistance programs without delay.
Table 2. Planned Sources of Fiscal Adjustment, 2011-2013 % of GDP
2010 2011 2012 2013
Target budget deficit 6.8 4.4 3.0 2.5 Required fiscal adjustment (vs. 2010 baseline) 2.4 3.8 4.3
of which: Reduction in Government Expenditures:
Public wage bill 1.4 1.4 1.4 Public employment 0.1 0.2 0.2 Implementation of the new pension law 0.3 0.5 0.6 Healthcare system rationalization 0.2 0.2 0.2 Social assistance programs' rationalization 0.4 0.7 0.8 Other measures 0.0 0.3 0.7
Increase in Government Revenues 0.1 0.5 0.0
Source: World Bank estimates, based on Government Fiscal-Budgetary Strategy 2011 and IMF

3
2.862.44
2.14 2.07
0
0.5
1
1.5
2
2.5
3
3.5
2010 2011 2012 2013
% of GDP
Figure 1. The Relative Annual Cost of Social Assistance will fall during 2010-2013 with Implementation of Reforms
Source: Social Assistance Reform Strategy 2011-2013, Government of Romania
7. Social assistance reforms will also generate fiscal savings, once implemented. The implementation of the Social Assistance Reform Strategy for 2011-2013, supported by the proposed Social Assistance Sector Modernization (SASM) project, would reduce the relative cost of social assistance programs from 2.9 percent of GDP in 2010 to an estimated 2.1 percent by 2013 (Figure 1). Spending on social assistance, in percentage of Government revenue, will also fall from 8.8 percent in 2010 to 7.5 percent in 2011, 6.5 percent in 2012 and 6.4 percent in 2013. This would bring the social assistance spending in Romania closer to the average spending levels in the new EU countries. Relative to its 2010 (baseline) level, the relative annual cost of social assistance is estimated to fall by 0.42 percentage points in 2011, 0.72 percentage points in 2012 and 0.78 percentage points by 2013. The sources of fiscal savings include parametric reforms; reduction in the level of error, fraud and corruption; and the freeze of the benefit levels of most programs (see Annex 8).
8. The Government remains committed to the reform program, even though such reforms are politically difficult. The Government has successfully adopted several ambitious reforms in recent months, as discussed below and in Annexes 8 and 9. The country is run by a coalition government and the current Prime Minister has been head of the Government since December 2008. The economic crisis and the austerity measures, which the Government has adopted in response to the crisis, have been politically difficult and have lead to some public protests,
as is the case in many countries.
9. Performance of social indicators is mixed. A decade of growth contributed to a reduction in absolute poverty from 35.9 percent in 2000 to 5.7 percent in 2008. The decline in absolute poverty continued during 2009, thanks in part to an expansion of social protection spending which largely compensated for the drop in earnings of the poor and the middle class. Absolute poverty fell to 4.4 percent in 2009. However, according to the measure of relative poverty used in Romania1, about 24 percent of the population was living in poverty in 2008. In broad terms, this is the target group for Romania’s social assistance programs for low-income households. The standardized unemployment rate, which increased from a low of 5.68 percent in first quarter of 2008 to 7.58 percent in the fourth quarter of 2009, started falling to 7.09 percent in the second quarter of 2010. In addition to poverty, other social concerns include: (a) declining fertility2; (b) an aging population; (c) relatively low labor market participation3; (d) a
1 The EU measures poverty and social inclusion using numerous indicators. The most commonly used poverty indicator relates to the share of population living on less than 60 percent of the median income per adult equivalent. 2 The total fertility rate (TFR) fell from 1.84 children per women in 1990 to 1.31 in 2000, to hover around this level during the 2000s (reaching 1.39 in 2009). A constant level of population is achieved for a TFR of 2.1. Source: Eurostat.
4
large share of work-age population depending on social assistance benefits (and possible adverse incentives of these benefits on labor market participation); and (e) relatively weak education outcomes of school-aged children living in poor or vulnerable households.
B. Sectoral and Institutional Context
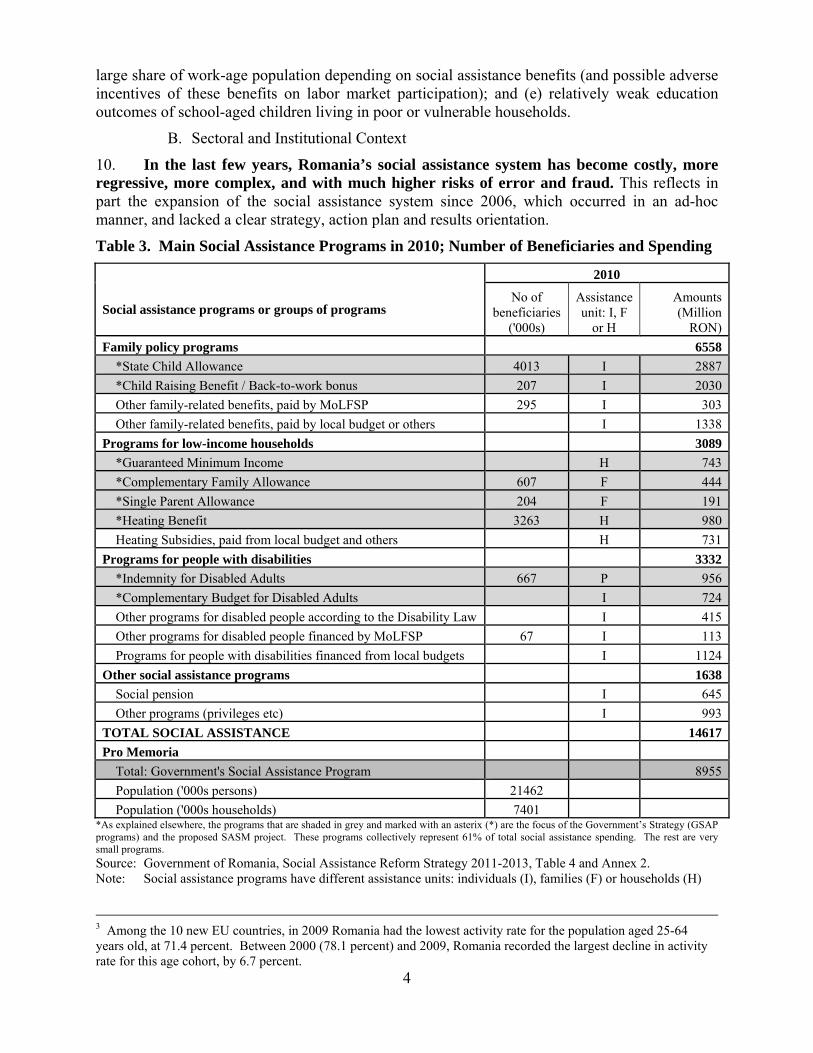
10. In the last few years, Romania’s social assistance system has become costly, more regressive, more complex, and with much higher risks of error and fraud. This reflects in part the expansion of the social assistance system since 2006, which occurred in an ad-hoc manner, and lacked a clear strategy, action plan and results orientation.
Table 3. Main Social Assistance Programs in 2010; Number of Beneficiaries and Spending
2010
Social assistance programs or groups of programs No of
beneficiaries ('000s)
Assistance unit: I, F
or H
Amounts (Million
RON)
Family policy programs 6558
*State Child Allowance 4013 I 2887
*Child Raising Benefit / Back-to-work bonus 207 I 2030
Other family-related benefits, paid by MoLFSP 295 I 303
Other family-related benefits, paid by local budget or others I 1338
Programs for low-income households 3089
*Guaranteed Minimum Income H 743
*Complementary Family Allowance 607 F 444
*Single Parent Allowance 204 F 191
*Heating Benefit 3263 H 980
Heating Subsidies, paid from local budget and others H 731
Programs for people with disabilities 3332
*Indemnity for Disabled Adults 667 P 956
*Complementary Budget for Disabled Adults I 724
Other programs for disabled people according to the Disability Law I 415
Other programs for disabled people financed by MoLFSP 67 I 113
Programs for people with disabilities financed from local budgets I 1124
Other social assistance programs 1638
Social pension I 645
Other programs (privileges etc) I 993
TOTAL SOCIAL ASSISTANCE 14617
Pro Memoria
Total: Government's Social Assistance Program 8955
Population ('000s persons) 21462
Population ('000s households) 7401 *As explained elsewhere, the programs that are shaded in grey and marked with an asterix (*) are the focus of the Government’s Strategy (GSAP programs) and the proposed SASM project. These programs collectively represent 61% of total social assistance spending. The rest are very small programs.
Source: Government of Romania, Social Assistance Reform Strategy 2011-2013, Table 4 and Annex 2. Note: Social assistance programs have different assistance units: individuals (I), families (F) or households (H)
3 Among the 10 new EU countries, in 2009 Romania had the lowest activity rate for the population aged 25-64 years old, at 71.4 percent. Between 2000 (78.1 percent) and 2009, Romania recorded the largest decline in activity rate for this age cohort, by 6.7 percent.

5
11. The social assistance system includes numerous programs administered by MoLFSP, and many others administered by local governments. The main programs are summarized in Table 3 above; Annex 7 provides detailed information on the benefit level and eligibility criteria for these programs (Table 7.7). By their objectives and target groups, these programs fall into four categories: family policy programs; means-tested programs for low-income households; programs for people with disabilities; and other programs (notably the social pension). Eight programs4, large both in terms of beneficiary served and spending level represent the backbone of the social assistance system (highlighted in grey and indicated with an asterix in Table 3). These eight programs account for 61 percent of the total social assistance spending. They are the focus of the Government’s Strategy for Social Assistance Reform, and represent the “Government Social Assistance Program” for the purpose of this proposed project.
Table 4. Targeting accuracy, Coverage and Generosity of Main Social Assistance Programs in Romania (2009)
Targeting Accuracy
Coverage Generosity
Poorest
20% Population
Poorest 20%
All beneficiaries
Poorest 20%
Total social assistance programs, of which:
37.7 57.5 82.2 9.3 26.2
1. Family policy / pro-natality programs State Child Allowance 33.1 52.2 74.3 4.0 10.1
Child Raising Benefit 29.1 4.0 6.2 22.7 37.2
2. Programs for LIH Guaranteed Minimum Income 81.5 3.4 14.2 19.4 23.6
Complementary Family Allowance 59.5 7.9 23.8 4.0 5.5
Single Parent Allowance 68.6 0.8 2.8 6.4 8.4
Heating Benefits 53.0 na na 18.5 40.4
3. Disability programs Benefits for People with Disabilities 35.7 4.4 8.6 15.5 25.8
4. Other social assistance programs Privileges 13.1 1.4 1.1 14.8 25.4
Social Pension 48.9 0.1 0.3 20.2 39.9 Notes: Targeting accuracy is the transfer amount received by the group as a percent of total transfers received by
the population. Program coverage is the portion of population in each group that receives the transfer. Generosity is the ratio of the transfer amount received by all beneficiaries in a group over the total welfare aggregate of the beneficiaries. By beneficiaries we mean all direct and indirect (other household members) receiving a transfer
Source: World Bank estimates based on HBS 2009. Deciles constructed based on per capita income net of transfers
12. The social assistance system has produced mixed results in terms of protecting the poor5 and vulnerable. Targeting accuracy varies among the social assistance programs captured by the 2009 Household Budget Survey (Table 4 above and Annex 7). Means-tested
4 Due to program consolidation, the number of programs in the “Government Social Assistance Program” was reduced from eight to seven from January 1, 2011, as the Complementary Family Allowance and the Single Parent Allowance have been consolidated into one program, the Family Allowance program. See Table 3 for the process of program consolidation during 2010-2013. 5 In this document, we use a relative definition of poverty, where we focus on the poorest 20 percent of the population ranked by per adult equivalent income. This is very close to the EU measure of relative poverty used in Romania (about 24 percent of the population living in relative poverty, by that measure).

6
programs for low-income households have very good targeting accuracy (with 64 percent of targeted benefits accruing to those in the poorest quintile), at par with best last-resort programs in the region. This share is substantially higher than for categorically-targeted programs (for families or people with disabilities), which transfer about a third of their funds to the poorest quintile. Privileges are regressive, transferring fewer funds to the poorest quintile than the share of this group in the population. Overall, the targeting accuracy of the system (37.7 percent in 2009) is on the low side in the ECA region, due to the prevalence of categorically-targeted programs. The system scores high on coverage of the poor (82.2 percent of the poorest quintile receives at least one social assistance program in 2009) and generosity (social assistance programs account for 26.2 percent of the income of the poorest quintile). Two programs are driving up the coverage rate of the poorest quintile: the State Child Allowance and Heating Benefit (HB) programs; all other programs cover less than 10 percent of the population. Five programs account for a large share of the income of the households in the poorest decile: the Child Raising Benefits, the GMI, the HB, benefits for people with disabilities and the social pension.
13. The fiscal cost of the social assistance system has risen. The surge in social assistance spending from 1.4 percent of GDP in 2005 to 2.9 percent of GDP in 2010 has contributed to a decline in poverty but has not translated into better human development outcomes (Figure 2). Spending expanded through four channels:
Family policies aimed, inter alia, at stimulating fertility. Several new programs aimed at boosting fertility were introduced (a Child-Rising Benefit; a Birth Grant; and an in-kind Allowance for Newborns) and the State Child Allowance (SCA) for children 0-2 years old was increased five times (from 42 to 200 RON per month, approximately USD 13 to USD 63), which added 0.9 percent of GDP to the social assistance bill. This expansion was accompanied by a modest increase in the total fertility rate, achieved at the expense of a reduction in labor force participation of parents of child-bearing age. In part, this is due to the overly generous and inequitable aspects of the Child Raising Benefit (non-contributory parental leave benefit), which pays 85 percent of pre-benefit earnings to the stay-home parent for the child’s first two years (three years if the child is disabled). This benefit is generous even by developed country standards.6
A new disability benefit system. In 2006, a new benefit system increased the generosity, eligibility and scope of disability programs, adding another 0.45 percent of GDP. Part of this increase led to improved support for disabled who are vulnerable, but another part was lost due to abuse of the system (error and fraud) or accrued to better-off families. For instance, since the new system discontinued income-testing, this allowed some beneficiaries to ‘double
6 In most EU countries, non-contributory parental leave benefits are offered for up to one year; in contrast, Romania offers these benefits for two years. Also, the size of the benefit is typically less than the average wage in most countries while in Romania it is 2.5 times higher than the average wage. With an implicit marginal tax rate of 85 percent on earnings (the benefit compensate of 85 percent of the average wage earned by the applicant parent during the previous two years), this type of benefit discourages work.
0.0
0.5
1.0
1.5
2.0
2.5
3.0
3.5
2005 2006 2007 2008 2009 2010 (budget)
Figure 2. Social Assistance Spending in Romania (% of GDP)
Other
Social assistance pensions
Programs for disabled
Support for low income households
Family policies

7
dip’ by claiming both the disability pension and the disability assistance benefits, and it also increased the share of funds going toward upper-income households.
Increased thresholds for means-tested programs. In 2008 and 2009, the eligibility thresholds for three income-tested programs (Complementary Family Allowances (CFA), Single Parent Allowances (SPA) and Heating Benefits (HB)) were increased from levels corresponding to the poorest decile (in 2008) to income levels as high as those of households in the fifth or sixth decile (in 2009), diluting the targeting accuracy of scarce budgetary resources.
Introduction of a social pension top-off for pensioners on low pensions. The social pension, introduced in 2009, fills the gap between the current pension and a relatively generous social minimum (350 RON in 2010, which is 35 percent higher than the absolute poverty line and roughly three times higher than the Guaranteed Minimum Income - GMI). In 2010, the cost of this policy was 0.13 percent of GDP.
14. Between 2005 – 2009, equity deteriorated. The proportion of overall social assistance funds going to the poorest quintile has declined in recent years, resulting in a loss of equity. While total social spending doubled in real terms since 2005, the share of spending on programs targeting low-income households has halved, from 45 percent in 2005 to 21 percent in 2009. Categorical benefits,7 rather than needs-based programs, have increased significantly in recent years such that 80 percent of expenditures on child and family benefits are spent on categorical programs, rather than on means-tested programs that would benefit the poor, resulting in increased regressivity at a time of tighter fiscal constraints. Only one-fifth of total social assistance spending is means tested, and even these programs have been expanded to include higher-income families. While the GMI program remains highly accurate in its targeting of benefits to the poorest, it is very small in terms of coverage, and reaches only a fraction of the poorest 10 percent. The share of spending on all social assistance benefits going to the poorest quintile of the population fell from 39 percent in 2005 to 37 percent in 2009 (estimates based on Household Budget Surveys for 2005 and 2009); the share going to the poorest decile fell from 26 percent to 23 percent.
15. Between 2005 – 2009, the social assistance system was fragmented and inefficient, involving high transaction and institutional costs. An assessment of public spending on social assistance by the Ministry of Public Finance (MoPF) in 2009 counted 57 categories of non-contributory social assistance entitlements operated by the Ministry of Labor, Family and Social Protection (MoLFSP), local governments and the Ministry of Education; plus another 145 quasi-wage benefits classified as social assistance by the Ministries of Interior, Defense and Justice. In the last decade, the MoLFSP was reorganized to separate policy-making and implementation functions by transferring implementation responsibilities for social assistance programs to three agencies subordinated to the Ministry: (i) the National Agency for Social Benefits (NASB), which operates the Management Information System for the majority of the social assistance programs and processes payments; (ii) the National Authority for Disabled Persons, which supervises social care centers and monitors the cash transfers for non-institutionalized disabled; and (iii) the Social Inspection, with the role to guard the integrity of the social protection system against error, fraud or poor management and the quality of social services. All three agencies have a central office and regional offices in each of the 41 counties. Social assistance claimants submit applications for many benefits via 3,100 social assistance offices in local town halls that are operated and financed by local governments. Other agencies cover other areas, like pensions,
7 Categorical programs define eligibility for broad categories (e.g. children, elderly, disabled etc.), irrespective of the means of the beneficiary.

8
labor market issues, domestic abuse, child protection, gender equality, and migration. In July 2010, some central agencies were reintegrated in the institutional structure of the MoLFSP as General Directorates, including the Social Inspection and the National Authority for Disabled Persons and National Agency for Child Protection; the reorganization of their territorial units is still under discussion.
16. Between 2005 – 2009, significant duplications existed in the area of disability policy. Beneficiaries of disability pensions and disability benefits are subject to two separate eligibility determination systems and receive two different bundles of cash and services from two separate institutions, although about half of the disability benefits’ beneficiaries also receive disability pensions. Institutional fragmentation seems to hinder effective policy making, communication, and implementation. A Functional Review of the Ministry of Labor, Family and Social Protection, currently being carried out through a fee-based service agreement between Romania and the World Bank using EU Structural Funds, will identify gaps and overlaps in responsibility leading to recommendations for simplification and greater efficiency of the system. A reorganization of the service delivery chain around the principle of one-beneficiary, one-application, one-point-of-service could substantially reduce the administrative and private costs of social assistance.
17. The fragmentation and complexity of the social assistance system leads to significant levels of error and fraud.8 This reduces efficiency and undermines the credibility of the system. Recent inspections by the Social Inspection (conducted in June-August 2010) suggest that the rate of error and fraud in certain benefits schemes is significant. Instances of errors and fraud have been confirmed in the disability allowance and Guaranteed Minimum Income (GMI) programs. As a result, Government remedies have resulted in the discontinuation of some benefits of beneficiaries of the GMI program and disability benefits, respectively. The weakest link in the “benefits delivery chain” is the town hall, which is charged with processing and increasing the number of benefits and claims for multiple benefits, crowding out key functions such as oversight and control of the validity of claims. The SAFIR system administered by NASB does not cover all social assistance programs and is not linked to other government databases able to facilitate cross-checks of data (data-matching) that would flag inaccuracies. Simplification of social assistance programs, as well as investment in the social inspectorate function and data-matching across government systems, could help improve compliance across the whole social assistance system and reduce the fiscal cost of social assistance.
18. Until recently, the social assistance system lacked a coherent strategy, a clear action plan and a results orientation. During the period of high growth (2003-2008), politics was the main factor driving up the fiscal costs of the social assistance system, with the largest increases in the generosity of benefits occurring before the 2008 and 2009 elections. When the crisis hit Romania in 2009, many actions taken by the Government were reactive and punctual, first in an attempt to protect the population from the crisis (2009) and later to reduce the fiscal cost of the system (2010).
19. At the same time, Romania’s social assistance system has some strong features which the current Government is committed to build upon. With the GMI, a program that ranks among the best in terms of targeting accuracy in the region and the world, Romania has found a model that is well adapted to country circumstances and can be replicated more widely.
8 It is important to recognize that social assistance programs always suffer from some degree of fraud and error. Thus, what is more important is to put in place systems for detecting, remedying, and minimizing these irregularities. Fraud refers to intentional behavior on the part of the benefit claimant to defraud the benefit system. Error refers to unintentional mistakes on behalf of benefit claimants or staff in the benefit office.

9
The system that processes payments, the management information systems and the financial management arrangements are strong for a subset of programs administered by the NASB. The institutions and mechanisms for oversight and controls, including for reducing the level of error and fraud, are also in place. In particular, the Social Inspection has well trained personnel and adequate procedures which proved their effectiveness during 2010. The proposed partnership between Romania and the World Bank will build on these strong fundamentals, and aims to improve the performance of the system (first generation reforms). Looking forward, MoLFSP could better link social assistance administration with the National Employment Agency (NEA). In doing so, it would be possible to advance the second generation reforms of the social assistance system in areas such as activating social assistance beneficiaries and providing incentives for human capital accumulation.
The Government’s Social Assistance Reforms Strategy
20. The Government of Romania has embarked on a comprehensive reform of its social assistance system. The outline of the new reforms, at the level of goals and principles, was endorsed by the Government in April 2010. Since then, the MoLFSP has undertaken many reform measures (see Annexes 2 and 7). It also prepared its Social Assistance Reform Strategy, adopted by the Government on February 28, 2011 (see Annex 7 for details). The key rationale for the Government’s Strategy is to improve the equity of the social assistance system, reduce its fiscal cost, simplify the service delivery, and reduce the levels of error and fraud; in other words, to address the key challenges of the sector outlined in paragraphs 13-17 above.
21. The objectives of the Government’s Social Assistance Reform include: (i) Reducing the fiscal cost of the system; the fiscal savings as of 2013 are estimated at
0.78 percent of GDP compared to the 2010 budgeted spending. While these savings will not bring the social assistance spending levels to the 2005 level, they will bring outlays closer to the average level of spending in the new EU member states;
(ii) Consolidating the number of benefit programs to reduce fragmentation, and containing and/or reducing spending levels;
(iii) Increasing the equity of the system, by expanding the principle of granting assistance primarily to those in need;
(iv) Increasing the pro-activity of the system, by providing incentives for households to invest in the education of their children and for adults to seek and retain work;
(v) Simplifying the administration of the system; and (vi) Setting clear program objectives and monitoring their results to improve performance
management.
22. To achieve these objectives, the Government’s Strategy focuses on four inter-related areas: parametric reforms; improvements in the management of the information; improvements in the payment arrangements; and improvements in the use of public resources (reduction of the error, fraud and corruption in the system). Parametric reforms include merging and consolidating of programs (see Table 5 for a
before and after summary), modifying the parameters of the programs (eligibility criteria, recertification criteria), as well as detailed implementation rules (application procedures and forms, documentary evidence, procedures for home visits).
These reforms would also be accompanied by improvements in the management of the information in the payment arrangements. This agenda is centered on the NASB, the payment agency for some of the social assistance programs, which will cover all the large social assistance programs by 2013.

10
A key element of the strategy is the emphasis on strengthening mechanisms to reduce the losses from error, fraud and corruption (EFC). These measures are focused on the strengthening of the Social Inspection, a specialized unit of the MoLFSP with the mandate to protect the system from EFC and to check the eligibility of beneficiaries. The NASB will reconcile the list of eligible recipients with the list of those who have been paid.
To support these changes, the Government’s Strategy indentifies the key inputs to achieve its goals: the legislative and regulatory inputs; human resource needs; technical assistance and other investments.
Table 5. Program Consolidation under the Social Assistance Reform Strategy 2011-2013.
2010: Configuration of Programs “Before” SASM
Project (% of SA spending 2010)
2011 2012 2013: Configuration of Programs “After” SASM
Project
Fam
ily
Pol
icie
s
*State Child Allowance (SCA) (20%)
SCA SCA State Child Allowance (SCA) (unified application form)
* Child Raising Benefits (24 months paid maternity leave) (14%)
CRB (modified)
CRB (modified)
Modified Indemnity for Child-raising (unified application form)
Other family-policy benefits (11%)
Other family-policy benefits
Other family-policy benefits
Other family-policy benefits (unified application form)
Sup
port
Fo
r L
ow-I
ncom
e H
ouse
hold
s
*Complementary Family Allowances (CCA) (3%)
Family benefits
Family benefits
Consolidated program for low-income households paid through single payment agency (unified application form)
*Single Parent Allowances (SPA) (1%)
*Guaranteed Minimum Income Program (GMI) (5%)
GMI GMI
*Heating Benefits (7%)
Heating Benefits
Heating Benefits
Prog
ram
s fo
r D
isab
led
(23%
of
SA
bene
fits
, of
whi
ch f
irst
two
acco
unt
for
14%
of
SA
spe
ndin
g)
*Indemnity for Disabled Adults (IDA)
IDA IDA Two largest disability benefit programs (IDA + CBD) consolidated; follow harmonized assessment criteria, unified institutional framework
*Complementary Budget for Disabled (CBD) CBD CBD
Other disability benefits (7%) Specific benefits remain but with harmonized disability and assessment criteria, unified institutional framework with single registry; and with strengthened O&C
Social Pensions & Other (20%) Social Pensions & Other No of GSAP programs in
8 7 7 4
Total 2.9% of GDP 2.1% of GDP (0.78% cost savings compared to 2010)
*As explained elsewhere, the programs that are shaded in grey and marked with an asterix (*) are the focus of the Government’s Strategy (GSAP programs) and the proposed SASM project. These programs collectively represent 61% of total social assistance spending. The rest are very small programs.

11
C. Higher Level Objectives to which the Project Contributes
23. The Government has asked the World Bank to engage in a multi-year partnership to support implementation of these reforms to strengthen the performance of its social assistance system. The focus of the partnership would be on implementation of Government’s Social Assistance Reform Strategy and related improvements in the social assistance system. As such, the proposed Project would support Romania in the design and implementation of key reforms, and then would disburse against indicators that measure the achievement of results associated with these reforms. There are 26 priority monitoring indicators in the Government’s Strategy associated with its six objectives. From this list, the World Bank and Romania have selected a subset of disbursement-linked indicators (DLIs) for the proposed SASM project. Achievement of these results will cumulatively lead to the achievement of the Project Development Objectives, as discussed below.
24. Ultimately, the partnership between Romania and the World Bank would contribute to Romania’s long-term goals to achieve growth and convergence with other EU countries, while protecting the poor and vulnerable. Some of the expected long-term gains from this partnership would include:
Reducing the fiscal cost of social assistance programs, by bringing it in line with the level of spending in the new EU member states. With successful implementation of reforms, the share of social assistance spending in GDP is projected to decline from 2.9 percent in 2010 to 2.1 percent in 2013 (due to the combined effect of modernizing and improving the efficiency of the system). These savings will support the growth and convergence goals, by freeing up resources from social assistance programs that were not meeting their stated goals.
Reducing poverty by strengthening targeting accuracy and improving efficiency. The share of overall social assistance funds going to the poorest quintile is projected to increase from 37.7 percent (2009) to at least 45 percent9.
Substantially reducing administrative and private costs associated with the social assistance system. The cost per application is estimated to decline by 15 percent and the application cost for low-income households is likely to decline by 15 percent from baseline value.
Detecting and reducing the rates of error and fraud in complex, risk-prone social assistance programs.
Contributing to other improvements that are not quantifiable but are nonetheless important, such as: improved policy making, strengthened performance management and stronger result orientation, strengthened oversights and controls, and improvement in the data quality for social assistance programs.
25. The proposed partnership would also contribute directly to several of the objectives in the Country Partnership Strategy (CPS) for FY10-13. A strategic positioning exercise showed the World Bank’s comparative advantage in supporting the national objectives10. The exercise was based on a perception survey done in February 2010 with high-level former and current representatives of the Romanian public administration (including Prime Ministers, 9 This indicator is the targeting accuracy of the overall social assistance system, including categorical benefits with moderate targeting accuracy which will not be modified during 2011-2013, such as disability benefits, State Child Allowance, Child Raising Benefits. The targeting accuracy of specific programs, such as the means-tested programs (FAs, HBs, GMI) would improve even more, from 64 percent to over 90 percent 10 Strategic Prioritization, Mihaela Stanculescu, Francois Rantrua, Catalin Pauna, March 11, 2010, Powerpoint presentation, mimeo

12
Secretaries of State) with the aim to identify the country needs for technical and financial assistance. The analysis of data provided valuable information regarding the way in which the country needs match with the World Bank’s comparative advantage in Romania in clients' perception: sectors and sub-sectors in which the country needs for assistance are high and the World Bank’s capacity is perceived as good and there is market share opportunity, were identified (i.e. social sectors, transportation). Based on consultations with the Presidency and Government officials, the areas for action for 2010-2013 were determined (including also a few other sectors that need to be improved). Moreover, the study showed that there is a high need for monitoring and evaluation of policies and the World Bank could assist. Social protection and social inclusion ranked high both in terms of country needs, and as an area where the World Bank has comparative advantage. Although this operation was not envisaged at the time of the CPS, it is directly relevant to several key objectives, including:
Promoting social and geographical inclusion – by refocusing social assistance spending on the poor and making it easier for the poor to access the assistance for which they are eligible;
Supporting Romania in responding to the economic and financial crisis - by cutting back on social assistance programs that do not target those in need or do not achieve their stated objectives, and facilitating the recovery of over-payments of social assistance with an effective error and fraud strategy.
26. The World Bank has a long-standing engagement on social protection issues in Romania. In recent years, the World Bank has been involved in social protection issues through a recently-closed Social Sector Development Project and an on-going Social Inclusion Project, as well as through several Analytical and Advisory Activities (AAA). As part of the international crisis-response program, the World Bank’s Development Policy Loan (DPL) series includes several measures in the area of Social Protection: in the first DPL, the eligibility threshold of the most efficient and well-targeted program, the Guaranteed Minimum Income (GMI), was increased to allow more coverage of the poor during the crisis and the funding and administrative arrangements were improved; the second DPL supports improvements in the targeting of two income-tested family benefits without increasing the overall budget envelope11. Both the GMI and the income-tested family benefits have been protected from the 15 percent cut in social transfers in 2010. The proposed project builds on the legislative inputs achieved via the DPL (revised GMI law, new Family Benefit law), by providing implementation support for the social assistance agenda of the DPL series. It would also expand the scope of World Bank support, both in terms of covering a broader set of social assistance programs, and in terms of providing implementation support beyond the development of new legislation or parametric reforms, with a 11 Under the DPL series, the Government program had supported and improvements in the GMI, CCA and SPA programs. Under DPL1, d the LPA and CCA were spared budget cuts and the threshold for the GMI program was increased by 15 percent with a corresponding increase in funding. Under DPL2, the emergency ordinance on the increase of the GMI threshold was enacted into law and the Government has initiated legislation aimed at improving the targeting of the two income-tested child allowances—the Complementary Child Allowance (CCA) and the Lone Parent Allowance (LPA) – and merging them into one program, the Family Allowance (FA) program. The new benefit schedule for FA: (i) reduces the eligibility threshold of the income tested family programs to RON 370 (limiting benefits to the first three income deciles); (ii) provides higher benefits to families with incomes below RON 200 (effectively families in the first decile); and (iii) uses a per child benefit formula up to the first four children. Under DPL3, the FA legislation was adopted by Parliament and new legislation was passed to transfer the GMI budget to the Ministry of Labor, Family and Social Protection (MoLFSP) and the payment function to the National Agency for Social Benefits (NASB). The transfer of the GMI budget increases the predictability and transparency of the benefit payments and reduces the potential for errors and fraud. Local governments would no longer have the discretion to allocate among various expenditure categories, as was the case in 2009, when the GMI was financed from a conditional block grant. This legislation was adopted by Parliament in December 2010.

13
deeper partnership to strengthen benefits administration and overall performance of the system. The implementation of the proposed SASM project would be facilitated by the knowledge transfer supported by the technical assistance (TA) identified during the project preparation, and financed under the ongoing (restructured) Social Inclusion Project (SIP), as discussed in more detail below.
27. Synergies are strong among IMF, EC, and World Bank operations, including the Functional Reviews (FR). The preparation of a new support operation (IMF/EC/WB) started in January 2011, including another round of the DPL series supported by the World Bank. The activities implemented under the proposed World Bank-financed SASM project would be closely coordinated with the other two partner institutions (IMF and EC), given complementary to the IMF and EC programs. The second phase of the on-going Functional Review of the Public Administration in Romania, commissioned by the GoR and financed under the EU structural funds, includes a review of the Labor, Family and Social Protection sector, including the social assistance. The scope of the Functional Review is broader including, in addition to social assistance, issues in the pensions and labor market areas. The Inception report of the Functional Review includes a set of recommendations that are complementary to the SASM project (as discussed in Annex 2).
28. Notwithstanding its benefits, the World Bank assesses the proposed Project as a high risk operation. The Government faces a fiscal situation that requires strong measures while its political support base is relatively fragile. At the same time, social assistance reforms will inevitably face some public opposition, requiring strong Government leadership and support to see them through. Moving forward with a social assistance reform in such a context can be risky, as discussed in more detail in Section V and Annex 4 (ORAF) and in Annex 9.
II. Project Development Objectives
A. Project Development Objectives
29. The proposed Project Development Objective is to improve the overall performance of Romania’s social assistance system by strengthening performance management, improving equity, improving administrative efficiency and reducing error and fraud. The proposed Project would focus on the Government’s programs for low-income households, the disabled, and families with children.
30. The proposed Project would partner with Romania to support implementation of its social assistance reforms. The broad directions of these reforms are established in the Government’s Strategy for Social Assistance Reforms, but support is needed to translate the goals into specific reform actions and outputs, and then to implement the program so as to achieve the intended outcomes. While the Government’s reforms encompass a wide spectrum of activities, including those relating to cash transfers and social services, the proposed Project focuses on supporting the Government’s efforts to improve results relating to equity, efficiency, and performance management, in relation to three types of social assistance transfers, namely those designed for low income households, the disabled, and families with children. This focus has important institutional linkages, as the MoLFSP’s structure and its programs are organized around these beneficiary groups.
1. Project Beneficiaries
31. The primary beneficiaries would include low income households, specific vulnerable groups, as well as taxpayers more generally.

14
Low-income households and vulnerable groups, such as needy families, single parents, Roma households, and the rural poor, would benefit from improvements in targeting accuracy, as they would receive a greater share of social assistance benefits (Results Area II).
Low-income households, persons with disabilities, and other applicants would benefit from the simplification and harmonization of intake and recertification processes, since the private costs of applying for benefits and accessing the system would be reduced (Results Area III). A reduction in the costs of applying for benefits would have the greatest impact on poor households, including Roma households, for whom such costs constitute important barriers for inclusion and for whom exclusion errors will decline.
Taxpayers would benefit from lower fiscal costs, as well as higher effectiveness and efficiency of social assistance spending. The proposed reforms offer some opportunities for the reallocation of resources to more efficient and effective spending. Specifically, the effect of increased administrative efficiency and reduced error and fraud (Results Areas III and IV) and other reforms are projected to reduce the fiscal costs of the social assistance system from 2.9 percent in 2010 to about 2.3 percent annually with implementation of the reforms.
2. PDO Level Results Indicators
32. The partnership between Romania and the World Bank will focus on four results areas: strengthening performance management, improving equity, improving administrative efficiency, and reducing error and fraud. These themes are articulated in the Government’s Social Assistance Strategy which is grounded on equity and efficiency principles and would be implemented following a realistic timeframe and an adequate resource and responsibilities allocation. The associated results indicators are as follows:
Strengthened Performance Management: Romania’s social assistance reform is implemented following a results-oriented strategy and action plan and is supported by a performance-management M&E system.
Improved Equity: Share of social assistance funds going to the first poorest quintile increased to 45 percent from 37.7 percent at baseline (in 2009).
Improved Administrative Efficiency: Reduction in administrative and client participation costs for means-tested programs by 15 percent from baseline value.
Reduced Error and Fraud: Programs for low-income households, disability benefits and family policy programs have strengthened information systems, and oversight and control procedures including detection of error and fraud using risk-based investigation, data matching, data quality audits and consolidated beneficiary registries.
III. Project Description
33. The proposed Project aims at strengthening the performance of Romania’s social assistance system. It is organized around the above mentioned four results areas, each contributing to the achievement of the PDO. For each results area, a series of inputs, actions, outputs and outcomes along a “results chain” has been identified (as illustrated in Figures 2a-2d and listed in the matrix Table A2.1 in Annex 2). Each “results chain” contributes to the achievement of the Project Development Indicators (PDIs) which are labelled with capital letters, from A to D.

15
34. Along these “results chains,” some of the critical actions, outputs and outcomes have been selected as Disbursement Linked Indicators (DLIs). A total of 20 DLIs have been agreed on and are detailed in matrix format in Annex 2, Table A2.1. Among the 20 DLIs, 18 are identified as priority outputs for marking progress in improving the implementation and functioning of Romania’s social assistance system, and two represent core intermediate outcomes generated by these improvements (step-wise improvements in targeting accuracy and measurable cost savings from the system).
35. These results chains would be complemented by co-financing of critical technical assistance (TA). While the proposed Project formalizes a partnership between Romania and the World Bank to accompany the implementation of critical actions, outputs and outcomes along the results chain, some complementary technical inputs will be needed as part of the process of strengthening Romania’s social assistance system. Romania has indicated that rather than borrowing for the TA in the context of the proposed loan, it prefers to restructure the on-going Social Inclusion Project (SIP) (Loan No.4825-RO) to reallocate €6 million to finance TA. Additionally, it is expected that the incremental costs for capacity building expenditures in MoLFSP and its implementing agencies and the administrative costs of implementing these programs by local governments could be offset within the overall budget for social assistance spending in two ways: (a) by eliminating ineffective programs, consolidating duplicate programs aimed at the same target groups and providing similar “treatments”, scaling down overly-generous programs, or flattening regressive benefit schedules; and (b) by consolidating some of the administrative functions and institutions under the MoLFSP. In addition, a Japanese PHRD Grant proposal for support of Disability and Development was submitted and, if approved, would provide approximately US$1.8 million for that results area of the loan. Finally, expertise and resources would be available as part of the on-going Functional Review of the MoLFSP.
Results Area I: Strengthened Performance Management
36. Until recently, the social assistance system lacked a coherent strategic vision, a clear action plan and results-orientation. As a result, the majority of the social assistance measures adopted over the past four years were ad-hoc, motivated initially by political considerations and subsequently by the economic crisis. These ad hoc measures, in turn, contributed to a costly, inefficient and ineffective social assistance system, as discussed in Section I. Available management information tools were not used for monitoring or measuring performance. The Integrated Information System for Administration of Social Benefits (SAFIR) for the social assistance system was launched in 2008, but only covers four out of the eight major social assistance programs. While SAFIR contain important data on social assistance programs, it is insufficiently used to support operational and policy-level management. Rather, SAFIR is primarily used as a tool to manage payment processes for a subset of social assistance programs. A monitoring module is part of the existing SAFIR software, but does not operate due to staffing and hardware constraints.
37. In this context, the proposed Project seeks to strengthen the management of Romania’s social assistance system such that implementation is guided by the Government’s results-oriented strategy and action plan, and is supported by a performance-management M&E system. Progress towards this intended outcome would be monitored through key actions and outputs along a results chain (Figure 2a). Along this results chain, three key Disbursement Linked Indicators were selected to accompany implementation and measure progress. (Figure 2a and Table 2.1 in Annex 2).

16
The dissemination of an Action Plan outlining the implementation of the vision of reform for the next three years is deemed a critical output for improving the overall system. (DLI 1).
Two additional output DLIs relating to improvements in performance monitoring and management of the overall social assistance system. Three monthly monitoring reports of 4 programs (DLI 2) and (DLI 3).
38. This results-focused partnership would be complemented by technical assistance inputs, co-financed through other sources. Specifically, the proposed restructuring of the on-going Romania SIP would support technical assistance inputs for the development of the action plan, as well as technical investments in the Government’s management information systems to expand the “decision-maker module” of the software.
Figure 2a: Strengthened Performance Management Results Chain
DLI 1:Adopted Action Plan for the Social Assistance Strategy is
disseminated by MoLFSP (output)
PDI AImproved Management:
Romania’s social assistance reform is
implemented following a results-oriented strategy and action plan and is
supported by a performance-management
M&E system
TA: Support for the development of the action plan of the social assistance
strategy (financed from SIP)
Target Timing; Year 1 Target Timing; Year 2 Target Timing; Year 3
DLI 3Three performance-management
reports for Low-Income Households Programs are
produced by NASB and used at the management level in MoLFSP
and NASB (output)
TA: Support for the development of a performance management system
(financed from SIP)
TA: To expand SAFIR decision-maker rules to generate regular performance
management reports (financed from SIP)
DLI 2Three monthly monitoring reports
of 4 programs (Family Allowance, Child Raising
Benefits, GMI, and State Child Allowance) are produced by
(NASB) (output)
The dissemination of the action plan contributes to
the achievement of all other DLIs (4 to 20)
39. The main risks for this Results Area are related to adequate staffing in the Government Agencies. Critical expertise in the four key implementation units or agencies (General Directorate for Social Assistance (MoLFSP), the Social Inspection, the National Agency for Social Benefits (NASB) and the National Institute for Medical Expertise and Work Capacity Recovery) are needed to ensure institutional capacity for strategic planning, performance monitoring and performance management, as endorsed by the EC/IMF/World Bank.
Results Area II: Improved Equity
40. Over the last five years, the social assistance system grew more costly and more regressive. For each key target group of social assistance system, more spending went hand-in-hand with increased regressivity:

17
The targeting accuracy12 for three income tested programs - Complementary Family Allowance, Single Parent Allowance, and seasonal Heating Benefit – deteriorated, as eligibility thresholds were increased from the poorest decile to the fifth decile (i.e., half the population) for the Complementary Family Allowance; and to the sixth decile, for heating benefits, significantly broadening the income range of applicants.
Similarly, the generosity and coverage of disability benefits were increased in 2007 when a change in the eligibility procedures eliminated an income test; by 2009, the number of disability allowance claimants rose by 50 percent. Recipients of contributory disability pensions are also entitled to draw on non-contributory disability allowances. One-third of the recipients of disability benefits also receive disability pensions.
Four new schemes were introduced to stimulate fertility and counter the region-wide demographic challenge brought about by declining fertility rates and out-migration: the Child Raising Allowance Benefits (a high-cost, regressive program) and three smaller one-time benefits (for new couples, birth grant, and a basket of goods for newborn babies). The programs were categorical, hence have poor targeting accuracy. The three smaller programs were eliminated in July 2010 as part of Romania’s crisis response.
41. In this context, the proposed Project would gradually improve the targeting accuracy of the social assistance system, by changing the program mix, changing the eligibility and benefits parameters of selected programs, and harmonizing the institutional framework so that by the end of the Project there would be a single, consolidated program for low-income households. These measures are fully consistent with the Government’s Social Assistance Reform Strategy. Figure 2b maps the results chain that would lead to an increase in the share of funds accruing to the poorest quintile from 37.7 percent to 45 percent. Along this results chain, four key DLIs were selected to accompany implementation and measure progress, including:
A reduction in the eligibility threshold for family and heating benefits. A new law on Family Benefits adopted in December 2010 consolidates the Complementary Family Allowance and the Single Parent Allowance into one benefit with a lower eligibility threshold (RON 370 versus RON 470, corresponding to the poorest three deciles versus poorest five deciles) and a higher benefit levels for poorer beneficiaries. A similar downward revision of the eligibility threshold for heating benefits is scheduled for the third quarter of 2011. (DLI 4)
The elimination or scaling-down of regressive, ineffective programs. The Government of Romania eliminated three smaller pro-natality cash payments to new couples and mothers in July 2010, and reduced the generosity of the Child Raising Benefit starting in January 2011. This will reduce the share of spending on categorical, regressive programs, and will contribute to an increase in the targeting of the overall social assistance spending (see Annex 8 for the results of a simulation of these parametric changes). (DLI 5)
The consolidation of all means-tested programs into one program for low-income households. A new law consolidates all means-tested programs (Family Benefits, Heating Benefits, and the GMI) into one single program for low-income households. The new program is larger and more generous than the current GMI (targets the poorest quintile, not only the poorest ventile), and better targeted than the Family or Heating
12 Targeting accuracy is a key intermediate outcome indicator for poverty-focused social assistance programs. It measures the share of program funds reaching the poor.

18
Benefits (see Annex 8 for the results of a simulation of these parametric changes). (DLI 6)
Regular measurement of targeting accuracy by the National Statistical Institute, using a standardized methodology that will produce comparable results across time. (DLI 7)
Figure 2b: Improved Equity Results Chain
42. This results-focused partnership would be complemented by technical assistance inputs, mostly financed under the on-going Romania SIP (as discussed above) to support the design and implementation of communications campaigns (see Annexes 2 and 9) to inform the population on the rationale, cost and benefits of the proposed reduction in the duration of the child-raising benefit; the reintroduction of income-testing for disability benefits; and the consolidation of all income- or means-tested programs into a single program for low-income households. The SIP would also support technical assistance inputs for the development of a regular statistical bulletin to track the targeting accuracy of the largest social assistance programs. The SIP will also support the development of the SAFIR information system, according to the new rules for the benefits programs.
Results Area III: Improved Administrative Efficiency
43. The administration of the fragmented system is inefficient. As of 2010, each of the numerous social assistance programs have separate application procedures, resulting in separate paper files being maintained for the same family, making the system difficult for the applicant to navigate and costly for the social assistance staff to process. The targeting accuracy of the income tested programs has remained below potential, and access to these programs is unnecessarily complex and costly. Only the GMI program uses a means test, while all other programs use less accurate income-tests. The identification of the needy is inconsistent across programs for low-income households, due to different definitions of means and of the assistance unit (i.e., individual, family, household). The administration of disability benefits is

19
unnecessarily complicated, with two separate benefits (payments) being made per beneficiary by different institutions, for historical reasons. About one-third of the disability pensioners receive disability benefits, and are screened for disability using different criteria by the Pension House and the disability benefit system. There is significant scope for simplification and harmonization of criteria and institutional framework.
44. The proposed Project supports Romania’s efforts to streamline this complex system. Programs for low-income households and family programs would be processed using a single application and single point of service. The rules and procedures to determine the means of the needy households would be harmonized, using the model of the best targeted program, the GMI. The disability assessment procedures and institutional framework for disability pensions and disability benefits will also be harmonized. These measures are fully consistent with the Government’s Social Assistance Reform Strategy. Figure 2c maps the results chain that would support this. Along this results chain, five key DLIs were selected to accompany implementation and measure progress.
Two output DLIs tracking the progress in implementing a harmonized disability assessment criteria and a unified institutional framework for disability benefits and invalidity pensions; (DLI 9 and DLI 10)
One output and one intermediate outcome DLIs tracking the progress in implementing a single application form for means-tested and family benefits, and an unified procedure to determine the means of the needy households; (DLI 8 and DLI 11) and
An output DLI measures the reduction in administrative and client participation costs for means-tested programs. (DLI 12)
Figure 2c: Improved Administrative Efficiency Results Chain

20
45. Complementary technical assistance would be required to design harmonized and integrated procedures for the different programs, prepare legislation to support the change, and modify the supporting the management information and IT system of NASB, the payment/registry agency for a majority of social assistance programs. Staff in town halls and county agencies would need training on the new system. Technical assistance for implementing this result area would be financed mostly from the on-going Romania SIP, as discussed above.
Results Area IV: Reduced Error and Fraud
46. At present, some social assistance programs contain significant levels of error and fraud. This prevents adequate resources from reaching those who need them most and undermine public trust in the social assistance system. As the social assistance system grew in complexity over the last 4 years, verification was either absent or minimal. In 2007, a Social Inspection was introduced, with the role of verifying compliance with program rules for social assistance transfers and social services, but the focus has been on the latter. In 2010, the inspections of cash transfer programs were carried out in two social assistance programs (GMI and disability benefits). They have shown significant rates of irregularities. The Social Inspection needs to be deployed more strategically, as similar rates of irregularities can be expected in other, larger programs, including the Single Parent Allowance, Complementary Family Allowance, Heating Benefits, and the Child Raising Benefit. Starting 2012, yearly sample-based inspections are planned for all these programs; through these inspections, the Government will establish baseline data on rates of error and fraud. Furthermore, social assistance databases are not linked to other databases across government, so there is no possibility of identifying obvious errors (an individual receiving child benefit, paying tax and receiving old age pension). Data-matching is a cost-effective and simple means of identifying such cases of error and/or fraud.
47. The proposed Project seeks to strengthen the institutions in charge of combating error and fraud. It also seeks to improve the oversight and control procedures incorporating the principles of prevention, detection, and deterrence. Data-matching with other databases at the application stage would aim to prevent ineligible beneficiaries from registration for income- or means-tested benefits intended for low income households. Compliance checks, social inspections, and re-certification will detect ineligible claimants of the Disability Benefits, Child Raising Benefit, and Family Allowance whose circumstances may have changed and thus reduce ‘leakage’ from the system to ineligible claimants. A sanctions policy would deter potential fraudulent claims and recover misspent resources. Figure 2d maps the results chain that would support achievement of this vision. Along this results chain, eight key DLIs were selected to accompany implementation, including:
Three output DLIs would increase the cost-efficiency of the Social Inspection;
Five output DLIs would support expanding the use of data-matching to detect cases with irregularities, data quality audits and consolidated beneficiary registries.

21
Figure 2d: Reduced Error and Fraud Results Chain13
DLI 13At least one thematic inspection campaign is carried out for each of the following programs: GMI,
Disability Benefits, Family Allowance, Heating and Child
Raising Benefits (output)
DLI 17Sanctions policy provisions, investigative powers and the
referrals system for the Social Inspection are revised and in
place (output)
DLI 19Risk-based investigation to
detect error and fraud is used by the Social Inspection for Low-income Households
Programs, Child Raising and Disability Benefits (output)
TA: Support to develop a national database for disability
benefit beneficiaries (SIP)
TA: Develop a data matching program for the databases operated by NASB, Pension House, NEA, Civil Registry and
ANAF (EU Funds)
PDI DReduced Error and
Fraud: Programs for low-income households,
disability benefits and family policy programs
have strengthened information systems, and
oversight and control procedures including detection of error and fraud using risk-based
investigation, data matching, data quality audits and consolidated beneficiary registries.
Target Timing; Year 1Target Timing;
Year 2Target Timing;
Year 3
DLI 18Three monthly lists of
irregularities detected by NASB via data matching between SAFIR and the databases managed by
Pension House, and NEA are sent to Social Inspection for verification and proposing remedial actions (output)
TA: Evaluation of the accuracy and completeness of the
information held in SAFIR; assess the capacity of SAFIR
to cross-check information with other public databases;
support for the development of the cross-checking needs /
requirements (SIP)
DLI 20Three monthly lists of
irregularities detected by NASB via data matching between SAFIR and the databases of ANAF and Registrul National de
Evidenta a Populatiei are sent to Social Inspection for
verification and proposing remedial actions (output)
TA: Legal TA for the development of a new
sanction policy and investigative powers for Social
Inspections (SIP)
DLI 14Remedial action plan is adopted by
NASB to address the recommendations of: (i) an
independent evaluation of the completeness and accuracy of the
SAFIR information; and (ii) a feasibility study of SAFIR data crosscheck with other databases
(output)
DLI 15At least 90% of GMI
beneficiaries are paid through NASB for two consecutive
months (output)
DLI 16A central registry with a national database of disabled persons is in
place (output)
TA: Support for the development of risk-based inspections (client profiling)
(SIP)
TA: Upgrade SAFIR with new rules for GMI, Family
Support benefits, Child Raising Benefits and the consolidated program for Low-Income Households
(SIP)
48. Complementary technical assistance would be required to introduce international experience of error and fraud reduction programs, design a comprehensive error and fraud strategy and implementation procedures, bolster and train the Social Inspection and provide for data-matching provisions between various Government databases, including those relating to tax, property registration, and other social protection programs. Staff in county agencies and the Social Inspection would need training on the new social inspection techniques, referrals system and sanctions policy. Data exchange protocols would be needed across several departments and agencies to facilitate data-matching while ensuring the confidentiality of such information. Specifically, EU funds would support technical assistance inputs for the development of the data matching program.
13 “Registrul National de Evidenta a Populatiei” means the national registry for the population administered by the Romanian Ministry of Administration and Interior.

22
A. Project Financing
1. Lending Instrument
49. The proposed Project would take the form of a €500 million “results-based” Specific Investment Loan (SIL) over a three year period, supporting the Government’s Social Assistance Program estimated at €5.5 billion. With a results-based approach, project disbursements would be (a) linked to defined eligible expenditure line items (jointly comprising the “Eligible Expenditure Program” or EEP) within the Government’s Program (social assistance system); and (b) triggered by the verified achievement of agreed specific results (“Disbursement-Linked Indicators” or DLIs) for improving the performance of that Program (the Romanian Government’s Social Assistance System).
Defining the Government’s Overall Program (Social Assistance System)
50. The proposed Project would partner with the Government’s Program, which is defined as the social assistance system. As discussed in Section 1 above, the Government’s social assistance system includes a number of programs, which can be grouped into four broad categories: family policy programs, means-tested programs for low-income households; programs for people with disabilities; and “other” programs (Table 3). In total, public spending on these programs accounts for about 2.9 percent of GDP (2010). The eight largest programs (in terms of spending and coverage), represent the backbone of the social assistance system, and account for 61 percent of total social assistance spending (totaling between Euro 1.7-1.9 billion per year, see Table 7). These programs include: (a) two family policy programs: the State Child Allowance and the Indemnity for Child Raising/Back-to-Work Bonus; (b) four targeted programs for low-income households (which are being consolidated with the support of this proposed operation): the Guaranteed Minimum Income Program (GMI), the Complementary Family Allowance, the Single Parent Allowance,14 and the Heating Benefit; and (c) two disability programs: the Indemnity for Disabled Adults and the Complementary Budget for Disabled Adults (see Table 3). These eight programs are the focus of the Government’s Strategy for Social Assistance Reform, and hence the focus of the proposed SASM project. They are thus referred to collectively as the “Government’s Social Assistance Program” for the purpose of this proposed operation.
Definition and Qualification of Programs for the Pooled Eligible Expenditure Program
51. The World Bank would reimburse a portion of the Government’s expenditures on its Program (the social assistance system). Within the overall Government Program of Social Assistance, specific programs would be qualified for World Bank reimbursement if they meet an established set of criteria for inclusion in the pooled “Eligible Expenditure Program.” These criteria focus on safeguarding entry into the pooled EEP to those programs with robust fiduciary arrangements. Specifically, social assistance programs would meet the following criteria for World Bank reimbursement under the pooled EEP:
Single Payment & Operating Agency. Qualifying programs would be operated via a single payments and registry operating agency (the NASB) that meets robust financial management arrangements (see Annex 3 for details).
14 In January 2011, reform legislation already consolidated the Complementary Family Allowance and the Single Parent Allowance into a single redesigned program, now called the “Family Allowance Program,” thus bringing the total number of main programs from eight to seven. Further reforms under the Government’s Social Assistance Strategy and supported by the proposed operation would consolidate the remaining targeted programs into a single program for low-income households, to be paid through a single payment agency (see Table 5 for “Before” and “After” Composition of the main social assistance programs in Section 1).
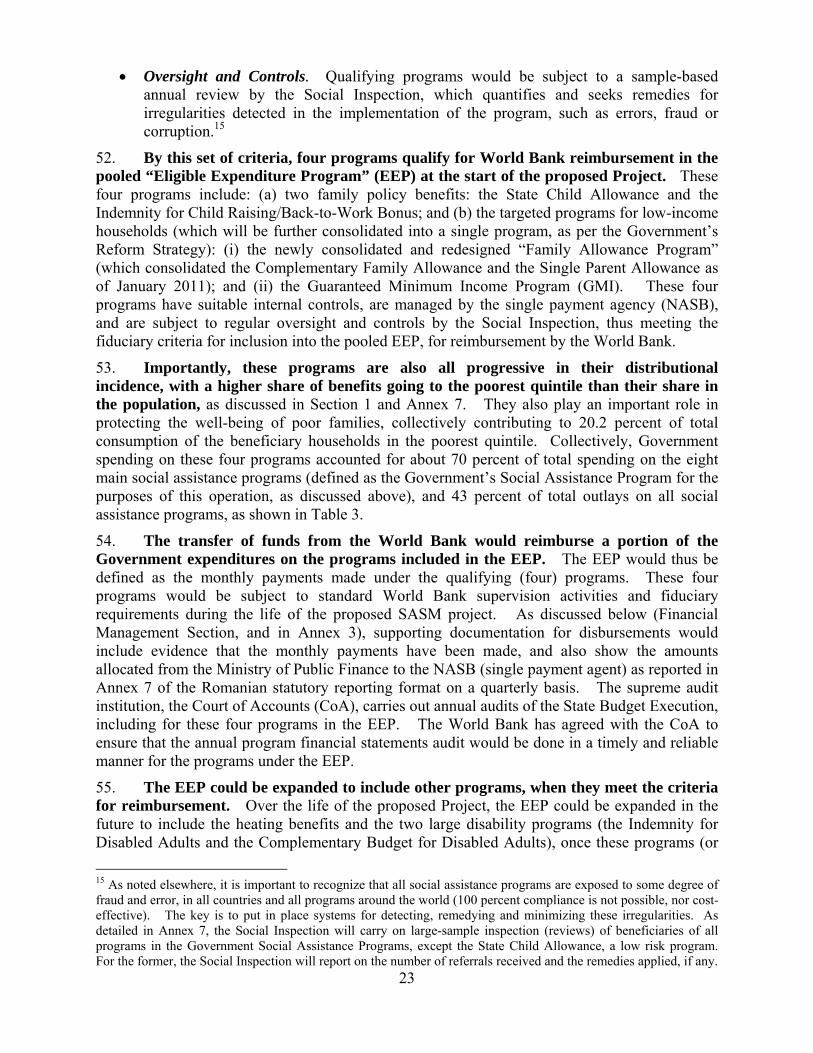
23
Oversight and Controls. Qualifying programs would be subject to a sample-based annual review by the Social Inspection, which quantifies and seeks remedies for irregularities detected in the implementation of the program, such as errors, fraud or corruption.15
52. By this set of criteria, four programs qualify for World Bank reimbursement in the pooled “Eligible Expenditure Program” (EEP) at the start of the proposed Project. These four programs include: (a) two family policy benefits: the State Child Allowance and the Indemnity for Child Raising/Back-to-Work Bonus; and (b) the targeted programs for low-income households (which will be further consolidated into a single program, as per the Government’s Reform Strategy): (i) the newly consolidated and redesigned “Family Allowance Program” (which consolidated the Complementary Family Allowance and the Single Parent Allowance as of January 2011); and (ii) the Guaranteed Minimum Income Program (GMI). These four programs have suitable internal controls, are managed by the single payment agency (NASB), and are subject to regular oversight and controls by the Social Inspection, thus meeting the fiduciary criteria for inclusion into the pooled EEP, for reimbursement by the World Bank.
53. Importantly, these programs are also all progressive in their distributional incidence, with a higher share of benefits going to the poorest quintile than their share in the population, as discussed in Section 1 and Annex 7. They also play an important role in protecting the well-being of poor families, collectively contributing to 20.2 percent of total consumption of the beneficiary households in the poorest quintile. Collectively, Government spending on these four programs accounted for about 70 percent of total spending on the eight main social assistance programs (defined as the Government’s Social Assistance Program for the purposes of this operation, as discussed above), and 43 percent of total outlays on all social assistance programs, as shown in Table 3.
54. The transfer of funds from the World Bank would reimburse a portion of the Government expenditures on the programs included in the EEP. The EEP would thus be defined as the monthly payments made under the qualifying (four) programs. These four programs would be subject to standard World Bank supervision activities and fiduciary requirements during the life of the proposed SASM project. As discussed below (Financial Management Section, and in Annex 3), supporting documentation for disbursements would include evidence that the monthly payments have been made, and also show the amounts allocated from the Ministry of Public Finance to the NASB (single payment agent) as reported in Annex 7 of the Romanian statutory reporting format on a quarterly basis. The supreme audit institution, the Court of Accounts (CoA), carries out annual audits of the State Budget Execution, including for these four programs in the EEP. The World Bank has agreed with the CoA to ensure that the annual program financial statements audit would be done in a timely and reliable manner for the programs under the EEP.
55. The EEP could be expanded to include other programs, when they meet the criteria for reimbursement. Over the life of the proposed Project, the EEP could be expanded in the future to include the heating benefits and the two large disability programs (the Indemnity for Disabled Adults and the Complementary Budget for Disabled Adults), once these programs (or
15 As noted elsewhere, it is important to recognize that all social assistance programs are exposed to some degree of fraud and error, in all countries and all programs around the world (100 percent compliance is not possible, nor cost- effective). The key is to put in place systems for detecting, remedying and minimizing these irregularities. As detailed in Annex 7, the Social Inspection will carry on large-sample inspection (reviews) of beneficiaries of all programs in the Government Social Assistance Programs, except the State Child Allowance, a low risk program. For the former, the Social Inspection will report on the number of referrals received and the remedies applied, if any.

24
their successors in the event of consolidation) would satisfy the above-mentioned criteria. Indeed, implementation support under the results-chain frameworks for the proposed project does seek to strengthen the administration of these programs, such that they achieve higher fiduciary standards. Such implementation support and supervision16 would be associated with DLIs that are specific to these programs (e.g., harmonizing disability criteria and institutional structures under DLIs 9 and 10, unifying the registry of disabled persons under DLI 16) and with broader system-wide DLIs that apply to all programs in the Government’s Program of Social Assistance (e.g., strengthening oversight and controls under Results Area IV). Complementary technical assistance provided by the restructured Social Inclusion Project (SIP) will also help strengthen these functions (as discussed above and in Annex 2).
Disbursements Triggered by Achievement of Results (DLIs)
56. Disbursements would be triggered by the verified achievement of agreed specific results for improving the performance of the Government’s Program (the social assistance system, as defined above). The MoLFSP and the World Bank have defined a set of 20 “Disbursement Linked Indicators” (DLIs) that consist of key results that contribute to the achievement of the PDO. These DLIs include are described in detail in relation to the results chains in Results Areas I-IV above, and in matrix format in Table A2.1 in Annex 2, and include: (a) 18 output indicators, marking improvements in the administration, functioning and implementation of the social assistance system; and (b) two intermediate outcome indicators, measuring improved performance and impacts of the social assistance system (the Government’s Program, as defined above).
57. When each DLI is achieved and verified, €25 million would be disbursed upon presentation of documentation related to the EEP. Verified achievement of the DLIs would gradually lead to the achievement of the PDO over the Project’s implementation period, although results are expected to continue in a sustained manner well beyond the Project’s lifespan. In terms of timing, the DLIs have been presented under “Target Years 1, 2, and 3” for purposes of projecting disbursements and facilitating Government budget planning, but their timing is not fixed. Rather, disbursements will be made upon verified achievement of the specified DLI at any time during the implementation period. Disbursed funds would flow to the MoPF’s Euro account opened at the National Bank of Romania (NBR) as reimbursement for spending on the pooled EEP. Disbursement projections by year and by priority area are presented in Table 6. A detailed description of each DLI, as well as the protocols for verification of their achievement, can be found in Annex 2.
16 Until these programs are qualified for inclusion in the pooled EEP, they would not be co-financed by the World Bank under the proposed operation (and as such, fiduciary and INT oversight would not directly apply). The World Bank would supervise their implementation and strengthening through the vehicle of the partnership formed by the Results Framework and the DLIs, as well as through the complementary TA activities supported by the restructured SIP. This is analogous to World Bank TA SILs whereby the partnership focuses on strengthening program administration, without directly co-financing the program per se (e.g, in traditional Social Protection SILs or Pension Administration SILs).

25
Table 6. Disbursement Projections by Priority Area and Target Years, Million Euros
2. Project Cost and Financing
58. The proposed Project’s contribution would represent a small share (16 percent in 2011, 6 percent in 2012, and 10 percent in 2013) of the Government’s spending on the Eligible Expenditure Program (EEP), which would currently include the four programs qualified for inclusion in the EEP, as described above. It would represent an even smaller share (7 percent in 2011, 2 percent in 2012, and 6 percent in 2013) of the Government’s overall social assistance spending, as illustrated in Table 7.
Table 7. Contribution of the Project to the Government Social Assistance Program
Million Ron Million Euro
2010 2011 2012 2013 2010 2011 2012 2013
Social Assistance Spending of which: 14617 13269 12826 13694 3431 3115 3011 3215 Government Social Assistance Program 8955 8224 7792 8660 2102 1931 1829 2033 EEP Programs (shaded) 0 6070 5638 8660 0 1425 1323 2033
State Child Allowance 2887 2999 2999 2999 678 704 704 704 Child Raising Benefit 2030 1916 1510 1113 477 450 354 261 GMI 743 687 668 0 174 161 157 0 Heating Benefits 980 547 547 0 230 128 128 0 Family Allowances 635 468 461 0 149 110 108 0 Consolidated program for LIH 0 0 0 2941 0 0 0 690 Indemnity for Disabled Adults 956 914 914 0 224 215 215 0 Complementary Budget for Disabled
Adults 724 693 693 0 170 163 163 0 Consolidated program for disabled
adults 0 0 0 1607 0 0 0 377 Disbursement projections (DPs) 225 75 200 DPs as a share of Social Assistance Spending 7% 2% 6% DPs as a share of the Government SA Program 12% 4% 10% DP as a share of EEP 16% 6% 10%
Notes: Staff estimation based on the spending forecast in the Government’s Social Assistance Reform Strategy, as reflected in Annex 7, Table 3. Disbursement projections from Table 4 EEP social assistance programs (forecast) are shaded Conversion of RON to Euro based on an exchange rate of 4.26 Euro/RON as of February 10, 2011
B. Alternatives Considered and Lessons Learned and Reflected in the Project Design
59. The proposed Project provides an opportunity to partner with Romania to support implementation of its efforts to strengthen and modernize its social assistance program with disbursements linked to measurable results.

26
60. Value-added from the proposed partnership would come from several sources: (a) a long-term partnership between the World Bank and Romania on the implementation of its Strategy for Social Assistance Reforms; (b) direct links between reimbursement of the cash transfer programs (those included in the pooled EEP) and the achievement of results; (c) the introduction of a results-based approach to managing and monitoring social assistance programs in Romania; and (d) the provision of international expertise both through implementation support under the proposed operation and through the financing of technical assistance under the companion restructured Social Inclusion Project (SIP). By ‘rewarding’ results, the proposed Project would also support the Romania with the political economy issues it faces in seeking to reform an entitlements-based social assistance system that currently benefits a wide spectrum of society (as discussed in more detail in Annex 9).
61. Alternative approaches considered for the proposed Project include providing financing through an additional DPL or another more traditional, input-based SIL. The proposed Project would complement the existing DPL series and Romania SIP with a partnership focused on strengthening the Government’s social assistance system in the four results areas. It is important to emphasize that all lending partnerships between the World Bank and our client Governments are designed to achieve results. Typically, these results are described in a results framework that presents core indicators for monitoring progress (input use, outputs, intermediate results, and outcomes) that explicitly or implicitly assume a causal relationship between inputs and results, such as the “results chains.” World Bank lending instruments vary, though, based on the degree to which specific results along the chain (ranging from inputs to outcomes) are linked to disbursements and the time-frame for accompanying the implementation of these results:
With Development Policy Operations (DPOs), disbursements are typically triggered when key policy actions (reforms) are undertaken. These reforms represent crucial actions (inputs) to set the framework for improvements and achievement of ultimate outcomes for development. They support the structural policy reforms deemed necessary for results to materialize. In Romania, key reform actions to help strengthen the social assistance system are currently being supported by a DPL series (as discussed in Section I.C). The proposed SASM project seeks to complement this DPL series by supporting implementation of system improvements over the medium-term.
With traditional Specific Investment Loans (SILs), disbursements are typically made against inputs – such as technical assistance and physical inputs. These inputs are identified as crucial building blocks to generate outputs and achieve outcomes for development impact. Supervision then focuses on contracting and implementation of these inputs, with monitoring of outputs and evaluation of potential impacts under the results framework. For the proposed operation, a traditional, input-based SIL was also rejected due to the risk that it would be too transaction-oriented, leading to a focus on procurement of specific inputs (e.g., IT systems, technical inputs, etc.) – though some select technical assistance activities would be directly supported under the complementary Social Inclusion Project. The proposed SASM project allows for a partnership with the Romanian authorities to support the implementation of their Strategy to modernize and improve the performance of the social assistance system, both through direct reimbursement of qualified programs in the pooled EEP and through implementation support linked to the monitoring and verification of results via the DLIs.
62. While disbursements have been linked to the achievement of results in other programmatic SILs supported by the World Bank, this approach is new for the World

27
Bank’s partnership with Romania. Since the mid-1990s, an increasing number of World Bank projects have supported various lending operations that incorporate results-based features, such as sector-wide approaches (SWAps), output based aid (OBA), and so forth. Many of these have been implemented in the social protection sector, including those supporting conditional cash transfers (CCTs), such as the World Bank’s partnership with Brazil’s Bolsa Familia Program, which reimbursed the program in a similar way to the proposed EEP for this operation, and which paced disbursements with “milestones” measuring improvements in the quality and performance of the program (similar to the DLI approach proposed here). This approach of linking disbursements to results in the context of a SIL is new for the World Bank’s partnership with Romania, however, and relatively new for the ECA region as a whole.
63. The experience gained from these results-based SILS in other countries has been taken into account in guiding the design of the proposed Project (particularly from those in the social protection and human development sectors). Some such “lessons learned” include (a) establishing a strong rationale and strategic vision for the project (see Section 1); (b) political commitment to the reforms being implemented and clear communications for the rationale for these reforms, including consultations with stakeholders (see Annex 9 on political economy and communications); (c) the importance of designing the operation on the basis of thorough technical diagnostics including for the expenditure framework (the Government’s overall Social Assistance Program and the programs selected for inclusion in the pooled EEP (see Section 1, the technical discussion in Appraisal section plus Annexes 2, 3, 7 and 8); (d) the importance of clearly defined results chains with measurable and verifiable disbursement-linked indicators (milestones, or DLIs), careful attention to “time calibration” of achievement of expected results, and clear protocols for measuring and verifying achievement of results (see Annex 2); and (e) the provision of on-going implementation support (described throughout the PAD and also in Annex 5).
64. One of the key lessons learned from other projects of all types – both in Romania and elsewhere – is the need for a strong partnership for results. Delivery of a new strategy or of legislation may be a necessary precursor or framework for important reforms, but too often there is only partial or inadequate implementation. The design of the proposed Project focuses precisely on the implementation phase and provides a medium-term partnership with Romania to help ensure that their ambitious Strategy for Social Assistance Reforms is implemented to achieve results. The World Bank is working with the Romanian Government counterparts to map out the key steps for implementation under the draft Action Plan, and have jointly identify “rewardable” results in the four core Results Areas for the Government’s Program. In doing so, the proposed Project aims to help instill a culture of results-monitoring, whereby the Government of Romania regularly collects and uses evaluations, management reports, and other sources of information to enhance the performance of its social assistance programs.
65. Another key lesson is the need to reap synergies with other country operations. The proposed SASM project maintains key links to the on-going DPL series, the (restructured) Social Inclusion Project (SIP), and the on-going Functional Review of the MoLFSP. The DPL series supports the establishment of a credible medium-term expenditure framework that guides and tightens the link between the strategic planning processes of line ministries and prioritizes budget allocations within credible resource envelopes, thus providing the Government with a strong foundation to proceed with the social assistance reform. It also supports key reform actions, which the proposed operation would build on at the critical moment in which a deeper institutional and technical partnership for implementation support is needed. As discussed above and in Annex 2, the (restructured) Social Inclusion Project (SIP) provides complementary

28
technical assistance activities that were defined in tandem with preparation of the proposed SASM project. Finally, the incipient Functional Review of the MoLFSP is being designed to complement the areas supported by the proposed SASM project, with a likely focus on human resources, information technologies, and institutional/organizational capacities.
66. The proposed SASM project also draws on the experience of past projects in the social protection sector. The Implementation Completion Report for the Social Sector Development Project (IBRD 4616), which closed at the end of 2008, also provided pertinent lessons for the design of this project. Specifically, (i) more emphasis was needed on training and ensuring familiarity with new procedures; and (ii) inclusion of a public awareness component is essential to enhance awareness and understanding of policy or organizational changes that will affect significant portions of the population. The issue of institutional capacity was incorporated into the design of the proposed SASM project as a medium-term partnership focused on providing implementation support. The issue of public awareness and political economy of reforms is a central pillar of the program design and a key mitigation of potential risks around public support for the proposed reforms (see Annex 9 on political economy and communications and Annex 4 on ORAF).
IV. Implementation
A. Institutional and Implementation Arrangements
67. The MoLFSP would implement and coordinate implementation of the activities under the proposed Project. The MoLFSP is leading the design of the reforms and would also implement the results chains supported by the proposed Project. It has implemented previous World Bank projects and has been assessed by World Bank fiduciary specialists as having the capacity to manage the proposed Project. Project activities would be coordinated and implemented using MoLFSP structures and staff, specifically the General Directorate for Social Assistance (see Annex 3). It is not expected that parallel structures for implementation will be necessary. An advanced draft of the Project Operational Manual to detail functions and responsibilities of the Ministry of Public Finance, the MoLFSP, and municipalities would be presented by the Borrower for discussion at Negotiations.
68. Implementing Agency risks relate primarily to capacity to implement the Government reform program, as noted in the risk assessment in Section V and Annex 4 (ORAF). As part of the financial crisis response, the Government of Romania made deep, across-the-board cuts in public sector staffing and pay in 2010. This affects all Ministries, and all departments within them, regardless of the relative strengths or merits of each department. There is a high risk, therefore, that key departments and agencies in MoLFSP will lack the capacity to implement the program in a timely and effective manner. Cuts in the administrative budgets of these departments and agencies have required that much of the necessary technical assistance resources to support achievement of the DLIs would be financed from the on-going World Bank-financed Social Inclusion Project.
B. Results Monitoring and Evaluation
69. With a results-based approach, monitoring and evaluation (M&E) are central. Government M&E systems would be strengthened with the World Bank’s support during project implementation. Since disbursement relies on unequivocal evidence of achievement of results as measured by the DLIs, the MoLFSP and other institutions would monitor, verify, and report on achievement of results, with the requisite information for each DLI, in a timely and comprehensive manner. Monitoring and reporting would be scheduled semi-annually to provide a regular check-in on progress.

29
Arrangements for Monitoring of Selected Results of the Program:
70. The Proposed SASM Project would strengthen the Government’s monitoring of its social assistance system. Results area I supports the development of the Action Plan to carry out the Government’s approved Social Assistance Strategy, the use of administrative data for monitoring and, over the life of the Project, the routine use of performance information for operational and policy management. Results area IV expands the scope of the management information systems for social assistance programs to all large programs and introduces procedures to check and improve the quality of data. Annex 1 describes the Results Framework and Monitoring arrangements; Annex 2 describes the monitoring arrangements of the DLIs; and the Project Operational Manual provides the details on the rationale, definition, and procedures to verify achievement of the DLIs.
Arrangements for Evaluation of Selected Results of the Program
71. In addition to monitoring, evaluations will be carried out to measure the achievement of intermediate outcome indicators, relating to targeting accuracy and cost savings. Specifically:
For Targeting Accuracy: The National Institute of Statistics will conduct regular evaluations of improvements in targeting for programs aimed at low-income households. The World Bank team met the President of the National Institute of Statistics (NIS) and the management team supervising the household surveys to inquire whether the NIS could produce, with the cooperation of the MoLFSP, regular bulletins on the benefit incidence of social protection programs based on the Household Budget Survey. The World Bank team presented standardized software (ADePT) that can automatize the production of such a bulletin to the staff involved in the collection of household survey data. The initial assessment of NIS is that such bulletin can be produced, but would require technical assistance. The MoLFSP will sign a cooperation agreement with NIS for the development and regular production of the statistical bulletin. This activity would be supported by the on-going SIP.
For Cost Savings: An assessment of the cost savings triggered by the process of simplifying, harmonizing and implementing revised rules and procedures for social assistance benefits would be conducted. This assessment would include a process evaluation that would estimate beneficiary costs (time or other elements of opportunity costs, and money) associated with the eligibility and recertification processes; and the administrative costs incurred by the town halls’ social assistance departments, for the subset of four means- and income-tested programs (GMI, CFA, SPA, and Heating Benefits) and their successor programs, for a representative sample of front-line units and beneficiaries. This exercise would be carried out before and after each step of simplification and harmonization of rules and procedures. The financing for this process assessment and cost evaluation activity would be supported by the Romania SIP.
C. Sustainability
72. Sustainability of the Government’s Program of Social Assistance comprises three elements: political commitment; fiscal sustainability; and technical and institutional capacity.
Political Sustainability
73. At least three key factors play into the political sustainability of social assistance reforms in Romania and make the risk to sustainability high: (a) political will and commitment to sustaining reforms; (b) society perceptions of the social compact and the

30
perceived need or rationale for reforms; and (c) the degree to which such reforms create benefits for some while reducing or removing them from others as a result of redistribution of benefits – and the extent to which those “losing” from reforms would organize in effective protests.
74. Commitment to reform of the social assistance system comes from the highest level of Government. Reform of the social assistance system is a critical part of Romania’s crisis response program and much-needed fiscal austerity measures. The Government, from the President to the Ministerial levels and down through the ranks have made public their commitment to reform. Social assistance reforms are also emphasized for structural reasons, to improve the effectiveness, fairness and credibility of public spending.
75. In terms of the social compact, public perceptions do endorse the rationale for the reform of social benefits. Public opinion survey data17 show that Romanians value work and protection of the poor and vulnerable groups – but have real concerns about the existing system of social benefits. Romanians are quite concerned about the issue of poverty and the well-being of the poor and vulnerable groups. They also have a strong work ethic as a duty to society – and value labor force participation for both genders. These dual principles translate into an endorsement of the role of government in providing support for the poor, vulnerable groups, and working parents. Yet most Romanians have serious concerns about the existing system of social benefits due to views that they are (a) too costly (strain on the economy); (b) yield few impacts (on poverty, inequality and work-family balance); (c) entail many irregularities (fraudulent claims); and (d) provide inadequate coverage and benefits for the poor (those in “real need”). Linked to this, a relatively large share of Romanians call for lower taxes and social spending.
76. The implementation of the social assistance reforms will likely result in benefits for some while reducing them from others, as a result of redistribution and a reduction in spending. Those who would benefit substantially from the reform would be the low income households, i.e. the poorest 20 percent of the income distribution. The share of social assistance benefits that will go to them is expected to rise, from 37.7 percent in 2009 to at least 45 percent in 2013. Moreover, despite a projected reduction in overall social assistance spending, the generosity of social assistance for this group is expected to rise from 26 percent to 29 percent as a share of transfer income in total income of beneficiary families (see Annex 8). Among those expected to lose from the social assistance reform would be the upper and middle-class beneficiaries, fraudsters, and those who entered in the programs in the past under weak eligibility rules (see Annex 9 for more details). The degree to which the latter would protest depends on the extent of harm they perceive and the extent to which they would organize in effective protest. Some groups, such as the fraudsters or those who entered under weak eligibility rules may decline to protest the loss of benefits out of fear of further penalties or incrimination. Other groups, such as higher-income ex-beneficiaries may perceive relatively less harm, since the benefits represent a smaller share of their total incomes, and as such may not believe it is “worth it” to organize in protest.
77. To mitigate these risks and promote political sustainability of reforms, a multi-layered communications strategy would be implemented. A strategy to manage the implementation of reforms, with tailored and on-going communication, consultations and engagement, is planned to facilitate the sustainability and success of reforms (see Annex 9 for more details). Most of the difficult reforms were already made at the end of 2010 with no public protests. Communication is critical to generating broad support for reforms. The Government of
17 Public opinion data from the World Values Survey (WVS, international coverage, multiple years) and the European Social Surveys (ESS 2008), see Annex 9 for details.

31
Romania has actively been engaged in presenting the different priority areas of the Social Assistance reform measures to the public via TV, press etc but a communication strategy, deemed necessary for informing the public of the rationale and benefits of social assistance reforms, was designed to further increase the connection with key audiences and increase stakeholders’ levels of engagement and their commitment to sustained development and needed reform (see Annex 9 for more details). The “multi-layered” communication strategy to support the SASM project reforms in Romania will be based on the initial diagnostics on the “political economy” of the reforms, on the public perceptions analysis presented, and on the strategic communication analysis. Financing for this communication strategy would be provided by the (restructured) Social Inclusion Project (as discussed in Annex 2 and Annex 9).
Fiscal Sustainability:
78. The proposed Project would help contribute to fiscal sustainability of the Government’s social assistance system. The surge in social assistance spending from 1.4 percent of GDP in 2005 to 2.9 percent of GDP in 2010 has not contributed to better social outcomes. The proposed project will reduce this cost back to 2.1 percent of GDP by 2013, in line with the new EU countries. Specifically, cost savings will come from (a) parametric reforms to the social assistance system (changes in eligibility criteria, consolidation of benefits, etc.); (b) improved implementation (reduced fraud and errors); and (c) operational efficiency gains (administrative efficiency for agencies and beneficiaries).
Technical and Institutional Capacity:
79. Strengthening the Government’s social assistance system will require technical inputs. The results-chains supported by the proposed Project indicate key technical inputs needed to generate improved outputs and outcomes of the system (Figures 2a-d). Financing for these technical investments and activities will come from several sources (Annex 2): (a) approximately €6 million to be made available through the proposed restructuring of the on-going Social Inclusion Project (SIP); (b) the World Bank’s budget through the use of experts during preparation and supervision missions; and (c) expertise and resources as part of a proposed Functional Review of the MoLFSP.
80. However, beyond discrete technical inputs, sustained institutional capacity will also be needed in the form of human resources (critical staffing, training), maintenance and continued strengthening of management information systems. Such institutional capacity requires a minimum level of continued administrative costs. A covenant will be included in the Loan Agreement to ensure that critical staff are hired.
V. Key Risks and Mitigation Measures
81. Overall risks to the proposed Project are relatively high, as detailed in Annex 4 (ORAF) and Annex 9. During the design and implementation of the proposed reforms, there are risks that specific interest groups manage to block reforms that would bring important improvements in the social assistance system. During implementation, there are also risks that reform momentum weakens and may be reversed as more prosperous economic times allow the recreation of a complex and poorly-targeted social assistance system. As many of the risks cannot be mitigated within the proposed Project, a high level of residual risk is anticipated.
82. At the national level, the current austerity measures, generally, are triggering public protests and social unrest, which could create implementation difficulties (as discussed above under political sustainability and in Annex 9). Such actions could lead to a significant delay in the implementation of the Government’s reform program, affecting the likelihood of DLIs,

32
resulting in the PDO not being met. As mitigation, the Government would develop a communications strategy supported by the World Bank to help explain the rationale for the reforms, as discussed in more detail in Annex 9.
83. As another mitigation measure, the World Bank’s team held consultations with representatives of various political parties and their technical staff, explaining the lending instrument, the rationale of the program and presenting the main features of the intervention. Similar consultations were held with the technical staff of the presidency, as a natural continuation of the policy dialogue initiated with the Presidential Commission which developed a Social Protection Strategy in 2009. The initiation of these discussions was appreciated by all the counterparts as a good starting point for further consultations and the transparency of the dialogue contributed to the establishment of a dialogue based on mutual trust and professional consideration.
84. At the sector level, implementing agencies may not receive the human and administrative resources they need to implement the reform measures and achieve the DLIs, e.g., funds to finance the software and hardware needed to implement data matching or additional staff to bolster the Social Inspection. In mitigation, the social assistance reforms have been endorsed by the Government and should therefore be budgeted. Some of the required technical assistance would be financed through an on-going Social Inclusion Project, non-lending TA, and other sources.
85. Another key sectoral risk relates to the potential for fraud and error. All social assistance systems contain some degree of fraud and error and recent inspections undertaken by the Government of Romania appear to confirm that these are significant and have been increasing. In terms of mitigation, Results chain IV relates specifically to enhancing the controls and oversight of the system, thus the application of new control and oversight measures would be a key indicator of success.
86. At the project level, a key risk is that the social assistance reforms would be delayed or scaled back. While the Government’s has adopted the Social Assistance Reform Strategy, there could be pressures to delay, scale back or reverse the measures during implementation. To mitigate this risk, the team has worked with the authorities to design clear and simple DLIs that can be measured by the Government’s own systems.
87. There is an information risk. The results-based nature of the proposed Project would rely on timely and comprehensive documentation of outcomes or results as evidence of achievement of the DLIs. A potential risk is a lack of timely or sufficient information. In terms of mitigation of such risk the appropriate sources of information and reporting requirements for each DLI would be set out comprehensively in the Project Operational Manual.
VI. Appraisal Summary
A. Economic and Financial Analysis
88. The estimated economic and financial impacts of the proposed Project center on the expected overall outcomes generated by the strengthening of the Government’s social assistance system. Given that, the tools of traditional economic analysis (estimation of the internal and external rates of return of specific sub-projects) do not apply. Rather the analysis focuses on quantifying the expected impacts of strengthening the safety net system on poverty, targeting accuracy, coverage of the poor, generosity, fiscal savings, and labor market impacts. Some final outcomes, such as the dynamics of poverty and labor market impacts, will be strongly influenced by the state of the economy, over and above the changes in the

33
distribution of social assistance transfers. While the simulated results presented in this annex do not separate the impact of economic growth from the redistribution of social assistance funds, we do note that growth effects are likely to be small.
89. The implementation period of the proposed SASM project coincides with a forecast for weak recovery (2011) followed by predictions of moderate growth (2012-2013) (Table 8). Moreover, real wages are projected to reach only 96 percent of their 2009 value by the end of 2013. The weak increase in real wages reflects the need to contain the public wage bill, to correct the large pay increases uncorrelated with productivity which occurred in the pre-crisis period. As wages represent a high share of the household incomes, wage stagnation will strongly influence the dynamics of the overall household income or consumption. Hence, the impact of economic growth on reducing poverty is moderate for the period of implementation of the proposed project.
Table 8. Modest Growth Prospects: By 2013, Real Wages Are Expected to be Below Their 2009 Level Indices (compared to previous year, y.o.y.) 2009 2010 2011 2012 2013
GDP 0.981 1.015 1.044 1.042 CPI (annual average) 1.061 1.061 1.034 1.030 Nominal wage growth 1.020 1.014 1.050 1.060 Real wage growth 0.961 0.956 1.015 1.029
Source: IMF (2010, December), “Staff report for the Sixth Review under the Stand-By Arrangement”, mimeo
90. The reforms are expected to result in significant fiscal savings (Figure 1 and Annex 8). With the implementation of reforms under the Government’s Social Assistance Strategy and the proposed SASM project, the share of social assistance spending in GDP is projected to fall from 2.9 percent in 2010 to 2.1 percent by 2013, an average annual reduction of 0.8 percentage points over the project period. This will bring the social assistance spending in Romania closer to average spending levels in the new EU countries. Relative to its 2010 (baseline) level, the implementation of the Social Assistance Reform Strategy will reduce the relative annual cost of social assistance by 0.42 percentage points in 2011, 0.72 percentage points in 2012 and 0.78 percentage points by 2013. In 2011, the sources of fiscal savings are parametric reforms (0.16pp); reduction in the level of error, fraud and corruption (0.09pp); and the freeze of the benefit levels of most programs (0.17pp). By 2013, the largest reduction will accrue from keeping constant the nominal budget of most social assistance programs (0.62 percentage points of the total fiscal savings from the total of 0.78 percentage points).
91. The ultimate development objective of the Government’s Social Assistance Reform Program – and the supporting proposed SASM project -- is to protect the poor, while reducing the fiscal cost of the social assistance system. By 2013, the living standards of the households from the poorest quintile will improve compared to 2009, although economic growth will be modest and the overall cost of social assistance transfers will fall. The poverty headcount for the poorest 5, 10, 15 and 20 percent in 2009 will also fall, with impacts more pronounced for the poorest of the poor. A key driver for the reduction in poverty is the improvement in the equity of the social assistance spending, which is the immediate project development outcome of the Government’s Social Assistance Reform Program, supported by the proposed SASM project. Operationally, the improvement in equity (targeting accuracy) is measured by the increase in the share of social assistance funds reaching the poorest quintile of the population.

34
5 5 5
0
10 109
7
15 1614 13
20 2119 20
0
5
10
15
20
25
2009 2011 2012 2013
Pov
erty
Hea
dcou
nt, %
5th percentile in 2009 10th percentile in 2009
15th percentile in 2009 20th percentile in 2009
Figure 3. Reduction in absolute poverty headcount, for different ventiles at baseline (2009)
Source: Staff estimations based on HBS 2009
Overall targeting accuracy is expected to rise from a baseline of 37.7 percent in 2009 to at least 45 percent by the end of 2013.
92. The targeting performance of means-tested programs is on par with the best programs in the region (Figure A7.1) in 2009 and will improve with reforms (Annex 8). Over the life of the reform program, the poverty-reduction impact of means-tested programs will improve, especially after the implementation of the consolidated program for low-income households (Minimum Social Insertion Income program) through better targeting, coverage and generosity for the population from the poorest quintile. Targeting accuracy, the share of program funds that accrue to the poorest quintile, is expected to increase for these programs from an average of 64 percent in 2009 to over 80 percent in 2013. The coverage of the population from the poorest quintile with means-tested programs is expected to rise from about 45 percent in 2009 to almost 60 percent in 2013. And the generosity of the last-resort program (GMI in 2009, MSII in 2013), which measures the share of the GMI transfers in the total income of beneficiary families, will go up from 24 percent in 2009 to almost 30 percent in 2013.
93. The targeting accuracy and coverage of the overall social assistance system will also improve, but to a lesser extent (see Annex 8). By 2013, timely implementation of the reform program is expected to generate an increase in the targeting accuracy for the overall social assistance system from 37.7 percent in 2009 to at least 45 percent (estimated at 49 percent in the reform scenario modeled in Table A8.10). The coverage of the poorest quintile is projected to increase from 82 percent in 2009 to over 90 percent in 2013. And the generosity of social assistance programs for beneficiaries in the poorest quintile could grow from 26 percent to over 29 percent over the same period.
94. The estimated overall poverty impact of the proposed reforms is positive and significant (Figure A8.2 and Table A8.10). On average, the living standards of the households in the poorest quintile will improve, with proportionally stronger gains for the poorest of the poor. By 2013, almost all people in the poorest ventile18 in 2009 will earn more than 311 RON, the cut-off poverty line that separated this group from the rest of the population (Table A8.14). For this group, the poverty headcount is expected to fall from five percent in 2009 to 0.4 percent in 2013. Similarly, the poverty headcount for those in the poorest decile in 2009 is expected to fall to 6.8 percent in 2013. Poverty impacts are less strong for the poorest quintile, although they are positive and significant.
18 A ventile is a quantile equal with 5 percent of the population. The poorest ventile is the poorest 5 percent of the population.

35
95. The implementation of reforms for low-income households supported by the proposed SASM project, although not specifically focused on the Roma, would shift a greater share of social assistance benefits to those in the poorest quintile, which includes a disproportionate share of the Roma. The Roma, which are a priority development focus for the World Bank’s Europe and Central Asia Region, are expected to benefit from the reforms. The Roma, comprising approximately 2.8 percent19 of the total Romanian population, but concentrated among the poorest in Romania, would be among the main program beneficiaries. In 2009, 73 percent of Roma men, women, and children lived in households with per capita incomes that put them among the poorest quintile in Romania (see Annex 7). In addition, the proposed SASM project would help improve access to benefits by simplifying application procedures to facilitate greater access, which would be particularly important for the Roma population as international evidence suggests that complex application and verification procedures can represent an obstacle to Roma inclusion in social programs (see also Annex 7 for a discussion of outreach mechanisms in Roma communities). For these reasons, it is expected that the Roma would benefit from simplification of application procedures and improved targeting of social assistance, both in terms of raising welfare and reducing vulnerability. Furthermore, the on-going Romania Social Inclusion Project (SIP) largely focused on supporting direct investments in Roma communities, and is being restructured to provide funding to many of the technical assistance activities associated with the proposed Project. Finally, improving the efficiency and effectiveness of Romania’s social assistance system would allow the Government to use these resources for complementary investments in Romania and would be expected to contribute to fiscal stability, which is beneficial for the population as a whole.
96. The overall program is expected to have positive labor market impact (as discussed in Annex 8). Romania has a large number of work-able adults on social assistance that are not in employment, education, training or disabled, estimated at about 1.8 million (22 percent of the working age beneficiaries). The planned social assistance measures aim to provide stronger work incentives for some adults in this pool by: (i) reducing the marginal tax rate on earnings for the Child Raising Benefit from 85 percent to 75 percent; (ii) reducing the duration of the CRB to one year for high income earners, and increasing the back-to-work bonus from RON100 to RON500; (iii) eliminating the “false” disabled who could work but were living on benefits; (iii) introducing stronger work- and activation-requirements in the GMI program, which will be maintained, fine-tuned and possibly expanded in the Minimum Social Insertion Income program.
B. Technical
97. The technical preparation of the proposed Project builds on various diagnostics and technical reviews of Romania’s social assistance system, including: (a) an on-going dialogue and diagnostics under the DPL series; (b) programmatic AAA on poverty and social policy monitoring; and (c) extensive comparable regional stock-taking and performance benchmarking of social assistance systems in ECA20. Technical preparation and implementation would also benefit from the on-going Functional Review of the MoLFSP and associated agencies, as well as the technical assistance activities identified for the proposed restructuring of the SIP. Finally, the preparation of the proposed Project benefitted from inputs from members of the World Bank’s
19 Estimation of World Bank staff based on Household Budget Survey 2009. 20 ECA Regional Social Protection Database, which analyzes detailed data on public spending on social protection plus key performance indicators using standardized software (SP ADePT) applied to household survey data of all countries in the region. For Romania, these household surveys included the HBS 2000-2009, which helped both with diagnostics and with determination of baseline indicators for performance monitoring.

36
Global Expert Team (GET) on Social Safety Nets and from participants in a Quality Enhancement Review.
C. Financial Management
98. Operationally, and from a financial management and disbursement perspective, the partnership between Romania and the World Bank to strengthen the performance of Romania’s social assistance system is defined around two key aspects of the Government Program. First, the partnership around the results-framework, whereby World Bank funding would be disbursed against verified evidence of achievement of “results” (defined as Disbursement-Linked Indicators). Second, for disbursement purposes, the pooled Eligible Expenditure Program (EEP) would initially comprise four programs within the overall social assistance system with strongest internal control mechanisms. As discussed above and in Annexes 2 and 3, the four programs that comprise the pooled EEP were selected as the ones for which the internal control, accounting, and reporting arrangements are the strongest, in order to mitigate the fraud and corruption risks. In addition to the fiduciary assurance functions, the World Bank would assist the MoLFSP and NASB to increase capacity in the financial management areas, particularly to improve the internal audit functions towards a risk-based approach and a longer term internal audit work planning, and increase capacity of the Social Inspection, with the overall goal to increase accountability and reduce fraud and corruption risks.
99. The payments under the EEP are subject to a complex and complementary system of oversight and controls21, that will be further improved during the life of the proposed SASM project (see Results’ Area IV).
The Court of Accounts (CoA), carries out annual financial and performance audits on the State Budget execution, including for programs within the pooled EEP; the CoA will ensure that the annual financial statements audit would be done not later than twelve (12) months after the end of the audited calendar year, starting with the audit of 2011,in a reliable manner, and that a separate audit opinion would be issued for each of the social assistance programs included in the EEP.
Payments’ compliance for the programs in the EEP are subject to desk reviews by the NASB and the results of such reviews will be reported to the World Bank on a quarterly basis.
Furthermore, the compliance with eligibility criteria will be verified by the Social Inspection through its system of ad-hoc (case-by-case) and thematic inspections. The Social Inspection is required to investigate all cases that have been referred to it by the general public, or from the staff and apply remedies, a system called ad-hoc inspections. In addition, the Social Inspection undertakes large sample inspections at the request of the MoLFSP, a system called thematic inspections. When noncompliance with eligibility criteria is detected, the Social
21 It is important to note, as emphasized elsewhere, that no cash transfer program is immune to errors, fraud or corruption, and the goal is to develop systems to deter, detect and remedy these irregularities. Irregularities could result in under- and overpayments and these can be further classified into error, fraud and corruption. Overpayments occur when a beneficiary receives a larger benefit that the amount he or she is entitled to, according to the rules of the program; this includes instances where a beneficiary should not receive any benefit. Underpayments occur when a beneficiary or applicant receives a smaller benefit that the amount he or she is entitled to, according to the rules of the program; this includes instances where an application was wrongfully denied by program staff. Error refers to unintentional mistakes of the benefit claimants or staff in the benefit office that result in under- and overpayments. Fraud refers to intentional behavior on the part of the benefit applicant to defraud the benefit system. Corruption refers to intentional behavior on the part of the program staff or management to appropriate benefits for personal gain. See van Stolk and Tesliuc, “Toolkit on Tackling Error, Fraud and Corruption in Social Protection Programs”, Social Protection Discussion Paper 1002, March 2010, World Bank.

37
Inspection can apply a range of remedies and/or sanctions as provided in the legislation: verbal notice; suspension or cease of payments; and administrative fines. When a serious infringement is detected, the Social Inspection refers the case to the Police or other investigative bodies. Over time, both the investigative powers of the Social Inspection and the sanction regime will improve (see Results area IV). A summary of the FM/Oversight and Control Mechanisms is presented in Table 3.2 in Annex 3.
D. Procurement
100. The proposed Project would not include any procurement of goods, works, or consultancy services.
E. Social (including safeguards)
101. The activities supported by the proposed Project do not trigger any of the World Bank’s social safeguards. The proposed SASM project aims to strengthen the Government’s social assistance system so that it would be more equitable and efficient, both in terms of administrative efficiency and accuracy. Under Results Area II, the proposed Project supports improved targeting of social assistance resources towards the poorest quintile by reducing the share of social assistance spending that reaches the upper and middle classes through amendments to the eligibility thresholds of some programs, elimination of others and harmonization of income-tests around that of the Guaranteed Minimum Income (GMI) program. Likewise, under Results Area IV, the proposed Project aims to directly ensure that more resources are channeled to the poor by tightening oversight and controls, and instilling regular inspections so that ineligible claimants are no longer allowed to claim benefits that were intended for the poor. In Results Area III, the proposed Project supports the reduction in transaction costs for potential beneficiaries of the social assistance system (thus reducing one potential barrier to their ability to benefit from the system), while reducing administrative costs, which could allow more resources to be channeled into the benefit programs. A simulation of the results of the implementation of the proposed Project on poverty, targeting accuracy, fiscal costs and labor market participation is presented in Annex 8. A description of those who would benefit or those who would incur a loss due to these reforms is presented in Annex 9.
F. Environment (including safeguards)
102. The activities supported by the proposed Project are not likely to have significant effects on Romania’s environment or natural resources. The measures contemplated under the loan relate to improving the Government’s social assistance system and are not expected to have any significant links to the environment, nor trigger any of the World Bank’s environmental safeguards. Moreover, Romania has adequate environmental controls in place. Romania’s environmental legislation and regulation is reinforced by EU environmental directives, including the EU’s guidelines on adoption of environmental assessments at the planning and programming level (June 2001) and the EU’s Environmental Liabilities Directive setting out liability for damage to properties and natural resources (April 2007).

38
Annex 1: Results Framework and Monitoring
PDO Level Results Indicators
Core Unit of
Measure Baseline, 2010
Cumulative Target Values
Frequency Data Source/ Methodology
Responsibility for Data Collection
Description 2011 2012 End Target (2013)
Results Area: Strengthened Performance Management – Project Development Indicator A (see Figure 2a):
Performance Management M&E system is operating within expectations
Yes/No No No No Yes Annual NASB Reports NASB
There is a systematic procedure to support management decisions using the M&E system
Yes/No No No No Yes Annual MoLFSP Reports MoLFSP
Results Area: Improved Equity – Project Development Indicator B (see figure 2b)
Increased share of social assistance funds going to the first poorest quintile.
Percent 37.7 (2009) na
na
45.0 (DLI 7)
Annual Household Budget Survey
National Institute for Statistics
Results Area: Improved Administrative Efficiency* – Project Development Indicator C (see Figure 2c)
Administrative costs and client participation costs for means‐tested programs are reduced by 15% from baseline value.
US$
na ‐ Baseline value Reduction by 15%
(DLI 12) Two survey waves: One at baseline and the 2
nd at
the end of Project
Cost evaluation MoLFSP
Result Area: Reduced Error and Fraud ‐‐ Project Development Indicator D (see Figure 2d) Programs for low‐income households, disability benefits and family policy exist and have improved:

39
PDO Level Results Indicators
Core Unit of
Measure Baseline, 2010
Cumulative Target Values
Frequency Data Source/ Methodology
Responsibility for Data Collection
Description 2011 2012 End Target (2013)
NASB Reports NASB Strengthened information systems
Yes/No No No Yes Yes Annual
Oversight and control procedures (including detection of fraud and error using risk‐based investigation, data matching, data quality audits and consolidated beneficiary registries)
Text Oversight and control of social assistance programs is absent or minimal
At least one thematic inspection campaigns is carried out for each of the following programs: GMI, disability, family allowance, heating, and child‐raising benefits (DLI 13)
Sanctions policy framework, investigative powers and the referrals system for the Social Inspection are revised and in place (DLI 17)
Risk‐based investigation to detect error and fraud is used by the Social Inspection for programs for low‐income households, child‐raising and disability benefits (DLI 19)
Annual Social Inspection Annual Reports of selected programs, and Risk‐based Analysis Control Reports of selected programs
General Directorate for Social Inspection
Indicator E: Number of beneficiaries reached by Governent Social Assistance Program: State Child Allowance Child Raising Benefit Family Allowances GMI Heating Benefits Indemnity for Disabled Adults Complementary Budget for Disabled Adults
Number
Of which women: State Child Allowance Child Raising Benefit Family Allowances GMI Heating Benefits Indemnity for Disabled Adults Complementary Budget for Disabled Adults
Number

40
INTERMEDIATE RESULTS
Intermediate Indicators Core
Unit of Measure
Baseline, 2010 Cumulative Target Values
Frequency Data Source/ Methodology
Responsibility for Data Collection
Description 2011 2012 2013
A. Strengthened Performance Management
A management information systems focused on performance management is operating (number of reports)
Number 0 3Comment: Three monthly monitoring reports of 4 major programs (Family Allowance, Child Raising Benefits, GMI and State Child Allowance) are produced by NASB (DLI 2)
3
3Comment: Three monthly performance management reports for programs for low‐income households are produced by NASB and used at the management level in the MoLFSP and NASB (DLI 3)
Annual SAFIR monitoring and performance management reports
NASB and MoLFSP
The indicator will report on the number of reports produced on the programs each quarter.
B. Improved Equity
Percentage of the family allowance beneficiaries are paid, through NASB, for two consecutive months according to harmonized means‐testing procedures and lower eligibility threshold
Percent 0 90(DLI 4)
90 ‐ Monthly (2011 and 2012)
SAFIR payment monitoring report
NASB At least 90%
Percentage of Child Raising Benefits beneficiaries entering the program since January 1
st
2011 are paid, trough NASB, for two consecutive months, using a lower replacement income of 75%
Percent 0 90(DLI 5)
90 90 Monthly SAFIR payment monitoring report
NASB At least 90%
Percentage of beneficiaries of the new consolidated program for low‐income households are paid through NASB for two consecutive months
Percent 0 0 0 90 (DLI 6)
Monthly (2013)
SAFIR payment monitoring report
NASB At least 90%
C. Improved Administrative Efficiency

41
Enacted harmonized means testing procedures for the GMI, family allowance, and heating benefits are disseminated
Text The identification of the needy is inconsistent across programs for low‐income households program
Enacted harmonized means testing procedures for the GMI, family allowance, and heating benefits are disseminated (DLI 8)
Once (2011) Official Gazette MoLFSP Qualitative
Percentage of the new applications for programs for low‐income households and family policy programs in the preceding two months comply with one‐application and one‐point of service operational guidelines
Percent 0 0
0 90(DLI 11)
Annual (2011‐2012) and monthly (2013)
Sample review of application records
MoLFSP At least 90%At the baseline, different application forms and procedures for different programs are in place.
Percentage of individuals who are certified for disability benefits according to the new harmonized disability system are paid through NASB
Percent 0
0 0
90(DLI 10)
Annual (2011‐2012) and monthly (2013)
SAFIR payment monitoring records
General Directorate for Disabled Persons and NASB
At least 90%; At the baseline, there are parallel disability certification schemes for pensions and for social assistance benefits
Enacted harmonized disability medical assessment criteria are disseminated
Yes/No No No Yes (DLI 9)
‐‐
D. Reduced Error and Fraud
Strengthened mechanisms to detect error and fraud, through data matching and data quality analysis are in place
Text Data matching to detect error and fraud is not performed
Remedial action plan is adopted by NASB to address the recommendations of: (i) an independent evaluation of the completeness and accuracy of the Integrated Information System for Administration of Social Benefits (SAFIR) information; and (ii) a feasibility study of SAFIR data
Three monthly lists of irregularities detected by NASB via data matching between SAFIR and the databases managed by Pension House, and NEA are sent to Social Inspection for verification and proposing remedial actions (DLI 18)
Three monthly lists of irregularities detected by NASB via data matching between SAFIR and the tax and civil registry databases are sent to Social Inspection for verification and proposing remedial actions (DLI 20)
Annual Data exchange protocols, Irregularity reports and Remedial Action Plan
NASB and MoLFSP

42
crosscheck with other databases (DLI 14)
At least 90% of GMI beneficiaries are paid through NASB for two consecutive months
Percent 0 90(DLI 15)
90
‐ Monthly (2011 and 2012)
SAFIR payment monitoring report
NASB
A central registry with a national database of disabled persons is in place
Text Disability benefits information is scattered across different management information systems
A central registry with a national database of disabled persons is in place (DLI 16)
A central registry with a national database of disabled persons is in place
A central registry with a national database of disabled persons is in place
Annual Disability national database and monitoring report
General Directorate for Disabled Persons
* An assessment of the cost savings triggered by the process of unifying the means-tested programs would be carried out in 2 waves, before and after the adoption of this measure – baseline tentatively for 2012 and after 2013.

43
Annex 2: Detailed Project Description
ROMANIA: SOCIAL ASSISTANCE SYSTEM MODERNIZATION PROJECT
1. The proposed Project Development Objective is to improve the overall performance of Romania’s social assistance system by strengthening performance management, improving equity, improving administrative efficiency and reducing error and fraud. The proposed Project would focus on the Government’s programs for low-income households, the disabled, and families with children.
2. With a results-based approach, project disbursements are linked to eligible expenditures and the verified achievement of results. Specifically, under the proposed SASM project, project disbursements would be (a) linked to defined eligible expenditure line items (jointly comprising the “Eligible Expenditure Program” or EEP) within the Government’s Program (social assistance system); and (b) triggered by the verified achievement of agreed specific results (“Disbursement-Linked Indicators” or DLIs) for improving the performance of that Program (the Romanian Government’s social assistance system).
3. Under the proposed SASM project, the World Bank would reimburse a portion of the Government’s expenditures on its Program (the social assistance system). Within the overall Government Program of Social Assistance, specific programs would be qualified for World Bank reimbursement if they meet an established set of criteria for inclusion in the pooled “Eligible Expenditure Program” (EEP). These criteria focus on safeguarding entry into the pooled EEP to those programs with robust fiduciary arrangements and are described in more detail in Annex 3. By this set of criteria, four programs qualify for World Bank reimbursement in the pooled “Eligible Expenditure Program” (EEP) at the start of the proposed Project,22 including (a) two family policy benefits: the State Child Allowance and the Indemnity for Child Raising; and (b) two targeted programs for low-income households ( (i) the newly consolidated and redesigned “Family Allowance Program” (which consolidated the Complementary Family Allowance and the Single Parent Allowance as of January 2011); and (ii) the Guaranteed Minimum Income Program (GMI). These four programs have suitable internal controls, are managed by the single payment agency (NASB), and are subject to regular oversight and controls by the Social Inspection, thus meeting the fiduciary criteria for inclusion into the pooled EEP, for reimbursement by the World Bank. Importantly, these programs are also all progressive in their distributional incidence, with a higher share of benefits going to the poorest quintile than their share in the population, as discussed in Section 1 and Annex 7. They also play an important role in protecting the well-being of poor families, collectively contributing to 20.2 percent of total consumption of households in the poorest quintile. Collectively, Government spending on these four programs accounted for about 70 percent of total spending on the eight main social assistance programs (defined as the Government’s Social Assistance Program for the purposes of this operation, as discussed above), and 43 percent of total outlays on all social assistance programs. The proposed SASM project would contribute a small share of the Government’s spending on the pooled EEP: 16 percent in 2011, 6 percent in 2012, and 10 percent in 2013 (as shown in Table 7 of the main text).
22 As discussed in Annex 3 and in the main text of the PAD, other programs could be qualified for inclusion in the pooled EEP, once they meet the criteria.

44
4. Disbursements would be triggered by the verified achievement of agreed specific results for improving the performance of the Government’s Program (the social assistance system, as defined above). The MoLFSP and the World Bank have defined a set of 20 “Disbursement Linked Indicators” (DLIs) that consist of key results that contribute to the achievement of the PDO. These DLIs include are described in detail in relation to the results chains in Results Areas I-IV and in matrix format in Table A2.1 below, and include: (a) 18 output indicators, marking improvements in the administration, functioning and implementation of the social assistance system; and (b) two intermediate outcome indicators (shown in bold in Table A2.1), measuring improved performance and impacts of the social assistance system (the Government’s Program, as defined above). Each of these results chains contributes to the achievement of the Project Development Indicators (PDIs), which are labeled with capital letters from A to D in the matrix Table A2.1 below. The protocols for verifying achievement of the DLIs are described in detail below.
5. Some technical assistance (TA) investments are needed for the achievement of these result areas. While technical investments and other inputs would be needed to support implementation and achievement of the DLIs, the Government of Romania has indicated that it does not wish to borrow for technical assistance in the proposed SASM project. Financing for these technical investments and activities would come from several sources outside the proposed project: (a) approximately €6 million to be made available through the proposed restructuring of the on-going SIP; (b) the Government’s own budget resources23; (c) the World Bank’s budget through the use of experts during preparation and supervision missions; (d) new non-lending AAA activities; (e) expertise and resources as part of a proposed Functional Review of the MoLFSP; (f) EU structural funds; and (g) others.
23 The incremental costs for capacity building expenditures in MOLFSP and its implementing agencies and the administrative costs of implementing these programs by local governments could be offset within the overall budget for social assistance spending in two ways: (a) by eliminating ineffective programs, consolidating duplicate programs aimed at the same target groups and providing similar “treatments”, scaling down overly-generous programs, or flattening regressive benefit schedules; (b) by
consolidating some of the administrative functions and institutions under the MoLFLSP.
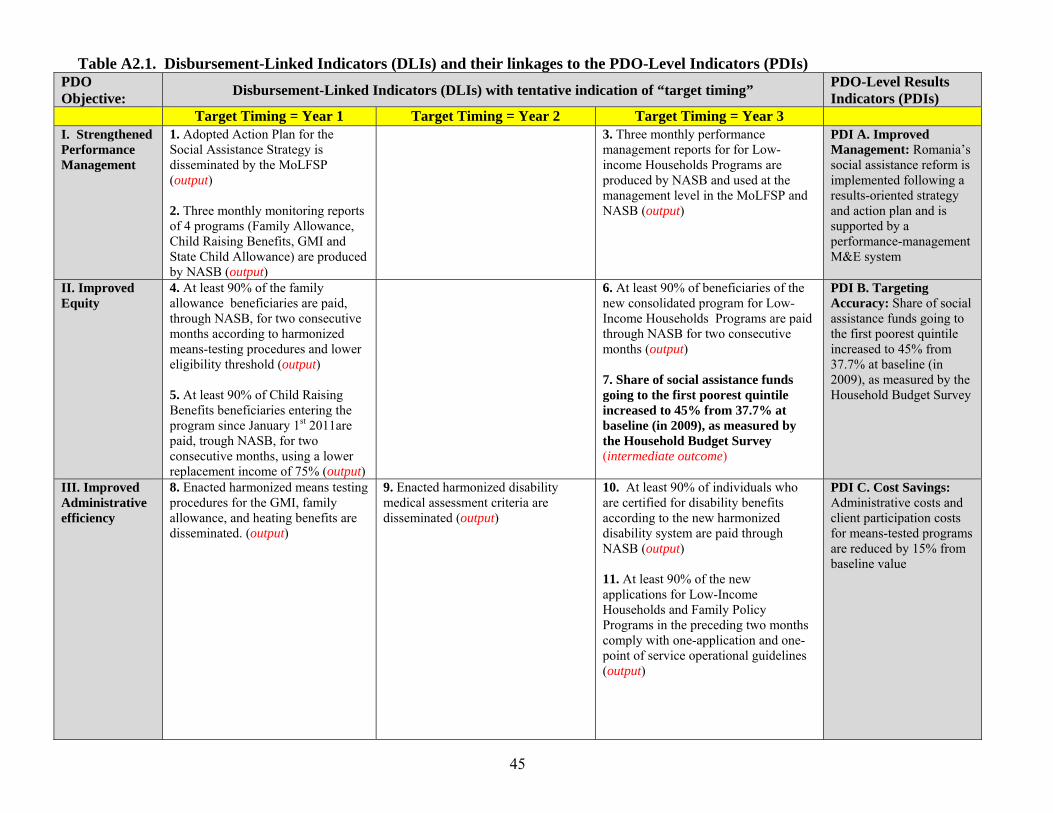
45
Table A2.1. Disbursement-Linked Indicators (DLIs) and their linkages to the PDO-Level Indicators (PDIs) PDO Objective: Disbursement-Linked Indicators (DLIs) with tentative indication of “target timing” PDO-Level Results
Indicators (PDIs) Target Timing = Year 1 Target Timing = Year 2 Target Timing = Year 3 I. Strengthened Performance Management
1. Adopted Action Plan for the Social Assistance Strategy is disseminated by the MoLFSP (output) 2. Three monthly monitoring reports of 4 programs (Family Allowance, Child Raising Benefits, GMI and State Child Allowance) are produced by NASB (output)
3. Three monthly performance management reports for for Low-income Households Programs are produced by NASB and used at the management level in the MoLFSP and NASB (output)
PDI A. Improved Management: Romania’s social assistance reform is implemented following a results-oriented strategy and action plan and is supported by a performance-management M&E system
II. Improved Equity
4. At least 90% of the family allowance beneficiaries are paid, through NASB, for two consecutive months according to harmonized means-testing procedures and lower eligibility threshold (output) 5. At least 90% of Child Raising Benefits beneficiaries entering the program since January 1st 2011are paid, trough NASB, for two consecutive months, using a lower replacement income of 75% (output)
6. At least 90% of beneficiaries of the new consolidated program for Low-Income Households Programs are paid through NASB for two consecutive months (output) 7. Share of social assistance funds going to the first poorest quintile increased to 45% from 37.7% at baseline (in 2009), as measured by the Household Budget Survey (intermediate outcome)
PDI B. Targeting Accuracy: Share of social assistance funds going to the first poorest quintile increased to 45% from 37.7% at baseline (in 2009), as measured by the Household Budget Survey
III. Improved Administrative efficiency
8. Enacted harmonized means testing procedures for the GMI, family allowance, and heating benefits are disseminated. (output)
9. Enacted harmonized disability medical assessment criteria are disseminated (output)
10. At least 90% of individuals who are certified for disability benefits according to the new harmonized disability system are paid through NASB (output) 11. At least 90% of the new applications for Low-Income Households and Family Policy Programs in the preceding two months comply with one-application and one-point of service operational guidelines (output)
PDI C. Cost Savings: Administrative costs and client participation costs for means-tested programs are reduced by 15% from baseline value
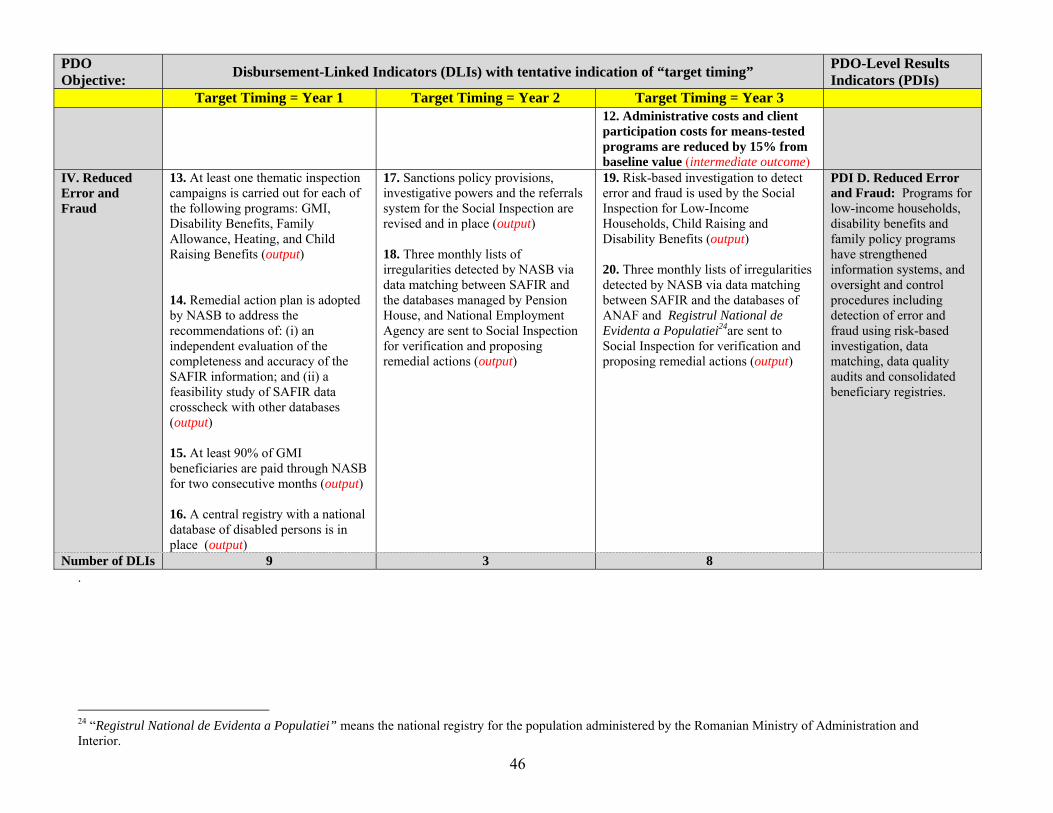
46
PDO Objective: Disbursement-Linked Indicators (DLIs) with tentative indication of “target timing” PDO-Level Results
Indicators (PDIs) Target Timing = Year 1 Target Timing = Year 2 Target Timing = Year 3
12. Administrative costs and client participation costs for means-tested programs are reduced by 15% from baseline value (intermediate outcome)
IV. Reduced Error and Fraud
13. At least one thematic inspection campaigns is carried out for each of the following programs: GMI, Disability Benefits, Family Allowance, Heating, and Child Raising Benefits (output) 14. Remedial action plan is adopted by NASB to address the recommendations of: (i) an independent evaluation of the completeness and accuracy of the SAFIR information; and (ii) a feasibility study of SAFIR data crosscheck with other databases (output) 15. At least 90% of GMI beneficiaries are paid through NASB for two consecutive months (output) 16. A central registry with a national database of disabled persons is in place (output)
17. Sanctions policy provisions, investigative powers and the referrals system for the Social Inspection are revised and in place (output) 18. Three monthly lists of irregularities detected by NASB via data matching between SAFIR and the databases managed by Pension House, and National Employment Agency are sent to Social Inspection for verification and proposing remedial actions (output)
19. Risk-based investigation to detect error and fraud is used by the Social Inspection for Low-Income Households, Child Raising and Disability Benefits (output) 20. Three monthly lists of irregularities detected by NASB via data matching between SAFIR and the databases of ANAF and Registrul National de Evidenta a Populatiei24are sent to Social Inspection for verification and proposing remedial actions (output)
PDI D. Reduced Error and Fraud: Programs for low-income households, disability benefits and family policy programs have strengthened information systems, and oversight and control procedures including detection of error and fraud using risk-based investigation, data matching, data quality audits and consolidated beneficiary registries.
Number of DLIs 9 3 8 .
24 “Registrul National de Evidenta a Populatiei” means the national registry for the population administered by the Romanian Ministry of Administration and Interior.

47
Results Areas (Project Description and Protocols for Monitoring)
6. Verifying compliance with the DLIs. The remainder of this annex lays out some of the basic definitions, and the concept of “protocols” for monitoring progress and verifying achievement of the DLIs. These protocols are further defined in the Project Operational Manual, which will be finalized and approved by the Borrower before effectiveness of the proposed Project.
7. Result Area 1: Strengthened Performance Management. This results area aims strengthen the management of Romania’s social assistance system such that implementation is guided by the Government’s results-oriented strategy and action plan, and is supported by a performance management M&E system. This result area would also ensure that the social assistance management information systems, as well as other elements of the social assistance M&E system, would provide improved, timely and relevant information for policy and operations decisions. Over the life of the loan, the quality of the monitoring information would improve, and would be increasingly used in the decision making process at both central and county levels.
Table A2.2a: Draft Protocols for Monitoring Achievement of DLIs of Results Area I – Strengthening Performance Management
# Disbursement-linked Indicator (DLI)
Definition of the DLI Draft Protocol to Evaluate Compliance of the DLI
1
Adopted Action Plan for the Social Assistance Strategy is disseminated by the MoLFSP (action)
This DLI will be met when the GoR, through the MoLFSP, has disseminated the Action Plan for the Social Assistance Strategy by posting the Ministerial Order on the MoLFSP website. The Action Plan should include, inter alia: (a) the objective and scope of the Action Plan (programs covered); (b) key activities, at least those required to comply with the list of DLIs for years 1-3 agreed with the Bank; (c) timetable; (d) responsible institutions; (e) required budget and human resources where applicable; (f) legal implications; (g) indicators to monitor progress; and (h) monitoring and evaluation procedures.
Data source: Official Gazette and MoLFSP website Procedures: A copy of the Ministerial Order published in the Official Gazette is sent to the World Bank
2
Three monthly monitoring reports of 4 programs (Family Allowance, Child Raising Benefits, GMI and State Child Allowance) are produced by NASB (output)
This DLI will be met when NASB has produced three monthly monitoring reports, through the SAFIR. At a minimum, the reports should include information on volume of spending and number of beneficiaries for the Family Allowance, Child Raising Benefits, GMI and State Child Allowance. The information should be disaggregated at the county (judet) and local level.
Data Sources: County level monitoring reports available on the MoLFSP website. Local level monitoring reports provided to the World Bank but are not made public. Procedures: Monthly monitoring reports are sent to the Bank upon completion of the DLI target

48
# Disbursement-linked Indicator (DLI)
Definition of the DLI Draft Protocol to Evaluate Compliance of the DLI
3
Three monthly performance management reports for programs for Low-income households are produced by NASB and used at the management level in the MoLFSP and NASB (output)
This DLI will be met when:(i) NASB produces three monthly performance management reports, including an expanded list of indicators (input, output, efficiency and process); (ii) There is an established feedback procedure to incorporate the results of the performance management reports into the decision-making process at the MoLFSP and NASB. The procedure should include the feedback mechanism, responsible units and timeframe, and be adopted through a Ministerial Order; and (iii) The feedback procedure is applied by decision-makers at MoLFSP, as well as by NASB management.
Data Sources: (i) Performance management reports, available on the MoLFSP website; (ii) Official Gazette; (iii) Minutes of performance management review meetings. Procedures: Monthly performance management reports; a copy of the Ministerial Order published in the Official Gazette; and minutes of performance management meetings are sent to the World Bank
Note: The protocols would be finalized in the Project Operational Manual
8. This result area would be complemented by technical assistance inputs, co-financed through other sources (attached Table A2.2b). Specifically, the restructuring of the Romania SIP would support technical assistance inputs for the development of the strategy and action plan, as well as technical investments in the Government’s management information systems to expand the “decision-maker module” of the software. Additional technical assistance activities to promote active use of the operational and policy-making reports for performance management would also be undertaken with direct financing from the Government budget.
Table A2.2b: Complementary Technical Assistance (TA) Inputs for Results Area I – Strengthening Performance Management (Tentative listing and financing plan)
Planned TA for Results Area 1 Financing Source Amount (Euro)
Support for the development of the action plan of the social assistance strategy
SIP 10,000
Support for development of a performance management system
SIP 50,000
Expand SAFIR decision-maker rules to generate regular performance management reports
SIP 15,000
9. Result Area 2: Improved Equity. This result area supports a set of actions and outputs that would increase the share of social assistance funds going to the first poorest quintile to at least 45 percent compared to the baseline (37.7 percent in 2009). This result area would be achieved by (i) reducing the scope of regressive programs or eliminating them altogheter; (ii) reducing the (very high) eligibility tresholds of the CFA and SPA, in their succesor program the Family Allowance; (iii) improving the progresivity of the benefit formula of the Family Benefit program; (v) using the most accurate means-testing procedures across all programs for low income households; and (iv) merging all programs for low-income households into a single, consolidated program.

49
Table A2.3a: Draft Protocols for Monitoring Achievement of DLIs of Results Area II – Improved Equity
# Disbursement-linked Indicator (DLI)
Definition of the DLI Draft Protocol to Evaluate Compliance of the DLI
4
At least 90% of the family allowance beneficiaries are paid, through NASB, for two consecutive months according to harmonized means-testing procedures and lower eligibility threshold (output)
This DLI will be met when at least 90% of the family allowance beneficiaries are paid, through NASB, for two consecutive months according to the following: (i) Using the same means-testing procedure as the GMI (ii) Applying a lower eligibility threshold compared to the Complementary Family Benefits and the Single Parent Benefit. NASB should generate a monthly payment report at the national and county level, specifying at a minimum the following information: (i) the number of eligible families approved by town halls; (ii) the number of rejected payments by County Agencies of Social Benefits; (iii) the number of beneficiaries with pending payments; and (iv) a synthetic table with the number of beneficiaries paid, total benefits spending; and maximum and minimum monthly household net income for each subgroup of beneficiaries (benefit level). The formula to calculate the DLI is:
Data sources: Family allowance payment monitoring report Procedures: Payment monitoring reports are sent to the World Bank upon completion of the DLI target
Number of applicants approved by NASB that have been paid in month X ______________ Number of applications approved by NASB in month X
X 100
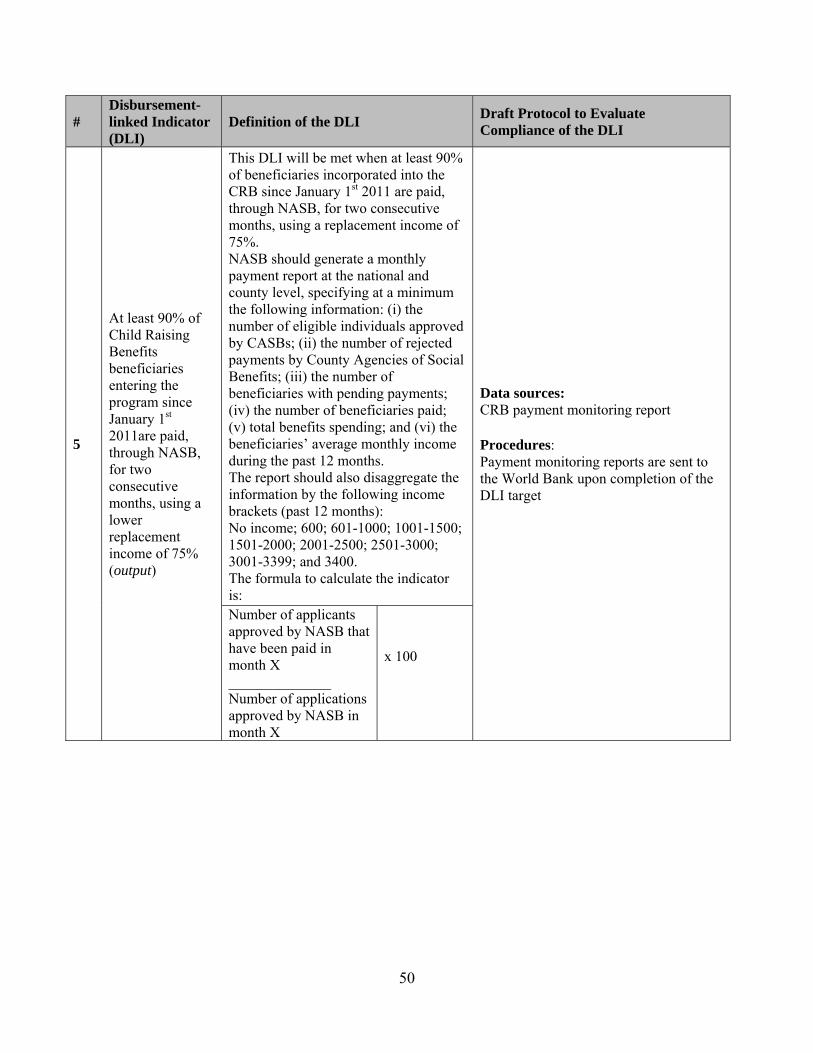
50
# Disbursement-linked Indicator (DLI)
Definition of the DLI Draft Protocol to Evaluate Compliance of the DLI
5
At least 90% of Child Raising Benefits beneficiaries entering the program since January 1st 2011are paid, through NASB, for two consecutive months, using a lower replacement income of 75% (output)
This DLI will be met when at least 90% of beneficiaries incorporated into the CRB since January 1st 2011 are paid, through NASB, for two consecutive months, using a replacement income of 75%. NASB should generate a monthly payment report at the national and county level, specifying at a minimum the following information: (i) the number of eligible individuals approved by CASBs; (ii) the number of rejected payments by County Agencies of Social Benefits; (iii) the number of beneficiaries with pending payments; (iv) the number of beneficiaries paid; (v) total benefits spending; and (vi) the beneficiaries’ average monthly income during the past 12 months. The report should also disaggregate the information by the following income brackets (past 12 months): No income; 600; 601-1000; 1001-1500; 1501-2000; 2001-2500; 2501-3000; 3001-3399; and 3400. The formula to calculate the indicator is:
Data sources: CRB payment monitoring report Procedures: Payment monitoring reports are sent to the World Bank upon completion of the DLI target
Number of applicants approved by NASB that have been paid in month X ______________ Number of applications approved by NASB in month X
x 100

51
# Disbursement-linked Indicator (DLI)
Definition of the DLI Draft Protocol to Evaluate Compliance of the DLI
6
At least 90% of beneficiaries of the new consolidated program for Low-income households are paid through NASB for two consecutive months (output)
This DLI will be met when at least 90% of beneficiaries of the new consolidated program for low-income households are paid through NASB for two consecutive months. NASB should generate a monthly payment report at the national and county level, specifying at a minimum the following information: (i) the number of eligible households approved by town halls; (ii) the number of rejected payments by County Agencies of Social Benefits; (iii) the number of beneficiaries with pending payments; (iv) the number of beneficiaries paid; and (v) total benefits spending. The formula to calculate the indicator is:
Data Sources: Payment monitoring reports Procedures: Payment monitoring reports are sent to the World Bank upon completion of the DLI target
Number of applicants approved by the NASB that have been paid in month X ______________ Number of applications approved by the NASB in month X
x 100
7
Share of social assistance funds going to the first poorest quintile increased to 45% from 37.7% at baseline (in 2009), as measured by the Household Budget Survey (HBS) (intermediate outcome)
This DLI will be met when the share of social assistance funds going to the poorest quintile, as measured by the HBS, increases to 45 % from 37.7% at baseline (2009). The list of social assistance programs is that included into the HBS questionnaire in 2009, with all subsequent modifications.
Data Sources: Household Budget Survey data available to the World Bank. NSI bulletin available on the MoLFSP website. Procedures: A copy of the NSI bulletin and the HBS database are sent to the World Bank
Note: The protocols would be finalized in the Project Operational Manual
10. This results area would be complemented by technical assistance inputs, co-financed through other sources (attached Table A2.3b). Specifically, the restructuring of the Romania SIP would support technical assistance inputs for public information campaigns to inform the population on the rationale, cost and benefits of the proposed reduction of the duration of the

52
child-raising benefit; the reintroduction of income-testing for disability benefits; and the consolidation of all income- or means-tested programs into a single program for low-income households. The SIP would also support technical assistance inputs for the development of a regular statistical bulletin to track the targeting accuracy of the largest social assistance programs. Additional activities to train the social assistance staff in the implementation of the consolidated program for low-income households would be undertaken with direct financing from the Government budget. Table A2.3b: Complementary Technical Assistance (TA) Inputs for Results Area II – Improved Equity (Tentative listing and financing plan)
Planned TA for Results Area 2 Financing Source Amount (Euro)
Development of a statistical bulletin to track the distributional impact of social protection spending
SIP 15,000
Upgrade SAFIR with new rules for GMI, Family Support benefits, Child Raising Benefits and the consolidated program for Low-Income Households*
SIP 3,560,000
*) This TA activity is an input for both Improved Equity (II) and Reduce Error and Fraud (IV) result’ chains.
11. Result area 3: Improved Administrative Efficiency. This result area would reduce the administrative cost of the social assistance system and the cost of applying and recertifying for social assistance benefits, by (i) harmonization of means-testing procedures for income-tested programs; (ii) harmonization of the disability assessment criteria and institutional framework with that of invalidity pension; (iii) consolidation of all income- and means-tested programs into a single program for low-income households; and (iv) the use of a single application for the consolidated program for low-income households and for family policy benefits.
Table A2.4a: Draft Protocols for Monitoring Achievement of DLIs of Results Area III – Improved Administrative Efficiency
# Disbursement-linked Indicator (DLI)
Definition of the DLI Draft Protocol to Evaluate Compliance of the DLI
8
Enacted harmonized means testing procedures for the GMI, family allowance, and heating benefits disseminated. (output)
This DLI will be met when the legislation and implementation regulations for the GMI, family allowance and heating benefits are disseminated including the same procedure to assess the income and means of beneficiaries, including the same: List of assets whose ownership
makes applicants ineligible for the program;
List of disregarded assets;
Data source: Official Gazette and MoLFSP website Procedures: A copy of legislation and regulations published in the Official Gazette are sent to the World Bank

53
# Disbursement-linked Indicator (DLI)
Definition of the DLI Draft Protocol to Evaluate Compliance of the DLI
List of incomes to be taken into account, the same documentary evidence and recall period;
Social enquiry form (home visit or “ancheta sociala”)
List of incomes disregards (not taken into account in the administrative definition of eligible income)
Formula for imputed incomes, if applicable
Recertification requirements
9
Enacted harmonized disability medical assessment criteria disseminated (output)
This DLI will be met when the certification for disability benefits and disability pensions is disseminated showing that it is done using a harmonized medical disability assessment criteria including at a minimum the following: the medical assessment criteria used
to assess the eligibility for disability pension and disability benefits is the same;
operational procedures and decision making flow in the disability benefit assessment are the same as those used by the system of disability pension, particularly with regards to the medical assessment of impairment/ disability; and
Data Sources: Official Gazette and MoLFSP website Procedures: A copy of legislation and regulations published in the Official Gazette are sent to the World Bank
10
At least 90% of individuals who are certified for disability benefits according to the new harmonized disability system are paid through NASB (output)
This DLI will be met when at least 90% of individuals who are certified according to the new harmonized disability system are paid through NASB for at least one month. NASB should generate a monthly payment report at the national and county level, specifying at a minimum the following information: (i) the number of beneficiaries with pending payments; (ii) the number of beneficiaries paid; and (iii) total benefits spending. The formula to calculate the
indicator is:
Data Sources: Disability benefits payment monitoring report generated by NASB Procedures: Payment monitoring reports are sent to the World Bank upon completion of the DLI target

54
# Disbursement-linked Indicator (DLI)
Definition of the DLI Draft Protocol to Evaluate Compliance of the DLI
Number of applicants approved by the disability certification institution that have been paid in month X ______________ Number of applications approved by the disability certification institution in month X
X 100
11
At least 90% of the new applications for programs for Low-income households and family policy programs in the preceding two months comply with one-application and one-point of service operational guidelines (output)
This DLI will be met when a random sample review of application records for programs for low income households and family policy programs show that at least 90% of the new applications in the preceding two months have complied with one-application and one point of service operational guidelines.
Data Sources: Sample review report of application records, including methodological note Procedures: Report on findings is sent to the World Bank
12
Administrative costs and client participation costs for means-tested programs are reduced by 15% from baseline value (intermediate outcome)
This DLI will be met when administrative costs and client participation costs resulting from the reform are measured through a rigorous evaluation and show a reduction of at least 15%.
Data Sources: Cost evaluation report and minutes of discussion meeting Procedures: Send a copy of cost evaluation report, database, and minutes of discussion meeting to the World Bank upon completion of the DLI target
Note: The protocols would be finalized in the Project Operational Manual
12. This results area would require complementary technical assistance (attached Table A2.4b). Specifically, the additional funds would be used to design harmonized and integrated procedures for the different programs, prepare legislation to support the change, and modify the supporting IT system of NASB, the payment/registry agency for a majority of social assistance programs. Staff in town halls and county agencies would need training on the new system. Technical assistance would be required to design harmonized assessment criteria to assess the
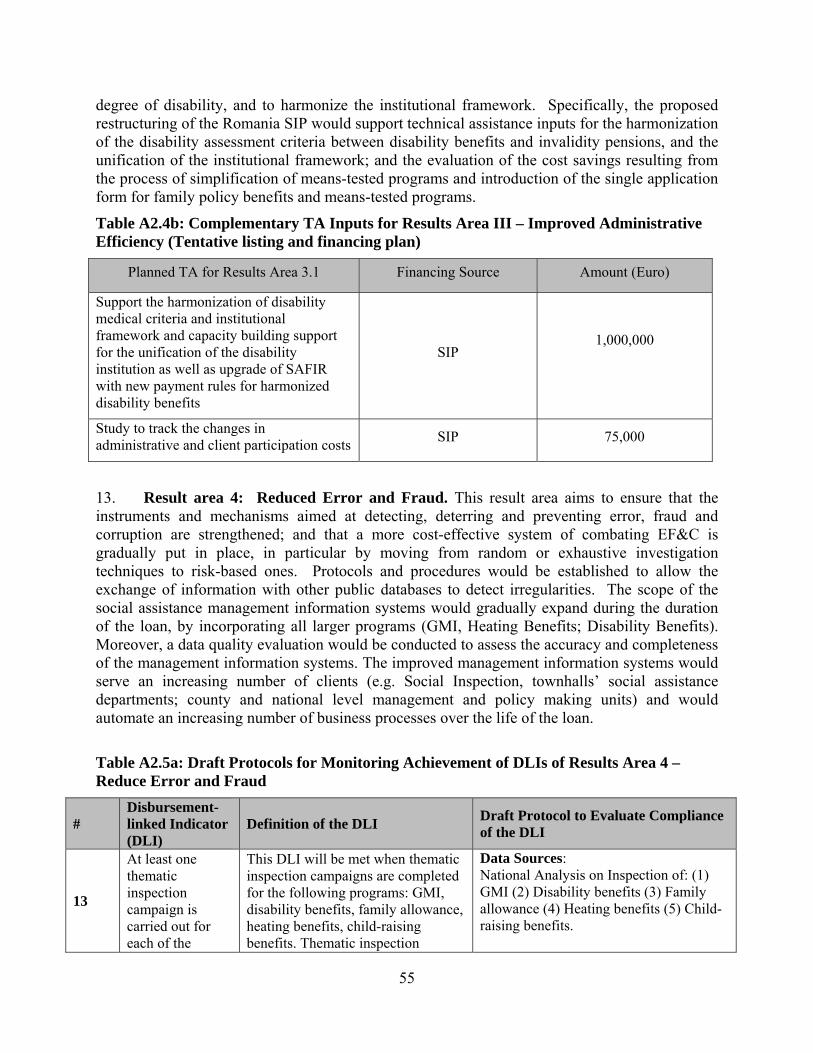
55
degree of disability, and to harmonize the institutional framework. Specifically, the proposed restructuring of the Romania SIP would support technical assistance inputs for the harmonization of the disability assessment criteria between disability benefits and invalidity pensions, and the unification of the institutional framework; and the evaluation of the cost savings resulting from the process of simplification of means-tested programs and introduction of the single application form for family policy benefits and means-tested programs.
Table A2.4b: Complementary TA Inputs for Results Area III – Improved Administrative Efficiency (Tentative listing and financing plan)
Planned TA for Results Area 3.1 Financing Source Amount (Euro)
Support the harmonization of disability medical criteria and institutional framework and capacity building support for the unification of the disability institution as well as upgrade of SAFIR with new payment rules for harmonized disability benefits
SIP 1,000,000
Study to track the changes in administrative and client participation costs
SIP 75,000
13. Result area 4: Reduced Error and Fraud. This result area aims to ensure that the instruments and mechanisms aimed at detecting, deterring and preventing error, fraud and corruption are strengthened; and that a more cost-effective system of combating EF&C is gradually put in place, in particular by moving from random or exhaustive investigation techniques to risk-based ones. Protocols and procedures would be established to allow the exchange of information with other public databases to detect irregularities. The scope of the social assistance management information systems would gradually expand during the duration of the loan, by incorporating all larger programs (GMI, Heating Benefits; Disability Benefits). Moreover, a data quality evaluation would be conducted to assess the accuracy and completeness of the management information systems. The improved management information systems would serve an increasing number of clients (e.g. Social Inspection, townhalls’ social assistance departments; county and national level management and policy making units) and would automate an increasing number of business processes over the life of the loan.
Table A2.5a: Draft Protocols for Monitoring Achievement of DLIs of Results Area 4 – Reduce Error and Fraud
# Disbursement-linked Indicator (DLI)
Definition of the DLI Draft Protocol to Evaluate Compliance of the DLI
13
At least one thematic inspection campaign is carried out for each of the
This DLI will be met when thematic inspection campaigns are completed for the following programs: GMI, disability benefits, family allowance, heating benefits, child-raising benefits. Thematic inspection
Data Sources:National Analysis on Inspection of: (1) GMI (2) Disability benefits (3) Family allowance (4) Heating benefits (5) Child-raising benefits.
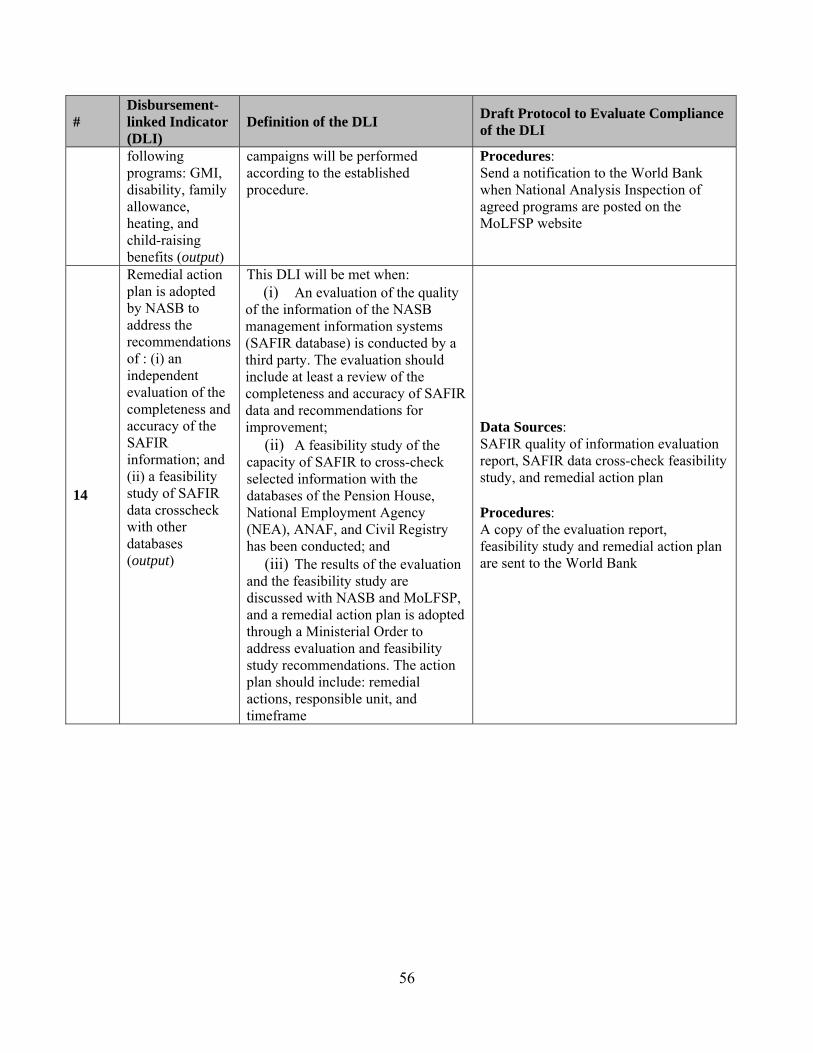
56
# Disbursement-linked Indicator (DLI)
Definition of the DLI Draft Protocol to Evaluate Compliance of the DLI
following programs: GMI, disability, family allowance, heating, and child-raising benefits (output)
campaigns will be performed according to the established procedure.
Procedures: Send a notification to the World Bank when National Analysis Inspection of agreed programs are posted on the MoLFSP website
14
Remedial action plan is adopted by NASB to address the recommendations of : (i) an independent evaluation of the completeness and accuracy of the SAFIR information; and (ii) a feasibility study of SAFIR data crosscheck with other databases (output)
This DLI will be met when:(i) An evaluation of the quality
of the information of the NASB management information systems (SAFIR database) is conducted by a third party. The evaluation should include at least a review of the completeness and accuracy of SAFIR data and recommendations for improvement;
(ii) A feasibility study of the capacity of SAFIR to cross-check selected information with the databases of the Pension House, National Employment Agency (NEA), ANAF, and Civil Registry has been conducted; and
(iii) The results of the evaluation and the feasibility study are discussed with NASB and MoLFSP, and a remedial action plan is adopted through a Ministerial Order to address evaluation and feasibility study recommendations. The action plan should include: remedial actions, responsible unit, and timeframe
Data Sources: SAFIR quality of information evaluation report, SAFIR data cross-check feasibility study, and remedial action plan Procedures: A copy of the evaluation report, feasibility study and remedial action plan are sent to the World Bank
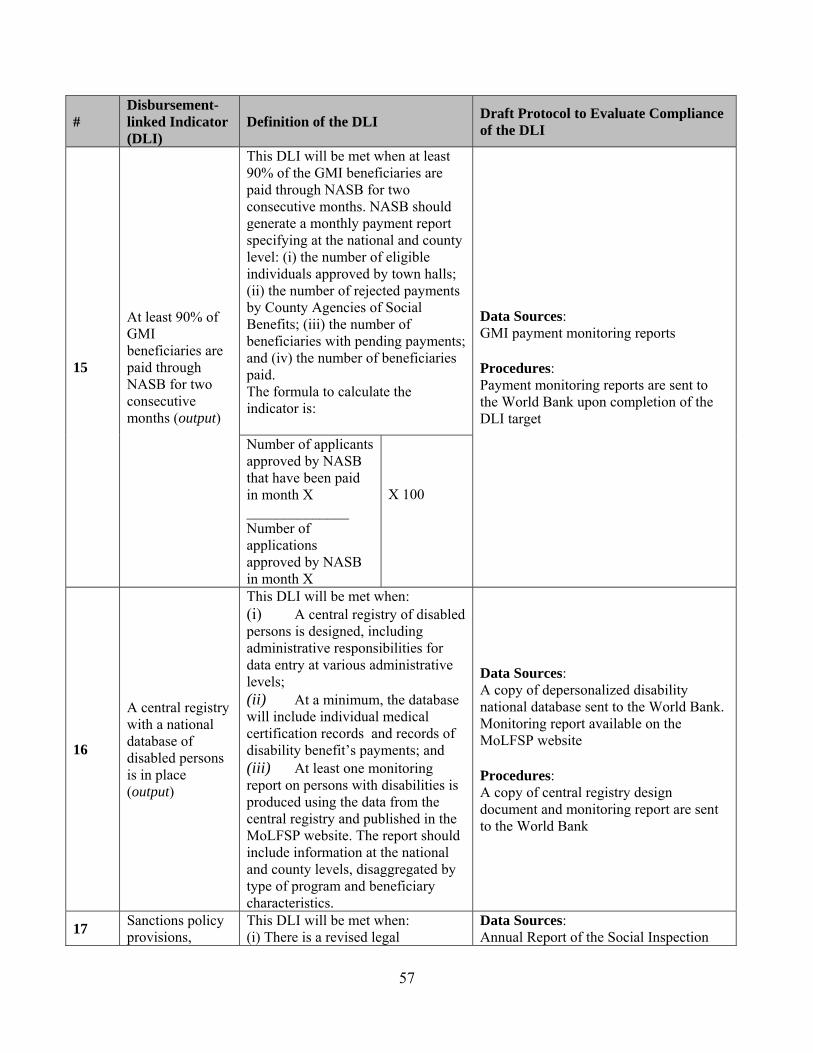
57
# Disbursement-linked Indicator (DLI)
Definition of the DLI Draft Protocol to Evaluate Compliance of the DLI
15
At least 90% of GMI beneficiaries are paid through NASB for two consecutive months (output)
This DLI will be met when at least 90% of the GMI beneficiaries are paid through NASB for two consecutive months. NASB should generate a monthly payment report specifying at the national and county level: (i) the number of eligible individuals approved by town halls; (ii) the number of rejected payments by County Agencies of Social Benefits; (iii) the number of beneficiaries with pending payments; and (iv) the number of beneficiaries paid. The formula to calculate the indicator is:
Data Sources: GMI payment monitoring reports Procedures: Payment monitoring reports are sent to the World Bank upon completion of the DLI target
Number of applicants approved by NASB that have been paid in month X ______________ Number of applications approved by NASB in month X
X 100
16
A central registry with a national database of disabled persons is in place (output)
This DLI will be met when:(i) A central registry of disabled persons is designed, including administrative responsibilities for data entry at various administrative levels; (ii) At a minimum, the database will include individual medical certification records and records of disability benefit’s payments; and (iii) At least one monitoring report on persons with disabilities is produced using the data from the central registry and published in the MoLFSP website. The report should include information at the national and county levels, disaggregated by type of program and beneficiary characteristics.
Data Sources: A copy of depersonalized disability national database sent to the World Bank. Monitoring report available on the MoLFSP website Procedures: A copy of central registry design document and monitoring report are sent to the World Bank
17 Sanctions policy provisions,
This DLI will be met when: (i) There is a revised legal
Data Sources:Annual Report of the Social Inspection

58
# Disbursement-linked Indicator (DLI)
Definition of the DLI Draft Protocol to Evaluate Compliance of the DLI
investigative powers and the referrals system for the Social Inspection are revised and in place (output)
framework in place that regulates a uniform set of sanctions for the following social assistance programs: state child allowance; GMI, disability, family, child-raising and heating benefits; (ii) A Special Statute of the Social Inspection modifying its role and attributions in order to grant new investigative powers is adopted; (iii) Methodological Guidelines that describe a referral system for cases of error, fraud and corruption, with clear reporting channels for staff and the general public are approved through a ministerial Order; and (iv) The Annual Report of the Social Inspection includes sections on the number of sanction applied using the new sanction policy; and the output of the new referral system (number of referrals by channel)
posted on the MoLFSP website Procedures: A copy of the sanction policy provisions, Special Statute, Methodological Guidance and Annual Report are sent to the World Bank
18
Three monthly lists of irregularities detected by NASB via data matching between SAFIR and the databases managed by Pension House, and National Employment Agency are sent to Social Inspection for verification and proposing remedial actions (output)
This DLI will be met when: (i) Operational guidelines are prepared on the detection of irregularities through data matching / cross-checking information of NASB with the Pension House and NEA; (ii) Operational guidelines are prepared for the uses of referrals from staff, public and data-matching; (iii) Three monthly lists of irregularities detected by NASB via data matching have been produced, and are submitted to Social Inspection for verification and proposing remedial actions. The list of irregularities will also be sent to town halls for remedial actions.
Data Sources: Operational guidelines; monthly irregularities report; and bi-annual monitoring report of the status of proposals to correct irregularities Procedures: A copy of irregularity reports; operational guidelines for the detection of irregularities through data matching; and monitoring report of the status of proposals to correct irregularities are sent to the World Bank upon completion of the DLI target
19
Risk-based investigation to detect error and fraud is used by the Social Inspection for programs for
This DLI will be met when: (i) Social Inspection performs a risk analysis for the classification of beneficiaries and service units into classes of risks of fraud; (ii) Procedural guidelines for the
Data Sources: Risk-based Analysis Control Report for selected programs and MoLFSP website Procedures: Send a notification to the World Bank

59
# Disbursement-linked Indicator (DLI)
Definition of the DLI Draft Protocol to Evaluate Compliance of the DLI
Low-income households, child-raising and disability benefits (output)
classification of beneficiaries and service units into classes of risks of fraud are adopted by the MoLFSP through a ministerial Order; and (iii) Social Inspection conducts at least one round of risk-based inspections for the following programs: programs for low income households; child-raising benefits and disability benefits
when risk-based analysis control reports of selected programs are posted on the MoLFSP website
20
Three monthly lists of irregularities detected by NASB via data matching between SAFIR and the databases of ANAF and Registrul National de Evidenta a Populatiei25 are sent to Social Inspection for verification and proposing remedial actions (output)
This DLI will be met when: (i) Operational guidelines are prepared on the detection of irregularities through data matching / cross-checking information of NASB with the Pension House, NEA, National Agency for Fiscal Administration (ANAF) and Civil Registry; (ii) Operational guidelines are prepared for the uses of referrals from staff, public and data-matching; (iii) Three monthly lists of irregularities detected by NASB via data matching have been produced; and are submitted to Social Inspection for verification and proposing remedial actions. The list of irregularities will also be sent to town halls for remedial actions.
Data Sources: Operational guidelines; monthly irregularities report; and bi-annual monitoring report of the status of proposals to correct irregularities Procedures: A copy of irregularity reports; operational guidelines for the detection of irregularities through data matching; and monitoring report of the status of proposals to correct irregularities are sent to the World Bank upon completion of the DLI target
Note: The protocols would be finalized in the Project Operational Manual
14. This results area would require complementary technical assistance (attached Table A2.5b). There are specific needs to introduce international experience of error and fraud reduction programs, develop sanctions policy implementation procedures, bolster and train the Social Inspection and provide for data-matching provisions between various Government databases, including those relating to tax, property registration, and other social protection programs. Staff in county agencies and the Social Inspection would need training on the new social inspection techniques, referrals system and sanctions policy. Data exchange protocols would be needed across several departments and agencies to facilitate data-matching while ensuring the confidentiality of such information. Specifically, the proposed restructuring of the Romania SIP would support technical assistance inputs for the development of the data matching program.
25 “Registrul National de Evidenta a Populatiei” means the national registry for the population administered by the Romanian Ministry of Administration and Interior.

60
Table A2.5b: Complementary TA Inputs for Results Area IV – Reduce Error and Fraud (Tentative listing and financing plan)
Planned TA for Results Area 3.2 Financing Source Amount (Euro)
Evaluation of the accuracy and completeness of the information held in SAFIR; asses the capacity of SAFIR to cross-check information with other public databases; support for the development of the cross-checking needs/requirements
SIP 80,000
Develop a data matching program for the databases operated by NASB, Pension House, NEA, Civil Registry and ANAF
EU Structural funds 1,400,000
Support to develop a national database for disability benefit beneficiaries*
SIP 350,000
Legal TA for the development of a new sanction policy and investigative powers for Social Inspections
SIP 15,000
Support for the development of risk-based inspections (client profiling)
SIP 50,000
Upgrade SAFIR with new rules for GMI, Family Support benefits, Child Raising Benefits and the consolidated program for Low-Income Households**
SIP 3,560,000
*) Financing for this activity is already included in the non-restructured components of the Social Inclusion Project. **) This TA activity is an input for both Improved Equity (II) and Reduce Error and Fraud (IV) result’ chains. 15. A number of additional technical assistance needs span across all results areas, and are listed in Table A2.6 below. These include financing of a communication strategy (see Annex 9 for the rationale and content of the communication activities); of studies and analyses to support the implementation strategy (for example, to calibrate and/or pilot the consolidated program for low-income households); as well as capacity building for the staff of MoLFSP, including on-the-job training abroad in areas where the expertise is not found locally (for example, on performance monitoring and management, and on risk-based inspections).
Table A2.6: Complementary TA Inputs that span across Results’ Areas (Tentative listing and financing plan)
Planned TA for Results Area 3.2 Financing source Amount (Euro)
Communication strategy SIP 500,000
Studies/ analyses to support the implementation of the Social Assistance Reform Strategy
SIP 100,000
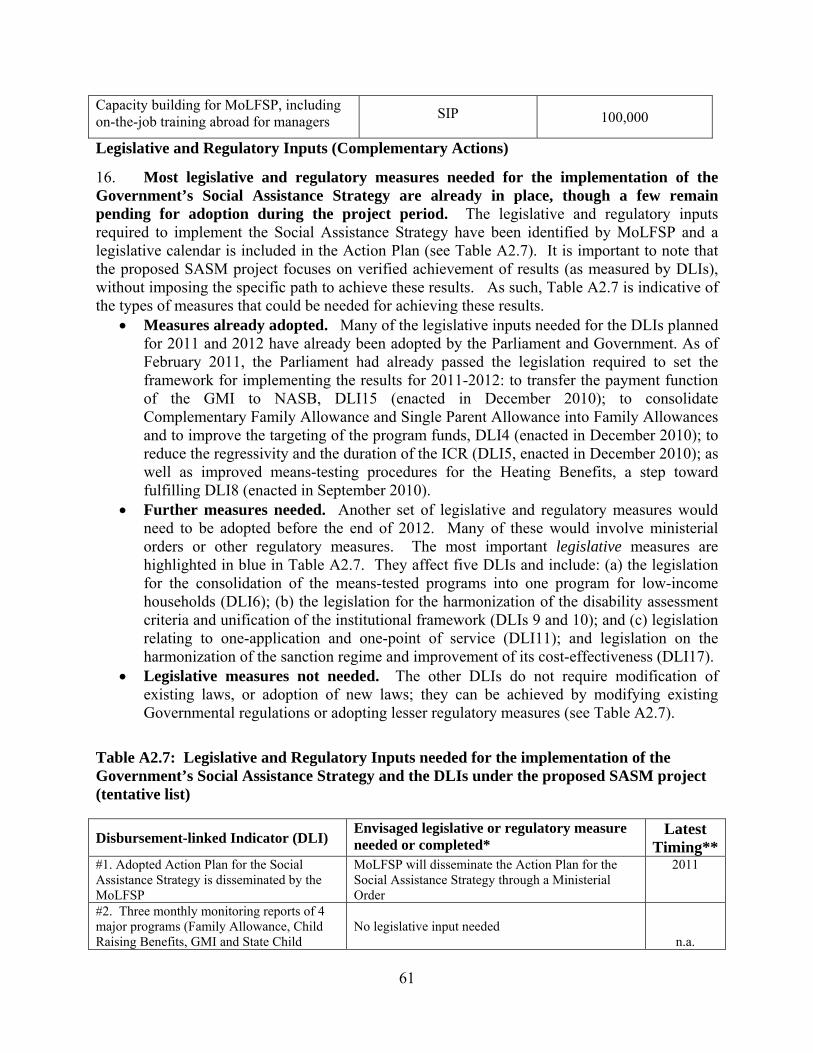
61
Capacity building for MoLFSP, including on-the-job training abroad for managers
SIP 100,000
Legislative and Regulatory Inputs (Complementary Actions)
16. Most legislative and regulatory measures needed for the implementation of the Government’s Social Assistance Strategy are already in place, though a few remain pending for adoption during the project period. The legislative and regulatory inputs required to implement the Social Assistance Strategy have been identified by MoLFSP and a legislative calendar is included in the Action Plan (see Table A2.7). It is important to note that the proposed SASM project focuses on verified achievement of results (as measured by DLIs), without imposing the specific path to achieve these results. As such, Table A2.7 is indicative of the types of measures that could be needed for achieving these results.
Measures already adopted. Many of the legislative inputs needed for the DLIs planned for 2011 and 2012 have already been adopted by the Parliament and Government. As of February 2011, the Parliament had already passed the legislation required to set the framework for implementing the results for 2011-2012: to transfer the payment function of the GMI to NASB, DLI15 (enacted in December 2010); to consolidate Complementary Family Allowance and Single Parent Allowance into Family Allowances and to improve the targeting of the program funds, DLI4 (enacted in December 2010); to reduce the regressivity and the duration of the ICR (DLI5, enacted in December 2010); as well as improved means-testing procedures for the Heating Benefits, a step toward fulfilling DLI8 (enacted in September 2010).
Further measures needed. Another set of legislative and regulatory measures would need to be adopted before the end of 2012. Many of these would involve ministerial orders or other regulatory measures. The most important legislative measures are highlighted in blue in Table A2.7. They affect five DLIs and include: (a) the legislation for the consolidation of the means-tested programs into one program for low-income households (DLI6); (b) the legislation for the harmonization of the disability assessment criteria and unification of the institutional framework (DLIs 9 and 10); and (c) legislation relating to one-application and one-point of service (DLI11); and legislation on the harmonization of the sanction regime and improvement of its cost-effectiveness (DLI17).
Legislative measures not needed. The other DLIs do not require modification of existing laws, or adoption of new laws; they can be achieved by modifying existing Governmental regulations or adopting lesser regulatory measures (see Table A2.7).
Table A2.7: Legislative and Regulatory Inputs needed for the implementation of the Government’s Social Assistance Strategy and the DLIs under the proposed SASM project (tentative list)
Disbursement-linked Indicator (DLI) Envisaged legislative or regulatory measure needed or completed*
Latest Timing**
#1. Adopted Action Plan for the Social Assistance Strategy is disseminated by the MoLFSP
MoLFSP will disseminate the Action Plan for the Social Assistance Strategy through a Ministerial Order
2011
#2. Three monthly monitoring reports of 4 major programs (Family Allowance, Child Raising Benefits, GMI and State Child
No legislative input needed
n.a.

62
Allowance) are produced by the NASB #3. Three monthly performance-management reports for programs for low-income households are produced by NASB and used at the management level in the NASB (output)
A systematic feedback procedure to incorporate the results of the Performance management reports into the decision-making will be adopted through a Ministerial Order
By 2013
#4. At least 90% of the family allowance beneficiaries are paid, through NASB, for two consecutive months according to harmonized means-testing procedures and lower eligibility threshold
*Legislation already adopted: Law 277/ December 2010, with modifications via Emergency Ordinance 2/January 2010; Governmental Regulation 38/ January 2011 on Implementation Procedures
Done.
#5. At least 90% of Child Raising Benefits beneficiaries entering the program since January 1st 2011 are paid through the NASB for two consecutive months, using a lower replacement income of 75%
Legislation adopted: Emergency Ordinance 111/ December 2010
Done.
#6. At least 90% of beneficiaries of the new consolidated program for low-income households are paid through the NASB for two consecutive months
Legislation needed. Slated for adoption before the end of 2012
Before end 2012
#7. Share of social assistance funds going to the first poorest quintile increased to 45% from 37.7 % at baseline (in 2009) , as measured by the Household Budget Survey (HBS)
No legislative input needed
n.a.
#8. Enacted harmonized means testing procedures for the GMI, family allowance, and heating benefits are disseminated
Legislation or Regulation and implementation regulations needed for harmonized means testing procedures. The legislation has been issued already for GMI and Family Allowance.
By 2011
#9. Enacted harmonized disability medical assessment criteria are disseminated
Legislation needed to harmonize medical disability for disability assessment
By 2012
#10. At least 90% of individuals who are certified for disability benefits according to the new harmonized disability system are paid through the NASB
Legislation to unify the institutional structure for disability assessment
By 2013
#11. At least 90% of the new applications for programs for low-income households and family policy programs in the preceding two months have complied with one-application and one-point of service operational guidelines
New legislative input needed.
n.a.
#12. Administrative costs and client participation costs for means-tested programs were reduced by 15% from baseline value
No legislative input needed
n.a.
#13. At least one thematic inspection campaigns is carried out for each of the following programs: GMI, disability, family allowance, heating, and child-raising benefits
No legislative input needed
n.a.
#14. Remedial action plan is adopted by NASB to address the recommendations of: (i) an independent evaluation of the completeness and accuracy of the SAFIR information; and (ii) a feasibility study of SAFIR data crosscheck with other databases
Ministerial Order needed to establish a remedial action plan to address evaluation and feasibility study recommendations.
In 2011

63
*Note: the legislation supported by the DPO is marked with an asterix *. **Note: “Latest Timing” in this table refers to the tentative calendar for legislative/regulatory measures (by which such reforms needed for implementation of the Strategy and achievement of the DLIs). Human Resource Needs for Implementing the Government’s Social Assistance Strategy
17. Implementation of the Social Assistance Strategy and achievement of the DLIs will require core skills and human resources. As part of the austerity package implemented in the second half of 2010, the staff of MoLFSP and its subordinated agency have been reduced by about 25 percent and their wages was also reduced by 25 percent. For 2011, the Ministry’s network operates under a staff hiring freeze. These budgetary and Human Resource constraints notwithstanding, the management of MoLFSP is well aware that the implementation of the Social Assistance Strategy would require more skills and human resources in certain areas. The Ministry has requested the assistance of the World Bank, through the Functional Review, to assess the staffing needs in four key units that are critical for the implementation of the Government’s Social Assistance Strategy: the General Directorate for Social Assistance; the
26 “Registrul National de Evidenta a Populatiei” means the national registry for the population administered by the Romanian Ministry of Public Administration and Interior.
#15. At least 90% of GMI beneficiaries are paid through the NASB for two consecutive months
*Legislation adopted: Law 276/ December 2010 on the modifications of the GMI Law (416/2001) Government Decree 50/January 2011
Done.
#16. A central registry with a national database of disabled persons is in place
Regulatory measures needed to introduce the obligation for all the decentralized database administrators (directiile de Asistenta Sociala si Protectia Copilului din subordinea consiliilor judetene) to report directly to the General Directorate for Persons with Disabilities on a monthly base
In 2011
#17. Sanctions policy provisions, investigative powers and the referrals system for the Social Inspection are revised and in place
Legislation needed to revise the sanctions policy framework, investigative powers and referral system for the Social Inspection. Revised Special Statute for Social Inspection also needed (Ministerial Action).
By 2012
#18. Three monthly lists of irregularities detected by NASB via data matching between SAFIR and the databases managed by Pension House, and National Employment Agency are sent to Social Inspection for verification and proposing remedial actions (output)
Ministerial Order needed to establish the Operational Guidelines for detection of irregularities through data matching and for the referral system
By 2012
#19. Risk-based investigation to detect error and fraud is used by the Social Inspection for programs for low-income households, child-raising and disability benefits
Ministerial Order needed to establish the Procedural Guidelines for the classification of beneficiaries and service units into classes of risks of fraud
By 2013
#20. Three monthly lists of irregularities detected by NASB via data matching between SAFIR and the databases of ANAF and Registrul National de Evidenta a Populatiei26 are sent to Social Inspection for verification and proposing remedial actions (output)
Ministerial Order needed to establish the Operational guidelines for detection of irregularities through data matching and for the referral system
By 2013

64
General Directorate for Persons with Disabilities; the General Directorate for Social Inspection; and National Agency for Social Benefits (as discussed in Annex 7). While arriving at an estimate for the number of personnel would differ from unit to unit, in general it should be based on the critical functions that the unit/ agency is expected to perform during 2011 - 13; a forecast of the work load (activities); and target staffing level based on an assumption on productivity. Another complementary approach is benchmarking with other units or agencies in "similar" countries. This estimate of staffing needs would be an input in the Action Plan for the implementation of the Government’s Strategy.
18. The preliminary findings of the draft Functional Review Inception Report recommend an increase in the staff by 41 percent in certain areas, concentrated in two highly understaffed units: Social Inspection and the NASB (as discussed in Annex 7). While this increase seems large, and it is larger than the cut effected during the 2nd half of 2011, the recommendations are well-justified in terms of cost-benefit ratio (the estimated fiscal savings from reducing error, fraud and corruption in the SA system of 400-460 million RON annually is 60 times higher than the current wage bill of the unit; and the savings are contingent of adequate staffing levels). Despite the human resources hiring freeze, the Ministry can reallocate staff from units that are well-staffed (or over-staffed) to those areas that are under-staffed. The overall staffing level in the Ministry and subordinated units (Pension, Employment, Labor Inspection agencies plus NASB) was 10,916 in December 2010; the increase in staff recommended for the four implementation units is only 619, or 5.6 percent of the total. The MoLFSP has already begun to adjust upwards its personnel in the four implementation units, notably in the Social Inspection and NASB, using temporary reassignment from other units.
19. By its design, the proposed SASM project covers indirectly the implementation issues in the front-line units, the Social Assistance services operated by local government. During 2005-2009, these units have been burdened by additional workload, when both spending and the number of programs and categories of beneficiaries have multiplied. During 2010, local government staff, including social assistance staff, were reduced as part of the austerity measures. As a result, some local governments, especially those in rural areas, could face capacity constraints. Over 2011-2013, these capacity constraints are likely to be relaxed. The proposed project would have a positive impact of the workload of the frontline units, through: consolidation (elimination) of certain programs; harmonization or rules and procedures across means-tested programs; simplification of rules and procedures to reduce both administration and client participation costs; introduction of a unique application form for family policy programs and program for low-income households.

65
Table A2.8: Draft Proposal to increase the number of staff in critical implementation units, Draft Functional Review Inception Report (World Bank, January 2011). Department or Agency
Number of Staff Justification Dec 2010 Proposed,
FR GD for Social Assistance
54 64 Increase in the scope of work / need to acquire new skills: monitoring of the SA Strategy Action Plan; selected M&E activities; stronger interaction with
implementation units; simulating, designing, piloting the new consolidated
program for LIHs GD for Persons with Disability
44 52 Increase in the scope of work: development of a national database for disabled persons; preparation of the legislative and regulatory framework for
harmonized disability assessment and unified institutional framework for disability allowances and pensions
supervising TA activities; piloting of the new service delivery model
GD for Social Inspection
136 320 Baseline: severely understaffed (when benchmarked internationally) Increase in the scope of work from two programs inspected in 2010 to five during 2012-
2013; move from random and referral-based inspections to risk-
based (client-profiling) inspections; expansion in the investigative powers of the inspectors Benefit-cost ratio: the ratio of irregularities detected in 2010 to the wage bill of the unit was 60 to 1
NASB 1266 1683 NASB is an agency that will expand its "business functions" over 2011-12 and rationalize them in 2013, as follows: (i) NASB is taking over new programs and payments, currently
carried on by the local governments (the GMI starting Jan 2011; potentially the heating benefits). In 2012 or 2013, the means-tested programs will be merged into the Social Insertion Minimum Income program. This will involve more files being processed (in 2011/12) and more payments being made through SAFIR;
(ii) The workload will fall during 2012/13 with the consolidation of programs and the introduction of the unique (family) application form / family-based file.
(iii) Starting 2011, NASB will develop new business functions: (i) cross-checking information and generating referrals for the SI and the local governments; (ii) expanded monitoring (including performance monitoring) reports.
Total 1500 2119 Relative increase
100% 141% Relative increase in staffing for these critical areas

66
Annex 3: Implementation Arrangements
1. Project institutional and implementation arrangements
i. Project administration mechanisms
1. The MoLFSP would implement the activities under the proposed Project. The MoLFSP is the main “actor” in the sector. It led the development of the approved Government’s Social Assistance Strategy, and would also implement the Strategy and the proposed SASM project (as discussed in more detail in Annex 7).
2. The MoLSFP has implemented other World Bank projects and has been assessed by World Bank fiduciary specialists as having the capacity to manage the proposed Project. Project activities would be coordinated and implemented using MoLFSP structures and staff, specifically the General Directorate for Social Assistance. It is not expected that creating parallel structures for implementation would be necessary. A Project Operational Manual is being developed to detail functions and responsibilities of the Ministry of Public Finance, MoLFSP and municipalities (effectiveness condition).
3. Implementing Agency risks relate primarily to capacity to implement (as discussed in the ORAF matrix in Annex 4). As part of the financial crisis response, the Government of Romania made deep, across-the-board cuts to public sector staffing and pay in the second part of 2010. This has affected all Ministries, and all departments within them, equally, regardless of the relative strengths or merits of each department. There is a high risk, therefore, that key departments and agencies in MoLFSP would lack the capacity to implement the program in a timely and effective manner. Cuts to the administrative budgets of these departments and agencies have required that much of the necessary technical assistance resources to support achievement of the DLIs would be sourced from another World Bank supported Social Inclusion Project.
ii. Financial Management, Disbursements and Procurement
a. Financial Management
Country Issues
4. The World Bank has extensive knowledge of Romania’s public financial management (PFM) system. A Country Financial Management Accountability Assessment (CFAA) was prepared in 2003. The CFAA deemed the overall fiduciary risk associated with the PFM system as moderate, and highlighted several strong PFM dimensions, including: the progress on program budgeting, the reliable cash management and distribution facilities provided by the Treasury system, and the Court of Accounts (Supreme Audit Institution) capacity.
5. Romania has continued to make considerable progress in the further development of its PFM systems and institutions. The Government has taken action to improve coordination and management of PFM reform and strengthen internal control, financial reporting and internal auditing systems. An Inter-Ministerial Committee, headed by a State Secretary of the Ministry of Public Finance (MoPF) endorsed a PFM Strategic Development Plan (SDP) in 2005 and has since monitored its implementation. A large number of the CFAA recommendations have been addressed by the Government, including in the areas of treasury management, harmonization of accounting standards and practices, decentralization and rationalization of ex-ante financial control and strengthening internal audit functions. The

67
organization and effectiveness of the Court of Accounts has further improved. Overall, steady progress has been made in the development of PFM systems and institutions. As a result of these efforts, the quality of financial control and oversight in the country has improved substantially.
6. Romania has made progress in government budget transparency as measured by the recent 2010 Open Budget Index assessment (OBI). According to OBI, the remaining budget issues are the absence of pre-budget statements, of a citizens’ budget and of a mid-year review; whereas only partial information is available for areas such as Executive’s budget proposal, in-year reports and audit reports.
Financial Management Risk Assessment and Mitigation Measures
7. The overall residual financial management risk for the proposed Project is rated as substantial. The country’s public financial management (PFM) systems and institutions are advanced, are based on and utilizing modern legal and operational frameworks (including reporting, audit and oversight), and are performing well. The result is that the country’s own fiduciary framework (including regulations and reporting requirements, internal audit and internal control, performance of the Supreme Audit Institution) provides sufficient inherent mitigation measures to support the financial management arrangements for this operation.
Strengths and Weaknesses
8. There are no significant weaknesses of the financial management system. The strengths that provide a basis for reliance on the financial management system include the well developed country PFM systems, processes and practices, simple flow of funds design and robust reporting framework (observed in practice as well).
Implementing Entity
9. Financial management arrangements will be the responsibility of the MoPF, MoLFSP, and NASB. The technical dimensions of the proposed SASM project would be managed by the Ministry of Labor Family and Social Protection (MoLFSP) and by the National Agency for Social Protection (NASB) as the primary operating agent. As this operation relies heavily on the country’s PFM systems, the financial management arrangements of the proposed Project are within the responsibility of the MoPF, the MoLFSP, and NASB to manage the disbursement requests according to the achievement of the DLIs. The MoPF would continue to execute the monthly budget transfers related to the several social assistance allowances, including for the four programs included within the pooled EEP (as discussed below), through the existing channels and procedures. The county branches of NASB, i.e. the CASB, regularly report on the receipt of transfers and utilization of budget funds, the MoPF and MoLFSP would also be responsible to ensure that the EEP reporting is regular, timely and is in compliance with statutory reporting requirements.
Disbursement Mechanisms under the Results-Based SIL (the EEP and DLIs)
10. With a results-based SIL, project disbursements would be linked to defined eligible expenditure items and verified achievement of results. Specifically, project disbursements would be: (a) linked to defined eligible expenditure line items (jointly comprising the “Eligible Expenditure Program” or EEP) within the Government’s Program (social assistance system); and (b) triggered by the verified achievement of agreed specific results (“Disbursement-Linked Indicators” or DLIs) for improving the performance of that Program (the Romanian Government’s social assistance system).
68
11. For the purposes of the proposed project, the Government Program would be defined as the eight largest programs in the social assistance system as of 2010. These eight programs are the largest (in terms of spending and coverage) and represent the backbone of the social assistance system, and account for 61 percent of total social assistance spending (totaling between Euro 1.7-1.9 billion per year, see Table 7). These programs are discussed in more detail in Annex 7 and include: (a) two family policy programs: the State Child Allowance and the Indemnity for Child Raising/Back-to-Work Bonus; (b) four targeted programs for Low-income households (which are being consolidated with the support of this proposed operation): the Guaranteed Minimum Income Program (GMI), the Complementary Family Allowance, the Single Parent Allowance,27 and the Heating Benefit; and (c) two disability programs: the Indemnity for Disabled Adults and the Complementary Budget for Disabled Adults (see Table 3 in the main text). These eight programs are the focus of the Government’s Strategy for Social Assistance Reform, and hence the focus of the proposed SASM project. They are thus referred to collectively as the “Government’s Social Assistance Program” for the purpose of this proposed operation.
12. The World Bank would reimburse a portion of the Government’s expenditures on its Program (the social assistance system). Within the overall Government Program of Social Assistance, specific programs would be qualified for inclusion in the pooled “Eligible Expenditure Program” (EEP) if they meet an established set of criteria. These criteria focus on safeguarding entry into the pooled EEP to those programs with robust fiduciary arrangements. Specifically, social assistance programs would meet the following criteria for World Bank reimbursement under the pooled EEP:
Single Payment & Operating Agency. Qualifying programs would be operated via a single payments and registry operating agency (the NASB) that meets robust financial management arrangements, including: use of the existing internal control, satisfactory accounting and reporting framework, separation of eligibility vs. payment functions, electronic registry of beneficiaries (SAFIR), and an electronic payment system that tracks amounts due, paid and not paid.
Oversight and Controls. Qualifying programs would be subject to an annual review by the Social Inspection, which quantifies and seeks remedies for irregularities detected in the implementation of the program, such as errors, fraud or corruption.28
13. By this set of criteria, four programs qualify for World Bank reimbursement in the pooled “Eligible Expenditure Program” (EEP) at the start of the proposed Project. These four programs include: (a) two family policy benefits: the State Child Allowance and the Indemnity for Child Raising; and (b) the newly consolidated and redesigned “Family Allowance Program” (which consolidated the Complementary Family Allowance and the Single Parent
27 In January 2011, reform legislation already consolidated the Complementary Family Allowance and the Single Parent Allowance into a single redesigned program, now called the “Family Allowance Program,” thus bringing the total number of main programs from eight to seven. Further reforms under the Government’s Social Assistance Strategy and supported by the proposed operation would consolidate the remaining targeted programs into a single program for low-income households, to be paid through a single payment agency (see Table 5 for “Before” and “After” Composition of the main social assistance programs in Section 1). 28 As noted elsewhere, it is important to recognize that all social assistance programs are exposed to some degree of fraud and error, in all countries and all programs around the world (100 percent compliance is not possible, nor cost- effective). The key is to put in place systems for detecting, remedying and minimizing these irregularities.

69
Allowance as of January 2011); and (c) the Guaranteed Minimum Income Program (GMI). These four programs have suitable internal controls, are managed by the single payment agency (NASB), and are subject to regular oversight and controls by the Social Inspection, thus meeting the fiduciary criteria for inclusion into the pooled EEP, for reimbursement by the World Bank.
14. The transfer of funds from the World Bank would reimburse a share of the Government expenditures on the programs included in the pooled EEP. The pooled EEP would thus be defined as the monthly payments made under the qualifying (four) programs. These four programs would be subject to standard World Bank supervision activities and fiduciary requirements during the life of the proposed SASM project. As discussed below (flow of funds and disbursements section), supporting documentation for disbursements would include evidence that the quarterly payments have been made, as per the Annex 7 of the Romanian statutory reporting format.
15. The EEP could be expanded to include other programs, when they meet the criteria for inclusion. Over the life of the proposed Project, the EEP could be expanded in the future to include the Heating Benefit and the two large disability programs (the Indemnity for Disabled Adults and the Complementary Budget for Disabled Adults), once these programs (or their successors in the event of consolidation) would satisfy the above-mentioned criteria. Indeed, implementation support under the results-chain frameworks for the proposed project does seek to strengthen the administration of these programs, such that they achieve higher fiduciary standards. Such implementation support and supervision29 would be associated with DLIs that are specific to these programs (e.g., harmonizing disability criteria and institutional structures under DLIs 9 and 10, unifying the registry of disabled persons under DLI 16) and with broader system-wide DLIs that apply to all programs in the Government’s Program of Social Assistance (e.g., strengthening oversight and controls under Results Area IV). Complementary technical assistance provided by the restructured Social Inclusion Project (SIP) will also help strengthen these functions (as discussed above and in Annex 2).
16. Disbursements would be triggered by the verified achievement of agreed specific results for improving the performance of the Government’s Program (the social assistance system, as defined above). The MoLFSP and the World Bank have defined a set of 20 “Disbursement Linked Indicators” (DLIs) that consist of key results that contribute to the achievement of the PDO. These DLIs include are described in detail in relation to the results chains in Results Areas I-IV and in matrix format in Table A2.1 in Annex 2.
17. When each DLI is achieved and verified, €25 million would be disbursed upon presentation of documentation related to the EEP. Verified achievement of the DLIs would gradually lead to the achievement of the PDO over the implementation period of the proposed SASM project, although results are expected to continue in a sustained manner well beyond the Project’s lifespan. In terms of timing, the DLIs have been presented under “Target Years 1, 2, and 3” for purposes of projecting disbursements and facilitating Government budget planning,
29 Until these programs are qualified for inclusion in the pooled EEP, they would not be co-financed by the World Bank under the proposed operation (and as such, fiduciary and INT oversight would not directly apply). The World Bank would supervise their implementation and strengthening through the vehicle of the partnership formed by the Results Framework and the DLIs, as well as through the complementary TA activities supported by the restructured SIP. This is analogous to World Bank TA SILs whereby the partnership focuses on strengthening program administration, without directly co-financing the program per se (e.g, in traditional Social Protection SILs or Pension Administration SILs).

70
but their timing is not fixed. Rather, disbursements will be made upon verified achievement of the specified DLI at any time during the implementation period. Disbursed funds would flow to the MoPF’s Euro account opened at the NBR as reimbursement for spending on the pooled EEP. These funds will be used in line with Romanian legislation, including the public debt legislation.
Budgeting and Planning
18. As noted above, the operation will rely heavily on country public financial management systems. The financial management dimensions (budget/treasury management, reporting and monitoring) would be the responsibility of the Ministry of Public Finance and MoLFSP and the operation would rely heavily on the country public financial management systems. The MoPF would work closely with the MoLFSP to prepare disbursement requests.
19. The Financial Management architecture of the programs that comprise the pooled EEP will be used with minor improvements. This architecture includes the budget classification and program structure, NASB’ and CASBs' reporting and expenditure monitoring systems, and monthly Treasury statements. The current financing scheme and flow of funds for the programs within the EEP is fairly straight-forward and well-managed, including reporting from CASBs back up to the center.
20. The existing transfers and payments system would be the basis for reimbursements under the proposed SASM project. The financing provided by the World Bank would represent only a fraction of the overall financing for the programs included in the pooled EEP for the implementation period (see Table 7 in the main text). The budgets would continue to follow the existing procedures for approval, reporting (on budget execution) and monitoring. The approved programs’ annual budgets are entered into the accounting system and used for periodic comparison with actual results as part of the interim reporting. The process of compiling budget data and approval would continue in the same manner, with each county’s budget data available by month and quarter.
Accounting Staffing
21. The accounting staff within MoLFSP, NASB and at the county (CASB) levels complies with the statutory requirements on qualifications and experience. Typically, each county CASB has a chief accountant and a number of 3-5 accountants. The Bank team observed a high level of compliance by the officials (including chief accountants and accountants) with national budget management and reporting requirements.
Accounting Policies and Procedures
22. The proposed SASM project would utilize the existing Romanian budgetary accounting policies, procedures and systems. The program’s accounting and budgetary transactions/records would continue to be maintained on an accrual basis and denominated in Romanian Lei (RON). The operation would rely upon the existing accounting procedures and internal control framework to ensure that all procedures and controls are adequately documented, contract monitoring and invoice payment procedures are consistently adhered to and documented. The controls over the programs within the pooled EEP are robust at the CASB local level and closely monitored by NASB, MoLFSP and MoPF at central level. The main accounting and transaction controls relate to the existing standard checklists which have to be filed for each budget engagement, transfer and payment and approved by the relevant financial controller.

71
Information Systems
23. Each CASB is responsible to keep detailed records for each of the programs within the pooled EEP, including distinct records for each of the cash transfer payments related to GMI, FAs, CRB and SCA. Analytic records are kept in the existing accounting and reporting software, Sintec, a widely used Romanian public sector accounting system, which is used nationwide by the CASBs and by NASB. Each CASB separates its monthly budgetary opening received in Treasury Account 57 by each social assistance program, using analytic accounts in Sintec. Additional software procedures are in place for the timely archiving of the monthly files and weekly information back up.
Internal Controls and Internal Audit
24. Full reliance would be placed on the existing public sector internal control framework. This framework includes the use of checklists to ensure that required procedures are performed and data established during the processing of the invoices, including: checking mathematical accuracy of the invoice, matching legal conformity of the invoice, matching the invoice to the relevant contract, agreeing invoice to goods received notes or other evidence of completion of work, account numbers, etc.
25. The NASB and each CASB have established an internal audit department, which includes the chief internal auditor and a small number of internal auditors. These internal audit departments have been created only recently and thus there is limited experience with internal audit. In practice, though internal audit work complies with Romanian legislation, it is still dominated to a large extent by ad-hoc compliance-focused audit engagements missions and is not yet based on a longer term risk-based planning method of internal auditing.
Funds Flow and Disbursement Procedures
26. A summary description of the existing State Budget funds flow mechanism, from MoPF, through MoLFSP, to NASB is illustrated in Table A3.1. The MoLFSP, as a first tier budget holder, is overall responsible for sector budget planning and for submitting reports to the MoPF. NASB is a second tier budget holder, under the MoLFSP’s coordination, and it is responsible for the implementation of several social services programs, including the four programs within the pooled EEP. NASB has branches in each of the 41 counties, the CASBs, which are third tier budget holders. The budgetary requests for each of the social assistance programs, including for the four programs within the EEP are prepared monthly by each CASB and submitted to NASB by a certain deadline. These requests are based on the information from the “SAFIR” system, which includes all the information related to beneficiaries and their eligibility for the respective social assistance program, and are accompanied by the lists of beneficiaries. NASB verifies these documents, and centralizes the budgetary requests for the entire country by each social assistance program, including for the four programs within the EEP. The aggregated budgetary requests are submitted by NASB to MoLFSP for their verification and approval. MoLFSP prepares the documentation needed for the monthly budgetary openings at the Treasury and submits the entire package to the MoPF. Once the final budgetary verifications are done by MoPF, including checking the compliance with the quarterly budget limits, the Treasury makes the monthly budgetary openings as requested.
27. Funds flow from the NASB (national level) down to CASB (county level) and then to the beneficiaries through the post and/or banking system (see Figure A3.1 below). NASB

72
receives the monthly openings at the central Treasury in Bucharest according to the various accounts as per the budgetary classification. NASB then makes the budgetary openings for each CASB at each county’s Treasury branch, based on the CASBs’ initial requests. Each CASB receives the amounts allocated for each of the programs, including for the four programs within the EEP made available together with other social assistance program for parents and children, under the family related social assistance Treasury account 57. Each CASB splits the monthly amounts allocated under each of the four programs within the EEP titles by batches of beneficiaries that receive their entitlements through the Post Office, and through the pre-agreed commercial banks. Each CASB has a list of 10-15 pre-agreed commercial banks that have branches in the respective county and have agreed favorable banking commission terms. Each CASB prepares two monthly payment orders for the Post Office, one on the 5th of the month for 66 percent of the total amount distributed through the Post Office and a second one on the 12th of the month for the remaining 34 percent of the amount. Each CASB prepares monthly a payment order for each of the banks used. Once the funds are transferred from each CASB’s Treasury account to the Post Office and commercial banks accounts, each final beneficiary receives its entitlement. The Post Office distributes the money through its postmen, while commercial banks credit the beneficiaries’ accounts.
28. Reporting on the funds used and remaining unused funds is done from the county level CASB to NASB. At the end of each month, the Post Office reports back to the CASB on the amounts undistributed (absent beneficiary, etc) and sends back such differences. CASB reports back to NASB by the 5th of the following month on the budget execution, and sends the supporting documentation (monthly Treasury statements, lists of beneficiaries, etc). The reporting format is standardized in an Excel spreadsheet used nationwide that is filled in by each CASB based on the monthly trial balance produced by Sintec. NASB verifies all information received, aggregates all county reports and prepares a consolidated monthly report to the MoLFSP and MoPF. The report is verified by MoPF together with the request for the following month budget opening.
29. Structure of the pooled EEP. As discussed above, the pooled EEP would comprise the monthly payments for the following four programs: the State Child Allowance, Child Raising Benefits, Family Allowances and the Guaranteed Minimum Income (GMI). These four programs have suitable internal controls, are managed by the single payment agency (NASB) and are subject to regular controls by the Social Inspection. The pooled EEP could be further expanded in the future to also include the heating benefits and two large disability programs (the Disability benefit and Complementary Budget for Disabled persons), once these programs, or their successors would also satisfy the above mentioned criteria.
30. IBRD loan funds flow would reimburse a portion of the pooled EEP. The loan flow of funds would imply that once a Disbursement-Linked Indicator (DLI) is fulfilled, as certified by the task leader and the task team, the Borrower (MoPF) could submit a withdrawal application for the disbursement of the relevant EUR value pre-assigned to that respective DLI. The loan proceeds would reimburse parts of the pooled EEP, up to the limit of the EUR values assigned to the DLIs. The supporting documentation for disbursements would include evidence on the aggregated payments made, and also show the amounts allocated (transfers that have been made) from MoPF to the National Agency for Social Protection (NASB) and then from NASB, for each of the programs under the pooled EEP. Such quarterly summary statements (Annex 7 in

73
the Romanian budgetary quarterly reporting format) are being prepared by NASB and would be submitted together with the withdrawal applications.
31. The main characteristics of the disbursement mechanism are as follows:
Disbursements are made upon the World Bank’s technical team verification of compliance and achievement of the DLI;
Once compliance with the DLI is verified, MoPF presents to the World Bank a disbursement report, as well as a report on budget execution of the pooled EEP (the four programs that comprise the pooled EEP);
World Bank would disburse the amount triggered by the complied DLI. Funds would flow to the MoPF’s Euro account opened at the NBR; and
Disbursements are not fixed to specific dates or years within the project life.
32. Disbursements for this operation would be report-based and as such, would utilize the budget reports such as Annex 7 of the Romanian statutory reporting format. These reports show both the planned transfers for the year and the actual transfers executed to-date. The budget execution reports compare the quarterly cumulative expenses to the allocations. Disbursements can be requested whenever the agreed disbursement linked indicators have been met, as certified by the World Bank. Withdrawal applications would be sent by the MoPF, for the amounts defined for each disbursement linked indicator, accompanied by the relevant quarterly budget and treasury reports and documentation for the achievement of DLIs.
Reporting and Monitoring
33. Quarterly unaudited Interim Financial Reports (IFRs) would be used for disbursement, monitoring and supervising the proposed SASM project. The quarterly IFR reports would include the expenditures for the entire EEP and would be generated by the existing system, based on the existing quarterly formats used (see section on disbursement). These reports aggregate the expenditure data for the programs included in the pooled EEP for each quarter in compliance with the national economic budget classification. The annual reports, that would include separate financial information on the programs in the pooled EEP for the year, in compliance with the national economic budget classification, would be regarded to the “Program Financial Statements” (PFS) for purposes of this project.
34. The local CASBs will retain all detailed expenditure information for the beneficiaries in their jurisdiction. For the purposes of monitoring this program, it is not necessary or required to have detailed individual beneficiary-level expenditure information included in the quarterly reports submitted to the Bank, though the Bank may review such level of detail during the course of implementation support of the operation.
External Audit
35. The Court of Accounts (CoA) carries out annual financial and performance audits on the State Budget execution, including for programs within the pooled EEP. However, it does not issue a separate audit report for each individual program, as these are covered in the overall CoA report prepared for all the activities under the Ministry of Labor, Family and Social Protection. The World Bank has discussed and agreed with the CoA to ensure that the annual financial statements audit would be done in a timely and reliable manner and that a separate audit opinion would be issued for each of the social assistance programs included in the EEP (the

74
Program Financial Statements, or PFS). This information needs to be made public by the MoPF in a timely fashion and manner acceptable to the World Bank. In addition, following the formal receipt of the PFS, the World Bank will make it available as the public in accordance with its Access to Information Policy.
36. Table A3.1 identifies the audit reports that would be required to be submitted together with the due date for submission.
Table A3.1 Audit Reports and Reporting Schedule Audit Report Due Date
Program financial statements (PFS) For each of the social assistance programs included in the EEP
Within twelve months after the closure of the fiscal year which is at the end of December each year; and also upon Project closure
National Agency for Social Benefits 37. While NASB does not have an audit role, it fulfills important payment and oversight functions. First, NASB monitors the payment compliance for the programs it manages through its monthly payment reports30 and covers the four social assistance programs in the EEP. Based on this report, NASB reports to MoLFSP the number of beneficiaries and the amounts for a specific program that are actually paid in a given month. Five DLIs measure the payment accuracy of new claims using this monthly payment report (DLI4, DLI5, DLI6, DLI10 and DLI15). This payment report is close, but not equivalent, to a payment compliance audit. The latter typically focuses on a random sample of monthly payments from the NASB, which would then be traced through the CASBs, and the Post Office and commercial banks used, to the beneficiaries to make sure that the payments were actually received by the specified beneficiaries. Second, NASB provides information on beneficiaries for the Social Inspection cross-checks. By the end of 2010, this process was not exhaustive and automatic; over time, the cross-checks will increasingly become automatic and will cover an expanded set of databases: the pension and unemployment benefit registries (tentatively in 2012), the tax and civil registry (tentatively in 2013).
Social Inspection 38. The Social Inspection plays an important role in overseeing the social assistance system. This role spans: a performance (eligibility compliance) function for programs included in the pooled EEP; a system improvement function by making recommendations to correct specific operational problems at the townhall level; and broader systemic problems by making proposals to amend the legislative framework.
39. The Social Inspection is required to investigate all cases that have been referred to it by the general public, or from the staff and apply remedies. Furthermore, the Social Inspection can initiate investigations in response to allegation of misconduct reported in the media. These are called ad-hoc inspections. The main focus of these inspections is currently on
30 This monthly payment report includes information on the number of beneficiary files that are (i) in payment; (ii) not yet solved; (iii) new applications, of which (iii.a) approved and (iii.b) effectively paid; (iv) suspended; or (v) paid again, once the suspension is lifted.

75
eligibility compliance. For some programs, the inspection team includes members of other organizations, such as the Labor Inspection (for the inspection of CRB cases) or doctors (for disability-related inspections). If an irregularity is detected, the Social Inspection can apply a range of remedies and/or sanctions as provided in the legislation: verbal notice; suspension or cease of payments; and administrative fines. When a serious infringement is detected, the Social Inspection refers the case to the Police or other investigative bodies. Over time, both the investigative powers of the Social Inspection and the sanction regime will be strengthened with the support of the proposed SASM project (see DLI17).
40. Finally, the Social Inspection undertakes thematic inspections at the request of the Minister of Labor, Family and Social Protection. The thematic inspections are large sample eligibility compliance reviews. They are relatively new (started in May 2010) and their methodology is evolving. Two such reviews undertaken in 2010 (for the GMI and beneficiaries of the Disability allowances for the severely disabled adult with physical or visual impairment) aimed to check the whole caseload. Given staff shortage, other thematic inspections planned for 2011 will check only a representative sample of cases, and will be targeted to high-risk beneficiaries. By the end of 2011, the Social Inspection is expected to complete the first set of thematic inspections for each of the four risk-prone social assistance programs: ICR, HB, the GMI, and the Family Benefits. An annual thematic inspection of the disability benefits will be added to the Social Inspection’s program of thematic inspections after the legislation to harmonize the criteria and unify the institutional framework is adopted. Given the role that the Social Inspection has in certifying compliance for the programs within the pooled EEP, it has been agreed that the Social Inspection would include in its annual work program, starting with 2012, the sample-based thematic inspections of all the programs included in the EEP. Thus the Social Inspection would prepare and submit to the World Bank annual reports for all the EEP programs, with the noting that, given the proven very low risk of error, fraud and corruption of the universal State Child Allowance, for which the Social Inspection would report on the ad-hoc inspections based on complaints and would inform the World Bank annually about such complaints and inspections, if any.
41. The annual reports of the Social Inspection would report on irregularities, separately for errors vs fraud and corruption, and on remedial actions taken. It is important to note, as emphasized elsewhere, that no cash transfer program is immune to errors, fraud or corruption, and the goal is to develop systems to deter, detect and remedy these irregularities. Irregularities could result in under- and overpayments, and these can be further classified into error, fraud and corruption. Overpayments occur when a beneficiary receives a larger benefit that the amount he or she is entitled to, according to the rules of the program; this includes instances where a beneficiary should not receive any benefit. Underpayments occur when a beneficiary or applicant receives a smaller benefit that the amount he or she is entitled to, according to the rules of the program; this includes instances where an application was wrongfully denied by program staff. Error refers to unintentional mistakes of the benefit claimants or staff in the benefit office that result in under- and overpayments. Fraud refers to intentional behavior on the part of the benefit applicant to defraud the benefit system. Corruption refers to intentional behavior on the part of the program staff or management to appropriate benefits for personal gain.
42. A summary of the FM/Oversight and Control Mechanisms is presented in Table 3.2 below.

76
Table 3.2 Summary of Oversight and Controls Mechanisms for Social Assistance Programs in Romania O&C / Audit Function Agency
Responsible Time Frequency
Applicability: EEP Programs Vs. Broader SA (DLI group of programs)*
Financial and Performance Audit – MoLFSP
Court of Accounts
Annual Each Program in EEP
Payments Compliance desk review ‐ reconciling payments to beneficiaries
in the NASB registry for a random sample of payments made
NASB, starting 2012
Annual Programs in EEP (pooled)
Thematic Inspections / Performance (eligibility compliance) Reviews
Social Inspection Annual 4 risk-prone programs (including 3 EEP programs, less SCA) starting 2012
On-the spot investigations Social Inspection When notified All social assistance programs
Cross-checks with other databases Starting 2012, NASB
Monthly Programs in EEP
Follow up and remedies for different types of irregularities
Social Inspection; Police; other bodies
All social assistance programs
Implementation Support and Supervision Plan for Financial Management
43. An accredited Financial Management Specialist would participate in the project team to provide technical assistance and implementation support for the proposed SASM project. In providing technical assistance for improving the performance of the program, the World Bank team would focus on working with the CoA on the annual program auditing and with the Social Inspection to increase their capacity for thematic inspections on eligibility compliance and improve their reporting. Additionally, the World Bank team would continue to work with the MoLFSP and the CoA to further improve the content and level of transparency in the reporting and disclosure of the programs included within the pooled EEP.
44. With regard to the implementation support of the proposed SASM project, the World Bank would conduct risk-based financial management supervisions, at appropriate intervals. During project implementation, the World Bank would supervise the financial management arrangements for the proposed SASM project in the following ways: (a) review the program’s quarterly interim financial reports as well as the annual audited financial statements and auditor’s report and remedial actions recommended in the auditor’s management letters; and (b) during the World Bank’s on-site supervision missions, review the following key areas: project accounting and internal control systems; budgeting and financial planning arrangements; and disbursement management and financial flows, as applicable. In addition, as part of the regular financial management implementation support, the World Bank financial management specialist would review a sample of transactions for the programs included in the pooled EEP, at the relevant commercial banks and the Post Office as part of the field-level reviews of payment distribution, controls and security over this entire process and check how local offices manage

77
and capture payment transaction data, how the data is reconciled and reported back to each CASB and then to the NASB.
iii. Procurement
45. The proposed Project would not include any procurement of goods, works, services or consultancy services.
iv. Environmental and Social (including safeguards)
46. The primary beneficiaries of the proposed Project would include low income households, specific vulnerable groups, as well as taxpayers more generally. 1. Low-income households and vulnerable groups, such as needy families, single parents, Roma
households, and the rural poor, would benefit from improvements in targeting accuracy, as they would receive a greater share of social assistance benefits (Results Area II).
2. Low-income households, persons with disabilities, and other applicants would benefit from the simplification and harmonization of intake and recertification processes, since the private costs of applying for benefits and accessing the system would be reduced (Results Area III). A reduction in the costs of applying for benefits would have the greatest impact on poor households, for whom such costs constitute important barriers for inclusion and for whom exclusion errors will decline.
3. Taxpayers would benefit from lower fiscal costs, as well as higher effectiveness and efficiency of social assistance spending. The proposed reforms offer some opportunities for the reallocation of resources to more efficient and effective spending. Specifically, the effect of increased administrative efficiency and reduced error and fraud (Results Areas III and IV) and other reforms are projected to reduce the fiscal costs of the social assistance system from 2.9 percent in 2010 to about 2.3 percent annually with implementation of the reforms.
47. The implementation of reforms for low-income households supported by the proposed SASM project, although not specifically focused on the Roma, would shift a greater share of social assistance benefits to those in the poorest quintile, which includes a disproportionate share of the Roma. The Roma, comprising approximately 2.8 percent31 of the total Romanian population, but concentrated among the poorest in Romania, would be among the main program beneficiaries. In 2009, 73 percent of Roma men, women, and children lived in households with per capita incomes that put them among the poorest quintile in Romania (see Annex 7). In addition, the proposed SASM project would help improve access to benefits by simplifying application procedures to facilitate greater access, which would be particularly important for the Roma population as international evidence suggests that complex application and verification procedures can represent an obstacle to Roma inclusion in social programs. For these reasons, it is expected that the Roma would benefit from simplification of application procedures and improved targeting of social assistance, both in terms of raising welfare and reducing vulnerability. Furthermore, the on-going Romania Social Inclusion Project (SIP) largely focused on supporting direct investments in Roma communities, and is being restructured to provide funding to many of the technical assistance activities associated with the proposed Project. Finally, improving the efficiency and effectiveness of Romania’s social assistance system would allow the Government to use these resources for complementary investments in
31 Estimation of World Bank staff based on Household Budget Survey 2009.

78
Romania and would be expected to contribute to fiscal stability, which is beneficial for the population as a whole.
48. Under the Results Area II, the proposed Project aims to support improved targeting of social assistance resources towards the poorest quintile by reducing the share of social assistance spending that reaches the middle classes through amendments to the eligibility thresholds of some programs, eliminating others and by harmonizing income-tests around that of the Guaranteed Minimum Income (GMI) program. The harmonization of targeting criteria and procedures is one of the proposed Project’s key development indicators.
49. In the Results Area III, the proposed Project supports the reduction in transaction costs for potential beneficiaries of the social assistance system (thus reducing one potential barrier to their ability to benefit from the system), while also reducing administrative costs, which could allow more resources to be channeled into the benefit programs.
50. Under Results Area IV, the proposed Project aims to directly ensure more resources are channeled to the poor by tightening oversight and controls and conducting regular inspections so that ineligible claimants are no longer allowed to claim benefits that were intended for the poor.
51. Finally, improving the efficiency and effectiveness of the social assistance system would allow the Government to use these resources for complementary investments in Romania and would be expected to contribute to fiscal stability, which is beneficial for the population as a whole.
52. The implementation of the social assistance reforms would likely result in some benefiting the most and an others that would have their benefits reduced from redistribution and a reduction in spending. Those benefiting the most from the reform would be the low income households, i.e. the poorest 20 percent of the income distribution. The share of social assistance benefits that will go to them is expected to rise, from 37.7 percent in 2009 to at least 45 percent in 2013. Moreover, despite a projected reduction in overall social assistance spending, the generosity32 of social assistance for this group is expected to rise from 26 percent to 29 percent as a share of transfer income in total income of beneficiary families (see Annex 8). Among those expected to have reduced benefits due to the social assistance reform would be the upper and middle-class beneficiaries, fraudsters, and those who entered in the programs in the past under weak eligibility rules (see Annex 9 for more details). The degree to which these that would lose would protest depends on the extent of harm they perceive and the extent to which they would organize in effective protest. Some groups, such as the fraudsters or those who entered under weak eligibility rules may decline to protest the loss of benefits out of fear of further penalties or incrimination. Other groups, such as higher-income ex-beneficiaries may perceive relatively less harm, since the benefits represent a smaller share of their total incomes, and as such may not believe it is “worth it” to organize in protest. For a full discussion of the extent of the beneficiaries from the reform and the communication strategy used to mitigate the risk of derailing the reform, see Annex 9.
53. The policies supported by the operation are not likely to have significant effects on Romania’s environment or natural resources. The measures contemplated under the loan
32 Generosity is the ratio of the transfer amount received by all beneficiaries in a group over the total welfare aggregate of the beneficiaries.

79
relate to improving the social assistance system and are not expected to have any significant links to the environment, nor trigger any of the World Bank’s environmental safeguards. Moreover, Romania has adequate environmental controls in place. Romania’s environmental legislation and regulation is reinforced by EU environmental directives, including the EU’s guidelines on adoption of environmental assessments at the planning and programming level (June 2001) and the EU’s Environmental Liabilities Directive setting out liability for damage to properties and natural resources (April 2007)
v. Monitoring & Evaluation
54. With a results-based approach, monitoring and evaluation (M&E) are central. Government M&E systems would be strengthened with the World Bank’s support during project implementation. Since disbursement relies on unequivocal evidence of achievement of results as measured by the DLIs, the MoLFSP and other institutions would monitor, verify, and report on achievement of results, with the requisite information for each DLI, in a timely and comprehensive manner. Monitoring and reporting would be scheduled semi-annually to provide a regular check-in on progress.
Arrangements for Monitoring of Selected Results of the Program
55. The Proposed SASM project would strengthen the Government’s monitoring of its social assistance system. Results area I supports the development of the Action Plan to carry out the Government’s approved Social Assistance Strategy, the use of administrative data for monitoring and, over the life of the Project, the routine use of performance information for operational and policy management. Results area IV expands the scope of the management information systems for social assistance programs to all large programs and introduces procedures to check and improve the quality of data. Annex 1 describes the Results Framework and Monitoring arrangements; Annex 2 describes the monitoring arrangements of the DLIs; and the Project Operational Manual provides the details on the rationale, definition, and procedures to verify achievement of the DLIs.
Arrangements for Evaluation of Selected Results of the Program
56. In addition to monitoring, evaluations will be carried out to measure the achievement of intermediate outcome indicators, relating to targeting accuracy and cost savings. Specifically:
For Targeting Accuracy: The National Institute of Statistics will conduct regular evaluations of improvements in targeting for programs aimed at low-income households. The World Bank team met the President of the National Institute of Statistics (NIS) and the management team supervising the household surveys to inquire whether the NIS could produce, with the cooperation of the MoLFSP, regular bulletins on the benefit incidence of social protection programs based on the Household Budget Survey. The World Bank team presented standardized software (ADePT) that can automatize the production of such a bulletin to the staff involved in the collection of household survey data. The initial assessment of NIS is that such bulletin can be produced, but would require technical assistance. The MoLFSP will sign a cooperation agreement with NIS for the development and regular production of the statistical bulletin. This activity would be supported by the on-going SIP.

80
For Cost Savings: An assessment of the cost savings triggered by the process of simplifying, harmonizing and implementing revised rules and procedures for social assistance benefits would be conducted. This assessment would include a process evaluation that would estimate beneficiary costs (time or other elements of opportunity costs, and money) associated with the eligibility and recertification processes; and the administrative costs incurred by the town halls’ social assistance departments, for the subset of four means- and income-tested programs (GMI, CFA, SPA, and Heating Benefits) and their successor programs, for a representative sample of front-line units and beneficiaries. This exercise would be carried out before and after each step of simplification and harmonization of rules and procedures. The financing for this process assessment and cost evaluation activity would be supported by the Romania SIP.

81
Figure A3.1: Flow of Funds for the EEP Programs

82
Annex 4 Operational Risk Assessment Framework (ORAF)
Project Development Objective
Improve the overall performance of Romania’s social assistance system by strengthening performance management, improving equity, improving administrative efficiency and reducing error and fraud.
PDO Level Results Indicators:
1. Strengthened Performance Management: Romania’s social assistance reform is implemented following a results‐oriented strategy and action plan and is supported by a performance management M&E system.
2. Improved Equity: The share of social assistance funds going to the first poorest quintile of the population increases to 45 percent from 37.7 percent at baseline (in 2009).
3. Improved Administrative Efficiency: Reduction in administrative and client costs for means‐tested programs by 15 percent from baseline value.
4. Reduced Error and Fraud: Programs for low‐income households, disability benefits and family policy programs have strengthened information systems, and oversight and control procedures including detection of error and fraud using risk‐based investigation, data matching, data quality audits, and consolidated beneficiary registries.

83
Risk Category
Risk Rating
Risk Description Proposed Mitigation Measures
Project Stakeholder Risks
Medium-Impact
The program outlined in the Social Assistance Reform Strategy could be delayed, diluted, or discontinued due to political and/or public opposition.
The Government is committed to carrying out the reforms for fiscal, equity and efficiency reasons. The Social Assistance Reform Strategy is also consistent with the broader reform program supported by the IMF and EC. Reform measures will be introduced gradually, and accompanied by a communications campaign to keep Romanians informed about the reforms, to dispel myths and to generate public support (see Annexes 2, 7, 9).
Implementing Agency Risks
Medium-Impact
Limited policy and implementation capacity, personnel cuts, lengthy contracting procedures and limited inter-agency cooperation could delay implementation of the reform program and so delay disbursements. Error and fraud could be detected undermining trust in the social assistance system. All social assistance programs in all countries contain some degree of irregularities and recent inspections by the Government appear to confirm that this risk is high.
The Functional Review of MoLFSP has analyzed the effective functioning and staffing of the MoLFSP and will assist in the preparation of an implementation plan. The proposed Project specifically aims to contribute to reducing levels of error and fraud (Results Area IV) and strong fiduciary and audit mechanisms are being put in place. Stronger oversight and controls often give rise to higher levels of error and fraud detection initially but capacity to remedy and sanction these irregularities is also being increased.
Project Risks

84
Design
Medium-Likely
The proposed Project intends to disburse on the basis of results achieved, which is new for Romania. Learning-curve could cause delays in disbursement.
Project preparation has focused on: (i) ensuring that DLIs are realistically calibrated, well specified, understood, measurable, and verifiable through a series of workshops involving the World Bank and the Government counterparts; (ii) ensuring that Treasury and FM systems and reporting are adequate; and (iii) identifying priority TA to support achievement of DLIs (to be financed by the on-going SIP).
Social and Environmental
Medium-Impact
Opposition to social reforms could create implementation difficulties. Proposed Project does not trigger environmental, resettlement, or social safeguards.
Reform measures will be introduced gradually, and accompanied by a communications campaign to keep Romanians informed about the reforms, to dispel myths and to generate public support
Program and Donor
Low The program could overlap or contradict other donor programs
The PDO is consistent with the Government’s Social Assistance Reform Strategy. The overall reform agenda is consistent with measures supported by IMF and EC.
Delivery Quality
Medium-Likely
Inability to cross‐check beneficiary information with other agencies could prevent the development of a sanction policy, which in turn could impact the ability to meet associated DLIs.
The Ministry of Public Finance is supportive of the reform program, which would reduce the over-payment of benefits from their budget and will facilitate inter-agency collaboration. MoPF and tax registry are partners in the Project preparation.
Overall Risk Rating at Preparation
Overall Risk Rating During Implementation
Comments
Medium-Impact High

85
Annex 5: Implementation Support Plan
1. Implementation support is a core element of the proposed SASM project partnership between Romania and the World Bank. Implementation support for the Government’s Social Assistance Strategy and the proposed SASM project would involve continuous World Bank engagement in partnering with the Government for several dimensions:
A continuous partnership for the sectoral and technical aspects of implementing the four Results Areas (described in Annex 2), including: (a) strengthening performance management and helping instill a culture of results-monitoring; (b) improving equity; (c) improving administrative efficiency; and (d) reducing fraud and error. Implementation support for the sectoral and technical aspects would come from the continuous partnership of the proposed SASM project, supervision of technical assistance activities under the (restructured) companion Social Inclusion Program (SIP), and on-going dialogue in the sector under both the proposed SASM project and the on-going DPO series, as well as supported by the incipient Functional Review (see Annex 2).
Continuous fiduciary engagement, both for regular fiduciary (financial management) supervision of the qualified programs included in the pooled EEP and for further support to the Government of Romania to continuously strengthen its country systems as they pertain to the social assistance system, such as annual program auditing under the CoA and the many oversight and controls improvements to the social assistance system described in Results Areas III and IV (improving administrative efficiency and reducing fraud and error). See Annex 3 for more details.
On-going partnership to support an effective communications strategy to manage the social and political dimensions of implementing the Government’s ambitious Reform Strategy for Social Assistance. These dimensions are described in Annex 9, with some of the communications investments being financed under the (restructured) companion Social Inclusion Project (SIP).
2. In terms of the timing of formal implementation support, supervision missions would be carried out twice a year (with regular ISR reporting), covering sectoral (technical), fiduciary and communications aspects. They will monitor and report on progress on the results chains (DLIs), as well as verification of the achievement of DLIs. They will also monitor risks, updating the risk assessment as needed, as presented in the ORAF matrix in Annex 4. Annual reviews would be carried out for a more in-depth stock-taking of performance to date (for the prior year), progress towards achieving the PDIs and overall PDO, the time calibration of achievement of DLIs (and any adjustments needed in disbursement forecasts associated with projected achievement of remaining DLIs), and overall project implementation arrangements, identifying any adjustments needed.

86
Table A5.1: Implementation Plan – Basic Timetable
Time Focus Skills Needed BB Resource Estimate
Partner Role
First twelve months (including on-going dialogue and engagement with at least one regular supervision mission and one annual review at the end of year 1)
Ensuring robust M&E systems
Seamless financial management
Development and implementation of communications campaign
M&E + Technical + FM+ Communications
USD 100,000 On-going implementation of the proposed Project and associated social assistance programs
Monthly payment of benefits for the programs in the EEP
Tracking and verifying achievement of the DLIs (see Annex 2)
Participation in supervision missions
Preparation of Annual Report on project performance (to be defined in the POM);
Financial management, oversight and controls + financial reporting (see Annex 3)
12-48 months (including on-going dialogue and engagement with at least three regular supervision missions and one annual review t the end of year 2)
Ensuring technical quality and compliance of DLIs
Ensuring fiduciary compliance
On-going communications campaign
Technical + FM+ Communications
USD 200,000
Other Table A5.2: World Bank Implementation Support - Skills Mix & Inputs
Skills Needed Planned Staff Weeks (Annual)
Planned Number of Trips (Annual)
Social Protection 16-18 2-3 Monitoring and Evaluation 6 2 Financial Management Specialist 2 2 Information Technology Consultant 3 1-2 Communications and social specialists (World Bank team, not including the directly financed TA contracts for specific communications campaign activities)
3 1-2
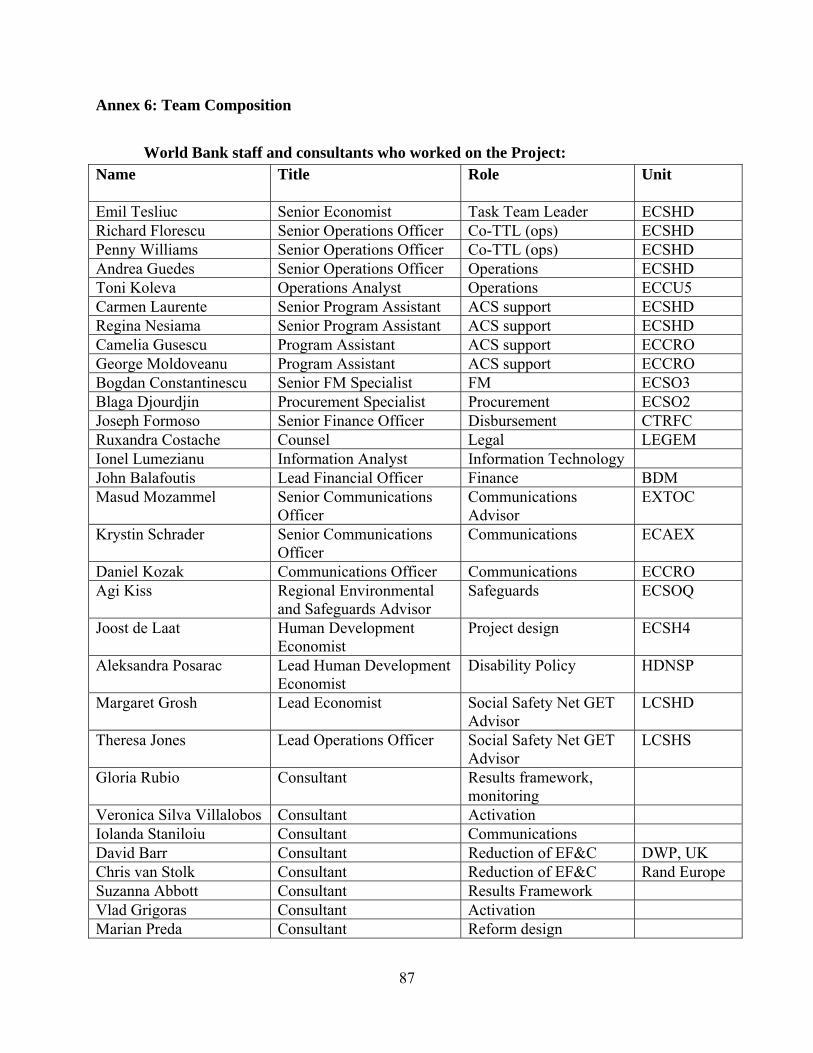
87
Annex 6: Team Composition
World Bank staff and consultants who worked on the Project:
Name Title Role Unit
Emil Tesliuc Senior Economist Task Team Leader ECSHD Richard Florescu Senior Operations Officer Co-TTL (ops) ECSHD Penny Williams Senior Operations Officer Co-TTL (ops) ECSHD Andrea Guedes Senior Operations Officer Operations ECSHD Toni Koleva Operations Analyst Operations ECCU5 Carmen Laurente Senior Program Assistant ACS support ECSHD Regina Nesiama Senior Program Assistant ACS support ECSHD Camelia Gusescu Program Assistant ACS support ECCRO George Moldoveanu Program Assistant ACS support ECCRO Bogdan Constantinescu Senior FM Specialist FM ECSO3 Blaga Djourdjin Procurement Specialist Procurement ECSO2 Joseph Formoso Senior Finance Officer Disbursement CTRFC Ruxandra Costache Counsel Legal LEGEM Ionel Lumezianu Information Analyst Information Technology John Balafoutis Lead Financial Officer Finance BDM Masud Mozammel Senior Communications
Officer Communications Advisor
EXTOC
Krystin Schrader Senior Communications Officer
Communications ECAEX
Daniel Kozak Communications Officer Communications ECCRO Agi Kiss Regional Environmental
and Safeguards Advisor Safeguards ECSOQ
Joost de Laat Human Development Economist
Project design ECSH4
Aleksandra Posarac Lead Human Development Economist
Disability Policy HDNSP
Margaret Grosh Lead Economist Social Safety Net GET Advisor
LCSHD
Theresa Jones Lead Operations Officer Social Safety Net GET Advisor
LCSHS
Gloria Rubio Consultant Results framework, monitoring
Veronica Silva Villalobos Consultant Activation Iolanda Staniloiu Consultant Communications David Barr Consultant Reduction of EF&C DWP, UK Chris van Stolk Consultant Reduction of EF&C Rand Europe Suzanna Abbott Consultant Results Framework Vlad Grigoras Consultant Activation Marian Preda Consultant Reform design
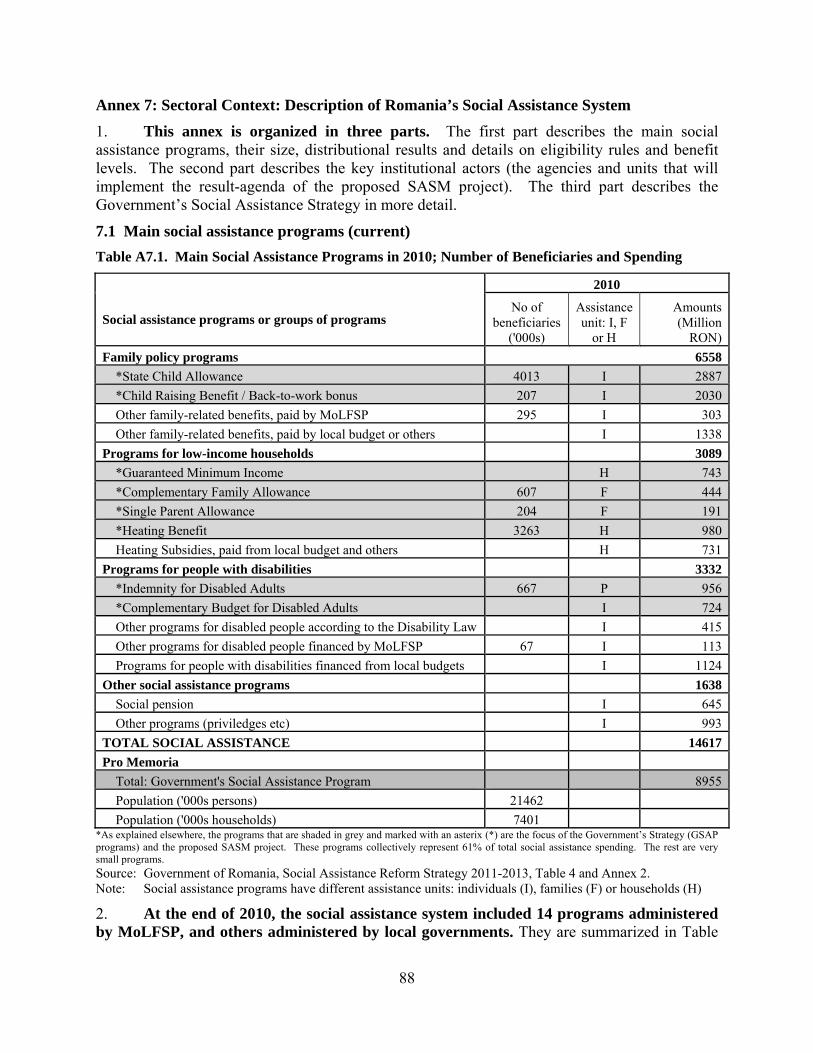
88
Annex 7: Sectoral Context: Description of Romania’s Social Assistance System
1. This annex is organized in three parts. The first part describes the main social assistance programs, their size, distributional results and details on eligibility rules and benefit levels. The second part describes the key institutional actors (the agencies and units that will implement the result-agenda of the proposed SASM project). The third part describes the Government’s Social Assistance Strategy in more detail.
7.1 Main social assistance programs (current)
Table A7.1. Main Social Assistance Programs in 2010; Number of Beneficiaries and Spending
2010
Social assistance programs or groups of programs No of
beneficiaries ('000s)
Assistance unit: I, F
or H
Amounts (Million
RON)
Family policy programs 6558
*State Child Allowance 4013 I 2887
*Child Raising Benefit / Back-to-work bonus 207 I 2030
Other family-related benefits, paid by MoLFSP 295 I 303
Other family-related benefits, paid by local budget or others I 1338
Programs for low-income households 3089
*Guaranteed Minimum Income H 743
*Complementary Family Allowance 607 F 444
*Single Parent Allowance 204 F 191
*Heating Benefit 3263 H 980
Heating Subsidies, paid from local budget and others H 731
Programs for people with disabilities 3332
*Indemnity for Disabled Adults 667 P 956
*Complementary Budget for Disabled Adults I 724
Other programs for disabled people according to the Disability Law I 415
Other programs for disabled people financed by MoLFSP 67 I 113
Programs for people with disabilities financed from local budgets I 1124
Other social assistance programs 1638
Social pension I 645
Other programs (priviledges etc) I 993
TOTAL SOCIAL ASSISTANCE 14617
Pro Memoria
Total: Government's Social Assistance Program 8955
Population ('000s persons) 21462
Population ('000s households) 7401 *As explained elsewhere, the programs that are shaded in grey and marked with an asterix (*) are the focus of the Government’s Strategy (GSAP programs) and the proposed SASM project. These programs collectively represent 61% of total social assistance spending. The rest are very small programs.
Source: Government of Romania, Social Assistance Reform Strategy 2011-2013, Table 4 and Annex 2. Note: Social assistance programs have different assistance units: individuals (I), families (F) or households (H)
2. At the end of 2010, the social assistance system included 14 programs administered by MoLFSP, and others administered by local governments. They are summarized in Table

89
A7.1; Table A7.7 provides detailed information on the benefit level and eligibility criteria for these programs; Table A7.8 provides information on the dynamics of the beneficiaries and transfers for the largest programs over 2005-2010. By their objectives and target groups, they these programs fall into four categories: family policy programs; means-tested programs for low-income households; programs for people with disabilities; and other programs (notably the social pension). Eight programs, large both in terms of beneficiary served and spending level, represent the backbone of the social assistance system (highlighted in grey and indicated with an asterix in Table A7.1 below). These eight programs account for 61 percent of the total social assistance spending. They are the focus of the Government’s Strategy for Social Assistance Reform, and represent the “Government Social Assistance Program” for the purpose of this proposed project.
3. The programs that are part of the “Government Social Assistance Program”, and their key design parameters (eligibility criteria and benefit levels) as of December 2010, are:
The State Child Allowance (SCA), a monthly cash transfer to all children age zero to eighteen (or more if still in school), with differentiated benefit levels for all children 0-2 years old (200 RON), 2-18 years old (42 RON) or children with disabilities 0 – 3 years old (200 RON) and 3-18 years old 84 RON). In Table A7.7, this is program number 1.
The Child Raising Benefit (CRB), a monthly cash transfer for the parent of a child that stays home to care for the child, equivalent to 85 percent of the average income earned over the past 12 months, capped at minimum 600 RON and maximum 4000 RON and granted until the child turns 2 years old, or 3 if disabled. In Table A7.7, this is program number 2A. Starting January 1, 2011, the parameters of this program have been modified as follows. Parents who opt for a duration of the program of 2 years receive a monthly allowance equivalent to 75 percent of the the average income earned over the past 12 months, capped at minimum 600 RON and maximum 1200 RON Parents who opt for a duration of the program of 1 year receive a monthly allowance equivalent to 75 percent of the the average income earned over the past 12 months, capped at minimum 600 RON and maximum 3400 RON. Parents who are opting for the one-year program and return to work before the end of the program are eligible for a back-to-work bonus of 500 RON per month for the second year, upon returning to work.
The Guaranteed Minimum Income (GMI) program, a monthly cash transfer that tops up family income to a GMI threshold, as described in Table 7.5. Adult members who can work are subject to work-requirement (provide work in the benefit of the community in exchange for their portion of the benefits) and activation-requirement (requirement to actively seek work with the Unemployment office). The average benefit per capita is around 60 RON per month. In Table A7.7, this is program number 10.
The Complementary Family Allowance (CFA) and Single Parent Allowance (SPA) were two income-tested benefits for poorer families with children having both, or respectively only one parent. These two programs were consolidated and replaced on January 2011 by the Family Allowance (FA) program, a monthly cash transfer to families with children that targets the children in the poorest three deciles, is subject to a means-test and, for school-aged children, to school conditionality. The new FA program pays a benefit of 30 RON for each of the first four children of families with per capita income less than 200 RON, and 25 RON for each of the first four children of families

90
with per capita income between 201-370 RON, subject to additional asset tests (see Table A8.6). Benefits are higher for families with a single parent. In Table A7.7, CFA and SPA are programs number 8 and 9, and the new FA program is number 9a.
The Heating Benefit (HB) is a seasonal cash transfer program targeted through a means-test to households from the poorest half of the population. The program operates for the winter season (November to March). It covers a share of the heating costs, with higher subsidies for household in the lower income brackets. There are three service delivery channels, depending on the type of fuel used for heating: for households connected to the central heating grid; for those heated with natural gas; and for those heating with wood, coal or crude oil fuels. The amount of subsidy varies between 19 RON and 262 RON. In Table A7.7, this is program number 21.
The Indemnity of Disabled Adults (IDA) and the Complementary Budget for Disabled Adults (CBDA) are monthly cash payments for people with disabilities, based on the severity of their disability (major, severe, and average disability). In Table A7.7, these are programs number 18 and 19.
Table A7.2. Targeting Accuracy, Coverage and Generosity of Main Social Assistance Programs in Romania (2009)
Targeting Accuracy
Coverage Generosity
Poorest 20%
Population Poorest
20% All
beneficiaries Poorest
20%
Total social assistance programs, of which:
37.7 57.5 82.2 9.3 26.2
1. Family policy / pro-natality programs State Child Allowance 33.1 52.2 74.3 4.0 10.1
Child Raising Benefit 29.1 4.0 6.2 22.7 37.2
2. Programs for LIH Guaranteed Minimum Income 81.5 3.4 14.2 19.4 23.6
Complementary Family Allowance 59.5 7.9 23.8 4.0 5.5
Single Parent Allowance 68.6 0.8 2.8 6.4 8.4
Heating Benefits 53.0 na na 18.5 40.4
3. Disability programs Benefits for People with Disabilities 35.7 4.4 8.6 15.5 25.8
4. Other social assistance programs Privileges 13.1 1.4 1.1 14.8 25.4
Social Pension 48.9 0.1 0.3 20.2 39.9
Notes:
Targeting accuracy is the transfer amount received by the group as a percent of total transfers received by the population; Program coverage is the portion of population in each group that receives the transfer; Generosity is the ratio of the transfer amount received by all beneficiaries in a group over the total welfare aggregate of the beneficiaries.; By beneficiaries we mean all direct and indirect (other household members) receiving a transfer.
Source: Own estimations based on HBS 2009. Deciles constructed based on per capita income net of transfers

91
4. The social assistance system has produced mixed results in terms of protecting the poor and vulnerable (see Tables A7.2, A7.10, A7.11, and A7.12). Targeting accuracy varies among the social assistance programs measured in the 2009 Household Budget Survey (HBS). Means-tested programs for low-income households have very good targeting accuracy (with 64 percent of targeted benefits accruing to those in the poorest quintile – for a poverty profile of the households in the poorest quintile, see table A7.9). This share is substantially higher than for categorically-targeted programs (for families or people with disabilities), which transfer about a third of their funds to the poorest quintile. Privileges are regressive, transferring fewer funds to the poorest quintile than the share of this group in the population. Overall, the targeting accuracy of the system (37.7 percent in 2009) is on the low side in the ECA region, due to the prevalence of categorically-targeted programs. The system scores high on coverage of the poor (82.2 percent of the poorest quintile receives at least one social assistance program in 2009) and generosity (social assistance programs account for 26.2 percent of the income of the poorest quintile). Five programs account for a large share of the income of the households in the poorest decile: the Child Raising Benefits, the GMI, the HB, benefits for people with disabilities and the social pension. As for the high coverage of the social assistance system, it comes primarily through the State Child Allowance and Heating Benefit programs; all others cover less than 10 percent of the population.
The targeting accuracy of means-tested programs (GMI, FA and the HA) is on par with the best last-resort programs in the region (Figure A7.1). Figure A7.1. Targeting Accuracy of Last-Resort Social Assistance Programs in ECA Region
Source: Sundaram, Kiso and Strokova "Performance of social assistance programs in Europe and Central Asia.", forthcomming
0
10
20
30
40
50
60
70
80
90
Percent of Total Benefits Received by the Poorest Quintile (%)

92
7.2 Key implementation units of the social assistance programs 5. Over the last 15 years, MoLFSP has undergone significant organizational and structural changes. During the pre-accession process, the Ministry underwent a number of changes to allow institutional harmonization with similar EU structures, developing a number of specialized agencies as: National House for Pensions, National Employment Agency, National Agency for Handicapped, National Agency for Family and Child Rights Protection, National Agency for Social Benefits, National Agency for Equality of Chances, Social Inspection and Management Authority for POSDRU. The separation of functions between policy making and executive agencies, although well intended, has resulted in poor communication and duplication of certain administrative functions.
6. In June 2010, the labor and social protection sector was restructured once again (Figure A7.2). MoLFSP was reorganized by a reduction of staff and by taking over the activities of National Agency for Persons with Disability, National Agency for Family and Child Rights Protection, National Agency for Equality of Chances and of the Social Inspection. These agencies became departments inside the MoLFSP. Labor Inspection, National House for Pensions, National Employment Agency and National Agency for Social Benefits were reorganized by a reduction of staff. As a result of this restructuring, the overall institutional structure of the labor and social protection sector, overseen by the MLFSP is as follows:

93
Figure A7.2. Organization of the Social Protection System in Romania
Source: Draft Inception Report, Functional Review 7. Following the last institutional restructuring and staff reductions, the current staffing of these institutions is presented in Table A7.3:
Table A7.3. Staffing levels in MoLFSP and Specialized Agencies, January 2011
INSTITUTUION AUTHORIZED POSITIONS - TOTAL
FROM WHICH: CENTRAL LOCAL
MoLFSP 1010 660 *) 350 National Employment Agency 2067 154 1913 National House for Pensions 3476 280 3196 National Agency for Social Benefits 1032 47 985 Labor Inspection 3236 178 3058 TOTAL 10821 1319 9502
*) The core Ministry currently has 660 authorized positions (without dignitaries and their cabinet staff) Source: Draft Inception Report, Functional Review 8. The NASB and four General Directorates within MoLFSP are key for the implementation of the Social Assistance Reform Strategy and achievement of the DLIs, as discussed in Annexes 2 and 3: (i) The National Agency for Social Benefits (NASB), which operates the Management Information System for the majority of the social assistance programs and processes payments; (ii) the General Directorate for Disabled Persons, which supervises social care centers and monitors the cash transfers for non-institutionalized disabled; and (iii) the General Directorate for Social Inspection, with the role to guard the integrity of the social
MINISTER
GENRAL DIRECTORATE POSDRU (EU funds)
DIRECTORATE FOR EQUALITY OF CHANCES
GENERAL DIRECTORATE SOCIAL INSPECTION
FOREIGN RELATIONS DIRECTORATE
STATE SECRETARYSTATE SECRETARY SECRETARY GENERAL
GE
N. D
IRE
CT
OR
AT
E F
OR
E
MPL
YM
EN
T, W
AG
ES
AN
D L
EG
ISL
AT
ION
SO
CIA
L D
IAL
OG
D
IRE
CT
OR
AT
E
SOC
IAL
IN
SUR
AN
CE
D
IRE
CT
OR
AT
E
GE
NE
RA
L D
IRE
CT
OR
AT
E
for
SO
CIA
L A
SSIS
TA
NC
E
GE
NE
RA
L D
IRE
CT
OR
AT
E
for
CH
ILD
PR
OT
EC
TIO
N
PUB
LIC
PO
LIC
IES
AN
D
CO
MM
UN
ICA
TIO
N
DIR
EC
TO
RA
TE
GE
NE
RA
L D
IRE
CT
OR
AT
E
for
PE
RSO
NS
WIT
H
DIS
AB
ILIT
IES
EC
ON
OM
IC
DIR
EC
TO
RA
TE
HU
MA
N R
ES
OU
RC
ES
DIR
EC
TO
RA
TE
PR
OJ.
MA
NA
GE
ME
NT
U
NIT
NATIONAL HOUSE OF PUBLIC PENSIONS
LABOR INSPECTION
NATIONAL AGENCY FOR SOCIAL BENEFITS
NATIONAL EMPLOYMENT AGENCY
COUNTY HOUSE FOR PUBLIC PENSIONS
TERRITORIAL LABOR
INSPECTORATE
COUNTY AGENCY FOR
SOC BENEFITS
COUNTY EMPLOYMENT
AGENCY
LOCAL HOUSES
LOCAL AGENCIES
Labor and Social Protection Organisation System in ROMANIA

94
protection system against error, fraud or poor management; and (iv) the General Directorate for Social Assistance, in charge of revising the legislation and monitoring the social assistance sector. The Table A7.4 below presents these MoLFSP social assistance structures, highlighting (in Grey color) the ones that will have significant contribution to the SASM project implementation and their current staffing. Annex 2 outlines the draft plans to improve the quality and quantity of staff.
Table A7.4. Staffing level in the key social assistance units and agencies, January 2011
DEPARTMENT/AGENCY PERSONNEL TOTAL
1. General Directorate for Social Assistance
54
1. General Directorate for Persons with Disabilities
44
3. Directorate for Child protection
47
4. Directorate for Gender Equity of Chances
16
1. General Directorate for Social Inspection
136
4. National Agency for Social Benefits
1266
TOTAL 1563 Source: Draft Inception Report, Functional Review
9. The NASB is the main operating agent for many social benefits. The National Agency for Social Benefits (NASB) is an agency subordinated to MoLFSP (established in November 2008). The NASB administers a subset of social assistance programs33. The Agency applies the policies and the strategies in the field of social assistance, in particular those related to: (i) management of cash transfer programs;; (ii) fraud and error prevention; (iii) monitoring of cash transfer payments; (iv) providing necessary information to set up the policies and strategies in social security area; and (vii) management of human and material resources in its area of activity. The NASB is organized at central level. Some 41 Territorial Agencies are subordinated entities – at county level and for Bucharest – as decentralized public services, with legal representation and their scope is to manage the social right system at territorial level.
10. A key function of NASB is to maintain a registry of beneficiaries for a subset of social assistance programs. This is done via an integrated management information system called SAFIR. SAFIR has three main components: operational system, decisional system and disaster recovery system. The operational system is a central database, accessed by territorial 33 NASB, through its SAFIR information system, manages the payment of the following social benefits: the State Child Allowance ; the Family Allowances; Monthly allowance for child placement; the Child Raising Allowance; Supplementary income for working parents for raising children until age 2; Emergency aid (for the families and the persons that are victims of the natural disasters, fires, accidents, as well as special situations as defined by law); Financial aid (for the families and the persons that are in extreme difficulty due to the health situation or other justified causes); Refundable aid for refugees; Monthly food subsidy for children and adults infected by HIV/AIDS; Allowances for persons with/without disability raising a child with/without disability, granted accordingly to the conditions of the law.

95
agencies through a Web interface. It manages approximately four million payments for about eight million final beneficiaries each month. The database offers a comprehensive picture of the different social assistance payments received by a beneficiary family, as well as the history of the transactions with that family. The decision-making module was designed to provide a concise set of indicators specific for different management levels; to generate reports and statistics; to provide data and query tools for new reports and statistics. However, it is not yet fully operational due to human and technical capacity constraints. The intension of the NASB is that this system will become operational in the next few months. The SAFIR information system is ensured in case of disaster by a National Disaster Recovery Centre.
11. Institutional Framework for Disability Policy. Romania has a strong system to support people with disabilities, operating via three channels. First, individuals who lost their ability to work while in formal employment benefit from a disability pension (cash transfer) and rehabilitation services. Second, all individuals with certain impairments but living with families or independently are entitled to disability allowances (cash transfers), free or subsidized provision of equipment to ensure their social inclusion, and rehabilitation services (including care-givers). Third, there is a system of institutionalized care. The first channel, operated by the Pension House, supports about 900,000 people (of a population of 21 million) at an annual cost of about 1 percent of GDP. The second channel is operated in a decentralized manner, and benefits about 700,000 people; the cash transfer payments only amount to 0.4 percent of GDP. The third channel includes 17,000 people in the institutionalized system. The disability system is financed through social security contributions (channel 1) and a blend of general and local government revenues (channels 2 and 3).
12. The operation of two separate channels of disability certification for non-institutionalized disabled poses a number of challenges. First, the two systems cater to the same beneficiary group, but they treat beneficiaries differently (different medical and functional criteria apply to pensioners vs. beneficiaries of allowances), have different point-of-entry into the system, and separate staff pools. The level of duplication is high, and increasing. As of 2010, about 20 percent of the disability allowance beneficiaries are also receiving disability pensions; at household-level, the level of duplication is even greater. More than half of the disability allowance beneficiaries also receive some type of pension. Second, each channel has its strengths and weaknesses. The disability allowance channel is stronger on connecting beneficiaries with rehabilitation services, including work-supports. Connecting all beneficiaries to such services will result in stronger social inclusion impacts. Decision-making in the disability pension system is supported by a nation-wide, efficient management information system; such a system is absent in the disability allowance system. The pension channel is stronger on disability certification, while the other channel is plagued by irregularities. Better gate-keeping of the disability allowance system would result in stronger confidence that the public resources go to those intended, will lower the fiscal cost and will improve sustainability of the system.
13. Overall, the operation of two channels of disability certification is inefficient for both beneficiaries and taxpayers. Beneficiaries are faced with inequitable access to rehabilitation services and higher costs in accessing the system of cash transfers and services. From the perspective of the taxpayers, the operation of two systems results in inefficient use of scarce administrative resources, higher administrative costs, poor information management that translates into poor policy-making, and poorer compliance. In addition, it does not provide all disabled people with the same set of rehabilitation services.

96
14. Harmonizing the disability certification procedures and unifying the institutional framework is high on the Government of Romania’s agenda; it is one of the objectives of the Social Assistance Strategy. The unit who will coordinate the development of the new unified institutional framework is the National Institute for Medical Expertise and Work Capacity Recovery. The new system would improve the lives of persons with disabilities: it would include an individual assessment on how to improve functioning for both types of beneficiaries (pensioners or beneficiary of allowances); it would improve the referral system to rehabilitation services; it would improve the access to the system, by reducing the cost of application and introducing a single-point of entry into the system; it would be more equitable and accurate, so that only deserving individuals would be included; and it would improve overall efficiency and effectiveness of the system.
15. To protect the social assistance system against the risk of error, fraud or corruption,34 the MoLFSP has a special unit in charge with inspections (investigations), the General Directorate for Social Inspection. This unit has small territorial units, which are reviewing ex-post the files of beneficiaries that are suspect of EFC. The Social Inspection is required by law to respond to referrals from the public, the social assistance network or based on the detection of inconsistent information in the application files with the same information stored in other public databases, a process known as cross-checking. This requirement extends to all programs under the “Government’s Social Assistance Program”. The process is known as ad-hoc inspections. In addition, it can undertake large sample inspections of a whole social assistance program at the request of the Minister of Labor, Family and Social Protection; these inspections which look at eligibility compliance are called thematic inspections. The thematic inspection typically includes a review of a large sample of beneficiaries’ files, followed by in-depth investigations for the cases determined at-risk. In the in-depth investigation, the Inspectors collect information via home visits, discussions with neighbors, employers, or – in the case of disabled people – with medical personnel. The operation of a special unit with investigative powers is considered a best-practice in the area of social protection, systems that carry out millions of relatively small payments transactions each month.
16. Starting the second half of 2010, the Social Inspection has begun a process of thematic inspections in all programs that are prone to EFC risks. These inspections include six out of the seven remaining programs under the “Government’s Social Assistance Program” between May 2010 and 2011. In 2010, the GMI, the two disability allowance programs and the Child Raising Benefit were thoroughly inspected. The inspections have resulted in the suspension or discontinuation of some benefits of beneficiaries of the GMI program and disability benefits. For the first half of 2011, two other programs – Heating Benefits and Family Benefits – are scheduled for inspection. The program not subject to this regime is the State Child Allowance (SCA), a categorical program that covers all children 0-18 years old in Romania, with
34 It is important to recognize upfront that all social assistance programs suffer from some degree of error, fraud and corruption. Of particular concern is the level of fraud and corruption (F&C). This level is typically higher in programs that have complex eligibility requirements, such as means-tested programs or disability programs. Even in OECD countries, this type of programs could exhibit rates of fraud of 5-10%, despite the strong systems and mechanisms to combat F&C and the high volume of resources used to minimize fraud and corruption (e.g. means-tested programs in the UK and the US). This rate is likely to be higher for programs operating in low capacity environments (low income countries). What is important is to put in place systems for detecting, remedying, and minimizing these irregularities.
97
one of the simplest eligibility criteria, managed and paid via the NASB SAFIR information and payment system. In the case of SCA, the Social Inspection reviews all cases with complaints, appeals, or referred by the front-line social assistance staff. These thematic inspections allow the Government to establish a baseline in terms of the cases with EFC. At the same time, the Social Inspection uses this information to develop risk-profiles, which will increase the cost-effectiveness of the inspections in the future. Starting 2012, four programs (ICR, FA, GMI, and HB) will be subject to sample based thematic inspection annually. Disability programs will be added to this inspection program once the harmonized legal and institutional framework is in place.
17. Under the proposed SASM project, the cost-effectiveness of the social assistance system to prevent, detect and deter EFC will increase, supported by technical assistance from the restructured SIP project. A summary of the key fiduciary, oversight and control mechanisms is presented in Table 3.2 in Annex 3. The MoLFSP is committed, in its Social Assistance Reform Strategy, to take concrete steps that will reduce the level of EFC in the system by (1) simplifying the social assistance system and administration (prevention); (2) improving the capacity of local government officials to verify the circumstances that determine eligibility of the applicants for social assistance benefits (prevention); (3) expanding social inspections to all programs that have a high risk of EFC (detection); (4) using the data available in the public databases operated by MoLFSP and other ministries to identify the cases potentially affected by EFC, and target EFC inspections (checks) toward these cases (detection); (5) providing sufficient resources and investigative powers for the social inspection to detect and address fraud (detection); and (6) ensuring adequate deterrence through a sanctions regime (deterrence).
18. The overall goal of the Government’s Social Assistance Strategy in the area of combating EFC is to ensure that most beneficiaries of social assistance programs will receive the right benefit, in the right amount and at the right time. During 2011-2013, the operational goal of the strategy is to put in place the key building blocks of a cost-effective strategy to fight EFC, in particular: (i) Improve the capacity of local government officials to verify the circumstances that determine eligibility of the applicants for social assistance benefits (prevention); (ii) Ensuring that all programs that are at high-risk of EFC are subject to annual inspections (detection); (iii) Gradually move from random inspections toward risk-based inspections, triggered by intelligence from within the social assistance system (referrals by staff or via cross-checking information from public databases) or from the public (via telephone and internet hotlines) (detection); (iv) Develop a cost-effective sanction regime and enforce it; (v) Ensuring adequate resources: staff, legal powers, operational costs for its detection branch, the Social Inspection. By 2013, Romania will narrow substantially the gap with other OECD countries with respect to the mechanisms and measures deployed to combat EFC, gap which is highlighted in Table A7.5.
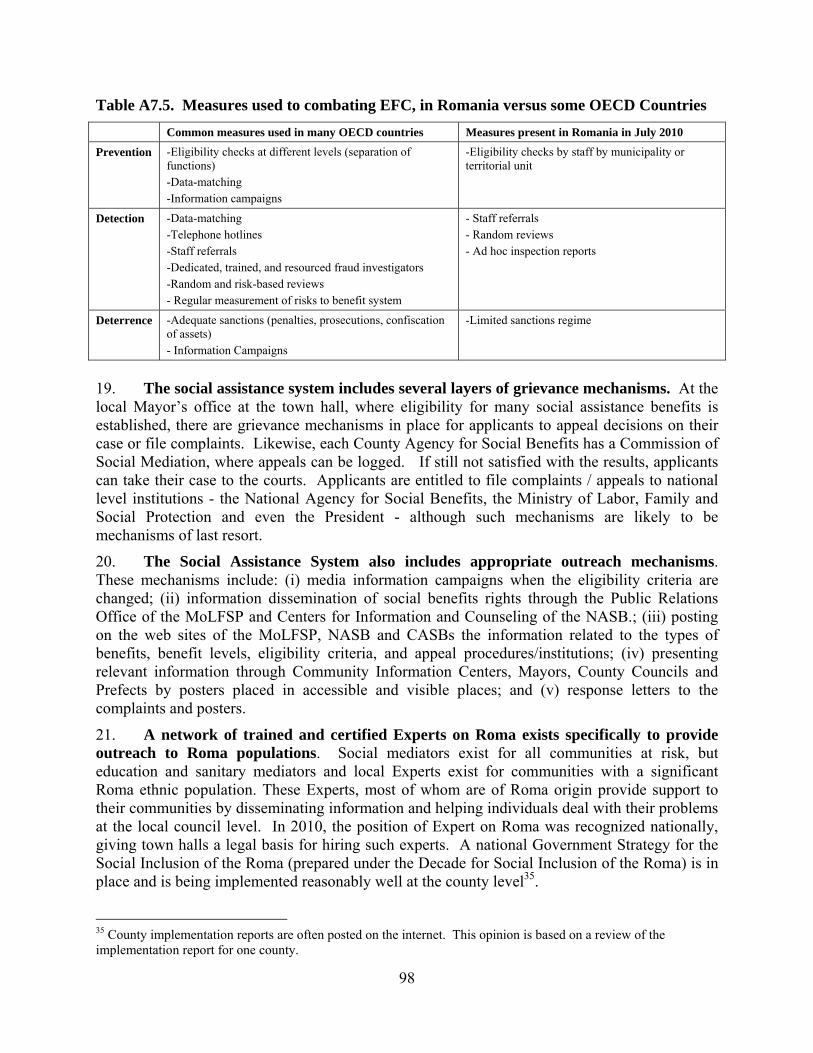
98
Table A7.5. Measures used to combating EFC, in Romania versus some OECD Countries
Common measures used in many OECD countries Measures present in Romania in July 2010
Prevention -Eligibility checks at different levels (separation of functions) -Data-matching -Information campaigns
-Eligibility checks by staff by municipality or territorial unit
Detection -Data-matching -Telephone hotlines -Staff referrals -Dedicated, trained, and resourced fraud investigators -Random and risk-based reviews - Regular measurement of risks to benefit system
- Staff referrals - Random reviews - Ad hoc inspection reports
Deterrence -Adequate sanctions (penalties, prosecutions, confiscation of assets) - Information Campaigns
-Limited sanctions regime
19. The social assistance system includes several layers of grievance mechanisms. At the local Mayor’s office at the town hall, where eligibility for many social assistance benefits is established, there are grievance mechanisms in place for applicants to appeal decisions on their case or file complaints. Likewise, each County Agency for Social Benefits has a Commission of Social Mediation, where appeals can be logged. If still not satisfied with the results, applicants can take their case to the courts. Applicants are entitled to file complaints / appeals to national level institutions - the National Agency for Social Benefits, the Ministry of Labor, Family and Social Protection and even the President - although such mechanisms are likely to be mechanisms of last resort.
20. The Social Assistance System also includes appropriate outreach mechanisms. These mechanisms include: (i) media information campaigns when the eligibility criteria are changed; (ii) information dissemination of social benefits rights through the Public Relations Office of the MoLFSP and Centers for Information and Counseling of the NASB.; (iii) posting on the web sites of the MoLFSP, NASB and CASBs the information related to the types of benefits, benefit levels, eligibility criteria, and appeal procedures/institutions; (iv) presenting relevant information through Community Information Centers, Mayors, County Councils and Prefects by posters placed in accessible and visible places; and (v) response letters to the complaints and posters.
21. A network of trained and certified Experts on Roma exists specifically to provide outreach to Roma populations. Social mediators exist for all communities at risk, but education and sanitary mediators and local Experts exist for communities with a significant Roma ethnic population. These Experts, most of whom are of Roma origin provide support to their communities by disseminating information and helping individuals deal with their problems at the local council level. In 2010, the position of Expert on Roma was recognized nationally, giving town halls a legal basis for hiring such experts. A national Government Strategy for the Social Inclusion of the Roma (prepared under the Decade for Social Inclusion of the Roma) is in place and is being implemented reasonably well at the county level35.
35 County implementation reports are often posted on the internet. This opinion is based on a review of the implementation report for one county.

99
7.3. Overview of the Government’s Social Assistance Strategy
22. The Government of Romania has embarked on a comprehensive reform of its social assistance system. The outline of the new reforms, at the level of goals and principles, was endorsed by the Government in April 2010. Since then, the MoLFSP has undertaken many measures, and has prepared a Social Assistance Reform Strategy, adopted by the Government on February 28, 2011. The Government is also developing an Action plan for the period from 2011-13, which will ensure that the Strategy would be implemented following a realistic timeframe, with clear assignation of institutional responsibilities, and with adequate resources. The Government is aiming to finalize the detailed Action Plan by March 2011.
23. The Government’s Strategy grounds social assistance reforms on clear equity and efficiency results. Specifically, the goals of the Government’s social assistance reforms include:
(i) Reducing the fiscal cost of the system; the fiscal savings as of 2013 are estimated at 0.78 percent of GDP compared to the 2010 budgeted spending. While these savings will not bring the social assistance spending levels to the 2005 level, they will bring outlays closer to the average level of spending in the new EU member states;
(ii) Consolidating the number of benefit programs to reduce fragmentation, and containing and/or reducing spending levels;
(iii)Increasing the equity of the system, by expanding the principle of granting assistance primarily to those in need;
(iv) Increasing the pro-activity of the system, by providing incentives for households to invest in the education of their children and for adults to seek and retain work;
(v) Simplifying the administration of the system; and (vi) Setting clear program objectives and monitoring their results to improve performance
management.
24. The Social Assistance Reform Strategy covers four inter-related areas: parametric reforms; improvements in the management of the information; improvements in the payment arrangements; and improvements in the use of public resources (reduction of the error, fraud and corruption in the system). To support these changes, the Strategy indentifies the key inputs to achieve its goals: the legislative and regulatory inputs; human resource needs; technical assistance and other investments.
25. Parametric reforms include merging and consolidating of programs, modifying the parameters of the programs (eligibility criteria, recertification criteria), as well as detailed implementation rules (application procedures and forms, documentary evidence, procedures for home visits).
(i) Program consolidation. During 2011-2013, the Government’s Strategy supports a reduction in the number of key programs, by consolidating the CCA and SPA into the redesigned Family Allowance program as of January 2011, further consolidating all means-tested programs into one program for low-income households in 2013, as well as the consolidation of two cash transfer programs for disabled adults (IDA and CDB) in 2013. This will result in a reduction of the number of main social assistance programs from 21 at the beginning of 2010,36 to 18 at the end of 2010, 13 in 2011 and 14 by 2013
36 In July 2010, as part of the austerity measures, the Government discontinued three smaller family policy programs.

100
(see Annex 7, Table A7.5 for a description of the social assistance programs in 2010). The number of social assistance programs in the “Government Social Assistance Program” will also fall, from 8 in 2010, to 7 in 2011 and to 4 by 2013. Table 4 illustrates the process of program consolidation, identifying the “before” and “after” composition of the social safety net.
(ii) Revised eligibility and recertification criteria as of January 2011. New legislation was adopted in December 2010 changing the eligibility rules for Family Allowances and the Child Raising Benefits. Starting in January 2011, the Government established new eligibility thresholds and benefits levels for the Family Allowance Program, which narrows the target group of the program from the poorest five to the poorest three deciles, and increases the benefit level of those in the poorest quintile and for families with more children.37 The new program also introduces a conditionality for minimum school attendance for school-aged beneficiaries. Reforms have also reduced the generosity of the Indemnity for Child Raising (ICR), both in terms of benefit levels and duration.38 Furthermore, the new legislation on Family Allowances (December 2010) and Heating Benefits (September 2010) has tightened the means-testing rules of these programs, moving from income-testing to income and asset testing, and introducing clearer and stricter rules of documenting the incomes and composition of the assistance unit, similar with the ones used by the best targeted program, the GMI. Recertification criteria for the three means-tested programs are now similar, a first step toward a full harmonization of eligibility criteria.
(iii)Further measures to revise eligibility and recertification criteria during 2012-2013. The Government’s Strategy provides for the harmonization of rules and procedures to declare and verify the household means (2011); the introduction of a unified application form for family policy programs and programs for low-income households (2013); and the harmonization of the disability assessment criteria for disability allowances and pensions, and the development of an unified institutional framework for programs for people with disability. Through this process, the access to the social assistance system will be based on a single-point-of-service approach, thus minimizing the transaction costs of the applicant, reducing the administrative costs of the system and minimizing the risk of error or fraud.
(iv) Harmonized and simplified program implementation rules. The Government’s Strategy also aims to harmonize and simplify the implementation rules, an ongoing process during 2011-2013. To simplify data entry into the NASB management information systems and reduce data entry errors, the new application forms for FAs, ICRs, HBs and GMI have been redesigned to allow scanning via Optical Character Recognition techniques.
37 As discussed elsewhere, these parametric measure were supported by the Development Policy Loan (DPL). 38 The new Child Raising Benefit (CRB) has reduced the benefit level from 85% to 75% of the income earned by the parent in the year before the child was born, and has lowered the maximum benefit level from RON 4000 (before the austerity measures) to RON 3400 if the parent chooses to stay on benefit for one year, or RON 1200 if the parent chooses to stay on benefit two years. To encourage an earlier return to work, the back-to-work bonus was increased from RON 100 to RON 500, and is given to parents who opt to return to work in less than a year in the program.

101
Table A7.6. Program Consolidation during the Social Assistance Reform Strategy 2011-2013.
2010: Configuration of Programs “Before” SASM
project (% of SA spending 2010)
2011 2012 2013: Configuration of Programs “After” SASM
project
Fam
ily
Pol
icie
s
*State Child Allowance (SCA) (20%)
SCA SCA State Child Allowance (SCA) (unified application form)
* Child Raising Benefits (24 months paid maternity leave) (14%)
CRB (modified)
CRB (modified)
Modified Indemnity for Child-raising (unified application form)
Other family-policy benefits (11%)
Other family-policy benefits
Other family-policy benefits
Other family-policy benefits (unified application form)
Sup
port
Fo
r L
ow-I
ncom
e H
ouse
hold
s
*Complementary Family Allowances (CCA) (3%)
Family benefits
Family benefits
Consolidated program for low-income households paid through single payment agency (unified application form)
*Single Parent Allowances (SPA) (1%)
*Guaranteed Minimum Income Program (GMI) (5%)
GMI GMI
*Heating Benefits (7%)
Heating Benefits
Heating Benefits
Prog
ram
s fo
r D
isab
led
(23%
of
SA
bene
fits
, of
whi
ch f
irst
two
acco
unt
for
14%
of
SA
spe
ndin
g)
*Indemnity for Disabled Adults (IDA)
IDA IDA Two largest disability benefit programs (IDA + CBD) consolidated; follow harmonized assessment criteria, unified institutional framework
*Complementary Budget for Disabled (CBD) CBD CBD
Other disability benefits (7%) Specific benefits remain but with harmonized disability and assessment criteria, unified institutional framework with single registry; and with strengthened O&C
Social Pensions & Other (20%) Social Pensions & Other Number of Key Social Assistance programs
8 7 7 4
Total 2.9% of GDP 2.1% of GDP (0.78% cost savings compared to 2010)
*As explained elsewhere, the programs that are shaded in grey and marked with an asterix (*) are the focus of the Government’s Strategy and the proposed SASM project. These programs collectively represent 61% of total social assistance spending. The rest are very small programs.
26. Parametric reforms would also be accompanied by improvements in the management of the information in the payment arrangements. This agenda is centered on the NASB, the payment agency for some of the social assistance programs. As of 2010, only four out of the eight large social assistance programs were part of the NASB, (SCA, ICR, CCA, SPA). In January 2011, NASB took over the registry and payment function for the GMI. By 2013, all eight of the primary social assistance programs (those shaded in Tables 1 and 3) or their successors will be paid via a single payment agency (NASB). The operational management information systems for disability programs (allowances and pensions) will be administered

102
outside the NASB, by the new unified disability agency, with payments processed by NASB. The separation of the eligibility determination function (local government) from the payment function will reduce the risks of fraud and error. The development of a unique management information system for the social assistance system is a key input for the development of a performance monitoring system (development scheduled for 2012). By 2013, the Strategy aims to link the performance monitoring indicators with explicit decision rules if certain indicators go out of their normal range, introducing elements of performance management in the system. This will complement and greatly expand the scope and content of the performance management contract of NASB with MoLFSP. At the same time, the development of the sector-wide management information systems will allow NASB to respond to other business needs, such as the cross-checking of information across social assistance programs to spot irregularities in the application or recertification processes.
27. A key aspect of Romania’s Social Assistance Strategy is the emphasis on strengthening mechanisms to reduce the losses from error, fraud and corruption (EFC). These measures are focused on strengthening of the Social Inspection, a specialized unit of the MoLFSP with the mandate to protect the system from EFC and to check eligibility of benefits, . The key elements of the EFC section include a set of actions aimed at: (i) prevention: ensuring sufficient checks and capacity to verify eligibility and prevent errors or fraudulent claims from entering the system; (ii) detection: ensuring sufficient resources and mandate for social inspectors to routinely review the cases that are suspect of EFC, using effective investigative techniques, intelligence from staff, the public, and other government departments; and (iii) deterrence: ensuring that a sufficiently robust sanctions regime is in place and that remedies are applied systematically to deter potential fraudulent claims on the social assistance system. To address EFC effectively, the Government’s Social Assistance Strategy aims to:
i. Simplify the social assistance system and administration (prevention); ii. Improve the capacity of local authorities to verify the circumstances that determine
eligibility of the applicants for social assistance benefits (prevention); iii. Expand social inspections to all programs that have a high risk of EFC (detection); iv. Use the data available in the public databases operated by MoLFSP and other ministries
to identify the cases potentially affected by EFC, and target EFC inspections (checks) toward these cases (detection);
v. Provide sufficient resources and mandate for the social inspection services to detect and address fraud (detection); and
vi. Ensure adequate deterrence through a sanctions regime (deterrence).
28. In terms of intended results, the Government’s Social Assistance Strategy includes a set of six objectives with associated results’ indicators. The objectives are improving the equity of the social assistance transfers; increasing the labor market participation of the social assistance beneficiaries; reducing administrative costs; reducing the level of error, fraud and corruption; improving the monitoring and evaluation capacity; and improving the quality of the human resources.

103
Table 7.7. Description of the Key Social Assistance Programs in Romania Legislative framework, benefit level and eligibility criteria
Name of the social assistance program
Frequency of
payments
Amount of the payment in 2010, RON
1.
State Child Allowance (SCA) - for disabled children
monthly 200 RON. paid for children two years old or less or to three-year olds or less if disabled
42 RON. paid for children of over two years of age and to youngsters 18 years old or more, that attend secondary schools or vocational institutions
84 RON. paid for disabled children aged over three
2. A. Child Raising Benefit (CRB), for children born before Jan 1st 2011
monthly 85% of the average income earned in the past
12 months, min. 600 RON,
max. 4,000 RON.
paid to one parent who had taxable earnings in the 12 months before the birth of the child duration: until the child turns 2 years old, or 3 if disabled.
payment of health insurance contribution for
beneficiary
accounts for 5.5% off the value of the child raising allowance and is fully paid from the state budget.
100 RON, back-to-work bonus
paid to those to get back to work and earn a professional income before the child turns 2/3 years respectively.
B. Child Raising Benefits (CRB), for children born before Jan 1st 2011 (beneficiary opts between regime A or B)
monthly Regime A. 75% of the average income earned in
the past 12 months, min. 600 RON,
max. 1,200 RON.
paid to one parent who had taxable earnings in the 12 months before the birth of the child duration: until the child turns 2 years old, or 3 if disabled.
Regime B. 75% of the average income earned in
the past 12 months, min. 600 RON,
max. 3,400 RON.
500 RON, back-to-work bonus
paid to one parent who had taxable earnings in the 12 months before the birth of the child duration: until the child turns 1 years old, or 3 if disabled. Back-to work bonus paid to those returning to work before the expiration of the 12 months, and who continue to earn a taxable income before the child turns 2/3 years respectively.
payment of health insurance contribution for
beneficiary
accounts for 5.5% off the value of the child raising allowance and is fully paid from the state budget.

104
C. Other child raising allowances
monthly 450 RON, allowance paid to people raising disabled children aged 3 - 7 years
450 RON, allowance paid to severely/accentuated disabled people raising disabled children aged 0 - 3 years who only generate the income referred to under Article 57, paragraph (4) of Law No. 448/2008 as amended and completed.
300 RON, allowance paid to severely/accentuated disabled people raising disabled children aged 3 - 7 years who only generate the income referred to under Article 57, paragraph (4) of Law No. 448/2008 as amended and completed.
300 RON, allowance paid to people raising disabled children aged 0 - 3 years who are not compliant with the conditions that are referred to used Government Emergency Ordinance No. 148/2005
150 RON, monthly aid paid to people raising disabled children aged 3 - 7years who are not compliant with the conditions that are referred to under Government Emergency Ordinance No. 148/2005.
450 RON, allowance paid to severely/accentuated disabled people raising children aged 0 - 2 years who only generate the income referred to under Article 57, paragraph (4) of Law No. 448/2008 as amended and completed.
150 RON, monthly aid is paid to major/severely disabled people raising children aged 2 - 7 years who only earn the income referred to under Article 57, paragraph (4) of Law No. 448/2008 as amended and completed.
3. Allowance for newly-born children
Once Repealed on July 2010
230 RON, is paid to each of the first four newly born children
4. Newly-born kit Once Repealed on July 2010
150 RON, paid for each newly born child
5. Placement allowance
monthly 97 RON - for disabled children this is paid as an amount increased by 50%
6. Day-care vouchers
monthly 350 RON
7. Financial support to newly weds
Once Repealed on July 2010
200 Euro, paid in RON equivalent
8. Complementary Family Allowance (CFA)
monthly Repealed on January 1st, 2011
50 RON - for families with 1 child 60 RON - for families with 2 children65 RON - for families with 3 children70 RON - for families with 4 children or more
- 470 RON / family member, maximum net monthly income for which this is paid - the allowance is increased by 25 % for GMI beneficiaries
9. Single Parent Allowance (SPA)
monthly Repealed on January 1st, 2011
70 RON - for families with 1 child 80 RON - for families with 2 children85 RON - for families with 3 children90 RON - for families with 4 children or more
- 470 RON / family member, maximum net monthly income for which this is paid

105
9a.
Family Allowance (FA): new program replacing 8 and 9 as of January 2011
monthly
30 RON - for families with 1 child 60 RON - for families with 2 children90 RON - for families with 3 children120 RON - for families with 4 children or more
0-200 RON / family member, plus asset filters - the allowance is increased by 25 % for GMI beneficiaries
monthly
25 RON - for families with 1 child 50 RON - for families with 2 children75 RON - for families with 3 children100 RON - for families with 4 children or more
201-370 RON / family member, plus asset filters
monthly
50 RON - single parents, 1 child 100 RON - single parents, 2 children150 RON - single parents , 3 children200 RON - single parents, 4 children or more
0-200 RON / family member, plus asset filters - the allowance is increased by 25 % for GMI beneficiaries
monthly
45 RON - single parents with 1 child90 RON - single parents, 2 children 135 RON - single parents, 3 children180 RON - single parents, 4 children or more
201-370 RON / family member, plus asset filters
10. Guaranteed Minimum Income (GMI) Program
monthly
This is paid on a differentiated basis to families or singles having a per family income below: 125 RON - for single-person families 225 RON - for families of 2 people 313 RON - for families of 3 people 390 RON - for families of 4 people 462 RON - for families of 5 persons 31 RON each for every person of the family above no. 5.
11. Emergency aid - from the local or state budget
Based on need
purpose - emergency situations The Government and the mayors can provide emergency aid, within the limits that are provided for in the budget in cases of necessity due to acts of God, fires, accidents.
12. Financial aid Based on need
the government can approve aid, within the limits of the funds that are approved in the budget for this specific purpose, for special situations due to a health condition or other justified causes.
13. Reimbursable aid to refugees
monthly
540 RON
14. Aid to cover a part of the funeral expenses
Based on need
Mayors can approve, in the case of a death, to give - out of the funds allocated for social aid - certain amounts of money to persons of the families that enjoy social aid, in order to cover a part of funeral expenses.
15. Monthly food allowance for HIV-infected or AIDS-affected persons
monthly adults -13 RON/day children-11 RON /day
16. Food allowance for HIV-infected /AIDS-affected children
monthly 11 RON/ day
17. Allowance for the caregiver of the visually impaired (with major disability)
monthly From: 3 July 2010 - 461 RON (allowance equal to the net salary of the junior social assistant working for a budgetary institution)
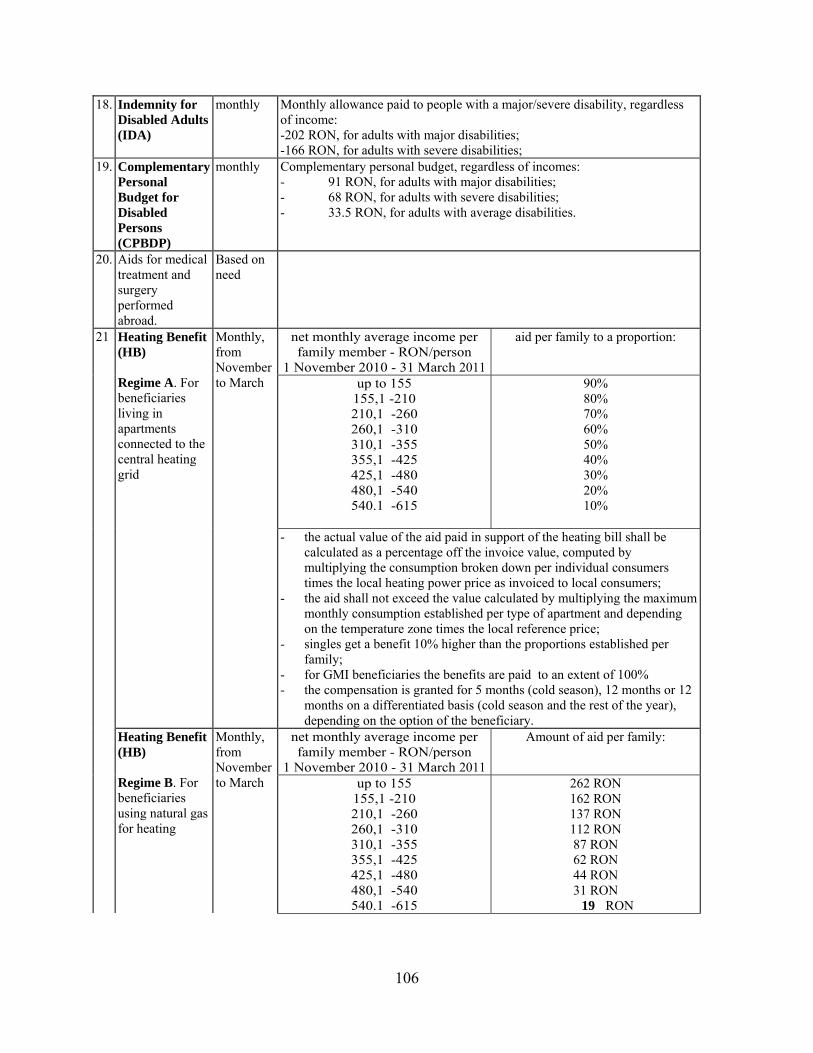
106
18. Indemnity for Disabled Adults (IDA)
monthly Monthly allowance paid to people with a major/severe disability, regardless of income: -202 RON, for adults with major disabilities; -166 RON, for adults with severe disabilities;
19. Complementary Personal Budget for Disabled Persons (CPBDP)
monthly Complementary personal budget, regardless of incomes: - 91 RON, for adults with major disabilities; - 68 RON, for adults with severe disabilities; - 33.5 RON, for adults with average disabilities.
20. Aids for medical treatment and surgery performed abroad.
Based on need
21 Heating Benefit (HB) Regime A. For beneficiaries living in apartments connected to the central heating grid
Monthly, from November to March
net monthly average income per family member - RON/person
1 November 2010 - 31 March 2011
aid per family to a proportion:
up to 155 155,1 -210 210,1 -260 260,1 -310 310,1 -355 355,1 -425 425,1 -480 480,1 -540 540.1 -615
90% 80% 70% 60% 50% 40% 30% 20% 10%
- the actual value of the aid paid in support of the heating bill shall be
calculated as a percentage off the invoice value, computed by multiplying the consumption broken down per individual consumers times the local heating power price as invoiced to local consumers;
- the aid shall not exceed the value calculated by multiplying the maximum monthly consumption established per type of apartment and depending on the temperature zone times the local reference price;
- singles get a benefit 10% higher than the proportions established per family;
- for GMI beneficiaries the benefits are paid to an extent of 100% - the compensation is granted for 5 months (cold season), 12 months or 12
months on a differentiated basis (cold season and the rest of the year), depending on the option of the beneficiary.
Heating Benefit (HB) Regime B. For beneficiaries using natural gas for heating
Monthly, from November to March
net monthly average income per family member - RON/person
1 November 2010 - 31 March 2011
Amount of aid per family:
up to 155 155,1 -210 210,1 -260 260,1 -310 310,1 -355 355,1 -425 425,1 -480 480,1 -540 540.1 -615
262 RON 162 RON 137 RON 112 RON 87 RON 62 RON 44 RON 31 RON
19 RON

107
- aid for heating with natural gas is paid in the established amounts, but not more than the value of the individual invoice or, as applicable, the expenses that are actually distributed for the amount of natural gas that is used during the cold season.
- the additional aid is directly paid to beneficiaries of natural gas heating aid and is paid from the Social Fund, which is created out of sponsorship from internal producers and distributors of natural gas, for the periods February-March and November- December.
Heating Benefit (HB) Regime C. For beneficiaries using wood, coal and crude oil fuels
Monthly, from November to March
net monthly average income per family member - RON/person
1 November 2010 - 31 March 2011
Amount of aid per family:
up to 155 155,1 -210 210,1 -260 260,1 -310 310,1 -355 355,1 -425 425,1 -480 480,1 -540 540.1 -615
54 RON 48 RON 44 RON 39 RON 34 RON 30 RON 26 RON 20 RON 16 RON
- GMI beneficiaries get aid for heating their homes during the cold season, from 1 November 2010 - 31 March 2011, of 58 RON /month.
Source: Based on Romania Social Assistance Reform Strategy, Annex 1

108
Table A7.8. Dynamics of the number of beneficiaries and budget for the main social assistance programs financed by MoLFSP, 2005‐2010
2005 2006 2007 2008 2009 2010
Social Assistance program Number of beneficiaries (thousands)
Amounts (million RON)
Number of beneficiaries (thousands)
Amounts (million RON)
Number of beneficiaries (thousands)
Amounts (million RON)
Number of beneficiaries (thousands)
Amounts (million RON)
Number of beneficiaries (thousands)
Amounts (million RON)
Number of beneficiarie
s (thousands)
Amounts (million RON)
State Child Allowance 1.517 429 1.480 447 1.481 1.262 3.724 2.543 3.835 2.841 4.013 2.887
Child Raising Benefit/ Back‐to‐work bonus 0 0 198 1.697 207 1.460 197 1.342 196 1.757 207 2.030
Other programs for children and family 65 83 251 175 286 306 271 332 271 305 295 303
Complementary Family Allowance 708 335 652 317 577 297 506 289 549 405 607 444
Single Parent Allowance 247 162 245 165 221 156 190 145 194 181 204 191
Heating Benefits 1.040 309 1.114 467 4.087 1.281 4.779 1.178 3.592 514 3.263 980
Allowance for disabled children 53 29 52 30 53 27 52 43 53 53 54 54
Indemity for raising a disabled children 0 0 0 0 1 3 3 12 4 21 6 28
Indemnity of Disabled Adults (IDA) and the Complementary Budget for Disabled Adults (CBDA) 390 674 419 811 507 1.306 590 1.682 635 1.967 667 2.095
Monthly allowance for HIV‐infected 5 14 6 16 6 23 6 28 7 31 7 31
TOTAL 2.035 4.125 6.121 7.594 8.075 9.043
Source: Government of Romania: Social Assistance Reform Strategy, Annex 2.

109
Table A7.9. Poverty profile of the poorest 5%, 10%, 15% and 20% of the population in 2009
Poverty headcount defined as: Poorest 5% Poorest 10% Poorest 15% Poorest 20%
Poverty line = 260 RON Poverty line = 332 RON Poverty line = 383 RON Poverty line = 430 RON Distribution of
population Poverty
Headcount Distribution
of poor Poverty
Headcount Distribution
of poor Poverty
Headcount Distribution
of poor Poverty
Headcount Distribution
of poor
Total 5.0 100.0 10.0 100.0 15.0 100.0 20.0 100.0 100.0 Area of residence
Urban 2.4 26.1 4.6 25.4 7.2 26.3 10.3 28.3 54.9 Rural 8.2 73.9 16.5 74.6 24.5 73.7 31.8 71.7 45.1
Macroregion North-East 6.9 24.0 15.1 26.2 23.3 26.9 29.0 25.1 17.3 South-East 6.8 17.8 12.2 16.1 18.6 16.3 25.0 16.4 13.2 South 4.5 13.6 9.6 14.6 14.4 14.7 20.6 15.8 15.3 South-West 5.9 12.5 12.6 13.3 19.8 13.9 25.8 13.6 10.5 West 4.2 7.5 6.6 5.9 8.5 5.1 11.9 5.3 8.9 North-West 4.7 11.9 9.6 12.2 13.9 11.7 19.0 12.0 12.6 Centre 4.7 11.1 9.0 10.6 12.2 9.6 16.1 9.5 11.7 Bucharest 0.7 1.5 1.2 1.2 2.7 1.9 4.3 2.3 10.4
Occupation Employee 0.5 2.8 1.5 4.5 3.2 6.1 5.5 8.1 29.2 Employer 1.5 0.1 1.5 0.0 3.4 0.0 3.4 0.0 0.2 Self-employed non-agriculture 11.5 8.5 21.4 7.9 30.7 7.6 38.3 7.1 3.7 Self-employed agriculture 14.6 24.9 29.3 24.9 40.6 23.1 50.1 21.3 8.5 Unemployed 13.4 12.2 21.5 9.8 29.8 9.0 36.6 8.3 4.5 Pensioner 1.3 6.2 3.4 8.0 6.5 10.3 9.9 11.8 23.7 Pupil, student 6.0 19.7 12.7 21.0 19.3 21.2 25.5 21.0 16.5 Housewife 10.9 11.8 20.2 10.9 28.5 10.2 37.8 10.2 5.4 Other 8.4 13.9 15.7 13.0 22.5 12.5 29.1 12.1 8.3
Ethnicity Romanian 4.1 73.9 8.7 78.7 13.7 81.9 18.5 83.4 89.9 Hungarian 3.1 3.9 7.7 4.8 11.7 4.9 16.3 5.1 6.2 Roma 36.0 20.5 52.8 15.0 63.2 12.0 73.2 10.4 2.8 Other 8.5 1.7 15.8 1.6 19.5 1.3 23.0 1.1 1.0

110
Table A7.9. Poverty profile of the poorest 5%, 10%, 15% and 20% of the population in 2009, continued
Poverty headcount defined as: Poorest 5% Poorest 10% Poorest 15% Poorest 20%
Poverty line = 260 RON Poverty line = 332 RON Poverty line = 383 RON Poverty line = 430 RON Distribution of
population Poverty
Headcount Distribution
of poor Poverty
Headcount Distribution
of poor Poverty
Headcount Distribution
of poor Poverty
Headcount Distribution
of poor
Total 5.0 100.0 10.0 100.0 15.0 100.0 20.0 100.0 100.0 Education
No formal schooling 9.4 23.6 17.4 21.9 24.0 20.1 30.7 19.3 12.6 Primary, grades 1-4 8.4 20.7 15.4 19.1 22.6 18.6 29.8 18.4 12.4 Middle, grades 5-8 7.6 32.6 15.3 33.1 22.5 32.4 29.4 31.7 21.6 Vocational 3.6 12.5 8.2 14.1 13.1 15.1 18.1 15.7 17.3 Highschool, grades 9-12 1.9 9.3 4.5 10.8 7.9 12.7 11.3 13.7 24.2 Post-secondary 0.6 0.4 0.9 0.3 1.6 0.4 2.9 0.5 3.4 Higher school 0.5 0.8 0.7 0.6 1.2 0.7 1.5 0.6 8.5
HH size 1 1.8 2.3 3.5 2.2 6.0 2.5 9.7 3.1 6.3 2 1.6 5.7 3.7 6.8 6.3 7.6 9.3 8.5 18.2 3 3.3 15.6 7.0 16.7 10.3 16.3 14.1 16.8 23.9 4 4.8 25.5 9.6 25.5 15.1 26.7 21.3 28.1 26.4 5 7.1 19.0 15.9 21.1 24.0 21.3 30.0 20.0 13.3 6 8.9 12.4 17.0 11.8 26.0 12.1 33.9 11.8 7.0 7 or more 19.9 19.5 32.3 15.8 41.3 13.5 47.8 11.7 4.9
Number of Children no children 3.3 37.5 7.0 40.0 11.0 41.9 15.3 43.6 57.1 1 5.2 24.7 9.6 23.1 14.9 23.8 19.6 23.4 23.9 2 6.5 17.4 13.9 18.7 19.8 17.7 26.5 17.8 13.4 3 or more children 18.4 20.4 32.9 18.2 45.0 16.6 54.8 15.2 5.5
Source: World Bank Staff estimations based on HBS 2009 Note: The poverty lines correspond to the income cut-offs for the 5th, 10th, 15th and 20th percentile of the per adult equivalent income distribution in 2009. Estimations performed with ADePT Poverty

111
Table A7.10 Distribution of Benefits (Targeting Accuracy)
Quintiles of per adult equivalent income, net of all
social assistance transfers Total Q1 Q2 Q3 Q4 Q5
All social protection 100.0 10.2 15.0 19.9 26.2 28.6
All social insurance 100.0 5.3 13.4 20.1 28.8 32.4
Old age pension 100.0 2.9 9.5 17.6 30.7 39.3
Disability pension 100.0 10.0 18.2 24.9 28.4 18.5
Survivor pension 100.0 12.3 24.1 27.7 22.5 13.4
Farmer pension 100.0 14.7 32.4 29.8 18.0 5.1
War veterans (including survivor) pension 100.0 13.3 15.1 20.1 32.1 19.5
All labor market programs 100.0 13.4 23.1 31.8 19.4 12.3
Unemployment benefits 100.0 14.1 23.8 32.0 19.3 10.7
Redundancy payments 100.0 2.5 13.7 28.5 19.9 35.4
All social assistance 100.0 37.7 22.5 16.5 12.9 10.3
State Child Allowance 100.0 33.1 24.1 17.7 13.7 11.5
Complementary Family Allowance 100.0 59.5 26.1 9.3 3.6 1.4
Single Parent Allowance 100.0 68.6 13.5 15.0 2.1 0.8
Child Raising Benefit 100.0 29.1 24.7 18.1 16.9 11.1
Disability Allowances 100.0 35.7 22.4 16.3 14.7 11.0
Guaranteed Minimum Income 100.0 81.5 7.9 4.0 3.6 3.1
Heating Benefits 100.0 53.0 25.0 12.8 7.8 1.2
Scholarships 100.0 27.2 15.8 18.9 17.6 20.6
Privileges for war veterans, heroes, etc 100.0 13.1 19.0 28.7 13.3 26.0
Social assistance pension 100.0 48.9 16.7 16.3 14.8 3.3
Other social assistance benefits 100.0 57.2 20.4 11.7 7.4 3.3
Source: Staff estimations based on HBS 2009 Note: Households are ranked based on per adult equivalent income distribution in 2009, net of all social assistance transfers. Benefits' incidence is the transfer amount received by the group as a percent of total transfers received by the population. Specifically, benefits'
incidence is: (Sum of all transfers received by all individuals in the group)/(Sum of all transfers received by all individuals in the population). Estimations performed with ADePT Social Protection

112
Table A7.11 Generosity of Benefits, for Direct and Indirect Beneficiaries
Quintiles of per ae consumption, net of all SA transfers
Total Q1 Q2 Q3 Q4 Q5
All social protection 38.6 43.5 39.7 40.2 41.5 33.5
All social insurance 53.1 48.4 52.1 54.1 55.0 52.0
Old age pension 55.8 51.6 50.8 54.2 57.2 57.2
Disability pension 30.5 41.9 37.6 35.1 29.6 20.8
Survivor pension 28.9 37.3 35.4 32.6 27.4 17.2
Farmer pension 28.0 37.1 38.3 28.1 20.2 13.4
War veterans (including survivor) pension 14.0 11.0 23.7 7.6 17.5 23.0
All labor market programs 27.2 42.9 32.4 29.3 23.5 16.5
Unemployment benefits 26.2 42.6 31.8 28.1 22.5 14.5
Redundancy payments 40.7 91.3 60.3 51.8 33.1 33.6
All social assistance 9.3 26.2 12.0 7.7 5.8 3.4
State Child Allowance 4.0 10.1 5.5 3.6 2.7 1.6
Complementary Family Allowance 4.0 5.5 3.5 2.6 1.9 1.3
Single Parent Allowance 6.4 8.4 4.8 4.1 3.8 1.9
Child Raising Benefit 22.7 37.2 26.5 21.3 21.4 10.6
Disability Allowances 15.5 25.8 15.9 14.9 11.9 8.2
Guaranteed Minimum Income 19.4 23.6 9.3 11.6 10.2 18.9
Heating Benefits 18.5 40.4 17.1 9.2 7.7 6.0
Scholarships 12.6 23.5 11.2 14.8 9.0 9.7
Privileges for war veterans, heroes, etc 14.8 25.4 18.7 21.3 8.9 10.9
Social assistance pension 20.2 39.9 17.1 17.4 10.3 8.9
Other social assistance benefits 11.2 14.1 10.2 8.3 7.3 7.1
Source: Staff estimations based on HBS 2009 Note: Households are ranked based on per adult equivalent income distribution in 2009, net of all social assistance transfers. Generosity is the mean value of the share transfer amount received by all beneficiaries in a group as a share of total welfare aggregate of the
beneficiaries in that group. Estimations performed with ADePT Social Protection

113
Table A7.12 Coverage of Population Groups with Social Protection Programs Quintiles of per ae consumption, net of all SA transfers
Total Q1 Q2 Q3 Q4 Q5
All social protection 84.4 91.7 89.1 86.7 83.6 71.1
All social insurance 46.0 31.8 48.5 51.8 55.3 42.7
Old age pension 29.4 11.7 26.0 33.3 41.5 34.4
Disability pension 10.2 8.2 11.1 11.9 12.3 7.7
Survivor pension 5.0 5.0 6.5 6.1 4.5 2.8
Farmer pension 9.9 10.6 14.4 13.5 8.7 2.5
War veterans (including survivor) pension 0.1 0.2 0.0 0.1 0.1 0.0
All labor market programs 4.0 3.4 5.1 6.0 3.4 1.9
Unemployment benefits 3.9 3.4 5.0 5.9 3.3 1.8
Redundancy payments 0.1 0.0 0.1 0.2 0.2 0.2
All social assistance 57.5 82.2 65.7 56.5 45.0 37.9
State Child Allowance 52.2 74.3 60.0 51.2 40.6 34.9
Complementary Family Allowance 7.9 23.8 10.0 3.8 1.5 0.6
Single Parent Allowance 0.8 2.8 0.6 0.5 0.1 0.0
Child Raising Benefit 4.0 6.2 5.1 3.8 2.7 2.2
Disability Allowances 4.4 8.6 5.5 3.1 2.8 2.0
Guaranteed Minimum Income 3.4 14.2 1.8 0.5 0.4 0.1
Heating Benefits 2.5 4.6 3.5 2.7 1.6 0.2
Scholarships 0.6 0.8 0.7 0.4 0.6 0.4
Privileges for war veterans, heroes, etc 1.4 1.1 1.4 1.4 1.4 1.4
Social assistance pension 0.1 0.3 0.1 0.1 0.1 0.0
Other social assistance benefits 1.0 3.1 1.0 0.5 0.3 0.1
Source: Staff estimations based on HBS 2009 Note: Households are ranked based on per adult equivalent income distribution in 2009, net of all social assistance transfers. Program coverage is the portion of population in each group that receives the transfer. Specifically, coverage is: (Number of individuals in the group
who live in a household where at least one member receives the transfer)/(Number of individuals in the group). Estimations performed with ADePT Social Protection

114
Annex 8: Economic Analysis of the Estimated Impacts of the Social Assistance Reform program39
1. The estimated economic and financial impacts of the proposed Project center on the expected overall outcomes generated by the strengthening of the Government’s Social Assistance (SA) System. Given that, the tools of traditional economic analysis (estimation of the internal and external rates of return of specific sub-projects) do not apply. Rather the analysis focuses on quantifying the expected impacts of strengthening the safety net system on poverty, targeting accuracy, coverage of the poor, generosity40, fiscal savings, and labor market impacts. Some final outcomes, such as the dynamics of poverty and labor market impacts, will be strongly influenced by the state of the economy, over and above the changes in the distribution of social assistance transfers. While the simulated results presented in this annex do not separate the impact of economic growth from the redistribution of social assistance funds, we do note that growth effects are likely to be small.
2. The implementation period of the SASM project coincides with a weak recovery (2011) followed by moderate growth (2012-2013) (Table A8.1). Moreover, real wages are projected to reach only 96 percent of their 2009 value by the end of 2013. The weak increase in real wages reflects the need to contain the public wage bill, to correct the large pay increases uncorrelated with productivity which occurred in the pre-crisis period. As wages represent a high share of the household incomes, wage stagnation will strongly influence the dynamics of the overall household income or consumption. Hence, the impact of economic growth on reducing poverty is moderate for the period of implementation of the proposed project.
Table A8.1. Modest Growth Prospects: By 2013, Real Wages Will Be Below Their 2009 Level Indices (compared to previous year, y.o.y.) 2009 2010 2011 2012 2013
GDP 0.981 1.015 1.044 1.042 CPI (annual average) 1.061 1.061 1.034 1.030 Nominal wage growth 1.020 1.014 1.050 1.060 Real wage growth 0.961 0.956 1.015 1.029
Source: IMF (2010, DecembeR), “Staff report for the Sixth Review under the Stand-By Arrangement”, mimeo
Overview of Key results
3. The reforms are expected to result in significant fiscal savings (Figure A8.1 and Tables A8.2 and A8.3). With the implementation of reforms under the Government’s Social Assistance Strategy and the proposed SASM project, the share of social assistance spending in GDP is projected to fall from 2.9 percent in 2010 to 2.1 percent in 2013. This will bring the social assistance spending in Romania closer to the spending levels in the new EU countries.
39 This annex was prepared by Vlad Grigoras and Emil Tesliuc, in consultation with counterparts from MoLFSP and National Statistical Institute. The estimation of fiscal savings due to the implementation of the Social Assistance Reform Strategy was undertaken by the team led by State Secretary Nicolae Ivaschescu and General Director Lacramioara Corches, MoLFSP. 40 Generosity is the ratio of the transfer amount received by all beneficiaries in a group over the total welfare aggregate of the beneficiaries.

115
Relative to its 2010 (baseline) level, the implementation of the Social Assistance Reform Strategy will reduce the relative annual cost of social assistance by 0.42 percentage points in 2011, 0.72 percentage points in 2012 and 0.78 percentage points by 2013. In 2011, the sources of fiscal savings are parametric reforms (0.16pp); reduction in the level of error, fraud and corruption (0.09pp); and the freeze of the benefit levels of most programs (0.17pp). By 2013, the largest reduction will accrue from keeping constant the nominal budget of most social assistance programs (0.62 percentage points of the total fiscal savings from the total of 0.78 percentage points). Figure A8.1. The Relative Annual Cost of Social Assistance will fall during 2010-2013
Source: Based on the Social Assistance Reform Strategy 2011-2013, Government of Romania 4. The ultimate development objective of the Government’s Social Assistance Reform Program – and the supporting proposed SASM project – is to protect the poor, while reducing the fiscal cost of the social assistance system. By 2013, the living standards of the households from the poorest quintile will improve compared to 2009, although economic growth will be modest and the overall cost of social assistance transfers will fall. The poverty headcount for the poorest 5, 10, 15 and 20 percent in 2009 will also fall, with impacts more pronounced for the poorest of the poor. A key driver for the reduction in poverty is the improvement in the equity of the social assistance spending, which is the immediate project development outcome of the proposed SASM project. Operationally, the improvement in equity (targeting accuracy) is measured by the increase in the share of social assistance funds reaching the poorest quintile of the population. Overall targeting accuracy is expected to rise from a baseline of 37.7 percent in 2009 to at least 45 percent by the end of 2013. 5. The targeting performance of means-tested programs is on par with the best programs in the region (Figure A7.1) in 2009 and will improve with reforms (Table A8.7). Over the life of the reform program, the poverty-reduction impact of means-tested programs will improve, especially after the implementation of the consolidated program for low-income households (Minimum Social Insertion Income program) through better targeting, coverage and generosity for the population from the poorest quintile. Targeting accuracy, the share of program funds that accrue to the poorest quintile, is expected to increase for these programs from an average of 64 percent in 2009 to over 80 percent in 2013. The coverage of the population from
2.862.44
2.14 2.07
0.00
0.50
1.00
1.50
2.00
2.50
3.00
3.50
2010 2011 2012 2013
% of GDP

116
the poorest quintile with means-tested programs is expected to rise from about 45 percent in 2009 to almost 60 percent in 2013. And the generosity of the last-resort program (GMI in 2009, MSII in 2013), which measures the share of the GMI transfers in the total income of beneficiary families, will go up from 24 percent in 2009 to almost 30 percent in 2013.
6. The distributional impact of the other categorical programs is moderate targeting accuracy at baseline, and is not expected to change significantly. Categorical programs do represent the large majority of funds in 2009 (79 percent) and they will still channel a majority of funds by 2013 (75 percent of social assistance spending) (Table 2). Because the social assistance mix will continue to be dominated by categorical programs, the improvement in overall targeting from all social assistance programs will be relatively modest.
7. The targeting accuracy, coverage and generosity of the overall social assistance system will also improve, but to a lesser extent (Table 9). By 2013, if the reform program is implemented as designed, we expect an increase in the overall targeting accuracy from 37.7 percent in 2009 to at least 45 percent (estimated at 49 percent in the reform scenario modeled in Table A8.10). The coverage of the poorest quintile is projected to increase from 82 percent in 2009 to over 90 percent in 2013. And the generosity of social assistance programs for beneficiaries in the poorest quintile could grow from 26 percent to over 29 percent over the same period.
8. The overall poverty impact of the proposed reforms is positive and significant (Figure A8.2 and Table A8.10). On average, the living standards of the households in the poorest quintile will improve, with proportionally stronger gains for the poorest groups. By 2013, almost all people in the poorest ventile41 in 2009 will earn more than 311 RON, the cut-off poverty line that separated this group from the rest of the population (Table A8.14). For this group, the poverty headcount is expected to fall from five percent in 2009 to 0.4 percent in 2013. Similarly, the poverty headcount for those in the poorest decile in 2009 is expected to fall to 6.8 percent in 2013. Poverty impacts are less strong for the poorest quintile, although they are positive and significant. 9. The simulation model produces conservative estimates of the impact on poverty and targeting accuracy, most likely underestimating the overall impact of the reform. As discussed in detail below, these results are based on a “partial” partial-equilibrium simulation model, and likely to bias downwards the true impacts on poverty or on targeting. The model does not take into account behavioral responses to the receipt of transfer (partial equilibrium), nor the effects of work- and school-conditionality, which in general was found to reduce poverty. Furthermore, the model does not include all the parametric changes implemented or contemplated for 2013 (such as the impact of asset tests, for example, which are progressive). Moreover, there are some known biases in the way HBS captures social assistance programs that would bias downwards the “true” impacts in terms of targeting accuracy or impact on poverty42.
41 A ventile is a quantile equal with 5 percent of the population. The poorest ventile is the poorest 5 percent of the population. 42 There are at least two sources of downward bias in the outcome indicators (poverty, targeting accuracy, labor market impacts) related to the representativity of the HBS data. First, the HBS underestimates the share of means-tested programs in overall social assistance spending. Some means-tested programs are under-estimated compared
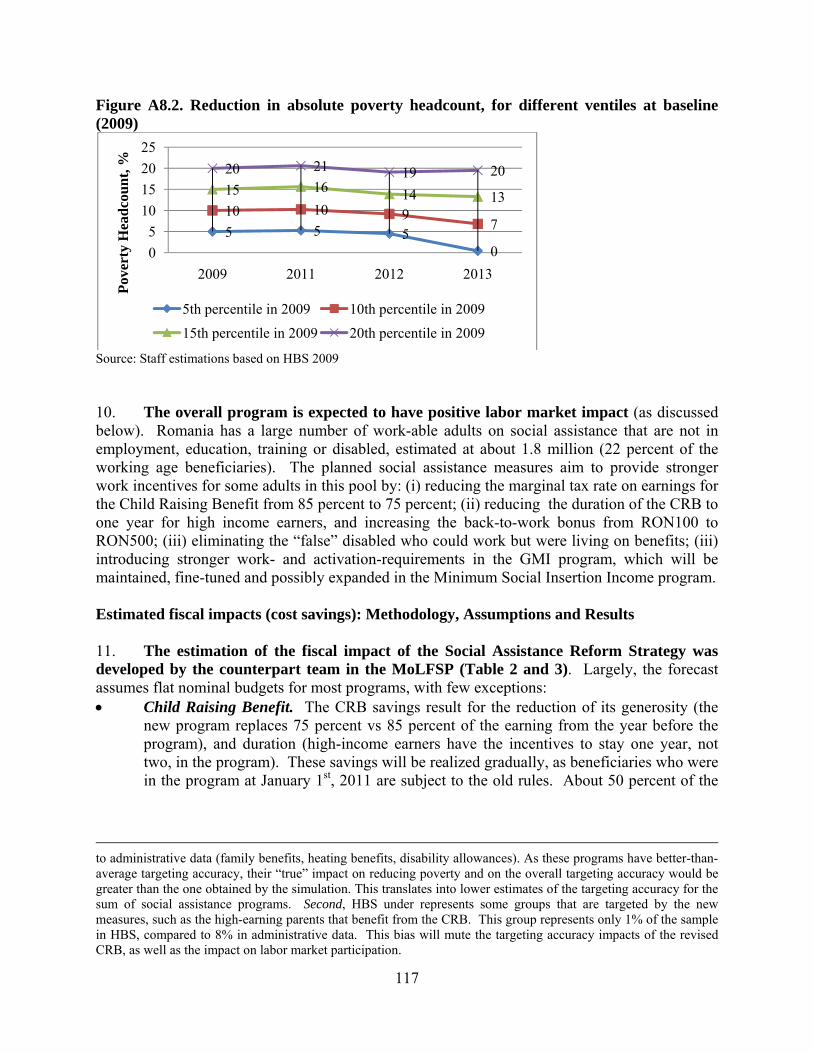
117
Figure A8.2. Reduction in absolute poverty headcount, for different ventiles at baseline (2009)
Source: Staff estimations based on HBS 2009 10. The overall program is expected to have positive labor market impact (as discussed below). Romania has a large number of work-able adults on social assistance that are not in employment, education, training or disabled, estimated at about 1.8 million (22 percent of the working age beneficiaries). The planned social assistance measures aim to provide stronger work incentives for some adults in this pool by: (i) reducing the marginal tax rate on earnings for the Child Raising Benefit from 85 percent to 75 percent; (ii) reducing the duration of the CRB to one year for high income earners, and increasing the back-to-work bonus from RON100 to RON500; (iii) eliminating the “false” disabled who could work but were living on benefits; (iii) introducing stronger work- and activation-requirements in the GMI program, which will be maintained, fine-tuned and possibly expanded in the Minimum Social Insertion Income program.
Estimated fiscal impacts (cost savings): Methodology, Assumptions and Results 11. The estimation of the fiscal impact of the Social Assistance Reform Strategy was developed by the counterpart team in the MoLFSP (Table 2 and 3). Largely, the forecast assumes flat nominal budgets for most programs, with few exceptions: Child Raising Benefit. The CRB savings result for the reduction of its generosity (the
new program replaces 75 percent vs 85 percent of the earning from the year before the program), and duration (high-income earners have the incentives to stay one year, not two, in the program). These savings will be realized gradually, as beneficiaries who were in the program at January 1st, 2011 are subject to the old rules. About 50 percent of the
to administrative data (family benefits, heating benefits, disability allowances). As these programs have better-than-average targeting accuracy, their “true” impact on reducing poverty and on the overall targeting accuracy would be greater than the one obtained by the simulation. This translates into lower estimates of the targeting accuracy for the sum of social assistance programs. Second, HBS under represents some groups that are targeted by the new measures, such as the high-earning parents that benefit from the CRB. This group represents only 1% of the sample in HBS, compared to 8% in administrative data. This bias will mute the targeting accuracy impacts of the revised CRB, as well as the impact on labor market participation.
5 5 50
10 10 97
15 16 14 13
20 21 19 20
0
5
10
15
20
25
2009 2011 2012 2013
Pov
erty
Hea
dco
un
t, %
5th percentile in 2009 10th percentile in 2009
15th percentile in 2009 20th percentile in 2009

118
caseload will be subject to new rules by the end of 2011, and almost the full caseload by end 201243.
Family Allowances. The retargeting of the FAs (from the poorest five deciles to the poorest three deciles, partially offset by higher benefits) will result in savings estimated at 214 million RON in 2011 and 2012 (compared with 2010 budget).
Guaranteed Minimum Income Program. Improved compliance in the GMI program is estimated to generate savings of 125 million RON in 2011 and 2012.
Heating Benefits. The introduction of asset filters in the Heating Benefits program has resulted in a reduction of the number of beneficiaries by 60 percent for the months of November-December 2011 (compared to the same period of 2010). The fiscal forecast takes this information into account, and assumes that the budget will halve in the 2010/2011 cold season. Estimated savings amount about 488 million RON in 2011 and 2012.
Oversight and Controls. The savings generated by reduced level of EFC in programs with complex eligibility criteria, which are prone to errors, fraud and corruption, amount to 450-500 million RON annually.
43 Parents with children with disabilities are covered by the program for three years. This group represents a small percentage of the program beneficiaries.

119
Table A8.2. Forecast of the cost of social assistance programs over 2010 – 2013* Social assistance programs or groups of programs Year Year 2010 2011 2012 2013 2010 2011 2012 2013 Amounts (million RON) % of GDP Family policy programs 6558 6323 5904 5515 1.28 1.16 0.99 0.84 State Child Allowance 2887 2999 2999 2999 0.56 0.55 0.50 0.46 Indemnity for Child Raising / Back-to-work bonus 2030 1820 1435 1068 0.40 0.33 0.24 0.16 Other family-related benefits, paid by MoLFSP 303 166 132 110 0.06 0.03 0.02 0.02 Other family-related benefits, paid by local budget or others 1338 1338 1338 1338 0.26 0.25 0.22 0.20 Programs for low-income households 3089 2263 2239 3466 0.60 0.42 0.37 0.53 Guaranteed Minimum Income 743 618 601 0 0.15 0.11 0.10 0.42 Complementary Family Allowance 444 0 0 0 0.09 0.00 0.00 0.00 Single Parent Allowance 191 0 0 0 0.04 0.00 0.00 0.00 Family Allowance 421 415 0 0.00 0.08 0.07 0.00 Heating Benefit 980 492 492 0 0.19 0.09 0.08 0.00 Heating Subsidies, paid from local budget and others 731 731 731 731 0.14 0.13 0.12 0.11 Minimum Social Insertion Income program 0 0 2735 0.00 0.00 0.00 0.42 Programs for people with disabilities 3332 3043 3043 3075 0.65 0.56 0.51 0.47 Indemnity for Disabled Adults, Complementary 956 823 823 841 0.19 0.15 0.14 0.13 Complementary Budget for Disabled Adults 724 623 623 637 0.14 0.11 0.10 0.10 Other programs for disabled people, Disability Law 415 357 357 357 0.08 0.07 0.06 0.05 Other programs for disabled people financed by MoLFSP 113 115 115 115 0.02 0.02 0.02 0.02 Programs for people with disabilities from local budgets 1124 1124 1124 1124 0.22 0.21 0.19 0.17 Other social assistance programs 1638 1640 1640 1638 0.32 0.30 0.27 0.25 Social pension 645 645 645 645 0.13 0.12 0.11 0.10 Other programs (priviledges etc) 993 995 995 993 0.19 0.18 0.17 0.15 TOTAL SOCIAL ASSISTANCE 14617 13269 12826 13694 2.86 2.44 2.14 2.09 Nominal savings: parametric reforms 884 1351 504 0.00 0.16 0.23 0.08 Nominal savings: reduced EFC 464 441 419 0.00 0.09 0.07 0.06 Pro Memoria GDP 511582 544426 599060 654429
Source: Based on Social Assistance Reform Strategy, Table 4. Note: Savings from reduction in the rate of EFC are estimates using a 2010 baseline at a rate of 10% for the program cost for the GMI, Family Allowances,
Heating Allowances, Disability allowances or the Minimum Social Insertion Income program; and of 5% for the Child Raising Benefit. *) the cost of the social assistance system is net of administrative costs.

120
Table A8.3. Fiscal savings expected from the implementation of the Social Assistance Reform Strategy
% of GDP
2010 2011 2012 2013
Total social assistance spending 2.86 2.44 2.14 2.07 Reduction in the share of SA spending compared to 2010 0.42 0.72 0.78
of which from: Parametric reforms 0.16 0.23 0.08 Reduced EF&C 0.09 0.07 0.08 Slower growth of the social assistance bill compared to nominal GDP 0.17 0.42 0.62
Source: Based on Table 2 Estimated Equity and Poverty impacts: Methodology and Results 12. Methodology. The estimates are based on a simulation model developed in consultation with Romanian counterparts (MoLFSP and National Statistics Institute). The model uses a partial-equilibrium approach, where first-round effects of parametric reforms are simulated assuming no behavioral response of households to the receipt of transfers or of specific conditionalities (work- or school- conditionality). The model simulates parametric changes of four key programs (Family Allowances; GMI, Heating Benefits and the Child Raising Benefit) and the impact of improved program compliance. For example, the simulation takes into account the fraction of irregularities detected in the GMI program, and the reduction in the number of beneficiaries of the Heating Benefit program due to strengthening documentation and verification procedures. 13. Data Sources. The source of data for the simulation model is the Household Budget Survey (HBS) 2009, a nationally representative survey that collects information on household income, consumption, household and family composition, as well as transfer income from the largest social protection programs. The HBS is a large sample cross-sectional survey with an annual sample of 31,600 households in 2009. Data is collected monthly, on subsamples of about 3,000 households. All EEP programs are covered by the survey, although the survey does not produce reliable estimates for all of them. Despite the large size of the HBS, three social assistance programs are under-estimated, namely Family Allowances, Disability Allowances and Heating Benefits (see Table 14). This has implication for the results of the simulation, as explained in paragraph 9. 14. Welfare Aggregate and Poverty Lines. For this simulation, households are ranked by and aggregated into quintiles based on household income per adult equivalent, a welfare measure preferred by the Romanian authorities. This welfare indicator is the closest to the eligibility criteria of the key programs, and will exhibit stronger sensitivity to the results sought by the Government. The income indicator is comprehensive, and includes all major income sources and consumption out of own production, and important income source in rural Romania. The adult equivalent scheme is the one used in domestic studies of poverty44. The impact on poverty
44 The number of adult equivalents (AE) depends on the number of adults and number of children. The scale assumes that the cost of a child is half of that of an adult, and an economies of scale parameter of 0.9. The formula is AE = (noadults+0.5*nochild)^0.9.

121
is determined using a set of four absolute poverty lines, corresponding to the 5th, 10th, 15th and 20th percentile of per adult equivalent income in 2009. For the rest of the forecast years, the poverty lines are inflated with CPI (see Table 4). These poverty lines help test the sensitivity of the results at different quantiles of the income distribution. Another set of sensitivity tests were performed using a different welfare aggregate (consumption). The results based on consumption were qualitatively similar with the ones reported in this annex and are not reported here.
Table A8.4. Poverty lines used in the simulation Poverty Thresholds Current RON per month per adult equivalent 2009 2011 2012 2013 CPI of the period (y-o-y) 1 1.13 1.03 1.03 Income cut-off for the 5th percentile in 2009 260 292 302 311 Income cut-off for the 10th percentile in 2010 332 374 387 399 Income cut-off for the 15th percentile in 2011 383 432 446 460 Income cut-off for the 20th percentile in 2012 430 484 500 515
Source: Own estimations based on HBS 2009
Key parametric and implementation reforms that are simulated 15. Simulations of the GMI program (2011-2012). The parameters of the GMI program are described in Annex 7, Table 7.5. Compared to 2009, two parametric changes are expected in 2011 and 2012. First, the 2011 beneficiaries were subject to an increased GMI threshold, in place since July 2009 (a trigger of the DPL1). The model simulates an increase in the GMI threshold by 15 percent for the HBS sample collected from January to June 2009. Second, the GMI threshold is adjusted with inflation in 2012, consistent with the provisions of the Social Assistance Reform Strategy. Third, we simulate the results of improved compliance following the inspections carried on by the Social Inspection (who detected about 12 percent irregularities in 2010), by selectively reducing the caseload of the program by about 10 percent during 2011-2013. In line with the results of the Social Inspection, the model takes out randomly some households with higher per adult equivalent income45. This simulation results in a lower caseload and total coverage of the program during 2011-2012 than in 2009, consistent with the fiscal forecast. 16. Simulations of the Family allowances (2011-2012). The parameters of the FA, CCA and SPA programs are described in Annex 7, Table 7.7. During 2010, Romania operated two programs for low-income households with children: the CCA and the SPA. They covered about 800,000 families with children; these families account for about 1.3 million pupils of the 3 million who are in school in grades 1 to 12. The CCA and SPA have been income-tested unconditional cash transfer programs. They offered an almost flat benefit per family (see Table 7.5 in Annex 7). Families with children were eligible for a cash transfer if their per capita monthly income was below RON 470 (roughly, this threshold corresponds to the poorest 50 percent of the population). In January 2011, these programs were replaced by a new Family
45 The sample of GMI beneficiaries is classified into five equal groups, and then some beneficiaries are dropped from the program using the following rule: 70% of those with the upper income bracket; 15% from the fourth, 10% from the thirds; 5% from the second; and 0% from the first income bracket.

122
Allowances program, targeted only to the poorest 3 deciles, based on a stronger means-test (compared to an income-test), and subject to a school attendance conditionality. Table 5 and 6 spell out the main parametric changes. We simulate the impact of the changes in eligibility threshold and benefit level; we do not simulate the impact of the introduction of the asset tests or school conditionality due to the lack of information in the HBS. Table A8.5, Parametric Changes from CCA and SPA to Family Allowance program
Group 1 2 3 4 0 - 200 RON 201 - 370 RON 371 - 470 RON 471+ RON
Before Jan 2011
Flat benefit per household
Flat benefit per household
Flat benefit per household NO benefit
After Jan 2011
(a) Benefit depends on # of children; (b) “HIGH” benefit level; (c) Benefit reduces with unexcused absences
(a) Benefit depends on # of children; (b) “LOW” benefit level; (c) Benefit reduces with unexcused absences NO benefit NO benefit
*(1) very poorest 20%, (2) poor 21%-30% (3) middle 31%-50% of income distributions (4) wealthiest >50% Table A8.6. Benefit levels for the family allowance program and the state child allowance
17. Simulations of the Heating benefits (2011-2012). The parameters of the HB program are described in Annex 7, Table 7.5. During the 2010-2011 cold season, the HB program has maintained the same nominal eligibility thresholds as in the 2009/10 season. The key parametric change, introduced by Emergency Ordinance 86/2010, was a switch from simple income test to means-testing (income and asset testing), coupled with stronger procedures for the declaration, documentation and verification of income and assets, as well as for the assistance unit. The impact of this parametric measure was substantial. According to administrative data, the number of beneficiaries applying during Nov-Dec 2010 dropped to 40 percent of their corresponding number a year ago. No other external factor that could have influenced the demand for the program has substantially changed (for example, the weather conditions or the relative price of fuels). MoLFSP counterparts believe that the large drop in caseload was the result of stronger documentation and verification procedures, and the deterrent effect of the Social Inspections done for other benefits. The simulation model takes this information into account, and reduces the number of HB beneficiaries by 40 percent in 2011-2012, using a stratified random procedure:
State Child Allowance
Type of family / allowance
# of Children \ Income bracket <200 RON 201-370 <200 RON 201-370
1 child 30 25 50 45 42
2 children 60 50 100 90 84
3 children 90 75 150 135 126
4 children or more 120 100 200 180 168
Both parents present
Family allowance
Lone parent

123
selecting 20 percent from the first and second quintiles of beneficiaries, 40 percent from the third, 50 percent from the fourth and 70 percent from the fifth quintile of beneficiaries. 18. Simulations of the Minimum Social Insertion Income program (MSII) (2013). The new consolidated program for low-income household was simulated based on parameters supplied by MoLFSP counterparts: (i) using a GMI threshold of 273 RON in 2009 purchasing power (sufficient to cover approximately 15 percent of the poorest population); and (ii) assuming a leakage rate of about 20 percent, in line with the targeting performance of the GMI and other well-targeted programs. The GMI threshold was expressed in 2013 prices based on CPI inflation. All households with a per adult equivalent income below the GMI threshold received a benefit equal to the difference between the threshold and their monetary income (variant 1, reported in this annex). Certain MSII parameters have not being simulated due to lack of information in the HBS, such as asset tests, school conditionality and work- and activation- requirements. To test the sensitivity of the results to alternative specifications of the MSII parameters, two other variants were simulated: (i) an estimation of the MSII using a higher GMI threshold and a full income concept (including consumption out of own production), to keep the same coverage of the poorest quintile as in variant 1; and (ii) an estimation were the MSII budget for 2013 was kept at the same level as the budget for income-tested programs in 2010. The results of these alternative simulations were qualitatively similar with the one reported in the annex, and are not reported. 19. Simulations of the Child Raising Benefit (2011-2013). The parameters of the CRB program are described in Annex 7, Table 7.5. The rules of the program have been changed in January 2011. During the period 2011-2013, program beneficiaries will be subject to three regimes, (a), (b) or (c). Regime (a) applies to parents with children born before Jan 1st, 2011, will be subject to the old rules of the program (grandfathering). Parents with children born after Jan 1st, 2011, are subject to regimes (b) or (c). Parents with low or moderate earnings (less than 2000 RON per month in the previous year) will opt for regime (b): they stay in the program for 2 years, with 75 replacement ratio, with a minimum 600 RON per month and a maximum of 1200 RON per month. Parents with higher earnings (more than 2000 RON per month in the previous year) will opt for regime (c): they will stay one year in the program, with 75 percent replacement rate of last year’s earnings, but no higher than RON 3400; and a back-to-work bonus of RON 500 for a second year.
20. The simulation model assumes that the age-composition of the newborn children in 2011-2013 is similar with 2009. For 2011-2013, the model keeps the structure of children in benefit as in 2009 (their age in months); for each parent, it determines the age (in months) of the child; and applies the new rules to those parents/children with children “born” after January 1st, 2011. For the simulation period, the new levels of the child raising benefits are adjusted based on the level of child benefits in 2009, the wage inflation to each year during the period 2011-2013, and the new rules. Due to the small number of parents with estimated earnings higher than 2000 RON in the previous year (parents under regime (c), less than 1 percent of the total beneficiaries), the results of the simulation on the duration of the program are insignificant. Note that the current structure of the CRB beneficiaries from administrative data includes 8 percent of higher earners (Social Inspection Report on CRB, 2011). The Romanian HBS is not representative of higher-income earners, a situation which is similar in other middle-income

124
countries. Hence, the simulated impact of the program is likely to under-estimate the fiscal savings, targeting impact and labor force impact. 21. The impact of the social assistance programs on the distribution of the transfer income was estimated with ADePT SP46, a standardized software developed by the World Bank that examines how the beneficiaries and/or benefits of social protection programs and private transfers are distributed across quintiles, deciles or other population groups. The indicators generated by the software include: (i) distribution of beneficiaries and/or benefits across quintiles/deciles and other, user-defined population groups; (ii) share of the population or population groups covered by a program or by a combination of programs; (iii) generosity of a program or a combination of programs, expressed by the ratio of the benefits in the consumption of beneficiary households; (iv) summary statistics for the progressiveness/ regressiveness of SP transfers, such as concentration coefficients, targeting differential or the distributional characteristic; (v) simulated impact of the transfers on (reducing) inequality and poverty; and (vi) estimates of the level of program overlap at household level, or the lack of coverage with such programs.
22. The estimation of the results’ indicators proceeds in few steps. First, a file with the simulated income aggregate and benefit level was produced for each of the forecast years, 2011-2013, as described above. Second, ADePT SP was used to generate the distributional indicators for 2009 and 2011-2013, such as program coverage, generosity, targeting accuracy, and impact on poverty headcount. Third, to estimate the reduction in poverty, the model uses four absolute poverty lines, set at the 5, 10, 15 and 20th percentile as of 2009 (baseline year). The use of the four poverty lines allows us to quantify the trend in poverty at different quantiles of the income distribution. The resulting change in poverty includes the effect of growth and changes in the distribution of benefits; but assumes no change in inequality, and ignores parametric changes that cannot be simulated in HBS due to lack of data – the questionnaire does not collect the information we need for simulations. Estimated Poverty and Equity Results
Means tested programs 23. Targeting accuracy, coverage and generosity of means-tested programs. Over the life of the program, the poverty-reduction impact of means-tested programs will improve, especially after the implementation of the consolidated program for low-income households (Minimum Social Insertion Income program) through better targeting, coverage and generosity for the population in the poorest quintile (see Table A8.7). Targeting accuracy, the share of program funds that accrue to the poorest quintile, is expected to increase for these programs from an average of 64 percent in 2009 to over 80 percent in 2013. The coverage of the population from the poorest quintile with means-tested programs is expected to rise from about 45 percent in 2009 to almost 60 percent in 2013. And the generosity of the last-resort program (GMI in 2009, MSII in 2013) will go up from 24 percent in 2009 to almost 30 percent in 2013. 46 For documentation and software, see www.worldbank.org/adept

125
Table A8.7. Distributional Impact of the SA Reform for Means-Tested Programs GMI Family Benefits Heating Benefits MSII
2009 2011 2012 2009 2011 2012 2009 2011 2012 2013
Targeting accuracy
Q1 81.5 87.2 89.8 59.5 75.0 73.1 53.0 59.7 59.8 81.8
Q2 7.9 5.6 5.6 26.1 21.2 22.4 25.0 24.9 24.5 13.2
Q3 4.0 2.7 1.7 9.3 3.8 4.5 12.8 9.4 10.2 4.6
Q4 3.6 2.5 1.6 3.6 - - 7.8 5.7 5.2 0.4
Q5 3.1 2.0 1.2 1.4 - - 1.2 0.3 0.3 -
Total 100.0 100.0 100.0 100.0 100.0 100.0 100.0 100.0 100.0 100.0
Coverage
Q1 14.2 13.5 14.0 23.8 26.1 26.2 4.6 3.7 3.7 59.7
Q2 1.8 1.2 1.4 10.0 8.9 9.8 3.5 2.4 2.4 11.4
Q3 0.5 0.3 0.3 3.8 1.4 1.7 2.7 1.5 1.6 3.3
Q4 0.4 0.1 0.2 1.5 - - 1.6 0.8 0.7 0.2
Q5 0.1 0.1 0.1 0.6 - - 0.2 0.0 0.0 -
Total 3.4 3.0 3.2 7.9 7.3 7.5 2.5 1.7 1.7 14.9
Generosity
Q1 23.6 20.6 25.3 5.5 5.7 6.1 40.4 39.3 37.6 29.4
Q2 9.3 7.4 8.3 3.5 2.9 3.1 17.1 16.8 15.9 14.2
Q3 11.6 8.9 7.8 2.6 2.7 2.9 9.2 8.2 7.8 12.8
Q4 10.2 17.0 10.8 1.9 n.a. n.a. 7.7 7.7 7.0 11.0
Q5 18.9 11.1 13.3 1.3 n.a. n.a. 6.0 5.8 5.4 n.a.
Total 19.4 17.8 21.4 4.0 4.6 4.8 18.5 20.2 19.1 24.3 Notes:
Targeting accuracy is the transfer amount received by the group as a percent of total transfers received by the population; Program coverage is the portion of population in each group that receives the transfer; Generosity is the ratio of the transfer amount received by all beneficiaries in a group over the total welfare aggregate of the beneficiaries.; By beneficiaries we mean all direct and indirect (other household members) receiving a transfer.
Source: Own estimations based on HBS 2009. Deciles constructed based on per capita income net of transfers
Child Raising Benefit
24. Other categorical programs, with moderate targeting accuracy, are not expected to change their distributional impact (State Child Allowance) or will do so only marginally through the effect of improved compliance, assumed progressive (Disability allowances, CRB) (see Table A8.8). These programs do represent the large majority of funds in 2009 (79 percent) and they will still channel a majority of funds by 2013 (75 percent of social assistance spending) (see Table 2). Because the social assistance mix will continue to be dominated by categorical programs, the overall improvement in targeting is relatively modest (see paragraph 25).

126
Table A8.8. Distributional Impact of the SA Reform for Child Raising Benefits Population Targeting accuracy Coverage Generosity
Group 2009 2011 2012 2013 2009 2011 2012 2013 2009 2011 2012 2013
Q1 29.1 28.1 27.2 27.3 6.2 5.9 5.8 5.8 37.2 31.9 31.4 32.6 Q2 24.7 24.4 24.4 24.6 5.1 5.0 4.9 4.9 26.5 22.1 21.9 22.7 Q3 18.1 19.3 20.2 20.4 3.8 3.9 4.1 4.1 21.3 17.7 17.2 18.0 Q4 16.9 17.0 17.1 16.5 2.7 2.7 2.7 2.6 21.4 17.4 16.9 17.2 Q5 11.1 11.3 11.2 11.2 2.2 2.2 2.2 2.2 10.6 8.4 8.1 8.4 Total 100.0 100.0 100.0 100.0 4.0 4.0 4.0 3.9 22.7 18.6 18.0 18.7
Notes: Targeting accuracy is the transfer amount received by the group as a percent of total transfers received by the population; Program coverage is the portion of population in each group that receives the transfer; Generosity is the ratio of the transfer amount received by all beneficiaries in a group over the total welfare aggregate of the beneficiaries.; By beneficiaries we mean all direct and indirect (other household members) receiving a transfer.
Source: Own estimations based on HBS 2009. Deciles constructed based on per capita income net of transfers
All social assistance programs
25. Overall targeting accuracy, coverage and generosity of the social assistance system (see Table A8.9). By 2013, in the program is implemented as designed, we expect an increase in the overall targeting accuracy from 37.7 percent in 2009 to over 45 percent (49.8 percent in the scenario illustrated in Table 947). The improvements in targeting accuracy in the previous two years are, however, modest. This underscores the importance of the introduction of the consolidated program in 2013, with adequate preparation (simulation, piloting activities during 2011 and/or 2012, including, as agreed under the proposed project, better data collection in HBS). The coverage of the poorest quintile is projected to increase from 82 percent in 2009 to over 90 percent in 2013. And the generosity of social assistance programs for beneficiaries in the poorest quintile could grow from 26.2 percent in 2009 to 29.4 percent in 2013.
47 The targeting accuracy for variant 1, reported in the main text, is estimated to rise to 49.8% in 2013. For the variant 2, where the identification of beneficiaries is based on monetary income and consumption from own production (a full income concept), the targeting accuracy was estimated at 49.3%. In variant 3, where we keep the budget of the MSII program constant to the sum of means-tested programs in 2010, the targeting accuracy raises to 46.5%.

127
Table A8.9. Distributional Impact of the SA Reform for All Social Assistance Programs Population Targeting accuracy Coverage Generosity
Group 2009 2013 2009 2013 2009 2013
Q1 37.7 49.8 82.2 93.3 26.2 29.4 Q2 22.5 19.3 65.7 68.8 12.0 10.4 Q3 16.5 13.5 56.5 56.8 7.7 6.7 Q4 12.9 9.5 45.0 44.8 5.8 4.6 Q5 10.3 7.9 37.9 38.2 3.4 2.8
Total 100.0 100.0 57.5 60.3 9.3 9.5 Notes:
Targeting accuracy is the transfer amount received by the group as a percent of total transfers received by the population; Program coverage is the portion of population in each group that receives the transfer; Generosity is the ratio of the transfer amount received by all beneficiaries in a group over the total welfare aggregate of the beneficiaries.; By beneficiaries we mean all direct and indirect (other household members) receiving a transfer.
Source: Own estimations based on HBS 2009. Deciles constructed based on per capita income net of transfers
Estimated Poverty Impacts
26. The impact on poverty is determined using a set of four poverty lines and an absolute poverty measurement. The poverty lines correspond to the 5th, 10th, 15th and 20th percentile of per adult equivalent income in 2009, and are inflated with CPI for the rest of the forecast years. The level of the nominal poverty line is presented in Table 2. These poverty lines help test the sensitivity of the results at different quantiles of the income distribution. Another set of sensitivity tests were performed using a different welfare aggregate (consumption), but the results are not reported in the annex. The results based on consumption were qualitatively similar with the ones reported in this annex. 27. The overall poverty impact of the proposed reforms is positive, with higher gains for the poorest of the poor (Table A8.10, attached). There are larger poverty gains for the very destitute (for those households who were below the cut-off for the 5th percentile in 2009) or the poorest decile from 2009, and more modest gains for the second decile. Table A8.10. Estimated reduction in poverty headcount against four poverty lines, 2009-2013
Absolute Poverty Thresholds
Poverty headcount, % of total population
2009 2011 2012 2013 Reduction 5th percentile in 2009 5.0 5.3 4.5 0.4 4.6 10th percentile in 2009 10.0 10.3 9.2 6.8 3.2 15th percentile in 2009 15.0 15.7 13.9 13.3 1.7
20th percentile in 2009 20.0 20.6 19.1 19.5 0.5 Source: Staff estimations based on HBS 2009 Note: The poverty lines correspond to the income cut-offs for the 5th, 10th, 15th and 20th percentile of the per adult
equivalent income distribution in 2009.

128
Labor market impacts of the social assistance reform 28. The overall program is expected to have positive labor market impact. This assertion is based on two elements. First, at the beginning of the reform, in 2010, Romania had a complex and costly social assistance system (paragraph 28), with a large share of adults that were not in employment, education, training or disabled (NEETD) receiving cash transfers (paragraph 29-31). Many of the conditions that trigger work disincentives in social assistance programs were present, at least for a subgroup of beneficiaries and programs (paragraph 32). Second, many of the measures supported by the Social Assistance Reform Strategy reduce the “dependency trap,” such as the parametric changes that reduce the marginal tax on earnings for CRB, the stronger work- and activation requirements for GMI and MSII, and the improved compliance that will remove the “false disabled” beneficiaries out of the program and (presumably) into work. 29. Romania has a complex social assistance system that has become more complex and more costly over time. Social assistance spending rose from about 1.4 percent to 2.9 percent of GDP from 2005 to 2010 mainly due to: the introduction of new programs of pro-natality programs (which added 0.45 percent of GDP to the social assistance bill); an increase in the generosity, eligibility and scope of disability allowances (adding another 0.3 percent of GDP); and increased eligibility thresholds for three income tested programs - complementary family allowance, lone parent allowance, and seasonal heating allowance (adding another 0.1 percent of GDP). Figure A8.3. Factors that determine the extent to which social assistance transfers cause work disincentives and dependency
30. The increase in the number and generosity of benefits could generate work disincentives. From a theoretical perspective, a social assistance program (or group of
Generosity
Beneficiary
household
with supply of labor
Marginal tax rate
on earnings

129
programs) could reduce the supply of labor of beneficiaries if the following conditions apply (see Figure A8.3):
The beneficiary household has supply of labor. Simplifying, this means that the beneficiary of the social assistance program should be of working age but in the NEETD group.
The benefit provided by the program should be large enough to allow the beneficiary (and his family or household) to “live of benefit”. A proxy for this factor is the generosity indicator: the ratio of benefit to the consumption or income of the beneficiary households (ranges from 0 to 1). Higher generosity implies stronger disincentives to work. To identify the share of households that depend of benefits for their household income, we quantify the share of social assistance beneficiaries where the share of social assistance income(s) represents more than 25 percent or 50 percent of the total household income. As a rule of thumb and simplifying a little bit, a generosity indicator in excess of 0.25 indicates that one spouse earns in benefits at least a third of the income of the other spouse. A generosity indicator at or above 0.5 indicates that one spouse earns benefits equal or greater to the rest of the earnings of the household.
The marginal tax rate (MTR) on earnings implicit in the eligibility formula, which indicates the value of benefits lost when earnings go up by one monetary unit. The MTR will typically range from 0 to 100 percent, although certain eligibility conditions may results in values that are larger than 1 (for example, when moving from assistance to work results in the loss of benefits, larger than the amount earned). Positive MTRs are found in all income- or means-tested programs. Higher values of MTR indicate les incentives to work. For example, a simple GMI program that reduces the value of benefits at par with any extra earnings has 100 percent MTR, and would discourage work. Note that the Romanian GMI has a number of features that mitigate this effect.
31. The current conditions which could trigger a reduction of work effort for social assistance beneficiaries do apply to a large number of people in Romania. First, the pool of working age individuals (with ages between 15 and 64) who receive, directly or indirectly, social assistance transfers is large: 8.3 million persons out a total of 15 million. A large segment of these are NEETD beneficiary adults: 1.8 million, or 22 percent of the total number of adults that receive social assistance transfers. Second, a number of social assistance programs are, in fact, income-replacement program offering generous benefits. For example, the child raising allowance replaces 75 percent of the last year earnings, and provides entitlement to other benefits for young children; it represents half of the income of the households from the poorest decile. Other allowances with high generosity levels for the beneficiaries in the poorest deciles are the heating allowances (a generosity of 54 percent); the disability allowances (31 percent) and the GMI (26 percent). Third, some individual-level benefits are offered on condition that the beneficiary will not work, which has strong work disincentive effects (high MTR). For example, the CRB is an income-replacement benefit that is conditional of parent caring the child, i.e. conditional of not working. The GMI has an implicit marginal tax rate on earnings (close to 100 percent in the case of GMI). Moreover, the negative impact of all social assistance benefits could be compounded at family of household level, given the possibility to accumulate numerous benefits.

130
32. The current pool of beneficiaries of working age who are not working, but depend on social assistance benefits is quite large (Table A8.11). In 2009, about 22 percent of the working age beneficiaries of social assistance was “Not in Employment, Education, Training or Disabled” (NEETD) (1.8 million individuals). This number is driven by the large number of NEETD adults benefiting from the State Child Allowance (about 1.6 million), but there is a sizeable number of such adults in the other programs. A large segment of NEETD adults exhibit characteristics similar with those in employment: 45.5 percent of them live in urban areas, where labor demand is stronger; only a small minority of them are single parents (0.7 percent); 63 percent of them have ages between 25 and 44 years old, the age-groups with the highest employment rate; 60 percent of them have at least vocational or high-school education; 36 percent of them have earnings that situated them in the upper 60 percent of the income distribution. 33. A large fraction of NEETD adults live in households that currently derive a substantial share of income from social assistance benefits; and a fair share of them are not poor (Tables A8.12 and A8.15). As shown in Table 12 below, the share of households that derive more than 25 percent of their income from transfers is high for a large fraction of the Child Raising Benefits, Heating Benefit and the GMI. In a family with two earners, this is equivalent with having the second earner with a third of the wage of the primary earner; this level of generosity may deter that spouse from working. Table 15 quantifies the fraction of NEETD beneficiary adults that live in households where more than half of the income comes from social assistance transfers, and extreme form of dependency. A smaller number of adults are in this category, and they are concentrated in the Heating Benefit program. However, considering the high number of NEETD adults, rates between 10 to 20 percents in the Heating Benefit, Child Raising Benefit and the GMI programs amount for a large number of NEETD adults living on benefits. 34. Summarizing the descriptive analysis, we found three social assistance programs where the conditions that could trigger work disincentive are all present: the CRB, HBs, and the GMI. (Table A8.13). For these programs, the introduction of policy measures that provide stronger incentives to work, as are those introduced or planned in the Social Assistance Reform Strategy, are likely to be effective. 35. The overall Social Assistance Reform Program is expected to have positive labor market impacts. The planned social assistance measures aim to provide stronger work incentives for some of this pool of adults: (i) the implicit marginal tax rate one earnings for the Child raising benefit was reduced from 85 percent to 75 percent, the duration of the program was reduced to one year for high income earners, and the back-to-work bonus was increased from RON100 to RON500; (ii) some of the “false” disabled who could work but were living on benefits would be encouraged to seek work; (iii) stronger work- and activation-requirements have been introduced in the GMI program, and will be maintained, fine-tuned and possibly expanded in the Minimum Social Insertion Income program.

131
Table A8.11: Profile of the NEETD Adults, based on their Distance from the Labor Market
Source: Staff estimations based on HBS 2009 Notes: Adults are people with ages between 15 and 65 (ILO definition).
NEETD adults are those who are not in employment, education, training or have a disability. Social assistance beneficiaries include both direct and indirect beneficiaries (those who live in households where at least one person receives social assistance).
Total Social Assistance GMI
Family Allowances
Child Raising Benefit
Heating Benefits
State Child Allowance
Total SA beneficiaries (direct, indirect) 12,343,275 730,806 1,860,249 857,374 546,063 11,210,038Total beneficiary adults (15-64 years old) 8,306,858 460,419 1,080,486 521,356 383,009 7,543,853Total NEETD beneficiary adults 1,796,543 194,350 349,488 250,133 93,405 1,635,395 % NEETD adults beneficiaries in total adult beneficiaries 21.6 42.2 32.3 48.0 24.4 21.7
Total NEETD Adult Beneficiaries, of which 100.0 100.0 100.0 100.0 100.0 100.0Area of residence
Urban 45.5 23.6 19.2 65.0 70.7 45.4Rural 54.5 76.4 80.8 35.0 29.3 54.6
Single ParenthoodLone-adults raising children 0.7 2.2 1.1 0.8 0.8 0.8Others 99.3 97.8 98.9 99.2 99.2 99.2
Age group15-24 19.0 24.2 19.8 15.9 13.7 19.025-34 37.4 32.7 40.8 62.9 25.9 39.135-44 25.9 21.0 25.4 15.6 35.1 27.145-54 11.4 13.6 7.1 3.8 16.8 9.855-64 6.3 8.6 6.8 1.8 8.5 5.1
Education LevelNo formal schooling 2.9 11.3 3.3 0.3 1.4 2.6Primary, grades 1-4 7.7 24.8 9.8 2.4 7.4 7.2Middle, grades 5-8 29.7 43.1 42.9 17.3 22.4 29.3Vocational/apprentice 22.4 11.7 21.4 15.5 26.1 22.4High school, grades 9-12, incl. lower high school 30.4 8.3 21.4 35.9 35.3 31.6Post-secondary or foremen's school 1.9 0.6 0.5 6.0 2.2 1.9Higher school, short and long term 5.0 0.3 0.6 22.7 5.3 4.9
Economic StatusUnemployed 25.7 26.0 13.2 8.4 46.5 24.7Housewife 39.8 37.5 40.4 7.9 44.4 41.0Family-help agriculture 20.8 27.8 42.6 2.8 4.5 20.4Family help non-agriculture 0.3 0.2 0.4 0.0 0.0 0.3Member of a cooperative/association 0.0 0.2 0.0 0.0 0.0 0.0Out of labor force, child raising 11.2 1.3 2.8 80.6 3.7 11.9Others. not disabled 2.0 6.9 0.6 0.3 0.9 1.8
Quintiles of per adult equivalent incomeQ1 38.3 79.4 52.5 9.2 22.6 37.6Q2 25.0 14.1 27.9 16.7 35.7 24.9Q3 17.2 3.1 13.3 20.3 23.8 18.0Q4 11.7 2.3 5.2 26.1 11.7 11.8Q5 7.8 1.1 1.1 27.7 6.1 7.7
Sample size (no of NEETD) 4.639 582 904 531 308 4080
Profile of NEETD Adult Beneficiaries

132
Table A8.12: Profile of the NEEDT Adults ("Dependence on Social Assistance Incomes")
Source: Staff estimations based on HBS 2009 Notes: Generosity is the share of social assistance income(s) in the total income of the beneficiary household.
Adults are people with ages between 15 and 65 (ILO definition). NEETD adults are those who are not in employment, education, training or have a disability. Social assistance beneficiaries include both direct and indirect beneficiaries (those who live in households where at least one person receives social assistance).
Total Social Assistance GMI
Family Allowances
Child Raising Benefit
Heating Benefits
State Child Allowance
Total beneficiaries (direct, indirect) 13.3 21.3 5.0 31.1 25.3 3.8Total beneficiary adults (15-64 years old) 12.1 21.3 4.9 30.5 24.7 3.3Total beneficiary NEETD adults 18.2 23.5 5.3 32.3 31.8 3.6
Total NEETD beneficiaries 26.6 37.4 0.2 69.0 49.6 2.2of which:
Urban 27.4 41.5 0.0 65.3 44.8 1.1Rural 26.0 36.1 0.2 75.7 61.1 3.2Lone-adults raising children 48.6 61.5 0.0 47.7 22.7 12.5Others 26.5 36.8 0.2 69.1 49.8 2.215-24 26.2 28.6 0.0 72.8 53.7 3.225-34 32.6 40.3 0.5 69.3 42.2 2.835-44 22.7 44.0 0.0 67.0 56.2 1.845-54 19.4 34.9 0.0 50.9 41.6 0.655-64 21.4 38.7 0.0 78.5 53.8 0.0No formal schooling 52.0 56.1 0.0 100.0 69.7 6.7Primary, grades 1-4 40.7 43.8 0.0 100.0 61.9 3.8Middle, grades 5-8 26.4 33.9 0.4 82.5 56.7 4.0Vocational/apprentice 19.0 20.4 0.0 80.6 57.8 1.4Highschool, grades 9-12, incl. lower HS 21.9 38.4 0.0 64.7 40.0 0.9Post-secondary or foremen's school 40.0 0.0 0.0 65.1 44.3 0.0Higher school, short and long term 49.8 0.0 0.0 54.8 22.1 0.2Unemployed 21.2 49.9 0.0 73.0 49.5 1.6Housewife 18.5 33.4 0.5 79.7 51.7 3.0Family-help agriculture 15.8 26.4 0.0 78.9 52.8 1.5Family help non-agriculture 5.3 57.6 0.0 0.0Member of a cooperative/association 0.0 0.0 0.0Out of labor force, child raising 85.7 0.0 0.0 67.0 29.7 2.4Others. not disabled 41.7 63.4 0.0 100.0 10.9 1.9Q1 32.0 44.1 0.4 98.9 81.5 5.7Q2 19.9 14.6 0.0 95.4 57.8 0.4Q3 18.3 5.8 0.0 76.9 32.4 0.0Q4 30.1 0.0 0.0 65.0 23.8 0.0Q5 34.6 8.3 0.0 41.0 0.0 0.0
Sample size (no of NEETD) 4.639 582 904 531 308 4080
Average Generosity of Transfers
% NEETD Beneficiaries Dependent on Social Assistance Income (Generosity > 25% )

133
Table A8.13: A subset of social assistance programs have potential benefit dependency issues
Number of Beneficiaries (Direct and indirect): Dependence Marginal
Tax
Total Adults NEETD
Adults
(% NEETD
adults)on transfers
Generosity>25% Rate on
Earnings* 1 2 3 4 = 3/2 5 6 Total Social Assistance 12,343,275 8,306,858 1,796,543 22
of which: State Child Allowance 11,210,038 7,543,853 1,635,395 22 Low 0 Family Allowances 1,860,249 1,080,486 349,488 32 Low Moderate Child Raising Benefit 857,374 521,356 250,133 48 High High GMI 730,806 460,419 194,350 42 Moderate Moderate Heating Benefits 546,063 383,009 93,405 24 High Moderate
Pro-Memoria Nr of Adults (15-64 years old) 21484287 15028172 2881699 19
Source: Staff estimations based on HBS 2009 Notes: Programs highlighted in gray are likely to suffer from benefit dependency issues.
Generosity is the share of social assistance income(s) in the total income of the beneficiary household. Adults are people with ages between 15 and 65 (ILO definition). NEETD adults are those who are not in employment, education, training or have a disability. Social assistance beneficiaries include both direct and indirect beneficiaries (those who live in households where at least one person receives social assistance).
Table A8.14. Representativity of Social Assistance Programs in the HBS 2009 (Representative programs in bold) Social assistance program: Administrative data Household Budget Survey
No of beneficiaries,
monthly average No of beneficiaries 95% Confidence
Interval Assistance
Unit Child Raising Benefit 195,980 201,197 177.155 - 225.239 P Complementary Family Allowance 548,579 351,093 301.543 - 400.643 F Single Parent Allowance 193,958 39,175 29.732 - 48.618 F Guaranteed Minimum Income 221,603 194,032 165.839 - 222.226 H State Child Allowance 3,888,014 4,276,172 4.076.569 - 4.475.774 P Disability Allowances 526,285 292,583 263.818 - 321.347 P Heating Allowance* 2,356,355 1,310,551 1064974 - 1556131 H
* Administrative data are for the cold season 2009-2010. Survey estimates are obtained by adjusting upwards the number of beneficiaries extrapolated from HBS 2009 by a factor of 12/5, to reflect the fact that the programs operates only 5 months per year (from November to March).

134
Table A8.15: Profile of the NEEDT Adults ("Dependence of Social Assistance Incomes")
Source: Staff estimations based on HBS 2009 Notes: Generosity is the share of social assistance income(s) in the total income of the beneficiary household.
Adults are people with ages between 15 and 65 (ILO definition). NEETD adults are those who are not in employment, education, training or have a disability. Social assistance beneficiaries include both direct and indirect beneficiaries (those who live in households where at least one person receives social assistance).
Total Social Assistance GMI
Family Allowances
Child Raising Benefit
Heating Benefits
State Child Allowance
Total beneficiaries (direct, indirect) 13.3 21.3 5.0 31.1 25.3 3.8Total beneficiary adults (15-64 years old) 12.1 21.3 4.9 30.5 24.7 3.3Total beneficiary NEETD adults 18.2 23.5 5.3 32.3 31.8 3.6
Total NEETD beneficiaries 8.6 5.1 0.0 10.9 18.0 0.1of which:
Urban 7.4 2.5 0.0 12.0 14.5 0.0Rural 9.6 5.9 0.0 8.9 26.6 0.3Lone-adults raising children 27.5 13.6 0.0 15.8 22.7 0.0Others 8.4 4.9 0.0 10.9 18.0 0.1Total 8.6 5.1 0.0 10.9 18.0 0.115-24 8.1 1.1 0.0 11.6 36.1 0.225-34 11.5 6.1 0.0 11.7 9.2 0.235-44 7.4 3.9 0.0 10.4 24.1 0.145-54 4.3 7.6 0.0 1.7 9.3 0.055-64 5.4 11.6 0.0 0.0 8.1 0.0No formal schooling 18.6 12.3 0.0 0.0 61.7 0.0Primary, grades 1-4 12.7 5.9 0.0 10.5 33.0 0.0Middle, grades 5-8 9.0 3.1 0.0 17.1 24.2 0.4Vocational/apprentice 6.7 6.0 0.0 10.3 20.0 0.0Highschool, grades 9-12, incl. lower HS 6.4 2.5 0.0 8.8 9.8 0.1Post-secondary or foremen's school 15.2 0.0 0.0 16.4 0.0 0.0Higher school, short and long term 13.4 0.0 0.0 8.7 11.5 0.0Unemployed 6.4 6.6 0.0 11.2 20.2 0.1Housewife 5.6 4.3 0.0 14.3 16.9 0.3Family-help agriculture 3.9 4.7 0.0 8.5 19.2 0.0Family help non-agriculture 0.0 0.0 0.0 0.0Member of a cooperative/association 0.0 0.0 0.0 0.0Out of labor force, child raising 32.4 0.0 0.0 10.7 3.8 0.0Others. not disabled 13.2 7.2 0.0 0.0 10.9 0.0Q1 11.4 6.2 0.0 42.0 37.8 0.4Q2 7.3 0.4 0.0 16.6 21.9 0.0Q3 7.3 2.0 0.0 7.2 3.4 0.0Q4 8.0 0.0 0.0 7.8 7.2 0.0Q5 2.9 8.3 0.0 2.8 0.0 0.0
Sample size (no of NEETD) 4.639 582 904 531 308 4080
Average Generosity of Transfers
% of NEETD Beneficiaries Dependent on Social Assistance Income (Generosity > 50% )

135
Annex 9: Political Economy and Strategic Communication for Sustainable Reforms
Summary
1. Reforming Romania’s social assistance system carries inherent political risks since such reforms will inevitably create higher benefits for some and reduced or removed benefits for others in the distribution of social benefits. As discussed in the main text and Annex 4 (ORAF), such risks are rated as high due to the risk that public protests could cause the reforms to be delayed or could cause implementation difficulties .
2. Nonetheless, experience in other countries shows that solid diagnostics and a careful strategy to manage the implementation of reforms, with tailored and on-going communication, consultations and engagement, can greatly facilitate the sustainability and success of reforms. This annex presents (a) initial diagnostics on the “political economy” of reforms and an outline of key messages that would need to be targeted for public information and consultations around the reforms; (b) indicators of Government commitment to social policy reforms and risks of reversals; (c) an outline of a suggested “multi-layered” strategy for managing the reform process, including strategic communication tools and other options for mitigating political and social risks.
A. Stakeholder Diagnostics: Political Economy, Perceptions, and Messaging the Reforms
Political Economy: Mapping the Reforms 3. The proposed Project aims at improving the performance of Romania’s social assistance system, with a focus on the Government’s programs for low-income households, the disabled, and families with children. Four results areas will contribute to achieving the Project Development Objective: 1) strengthening performance management, 2) improving equity, 3) improving administrative efficiency, and 4) reducing error and fraud.
4. The timing of the reforms is key for understanding political sustainability and devising an effective, multi-layered communications campaign. The Government’s Reform Strategy, and the proposed SASM project, support implementation of various types of reforms: (a) parametric reforms; (b) tightening of the eligibility rules for income-tested programs; (c) reform of the disability pension and allowances; and (d) reform of the administrative system. In terms of timing, many of the politically “toughest” aspects of these reforms have already been adopted, though implementation will also require a communications campaign.
5. The parametric reforms consisting in changes in programs rules are concentrated in two periods: December 2010 (when the new Family Benefit law, Child Raising Benefit law, and GMI law have been adopted by parliament), and 2013 (when the consolidated program for low income households will be implemented, and the institutional framework for disability certification will be unified). In terms of redistribution of resources, these two phases of reforms are of comparable magnitude. It is important to note that the adoption of the first round of parametric reform, carried out in December 2010, did not resulted in protests, only in healthy debates.
6. Tightening of the eligibility rules for income-tested programs represents a “soft push out” for beneficiaries that were not really poor (were asset-rich) or who have entered in the programs due to poor verification/documentation of household incomes and assets. For example, the heating benefits in the winter season of 2010-2011 have maintained the same eligibility

136
thresholds as before (which go up to the sixth decile of the income distribution), but have been accompanied by clearer rules on how to account for different sources of income, on documentary evidence, on verification. Moreover, the threat of an inspection of the claims had a deterrence effect, as was previously done and advertised with the GMI and disability benefit programs. All these “soft-push” measures resulted in a drop in the number of heating allowance beneficiaries from 100 percent during the last season to only 40 percent in this winter season, for the months Nov-Dec. Again, the tightening of the criteria for entering the program did not resulted in public protests or major opposing debates.
7. Many of the politically “tougher” administrative reforms have already under-taken. Reform of the administrative system started with measures taken in 2010: wages cut by 25 percent, staff cut by 25 percent across the board in the MoLFSP and subordinated agencies. For 2011-2013, the administrative agenda is more “positive” in its political outlook. The key implementing units and agencies have developed Human Resource plans based on projected levels of activity, and an increase in staff is expected over the life of the project, compensated by reduction in the staff numbers in other social protection agencies. Public wages are also expected to rise over the life of the program (see Annex 8). Importantly, the reform provides for consolidation of programs, harmonization of rules and procedures, simplification of procedures. All these will reduce the bureaucratic burden on the system. There is a strong push to expand the use of ICT across the whole range of social assistance programs, which will improve working conditions as well as program compliance (reduce the level of error in the system). Overall, the reform should bring positive benefits to staff.
8. Harmonizing the disability certification procedures and unifying the institutional framework is high on the Government of Romania’s agenda, and it is one of the objectives of the Social Assistance Strategy. The new system will improve the lives of persons with disabilities: it will include an individual assessment on how to improve functioning for both types of beneficiaries (pensioners or beneficiary of allowances); it will improve the referral system to rehabilitation services; it will improve the access to the system, by reducing the cost of application and introducing a single-point of entry into the system; it will be more equitable and accurate, so that only deserving individuals will be included; and it will improve overall efficiency and effectiveness of the system.
9. Reform of the disability benefits is a special case: it has strong benefits for beneficiaries, but some of the staff involved in certification of disability may lose jobs and will face stronger transparency and oversight. Romania has a strong system to support people with disabilities, operating via three channels. The first channel, operated by the Pension House, supports about 900,000 people (of a population of 21 million) at an annual cost of about 1 percent of GDP. These are individuals who lost their ability to work while in formal employment benefit from a disability pension (cash transfer) and rehabilitation services. The second channel is operated in a decentralized manner, benefitting about 700,000 people, and the cash transfer payments only amount to 0.4 percent of GDP. This channel covers all individuals with certain impairments but living with families or independently are entitled to disability allowances (cash transfers, like the IDA and CBDA), free or subsidized provision of equipment to ensure their social inclusion, and rehabilitation services (including care-givers). The third channel services about 17,000 people that are in the institutionalized system. Those to benefit the most (beneficiaries) of the proposed reforms would include non-institutionalized people with disabilities who are expected to benefit from the proposed measures of harmonizing the

137
disability assessment criteria and unifying the institutional framework, which will correct a number of inefficiencies (see Annex 7). Those who could be perceived as “losing” from the benefits include: (a) some of the staff in the existing parallel system for certifying disability status and eligibility for disability benefits; and (b) existing beneficiaries who had entered the system via errors, fraud or corruption. Despite the fact that the group of those losing is rather small, they are likely to oppose the reforms. To mitigate this risk, the process of reform is gradual, with piloting and evaluation before actual implementation, and with an adequate communication strategy.
Beneficiaries from the Proposed Social Assistance Reforms
10. Those benefiting the most from the reform are the low income households, i.e. the poorest 20 percent of the income distribution. The share of spending that will go to them is expected to rise, from 37.7 percent in 2009 to at least 45 percent in 2013. Moreover, despite a planned reduction in overall social assistance spending (from 2.9 percent in 2010 to 2.1 percent of GDP by 2013), the generosity of social assistance for this group is expected to rise from 26 percent to 29 percent, as a share of transfer income in the total income of beneficiary families (see Annex 8).
Households in the poorest quintile are already benefitting from some of the legislative measures already in 2009-2010. In 2009, the eligibility threshold of the GMI was raised by 15 percent. In 2011, the funding of the GMI was transferred to MoLFSP, which ensures more predicable financing arrangements. In January 2011, Family Benefits were targeted more tightly to families from the poorest three deciles (as opposed to the poorest fifth), and the benefit formula was changed from a per family to a per-child rule, which provides better support for families with more children, which tend to be poorer. The share of funds from this program going to the poorest quintile is expected to increase from 60 percent to about 73 percent in 2011/2012 (see Table A8.7)
The other major improvement in the living standards of the poorest quintile will occur in 2013, with the consolidation of the means-tested programs into the Minimum Social Insertion Income (MSII) Program. This program will be more generous (i.e. will provide adequate support to all poor) and will use an expanded definition of poverty, in line with the EU definition, covering 15 percent instead of 3-4 percent of the population (the other households in the poorest quintile are covered by other social assistance programs: the overall coverage is estimated to be 93 percent, see Table A8.7 and A8.9). Also, this program will maintain or strengthen the school conditionality requirements, work-requirements, and activation requirements, thus contributing to the human capital development and competitiveness goals outlined in the Country Partnership Strategy. According to simulations, the targeting accuracy of this program will be over 80 percent, a step increase compared to the average targeting accuracy of the current programs (GMI, family and heating benefits) of 60 percent.
11. Those likely to have reduced or removed benefits due to the social assistance reform include:
Upper and middle-class beneficiaries of Child Raising Benefit (representing less than one-quarter of the current 207,000 beneficiaries) and Family Benefit programs

138
(representing less than 20 percent of 811,000 beneficiaries) (see Annex 7, Table A7.1). The losses under CRB are also distributed over time, given that current beneficiaries have been grandfathered under the old rules. Moreover, higher-income ex-beneficiaries may perceive relatively less “harm” from the reforms, since the benefits represent a smaller share of their total incomes (and as such may not believe it is “worth it” to organize in protest).
Fraudsters and those who entered in the programs in the past under weak eligibility rules (as with the heating allowances), who were not truly in need, are also losing out. But they are unlikely to protest the loss of benefits out of fear of further penalties or incrimination.
Some of the social assistance staff that are currently involved in disability allowance certification may lose their jobs.
Perceptions regarding social assistance in Romanian society and their influence on the sustainability of reforms
12. The “social compact” across societies differs significantly in terms of expectations of Governments to provide jobs or benefits in general, for specific vulnerable groups, or in the face of specific income shocks (e.g., unemployment, retirement, maternity leave, etc.). These expectations can be influenced by the country’s socio-economic context (degree of poverty, inequality, and population characteristics), historical factors, attitudes towards work, perceptions of the poor and other groups in society, and so forth.
13. International perception surveys provide a useful tool in gauging public perceptions of such issues – which in turn can affect the nature, course, and sustainability of redistributive reforms of social assistance benefits. Data from the World Values Surveys (WVS, international coverage) and the European Social Surveys (ESS 2008, European coverage only) suggest some key messages that should be taken into consideration in the analysis of the political economy of redistribution, social benefits, work, female labor force participation, and care for the disabled.
14. Romanians are concerned about the poor, though they have mixed views on the causes of poverty. Data from the WVS suggest that a large majority (close to 80 percent) of Romanians consider poverty to be the most serious problem in the country.48 This is higher than other countries in Europe and those in most other regions (Figure A9.1). Moreover, Romanians perceive a high “poverty rate” in the country, with most of those surveyed in the 2008 ESS believing that over 20 percent of the population does not have enough money for basic necessities, which is quite close to the relative poverty measure used by the Romanian Government and European Union. They tend to view poverty as chronic, with only 20 percent of those surveyed in the WVS survey considering the poor have a chance to escape poverty. Finally, Romanians have mixed views as to the causes of poverty, with 42 percent of those surveyed in the WVS indicating “injustice in society” as the primary cause, 29 percent indicating laziness or a lack of willpower by the poor in creating their own situation, and about a tenth indicating that poverty is due to bad luck (“unlucky”) or reflects “modern progress” (Figure A9.2).
48 Data from WVS (2005-08).
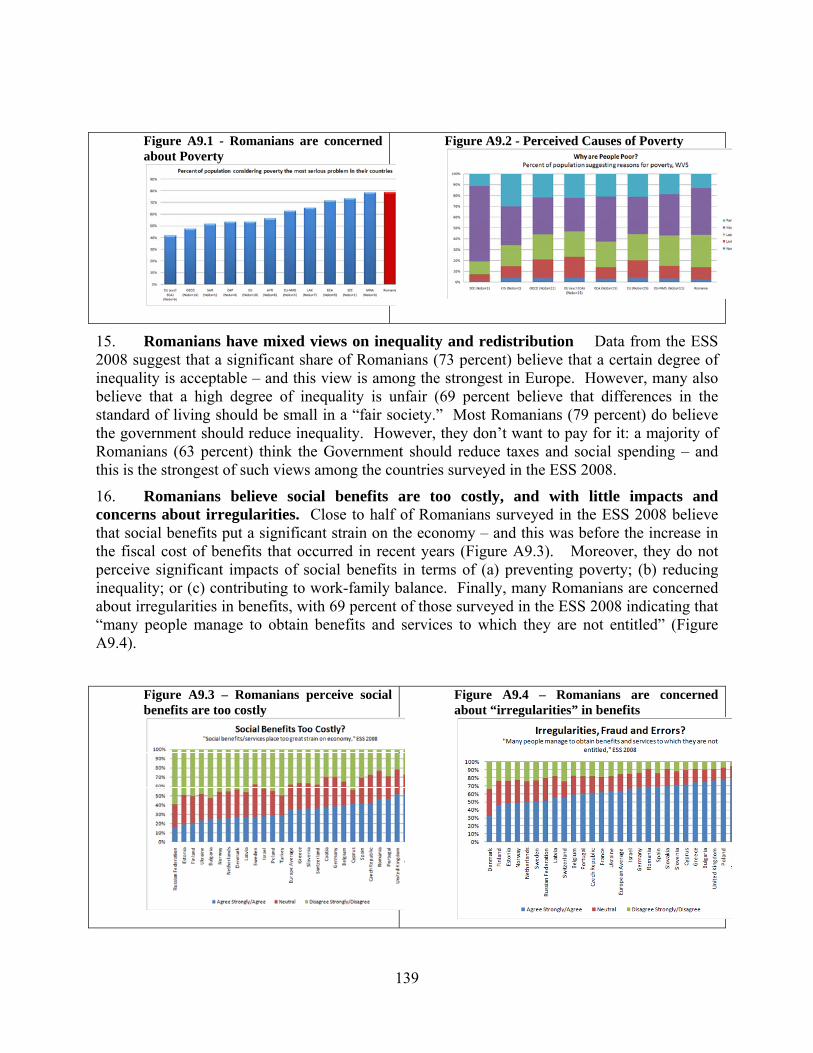
139
Figure A9.1 - Romanians are concerned about Poverty
Figure A9.2 - Perceived Causes of Poverty
15. Romanians have mixed views on inequality and redistribution Data from the ESS 2008 suggest that a significant share of Romanians (73 percent) believe that a certain degree of inequality is acceptable – and this view is among the strongest in Europe. However, many also believe that a high degree of inequality is unfair (69 percent believe that differences in the standard of living should be small in a “fair society.” Most Romanians (79 percent) do believe the government should reduce inequality. However, they don’t want to pay for it: a majority of Romanians (63 percent) think the Government should reduce taxes and social spending – and this is the strongest of such views among the countries surveyed in the ESS 2008.
16. Romanians believe social benefits are too costly, and with little impacts and concerns about irregularities. Close to half of Romanians surveyed in the ESS 2008 believe that social benefits put a significant strain on the economy – and this was before the increase in the fiscal cost of benefits that occurred in recent years (Figure A9.3). Moreover, they do not perceive significant impacts of social benefits in terms of (a) preventing poverty; (b) reducing inequality; or (c) contributing to work-family balance. Finally, many Romanians are concerned about irregularities in benefits, with 69 percent of those surveyed in the ESS 2008 indicating that “many people manage to obtain benefits and services to which they are not entitled” (Figure A9.4).
Figure A9.3 – Romanians perceive social benefits are too costly
Figure A9.4 – Romanians are concerned about “irregularities” in benefits

140
17. They are also concerned about inadequate coverage and benefits for the poor. A significant share of Romanians suggests that “many people with very low incomes get fewer benefits than they are legally entitled to” (Figure A9.5). Moreover, there is a strong view that current benefits are inadequate for the poor, with three-quarters of Romanians interviewed in the ESS 2008 reporting that “there are insufficient benefits to help the people who are in real need” (Figure A9.6).
Figure A9.5 – Romanians are concerned with low benefit take-up rates for the poor
Figure A9.6 – Romanians would endorse higher benefits for the poor
18. Romanians have a strong work ethic, expecting people to work as a duty to society and a moral value. A large share of Romanians (70 percent) surveyed in the WVS (2005-08) indicate that they believe “work is a duty towards society” and an even larger share (over 80 percent) believe that “people who don’t work become lazy”. Close to half of the population surveyed in the ESS 2008 perceives that “most unemployed people do not really try to find a job”.
19. While there is a certain stigma for social and unemployment benefits, Romanians do believe that such benefits are the Government’s responsibility. Over half of all Romanians surveyed in the WVS believe that “it is humiliating to receive money without having to work for it.” However, the ESS 2008 suggests mixed views about the labor impacts of social transfers, with about one-third of the population suggesting that “social benefits make people lazy,” another third responding neutrally, and another third disagreeing. Moreover, a relatively large share of Romanians does believe it is the Government’s responsibility to provide for the unemployed.
20. Female labor force participation is also valued in Romania – with implications for family policy. Most Romanians think that women should work outside the home, with only a small share of those surveyed in the WVS indicating that “being a housewife is just as fulfilling”. Moreover, few Romanians express a strong gender bias for jobs, with only a third agreeing that men should have job preferences when jobs are scarce and 40 percent disagreeing or strongly disagreeing with that bias. Romanians surveyed in the ESS are also split on women’s responsibilities to work vs. family life, with less than half agreeing with the statement that “women should cut back on work for the sake of family”. In terms of family policy, Romanians are not fully convinced that social benefits facilitate work-family balance, though many do believe that the Government has the entire responsibility to provide child care-services for working parents.

141
21. In terms of disability benefits, Romanians do see a role for Government for care-givers. Public opinion survey data on perceptions of disability benefits are limited. The ESS 2008 does suggest that a moderate share (one-third) of Romanians do view that the Government has full responsibility for the provision of paid leave for care-givers to take care of family members who are temporarily sick or disabled. This is about the same share (one-third) as those who see full Government responsibility for child care services and unemployment benefits, though less than those prioritizing full government responsibility for ensuring the standard of living for pensioners in old age (42 percent).
22. In sum, Romanians value work and protection of the poor and vulnerable groups – but have real concerns about the existing system of social benefits. Romanians are quite concerned about the issue of poverty and the well-being of the poor and vulnerable groups. They also have a strong work ethic as a duty to society – and value labor force participation for both genders. These dual principles translate into an endorsement of the role of government in providing support for the poor, vulnerable groups, and working parents. Yet most Romanians have serious concerns about the existing system of social benefits due to views that they are (a) too costly (strain on the economy); (b) yield few impacts (on poverty, inequality and work-family balance); (c) entail many irregularities (fraudulent claims); and (d) provide inadequate coverage and benefits for the poor (those in “real need”). Linked to this, a relatively large share of Romanians call for lower taxes and social spending. These perceptions lay the groundwork for the reform of social benefits.
Implications for “Messaging” and Communication around the Proposed Reforms
23. These perceptions are quite consistent with the Government’s proposed reform agenda – and provide an important foundation for such reforms. Communication is crucial for solidifying this base, communicating the underlying rationale and objectives of the reforms. Specifically, communication and awareness campaigns should focus on explaining the government’s strategy and objectives around several key messages – which reflect these widespread beliefs:
The current system of social benefits is too costly – with opportunity costs for the economy (cost agenda)
It is also inefficient – with irregularities and duplications in systems and benefits (efficiency agenda)
Impacts on poverty are limited – in part due to inadequate coverage and benefits for those truly in need (equity agenda)
Social benefits are ineffective in their ability to help combine work and family – and such supports should be reoriented towards promoting work (labor-force participation) and supporting working parents (proactivity agenda).
B. Country Risks: Government Commitment to Reforms
24. Even though public perceptions broadly align with the Government’s social assistance reform agenda, political risks for the reforms are high. The economic crisis has

142
compelled the coalition to implement an austerity package that consisted in reducing public wages by 25 percent and certain non-contributory pensions and other benefits by 15 percent while increasing the VAT 5 points up. The current austerity measures have lead to public protests. Nonetheless the government remained committed to continuing reform and succeeded to stay in power.
25. The incoming local and national elections in 2012 are expected to re-ignite the public debate, with emphasized focus on social issues and social consequences of government’s policies. In 2010, the government has put several bills to Parliament with a confidence vote. As discussed in the main text and Annex 4 (ORAF), political and social risks could be mitigated through a series of measures, the proposed communication strategy on social assistance reform being a significant part of the mitigation plan.
26. Romania has successfully adopted several ambitious social policy reforms in recent months. The Government reaffirmed its commitment to reform the social benefits system to improve the efficiency of protection of the poorest and most vulnerable, while providing support for the fiscal adjustment strategy. The outline of the new reforms, at the level of goals and principles, was endorsed by the Government in April 2010. Since then, the MoLFSP has undertaken many measures, and has adopted a Social Assistance Reform Strategy, approved by the Government on March 28, 2011. The Government has developed an Action Plan for the period from 2011-13, which will ensure that the Strategy would be implemented following a realistic timeframe, with clear assignation of institutional responsibilities, and with adequate resource. The new Family Benefit law, Child Raising Benefit law, and GMI law were already adopted by the parliament in December 2010. The measures following adoption of this new legislation were not perceived as harsh therefore they didn’t lead to protests or other public reactions.
C. Elements of a Communication Strategy for Managing Reforms
A Multi-layered Strategy for Communication
27. Communication is critical to generating broad support for reforms. A communication strategy thoughtfully designed to connect with key audiences is the way to increase stakeholders’ levels of engagement and their commitment to sustained development and needed reform. This section outlines the structure of the suggested “multi-layered” communication strategy to support the Government’s social assistance reforms (and the proposed SASM project) in Romania, based on the initial diagnostics on the “political economy” of the reforms, on the public perceptions analysis presented in Section A above, and on communication analysis; this includes a set of strategic communication tools and other options for mitigating political and social risks identified in Section B.
Communication Needs Assessment
28. The communication needs assessment is the initial stage of strategic communication planning process. It seeks to analyze the social and political risks for the project (as presented in section B), and to assess the capacity of the government to implement and supervise the communication strategy. This research collects information about stakeholders’ knowledge, perceptions, attitudes, expectations, and practices that can shape the design of the proposed

143
project. Based on these data, the communication objectives are identified and further investigated. The communication needs assessment should also identify indicators for monitoring and evaluation, as well as the areas where further and deeper public opinion research, both quantitative and qualitative, is required.
29. The Government is actively communicating its reform measures, but effectiveness can be improved. The Romanian Government and the MoLFSP are actively communicating the social assistance reforms measures taken so far (the modification of the Child Raising Benefit, the new Family Benefit law). There are serious efforts to inform the population about the rationale of the new measures, as well as on how these measures are working. The print, television, and web-based media are constantly reporting on and discussing social assistance issues. The MLFSP officials are responding to questions, informing about new measures, or having their own op-eds. In terms of feedback mechanisms, they are relying on media monitoring, and internal reports. At the same time, the communication efforts of MoLFSP suffer from a number of weaknesses. There is little investment in public opinion research or on employing external professional communication specialists or agencies. Some forms/channels of communication are not or under- utilized, such as: grass-roots campaigning, social media, consultations, constituencies/coalition building. Due to the sensitivity of the social reforms, and the polarized media environment, but also to inabilities, incoherencies, and chronic lack of resources for communication, MoLFSP is constantly under scrutiny and criticism. The effectiveness of the current communication efforts could be increased with additional support through the proposed communication strategy and action plan.
30. Stakeholders Analysis. An assessment of stakeholders, both internal and external, would show the ways in which the social assistance reforms (supported by the proposed SASM project) would affect them and determines their communication needs so as to achieve the desired behaviors. The stakeholders analysis includes such characteristics as knowledge of the policy, interests related to the policy, position for or against the policy, potential alliances with other stakeholders, and ability to affect the policy process (through power and/or leadership). The Government’s Social Assistance Reform Strategy (and the proposed SASM project) addresses primarily two categories of stakeholders who are the audiences for different communication interventions (a detailed stakeholders analysis will be part of subsequent project communication strategy): (a) external (beneficiaries of social assistance and the Romanian society at large); and (b) internal (implementers of social assistance reforms, government officials, agencies involved in the reforms).
External Audiences
31. Primary Audience refers to those groups of people who are ultimately affected, i.e. who expect to benefit from or be adversely affected by the reform or policy intervention. Therefore it can be divided into two categories, those that would benefit the most and those who would have reduced or removed benefits. As discussed in Section A above, in case of Social Assistance Reforms, those that would benefit the most are the poorest segment of the Romanian population who will gain more and waste less time and efforts with cumbersome bureaucratic procedures to get social benefits (82 percent of the poorest quintile in 2009). Those with reduced or removed benefits are those who are receiving benefits – knowingly or unknowingly – due to the weaknesses and loopholes of the current system but are losing partially or entirely those social benefits as a result of the proposed reforms.

144
32. Those who would benefit the most from the implementation of reforms need to know what they are going to gain, and what to do in order to secure their benefits. They are a very compact group in terms of living standards: the poorest quintile of the population, to a large extent illiterate, and with little to no access to traditional media or other forms of communication. In socio-demographic terms, they are mostly unemployed or belonging to the “working poor” category, families with more children, and three times more widespread in rural than in urban areas. The implementing agency should play an important role in timely and strategic sharing of accurate information.
33. Those not benefiting should be informed of the changes in rules (parametric reforms) and the rationale behind the reforms. They are less compact as a group and more spread socially and geographically. There will be those losing benefits or having them reduced among higher-income families as well as within the population with incomes below rated as poor, but “asset-rich.” They could be sensitized with messages on values such as equity and solidarity, while the less well-off groups will additionally need other forms of communication: inter-personal, group support, counseling, etc. Therefore, in the latter’s case, communication should be complemented with other economic and social measures/actions (workforce re-insertion, more jobs, NGO’s support) which are not envisaged by the proposed project, but should be in the government’s attention.
34. The secondary audience includes influencers who exert pressure on primary audience to change attitudes/adopt or not new behaviors following the reform: public authorities at all levels (national and local/regional), public sector employees, and formal and informal leaders of the poor communities (e.g. heads of Roma groups, associations of people with disabilities).
35. The tertiary audience consists in communities and public at large, opinion/authority leaders (priest, mayor), local/regional administration, policy-makers (the parliament), NGOs working in social projects, and media.
36. A complementary segmentation of audiences which is relevant to the strategic goal of SASM communication is the Opponents/Supporters divide. Identifying groups of people whose support is crucial to the reform’s success would help determine specific communication channels and messages to keep the momentum of the reform. On the other hand, identifying the groups that oppose the reforms would help determine the communication tools to engage them in a constructive dialogue with an aim to build consensus and support through their active engagement and participation in the process.
37. In case of social assistance reforms, opponents can include those losing benefits due to the reform, some CSO’s, local administration bureaucracy. The communication strategy may try to convert the opponents to support the cause; or, if it is unlikely that their opposition can be addressed to their satisfaction, communication efforts will aim to neutralize the negative impact of their opposition. Supporters may contain public opinion leaders, the academia, the private sector, some NGOs working in the social projects, IFIs, and EU agencies. Allies will need communication to reinforce their beliefs and encourage their active involvement in advocacy and the implementation of reform measures. People in the middle of the continuum require more communication effort: those that are uncommitted but involved in the issue (e.g. policy makers) may need persuasive messages to encourage their active participation as champions of change. Those who are uncommitted and uninvolved (e.g. public at large, media) may require more time and communication resources than usually are available to reformers.

145
Internal Audiences
38. Internal audiences include the implementers of social assistance reforms, government officials, and agencies involved in the reform. The implementers of the reform are key stakeholders of the project as they can significantly influence the project, and are most important to the success of the project. Therefore they need to understand the benefits of the reform – for themselves but for society as a whole – before they could believe in and support it. Reform enabling stakeholders are the MLFSP political leadership, on one hand, and the technical decision makers and staff of the social assistance coordinating agencies, on the other: General Directorate for Social Assistance (GDSA), National Agency for Social Assistance Benefits (NASB), General Directorate for Social Inspection (SI), and the National Institute for Medical Expertise and Labor Capacity Recovery (NIMELCR). As sometimes there are clashes of vision and interests between political leadership and technical execution layers, these have to be addressed and reconciled through consensus building activities.
39. Assessment of the media environment determines the most appropriate vehicles for mass communication. In order to determine the media tools needed for different target audiences it is important to (a) identify the channels each segment of the society uses to receive and disseminate information, and (b) evaluate the degree of trust on the existing in each channel.
40. The Romanian media environment is diversified and polarized. During the first few years after 1989, a limited number of daily newspapers with large circulation played a role in strengthening political pluralism, investigating abuses of past and present power, and raising political expectations. However, since 2005 print readership decreased as television took off with a plethora of channels opening every year. It is assessed that over the past two decades, more than 80 percent of Romanians have obtained most of their information on politics from television. The concentration of media ownership around groups with economic and political interests led to a polarized environment not always conducive to consensus building around key issues on the national agenda. Nevertheless, during the past few years, evolving new social media (such as the Internet platforms, forums, blogging community, Facebook, etc.) has started to play an increasingly influential role in ensuring freedom of speech and shaping public opinion. The balancing act of new media against anti-reformist traditional media conglomerates was crucial in deciding the outcomes of the last general and presidential elections (2008 and 2009) as well as in keeping alive the public debate around reform issues.
41. Participatory communication can be more effective in communicating reforms. Not all media or channels, however, are useful for the purposes of reform communication. Methods outside of the mass media can be effective, and even necessary in case of illiterate or extremely poor (with no access to media) audiences. Social and participatory communication such as consultations, organized group discussions at community level, as well as face-to-face interventions might be much better and effective ways to reach such groups of stakeholders.
42. Communication Strategy Objectives. An outline of the communication strategy was agreed with the MLFSP, on a shared vision that the ultimate goal of the proposed communication strategy on the Social Assistance System Modernization is to increase public support for the reform process, and to minimize opposition. Hence, based on the initial findings and insights of the communication needs assessment, the key objectives of the strategic communication of the reforms in social assistance should be to:

146
Build public support and sustain momentum for the reforms in the social assistance system;
Ensure buy-in of the key Government apparatus including ministries, relevant agencies, and public administration involved in the modernization of the social assistance system; and
Ensure stakeholders’ participation and build alliances at different levels (including media and civil society) to build trust on the government efforts by promoting transparency and accountability in the reform process.
43. The action plan builds on the following strategic approaches:
Increasing communication capacity of the relevant public administration departments to implement the communication interventions on reform in social assistance system;
Developing a pro-active internal communication system within the government machinery to effectively engage the key stakeholders within the government;
Launching a public awareness campaign for the Social Assistance beneficiaries in particular and people in general;
Engaging and strengthening the capacity of media and civil society organizations to broaden public outreach and create a platform for an informed and constructive dialogue and debate in the public sphere.
Monitoring and measuring the impact of communication interventions through research and fine-tune the communication strategy throughout the reform process.
44. Message development and testing are critical in strategic communication. To determine the most appropriate messages for each audience, it is necessary to anticipate their concerns. Messages should be designed on those reform benefits that are meaningful and credible for each stakeholder group. Experience shows that messages are most effective when they are based on a value — like the common good or justice — and framed in a systemic, thematic way rather than in an episodic one. Therefore core messages of the awareness campaign should be on-going and repeated across time. Key messages will focus on aspects such as social value of work, equity, or the stigma of fraud, etc. as deemed relevant following a thorough message testing process for each target group. Section A of this Annex provides valuable insights for effective messaging of social assistance issues based on data from the World Values Surveys, and the European Social Surveys.
45. Anchoring the Reform’s Communication Strategy on its Management Objectives. To maximize impact and increase effectiveness, key communication interventions will be planned in sync with the most important phases of the reform implementation throughout the life of the project:
Phase 1: The launch of the SA strategy and its action plan (Feb - March 2011). The period of intense communication activities should cover February - May 2010 (communication activities to explain the rationale of the reforms, to spell out expected results).
Phase 2: Changes in the administration of disability benefits: harmonization of criteria for disability benefits and unification of institutional framework (timetable of actual reforms: diagnostic is done in 2011, piloting is done in 2012, legislation is adopted by the end of 2012, and implementation in 2013). The period of intense communication activities

147
should cover end 2012 - beginning of 2013 (the period preceding the implementation of the new legal framework / institutional framework). Selected communication activities should be carried on in conjunction with launching of the pilots, then to disseminate the results of the pilots.
Phase 3: Reduction of losses due to error, fraud and corruption (timetable of this action: on-going over the life of the loan; each year the Social Inspection will carry on inspection of five types of benefits, and will report back on findings and remedial actions every two months). Suggested timetable of the communication activities: should accompany every inspection campaign, focusing on findings and how to correct irregularities (deterrence effect).
Phase 4: Consolidation of means-tested programs (GMI, heating benefits, family benefits) into one large program (Minimum Social Insertion Income, the consolidated program for low-income households). The timetable of this measure is 2012 for design/ simulation/ legislative framework, and 2013 implementation. It is important to have a solid communication effort in 2012, preceding the implementation of the new legal framework / program.
46. Optimum mix of communication channels and tools. In deciding which mix of communication channels will be effective in the proposed strategy and action plan, there are three aspects that should be considered: reach, frequency, and credibility. A multichannel approach will create synergies while having more impact by reaching more people and reaching people in different environments with more frequency. Based on identified communication habits of target audiences, the proposed communication campaign will use a mix of tools and channels including but not limited to: (i) print materials; (ii) audio-visual products; (iii) web-based and new media products; (iv) interpersonal or group communication activities; and (v) knowledge and research.
47. Communication Monitoring and Evaluation: Traditional results and ex-post evaluations (based on the indicators of the ex-ante evaluation) should be developed for all communication interventions. However, given that reforms and the corresponding communication interventions are highly contextual and that any communication intervention can change the conditions of the project, the development initiative needs to receive periodic feedback from the main stakeholders. This feedback may help redefine both the implementation of the development initiative itself and the communication program in order to better accomplish the development goals.
In conclusion, the proposed communication strategy and action plan aim to support the implementation of the Government’s Social Assistance Reform Strategy, as well as the dissemination of the results achieved, and the achievement of the development objectives of the proposed project and to offer solutions to mitigate social and political risks. As shown in this annex, in line with its commitment to reform, the MoLFSP is actively communicating to the public but the effectiveness of its efforts can be increased. There is an outline for this communication strategy, agreed with the line ministry (see Table A9.1). The proposed communication action plan will contain a number of activities planned in-sync and specifically designed to address key project phases. There are resources to finance this in the ongoing Social Inclusion Project (SIP), of about USD 500,000 (if financed only from SIP), or USD 600,000 (if the Disability Trust Fund will be approved).

148
Table A9.1: Draft Communication Strategy Mapping and Timeline
Key Communication Objectives Strategic Approach
Key Project Phases Project Timeline/Intensity of Communication Interventions
1st Year 2nd year 3rd year
Build public support and sustain momentum for the reforms in the social assistance system;
Public awareness campaign for the Social Assistance beneficiaries in particular and people in general;
1. The launch of the SA strategy and its action plan
X
2. Changes in the administration of disability benefits
X X
3. Reduction of losses due to error, fraud and corruption
X X X
4. Consolidation of means-tested programs
X
Monitor and measure the impact of communication interventions through research and fine-tune the communication strategy throughout the reform process.
1, 2, 3, 4
X X X
Ensure buy-in of the key Government apparatus including ministries, relevant agencies, and public administration involved in the modernization of the social assistance system;
Increase communication capacity of the relevant public administration departments to implement the communication interventions on reform in social assistance system;
1. The launch of the SA strategy and its action plan X
Develop a pro-active internal communication system within the government machinery to effectively engage the key stakeholders within the government;
1, 2, 3, 4 X X X
Ensure stakeholders’ participation and build alliances at different levels (including media and civil society) to build trust on the government efforts by promoting transparency and accountability in the reform process.
Engage and strengthen the capacity of media and civil society organizations to broaden public outreach and create a platform for an informed and constructive dialogue and debate in the public sphere.
1, 2, 3, 4
X
X
X


MoldoveanuMoldoveanu(2,544 m )(2,544 m )
Ba
n
at
W a l a c h i aW a l a c h i a
Do
br
uj
a
Mo
ld
av
ia
T r a n s y l v a n i a n A l p s
Olt
Olt
ArgesArges
IalomitaIalomita
BuzauBuzau
SiretSiret
SiretSiret
BistritaBistrita
Crisul Alb
PrutPrut
Mures
Timis
Som
es
Jiu
Danube
Danube
A R A DA R A D
G O R JG O R J
HUNEDOARAHUNEDOARA
CARAS -CARAS -SEVERINSEVERIN
T I M I ST I M I S
PRAHOVAPRAHOVA
BRASOVBRASOVCOVASNACOVASNA
S I B I US I B I U
ARGESARGES
IALOMITAIALOMITA
VRANCEAVRANCEA
V A S L U IV A S L U I
GALATIGALATI
T U L C E AT U L C E A
NEAMTNEAMT
I A S II A S I
BOTOSANIBOTOSANI
HARGHITAHARGHITA
SUCEAVASUCEAVAMARAMURESMARAMURES
A L B AA L B A
C L U JC L U J
MURESMURESB I H O RB I H O R
SATU MARESATU MARE
O L TO L T
D O L JD O L J
MEHEDINTIMEHEDINTI
TELEORMAN TELEORMAN GIURGIUGIURGIU CONSTANTACONSTANTA
BUCURESTIBUCURESTI
DÂMBOVITAMBOVITA
VÂLCEALCEA
BISTRITA-BISTRITA-NASAUDNASAUD
BUZAUBUZAU
BRAILABRAILA
CALARASICALARASI
SALAJSALAJ
B A C A UB A C A U
LugojLugoj HunedoaraHunedoara
TurdaTurda
PetrosaniPetrosani
OrsovaOrsova
CalafatCalafat
CaracalCaracal
MediasMedias
DejDej
RomanRoman
OnestiOnestiBirladBirlad
MedgidiaMedgidia
FetestiFetesti
HusiHusi
Turnu MagureleTurnu Magurele
TecuciTecuci
GheorgheniGheorgheni
BradBrad
DevaDeva
AradArad
SibiuSibiu
ZalauZalau
TulceaTulcea
VasluiVaslui
OradeaOradea
GiurgiuGiurgiu
CraiovaCraiova
SlatinaSlatina
SuceavaSuceava
SloboziaSlobozia
Târgu Jiurgu Jiu
Baia MareBaia Mare
Satu MareSatu Mare
AlexandriaAlexandria
AlbaAlbaIuliaIulia
Cluj-Cluj-NapocaNapoca
RâmnicumnicuVâlcealcea
Miercurea-Miercurea-CuicCuic
Drobeta-Drobeta-Turmu SeverinTurmu Severin
BistritaBistrita
TârgurguMuresMures
BotosaniBotosani
IasiIasi
Piatra-Piatra-NeamtNeamt
PloiestiPloiestiTârgovistergovistePitestiPitesti
ResitaResita
TimisoaraTimisoara
GalatiGalatiBrasovBrasov
FocsaniFocsani
BacauBacau
CalarasiCalarasi
BrailaBraila
BuzauBuzau
SfSfântuntuGheorgheGheorghe
BUCHARESTBUCHAREST
Ca
rp
at
hi
an
M
t s.
ILFOVILFOV
UKRAINEUKRAINE
UKRAINEUKRAINE
HUNGARYHUNGARY
BULGARIABULGARIA
To To ChisinauChisinau
To To ChisinauChisinau
To To Ivano-Frankivs'kIvano-Frankivs'k
To To UzhhorodUzhhorod
To To BudapestBudapest
To To BudapestBudapest
To To SuboticaSubotica
To To Novi SadNovi Sad
To To SofiyaSofiya To To
VarnaVarna
To To ShumenShumenTo To
ShumenShumen
To To BaltiBalti˘
To To Veliko TurnovoVeliko Turnovo˘
To To NisNis̆
SERBIASERBIA
Lugoj Hunedoara
Turda
Petrosani
Orsova
Calafat
Caracal
Medias
Dej
Roman
Birlad
Navodari
Mangalia
Medgidia
Fetesti
Husi
Turnu Magurele
Tecuci
Gheorgheni
Brad
Onesti
Deva
Arad
Sibiu
Zalau
Tulcea
Vaslui
Oradea
Giurgiu
Craiova
Slatina
Suceava
Slobozia
Târgu Jiu
Baia Mare
Satu Mare
Alexandria
AlbaIulia
Cluj-Napoca
RâmnicuVâlcea
Miercurea-Cuic
Drobeta-Turmu Severin
Bistrita
TârguMures
Botosani
Iasi
Piatra-Neamt
PloiestiTârgovistePitesti
Resita
Timisoara
Constanta
GalatiBrasov
Focsani
Bacau
Calarasi
Braila
Buzau
SfântuGheorghe
BUCHAREST
A R A D
G O R J
HUNEDOARA
CARAS -SEVERIN
T I M I S
PRAHOVA
BRASOVCOVASNA
S I B I U
ARGES
IALOMITA
VRANCEA
V A S L U I
GALATI
T U L C E A
NEAMT
I A S I
BOTOSANI
HARGHITA
SUCEAVAMARAMURES
A L B A
C L U J
MURESB I H O R
SATU MARE
O L T
D O L J
MEHEDINTI
TELEORMAN GIURGIU CONSTANTA
BUCURESTIILFOV
DÂMBOVITA
VÂLCEA
BISTRITA-NASAUD
BUZAU
BRAILA
CALARASI
SALAJ
B A C A U
UKRAINE
MOLDOVA
UKRAINE
HUNGARY
SERBIA
BULGARIA
Olt
Arges
Ialomita
Buzau
Siret
Siret
Bistrita
Crisul Alb
Prut
Mures
Timis
Mure
s
Som
es
Jiu
Danube
Danube B lack
Sea
To Chisinau
To Chisinau
To Ivano-Frankivs'k
To Uzhhorod
To Budapest
To Budapest
To Subotica
To Novi Sad
To Sofiya To
Varna
To ShumenTo
Shumen
To Balti˘
To Veliko Turnovo˘
To Nis̆
Ba
n
at
W a l a c h i a
Do
br
uj
a
Ca
rp
at
hi
an
M
t s.
Mo
ld
av
ia
T r a n s y l v a n i a n A l p s
Moldoveanu(2,544 m )
22°E 24°E 26°E 28°E
24°E
48°N
46°N
44°N44°N
30°E
30°E
ROMANIA
This map was produced by the Map Design Unit of The World Bank. The boundaries, colors, denominations and any other informationshown on this map do not imply, on the part of The World BankGroup, any judgment on the legal status of any territory, or anyendorsement or acceptance of such boundaries.
0 25 50 75
0 25 50 75 Miles
100 Kilometers
IBRD 33469R2
FEBRUA
RY 2008
ROMANIASELECTED CITIES AND TOWNS
COUNTY (JUDET) CAPITALS
NATIONAL CAPITAL
RIVERS
MAIN ROADS
RAILROADS
COUNTY (JUDET) AND MUNICIPALITY(MUNICIPIU) BOUNDARIES
INTERNATIONAL BOUNDARIES