public disclosure authorized banking on protected areas
TRANSCRIPT

Banking on Protected AreasPromoting sustainable protected area tourism to benefit local economies
Pub
lic D
iscl
osur
e A
utho
rized
Pub
lic D
iscl
osur
e A
utho
rized
Pub
lic D
iscl
osur
e A
utho
rized
Pub
lic D
iscl
osur
e A
utho
rized

© 2021 International Bank for Reconstruction and Development / The World Bank
1818 H Street NW
Washington DC 20433
Telephone: 202-473-1000
Internet: www.worldbank.org
This work is a product of the staff of The World Bank with external contributions. The findings, interpretations, and conclusions expressed in this work do not necessarily reflect the views of The World Bank, its Board of Executive Directors, or the governments they represent.
The World Bank does not guarantee the accuracy, completeness, or currency of the data included in this work and does not assume responsibility for any errors, omissions, or discrepancies in the information, or liability with respect to the use of or failure to use the information, methods, processes, or conclusions set forth. The boundaries, colors, denominations, and other information shown on any map in this work do not imply any judgment on the part of The World Bank concerning the legal status of any territory or the endorsement or acceptance of such boundaries.
Nothing herein shall constitute or be construed or considered to be a limitation upon or waiver of the privileges and immunities of The World Bank, all of which are specifically reserved.
RIGHTS AND PERMISSIONS
The material in this work is subject to copyright. Because The World Bank encourages dissemination of its knowledge, this work may be reproduced, in whole or in part, for noncommercial purposes as long as full attribution to this work is given.
Any queries on rights and licenses, including subsidiary rights, should be addressed to World Bank Publications, The World Bank Group, 1818 H Street NW, Washington, DC 20433, USA; fax: 202-522-2625; e-mail: [email protected].
editor Mark Mattson designer Sergio Andres Moreno Tellez cover photo Wandel Guides, Shutterstock.com

SUPPORTED BY:
Contents
Acknowledgements ....................................................................................................................... 7Executive Summary ..................................................................................................................... 9
How was the study done? .................................................................................................. 10
What did the study find? ..................................................................................................... 11
What lessons can countries draw from the study? ...................................................... 13
Recommendation 1–Protect the Asset ........................................................................... 13
Recommendation 2–Grow and Diversify the Business ............................................. 13
Recommendation 3–Share the Benefits........................................................................ 14
1. Introduction ................................................................................................................................. 161.1. The State of Biodiversity ........................................................................................................ 17
1.2. Benefits of Protected Areas ................................................................................................. 18
1.3. Protected Area Coverage ...................................................................................................20
1.4. Protected Area Challenges .................................................................................................20
1.4.1. Protected Area Funding ......................................................................................... 23
1.4.2. Community Benefits ............................................................................................... 24
1.5. Rationale for the Study .........................................................................................................26
2. Assessing the Economic Impacts .......................................................................................302.1. Methodology ............................................................................................................................ 32
2.1.1 Estimating the Economic Impact of Tourism in Protected Areas ................... 32
2.2. Avenues for Economic Impacts of Protected Areas .................................................... 34
2.3. Lewie Model ........................................................................................................................... 36
2.4. Data Collection ...................................................................................................................... 37
3. Findings ........................................................................................................................................393.1. Country Context and Summary Statistics ........................................................................ 39
3.2. Key Findings From Country Case Studies ....................................................................... 48
Effects of Protected Area Tourism on Local Economies .......................................... 48
Return on Government Spending ..................................................................................52
Impact of Conflicts and Shocks ....................................................................................... 53
Impact of Government Policies ........................................................................................ 54
3.3. Study Limitations .................................................................................................................... 57

4. Policy Recommendations ..................................................................................................... 584.1. Protect Natural Assets ...........................................................................................................60
4.1.1. Formalize Protected Areas ......................................................................................60
4.1.2. Increase Public Investment in Protected Area Management ........................60
4.1.3. Build Capacity of Protected Area Managers ..................................................... 64
4.1.4. Regularly Assess the Effects of Visitor Spending............................................. 64
4.2. Grow and Diversify Tourism Businesses ......................................................................... 64
4.2.1. Diversify Tourism Offerings .................................................................................... 64
4.2.2. Develop Concession Policies to Promote Tourism in Protected Areas ...65
4.3. Share Benefits with Local Communities .........................................................................68
4.3.1. Formalize Benefit Sharing Arrangements ..........................................................68
4.3.2. Strengthening Income Multipliers .......................................................................69
4.3.3. Mitigate and Compensate for Human-Wildlife Conflict ................................. 70
4.4. Green Recovery .................................................................................................................... 70
5. Conclusion .................................................................................................................................... 74
References ........................................................................................................................................76

Banking on Protected Areas is the result of a collaborative effort between the World
Bank (Urvashi Narain, Hasita Bhammar, Phoebe Spencer) and the University of
California, Davis (Prof. Edward Taylor, Heng Zhu, Edward Whitney, Anubhab Gupta,
Mateusz Filipski, Elisabeth Earley). We are also thankful to Jo Pendry and Laura Onofri
for their contribution to the report.
This global study synthesizes information from four country case studies. We are grate-
ful to the co-authors of these studies:
BRAZIL Prof. Carlos Eduardo F. Young, Alexandre Kotchergenko Batista, Camila Rizzini
Freitas (University of Rio de Janeiro); Sylvia Michele Diaz and Bernadete
Lange (World Bank.
FIJI Prof. Stuart Kininmonth (University of South Pacific); Jessie McComb (IFC).
NEPAL Sindhu Prasad Dhungana (Government of Nepal); Tijen Arin (World Bank);
Siddhartha Bajra Bajracharya (National Trust for Nature Conservation); and
Sagar Raj Sharma (Kathmandu University).
ZAMBIA Iretomiwa Olatunji, Ngao Mubanga (World Bank)
authors

Co
nte
nts
7PRoMotInG sUstAInABLe PRoteCteD AReA toURIsM to BeneFIt LoCAL eConoMIes
This report is supported by passionate individuals across many institutions and organi-
zations who are banking on protected areas to promote conservation and development.
The team is grateful for the support, encouragement, and overall guidance of Karin
Kemper, Iain Shuker, Christian Peter, Garo Batmanian, Raffaello Cervigni, Christophe
Crepin, Charlotte De Fontaubert, Ann Jeannette Glauber and Valerie Hickey.
Peer reviewers included: Richard Damania, Giovanni Ruta, Kirk Hamilton, Ross
Hughes, Shaun Mann, Juan Pablo Castaneda, Mimi Kobayashi, Maurice Rawlins, Julie
Rozenberg, Bernadete Lange, Renato Nardello, Lisa Farroway, Kasia Mazur, Jessie F.
McComb, Andre Aquino, Fei Deng, Sylvia Michele Diaz, David Kaczan (World Bank),
and Juha Siikamäki (IUCN). Valuable feedback was also provided by: Susan Pleming,
Wendy Li, Olga Gavryliuk, and Elisson Wright (World Bank).
Finance for the four country case studies was generously provided by the following
trust funds: PROBLUE and Window-3 funded the Brazil and Fiji studies; the Nepal study
was funded by WAVES; the Zambia study was funded by PROFOR. The global study
was supported by the Global Wildlife Program funded by the Global Environment
Facility.
BRAZIL Fernando P.M. Repinaldo Filho (Abrolhos Marine National Park); Betania
Fichino, Amanda Silva, Ricardo Castelli Vieira and Renata Carolina Gatti
(Brazilian Ministry of Environment); Adriana Moreira, Sergio Margulis, Paula
Montenegro, Wanessa Matos, Eduardo Romao Rosa, and Charlotte De
Fontaubert (World Bank); and Guilherme Dutra (Conservation International).
The dedicated and enthusiastic Brazil survey team includes: Lucas de A. N.
Costa, Maira L. Spanholi, Lucas Rolo Fares, Rodrigo Fernandes Gonçalves,
Daniel Sander Costa, Rodrigo Abreu Carvalho, Marcos P. Mendes, João
Augusto Muniz Videira, Gabriel Pabst da Silva, William John Hester, Aline
Guzenski Fioravanso, Patricia Camara de Brito, Miguel Ângelo Portela
Pinheiro, and Thais de Jesus Custodio.
FIJI Craig Strong, Saras Sharma (Ministry of Fisheries); Marica Vakacola
(Mamanuca Environment Society); Helen Sykes (Marine Ecology Consulting);
Lasse Melgaard, Cary Ann Cadman, Jeremy Webster, Sophie Egden, Luke
Vueta, and George Henry Stirrett (World Bank). The dedicated and enthusi-
astic Fiji survey team includes: Apimeleki Yasawa Nasokitabua, Reshma Ram,
Tony Tarivonda, Glen Bule, Noleen Lata Narayan, Simione Naivalu, Solomone
Volau, Leba Tavo Miller, Arishma Archna Ram, Shane Rico Henry, Adi Losana
Marama Tabuavuka Bulamaibau, Ruth Naomi Narawa, Shilpa Shupriya Lal, and
Gabriel Jacob Selema Mara.
NEPAL Saneer Lamichhane, Umesh Paudel, Tek Bahadur Gurung (National Trust for
Nature Conservation); Annu Rajbhandari and Sailja Shrestha, (World Bank).
The dedicated and enthusiastic Nepal survey team includes: Animesh
Shrestha, Saujan Khapung, Jeena Maharjan, Shikha Neupane, Pragya Joshi,
Aashruti Tripathy, Pema Sherpa, Muna K.C., Rijan Upadhyay, Sonu Gurung,
Pralita Rana Magar, Hrijata Dahal, Bidur Poudel and Rikesh Prasain from
Kathmandu University.
ZAMBIA Dr. Chuma Simukonda, Miyanda Gwaba (Department of National Parks and
Wildlife, Government of Zambia); Donald Banda (Chipata Town); Moses
Saul Kaoma (Lower Zambezi National Park); Nathalie Johnson, and Hellen
Mungaila (World Bank); Chiwala Matesamwa (Chiawa GMA); Alex Chidakel
and Brian Child (University of Florida); Petros Muyunda and Choizya Mbewe;
Ian Stevenson (Conservation Lower Zambezi); Keira Langford-Johnson
(PROFLIGHT Zambia); Adrian Coley (Flatdogs Camp); Paul Barnes (Pioneer
Camp); and Grant Cumings (Chiawa Camp). The dedicated and enthusiastic
Zambian survey team included: Alick Bruce Makondo, Kenneth Mulenga,
Sarai Sinyolo, Nozyenji Mwale, Janet Mulla, Chilufya Chisanga, Memory
Bwalya, Liseli Moira Banda, Mwila Lunda, Margret Mbewe, Chipo Shimoomba,
Christopher Chibwe, Keren Chakaba, and Vincent Katowa.
acknowledgements
Country Teams


Executive Summary
Globally, biodiversity is imperiled. The 2020
Living Planet Index reported a 68 percent
average decline in birds, amphibians, mammals,
fish, and reptiles since 1970; one third of the
world’s terrestrial protected areas are under
intense human pressure and about two-thirds of
the world’s oceans suffer from human impact, as
habitat loss and degradation, pollution, exploita-
tion, climate change and invasive species drive
catastrophic biodiversity losses.
Biodiversity matters because of its intrinsic
worth, and because ecosystem services, which
depend upon biodiversity, underpin human well-
being and support economic activity in a range
of sectors. Our survival is, finally, impossible
without intact natural landscapes and sea-
scapes. Land- and marine-based ecosystems
provide food, oxygen, water, carbon seques-
tration, resilience in the face of climate change,
and a buffer against pandemics. They also
foster economic activities such as tourism, which
attract eight billion visitors to protected areas in
a typical year. The need to protect these natural
areas has never been greater.
At the same time, the COVID-19 pandemic has
led to a deep global recession in which much
economic activity has declined and govern-
ments face increasing fiscal constraints and
challenges in allocating scarce resources to
support the health, security, and development
of their populations. The tourism sector too, has
suffered significant setbacks. In tourism-depen-
dent economies in Africa and the Caribbean,
for example, GDP is projected to shrink by 12
percent. Additionally, many biodiversity-rich
protected areas are located in far-flung, neglect-
ed rural regions, in which poverty is persistent.
Often, protected areas around these rural
communities help leverage tourism to provide
the few avenues available to support livelihoods
and address development challenges.
These intersecting calamities – a pandemic in
a time of biodiversity loss – call for a response
which speaks to both crises, addressing
economic losses and promoting recovery
through actions which simultaneously support
biodiversity conservation. Such a view brings
the world’s protected areas into much-needed
focus, as they are key to any global effort to
contain biodiversity loss. Their role in doing so
will be deliberated at the CBD COP-15 this year,
where threats to biodiversity and their impacts
on development will be stressed, and countries
will be encouraged to set aside more land and
marine areas for conservation.
How can countries address both crises? Can
countries afford to bring even larger areas
under protection when the need for economic
recovery is so pressing, fiscal spaces are tight,
and so many development challenges persist?
This study set out to make the case that it is
possible. That by promoting sustainable and
inclusive tourism in protected areas, countries
can respond to these escalating crises, recov-
er from the economic fallout of the pandemic,
address longstanding development challenges,
and conserve biodiversity.
While governments see protected areas as key
to addressing biodiversity loss, protected areas
are often overlooked in economic develop-
ment plans and economic recovery strategies.
One reason for this is that data gaps make it
difficult to demonstrate protected area tour-
ism’s far-reaching stimuli to national and local
economies, especially in developing countries.
Banking on Protected Areas study therefore
set out to quantify the impacts of protected
area tourism on local economies to show that
protected areas promote conservation and
development.
The study explores economic impacts on local
economies, as local economic development is
a goal in-and-of itself, and community support
is a critical concern for protected areas and is
needed to secure their long-term integrity. It
therefore estimates protected area tourism’s

ex
eC
UtI
ve
sU
MM
AR
y
10 BAnKInG on PRoteCteD AReAs
economic costs and benefits to local com-
munities, and explores how benefits may be
increased and costs reduced.
At the same time, a key challenge for protected
areas is lack of finance. Research shows that
poorly financed protected areas lose biodiver-
sity through poaching, livestock incursions, land
grabs, and illegal mining and logging; likewise,
funding has been found to be the most robust
predictor of successful ecological outcomes
in marine protected areas. Pre-pandemic
figures show a global biodiversity funding gap
of US$598–US$824 billion per year, a figure
mirrored for protected areas, which have lost
further funding due to the pandemic. Thus, the
study argues strongly for public investment in
protected areas by providing estimated rates of
return on investments.
How was the study done?
Four country case studies were undertaken:
two in terrestrial protected areas in Zambia and
Nepal, and two in marine protected areas in
Fiji and Brazil. While the number of countries
is small, the case studies - from Latin America,
Africa, Small Island States, and Asia - cover a
mix of economies, environments, and cultures.
Governments were consulted to select study
sites, and local students were trained to conduct
surveys of tourists, lodges, businesses, and
households. Information on production, income,
expenditure, and the locations of transactions
was gathered, and in each country, partnerships
with local universities grounded the case studies
in the socio-economic context. Study findings
were shared with stakeholders, both in-country
and globally, to enhance buy-in and quality.
Tourism in protected areas triggers
economic activities, and as these
activities expand, growing income
and expenditure increase the
demand for goods and services.
Contributions to the economy are
direct in the form of visitor spend-
ing on park fees, hotels, transport,
leisure and recreation, which create
employment and support local busi-
nesses; while indirect effects occur
when tourism businesses and em-
ployees further stimulate economic
activity by using the services of
other local businesses. These direct
and indirect impacts converge on an
income multiplier, which is defined
as the change in local household
incomes per unit of money entering
the local economy through tourist
spending, and is a measure of eco-
nomic impact. A general equilibrium
model is needed to estimate these
impacts, and the study adopts a
model known as LEWIE - Local
Economy-Wide Impact Evaluation.
The model attributes values to these
multipliers for a range of simulat-
ed, direct and spillover impacts,
allowing users to: (1) describe the
manner in which tourism stimulates
local economies, (2) clarify returns
on public investment in protected
areas, (3) understand impacts of
economic conflicts and shocks, and
(4) estimate the effects of govern-
ment policies.
figure es-1 Economic Impact Pathways for Protected Areas
Source: Adapted from Taylor and Filipski 2014.
TOURISTS VISITIN
GTOURISTS VISITIN
G
PARK AUTHORITY,GOVERNMENT
LOCAL FARMSAND BUSINESSES
HOUSEHOLDSTOURISM,
LODGES ANDBUSINESSES
aa
a
Pay non-consumptive and consumptive fees and taxes
Pay a Park Entrance Fee
bBusinesses pay taxes and fees
Revenue sharing, community projects Environmental
Impact
Trade with outside/ non-local markets
Park hires guards or employs households for PA activities
aPurchase food, goods and
servicesb Source goods
and services
Purchase goods and services
aSpend money on lodging, tourist
activities
b
Wages paid to workers employed in tourism activities
cb,c
Local incomes increase;
households spend their income to
source goods
Protected AreasTerrestrial / Marine
a
b
Direct Impact
Indirect impact through production linkages
Legend of Pathways of Influencea. Direct impactsb. Production linkagesc. Income and consumption linkages

ex
eC
UtI
ve
sU
MM
AR
y
11PRoMotInG sUstAInABLe PRoteCteD AReA toURIsM to BeneFIt LoCAL eConoMIes
What did the study find?
Tourism in protected areas generates
significant income multipliers. Income
multipliers from tourism are greater than one
in all country cases, showing that local market
linkages are strong, and amplify tourist spending
(Figure ES-2); the multipliers also suggest that
income leakage from local economies is not
considerable. Multipliers across the four country
cases are also consistent, suggesting that a
healthy protected area tourism sector provides
similar income gains to local households across
a variety of contexts, despite variations in per
tourist spending and numbers of visitors.
Benefits are broad and help the poor. The
study reveals that tourism benefits households
directly involved in the tourism sector and those
indirectly linked with the sector. Households
benefit directly and indirectly through pro-
duction and income linkages - when tourism
operators hire local people and buy local
goods, and when households spend wages or
businesses spend profits earned through the
tourism sector. Study findings reveal that despite
the larger multiplier shares of non-poor house-
holds in most instances (Figure ES-3), tourism
appears to benefit the poor more, as normal-
izing multiplier shares by populations of poor
and non-poor residents (Figure ES-4) shows that
the multiplier shares per resident are higher for
poor residents than for non-poor in all country
case studies but one.
Tourism in protected areas also creates signifi-
cant job opportunities. Jobs are created directly
through tourism activities, and indirectly by
stimulating local economies. Beyond the number
of jobs, the share of employment supported
by the tourism sector is substantial. In Zambia,
tourism in protected areas generated jobs for
14 and 30 percent of working age populations
around the Lower Zambezi and South Luangwa
Parks, respectively. In Nepal, tourism-related
jobs around Chitwan National Park are held by
3 percent of the working age population, while
in Brazil’s coastal region this figure is 12 per-
cent. Tourism in Fiji’s Mamanuca Islands created
8,304 jobs (through direct and indirect channels),
employing 13 percent of the local population in
the Mamanucas and adjoining coastal areas. The
study accounts for jobs such as hotel employees,
tour operators, and restaurant workers, and those
employed as a result of the increased demand
for goods and services catalyzed by tourism
in sectors such as retail, services, and in some
instances agriculture, livestock, and fishing.
figure es-2 Income Multipliers, 2019
ZambiaLower Zambezi
ZambiaSouth Luangwa
BrazilAbrolhos
Marine Park
0.00
0.50
1.00
1.50
2.00
2.50
3.00
Inco
me
mul
tiplie
r
NepalChitwan
National Park
FijiMamanuca
Islands
1.821.53
1.78 1.74 1.83
Source: World Bank
figure es-3 Income Multipliers by Household Type, 2019
LowerZambezi
SouthLuangwa
ChitwanNational Park
AbrolhosMarine Park
MamanucaIslands
Zambia Nepal Brazil Fiji
0
0.2
0.4
0.6
0.8
1
1.2
1.4
1.6
1.8
2
Inco
me
mul
tiplie
r
Poor Non-poor Island
Source: World Bank
Figure es-4 Normalized Income Multipliers by Household Type, 2019
LowerZambezi
SouthLuangwa
ChitwanNational Park
AbrolhosMarine Park
MamanucaIslands
Zambia Nepal Brazil Fiji
0%
20%
40%
60%
80%
100%
Perc
enta
ge o
f Mul
tiplie
r
Poor Non-poor Island
Source: World Bank

ex
eC
UtI
ve
sU
MM
AR
y
12 BAnKInG on PRoteCteD AReAs
Protected areas can impose costs on commu-
nities which must be managed. Human-wildlife
conflict around terrestrial protected areas, and
fishing restrictions in marine protected areas,
can cause critical short-term income loss to
households which should be mitigated through
avoidance measures and timely compensa-
tion. In 2019, wildlife caused crop losses of 14
percent around the Lower Zambezi National
Park and 11 percent at South Luangwa National
Park in Zambia, and 9 percent around Chitwan
National Park in Nepal. Over this period, these
losses were estimated at US$1.8, 1.2 and 2.9
million in Lower Zambezi, South Luangwa and
Chitwan National Parks, respectively. Similarly,
marine protected areas may cause short-term
income loss by restricting fishing, a major means
of livelihood. Often, those suffering the negative
effects of proximity to protected areas may not
be major beneficiaries of tourism, and these im-
balances should be redressed in order to build
much-needed community support.
Public investment in protected areas pays off,
and generates high economic returns. Rates
of return on government spending are signifi-
cantly greater than one, making protected areas
valuable economic assets. As noted, tourism
triggers direct and indirect economic impacts in
local economies, which in turn generate rates
of return on government spending of between
$6.2–$-28.2 for every public dollar invested.
This accrual of economic benefits relative to
government investment in protected areas
reveals the potential of these areas to promote
green economic recovery and support sustain-
able development.
Together, these findings make the case for gov-
ernments to promote sustainable and inclusive
tourism in protected areas to stimulate econom-
ic growth and create jobs. Caution is warranted
when drawing lessons from the four country
case studies, however. For example, because
the study uses a static model, it cannot account
for fluctuations in natural resources which
affect incomes, or the negative environmental
impacts of tourism, both of which may reduce
the economic benefits of tourism in protected
areas. Also, the model does not account for the
value of other ecosystem services supplied by
protected areas, the focus on local economies
neglects the wider economic advantages of
tourism, and lack of data prevents the mod-
el from capturing all economic linkages and
effects. These constraints, when addressed, will
increase economic impacts. Finally, the results
cannot be easily generalized, as individual sites
do not represent the entire protected area
system in a given country, which may contain
both tourist hotspots and areas in which tourism
is not viable.
figure es-5 Annual Estimated Rate of Return on Government
Spending, 2018–2019
ZambiaLower Zambezi
ZambiaSouth Luangwa
NepalChitwan
National Park
BrazilAbrolhos
Marine Park
0
5
10
15
20
25
30
35
Rate
of R
etur
n
16.7
28.2
6.2 7.6
Source: World Bank
figure es-6 Framework for Sustainable Tourism in Protected Areas
Source: World Bank

ex
eC
UtI
ve
sU
MM
AR
y
13PRoMotInG sUstAInABLe PRoteCteD AReA toURIsM to BeneFIt LoCAL eConoMIes
What lessons can countries draw from the study?
While the findings of this study cannot be ap-
plied to all protected areas, they offer lessons
from diverse settings from which policies can
be tailored. Central to all efforts, however, is
the need to fund and manage protected areas
well, promote tourism and diversify its offerings,
and share benefits with local communities fairly.
Taken together, these three factors can enhance
development outcomes, secure biodiversity
assets and support economic recovery from the
pandemic.
recommendation 1 Protect the Asset
Formalize Protected Areas. To protect these
natural assets, it is necessary to formalize their
status. Even if this action restricts resource use,
such losses may be offset, as exploited wild
stocks recover and disperse under formal pro-
tection. Formalization also confers authority on
governments to raise environmental standards
and reduce the negative impacts of tourism,
and this demonstrated commitment to conser-
vation can stimulate private sector investment in
tourism services.
Increase Public Investment in Protected Area
Management. The study advocates strongly for
investment in protected area management; and
to accomplish this, it supports the use of finan-
cial instruments such as public budgets, as well
as innovative mechanisms to tap private sector
resources such as conservation trust funds,
carbon finance, conservation bonds and collab-
orative public-private management partnerships.
Build Capacity of Protected Area Managers.
To deliver the benefits described in this study,
protected areas must be well managed, and
the underlying factors associated with poor
performance must be addressed. Successful
protected areas have qualified managers who
understand protected area laws and policies,
and the business needs of tourism operators
and commercial entities. For example, managing
commercial visitor services requires abilities that
go beyond the skills of wildlife management,
and this capacity must be built.
Monitor Visitors and Impacts. To make the
case for public spending, and to aid planning,
governments and conservation agencies should
regularly assess the impacts of protected area
tourism, and use surveys to capture visitor num-
bers, tourist spending, and seasonal changes in
tourism behavior. Such information can shape
policies, improve tourist services, assist local
communities, refine tourism business models,
and demonstrate the economic returns of in-
vesting in protected areas.
recommendation 2 Grow and Diversify the Business
Diversify Tourism Offerings. In many countries,
protected area tourism is focused on a few key
locations, which concentrate both positive and
negative tourism impacts. In the countries fea-
tured in this study, this concentration of visitors
at well-known sites makes it important to ex-
pand the number of protected area sites, and to
select priority sites on the basis of road access,
security, biodiversity, landscape attractions, and
local stakeholder interest in tourism. To dilute
negative impacts, the study also advocates the
selection of an expanded network of protected
areas for phased tourism development, based
on various desirability and feasibility criteria
through which sites can be ranked to identify
optimal opportunities for private sector partici-
pation and community benefits.
Develop Concessions Policies. Another
means to promote tourism in protected areas
is through concessioning, which can enhance
park operations through managing and financing
infrastructure, and providing services such as
accommodation, food, merchandise, recreational
activities, rental equipment, and transport. Similar
approaches to outsource tourism development
may include leases, management contracts, and
licensing, and such mechanisms should stipulate
key terms and conditions for business operation,
such as duration, type of operation, environmen-
tal conditions, and fees for access. Concessions
programs should include strong protected
area laws and regulations, public support for
proposed commercial activities, demonstrat-
ed economic benefits, stakeholder input into
concession operations, and legal frameworks to
support implementing agencies.

ex
eC
UtI
ve
sU
MM
AR
y
14 BAnKInG on PRoteCteD AReAs
recommendation 3 Share the Benefits
Formalize Benefit Sharing. As noted, protected
area neighbors are essential stakeholders, and
sharing benefits in these communities across
poor and non-poor households is key to main-
taining protected area integrity. Perhaps most
importantly, these benefits should be distributed
fairly by including the poor and disadvantaged,
and the study recommends that policies be
put in place to enable this. Advocated benefit
sharing approaches include direct and indirect
employment, revenue sharing by protected
area authorities, revenue sharing schemes from
tourism businesses and partnerships, sustain-
able utilization of plants and animals, and shared
decision making and capacity building.
Strengthen Income Multipliers. Because
tourism is the strongest lever for delivering
protected area benefits to communities, govern-
ments should assist households to participate in
the tourism economy through entrepreneurship
training, skills development, credit services and
logistics; governments should also support busi-
ness diversification, and local procurement to
strengthen linkages in local economies, prevent
leakage and increase multipliers.
Mitigate and Compensate for Human-Wildlife
Conflict. Mitigation and compensation are
fundamental to managing human-wildlife conflict
and help to secure support for conservation
from local communities who are critical ben-
eficiaries and conservation allies. The study
stresses the need for well-managed compensa-
tion payouts that are timely and transparent. The
determination of losses to park neighbors, such
as crop losses, is very difficult, and the study
also advocates further research, standardized
methods for estimating crop losses, and local
level management actions, such as seasonal
fences and the corralling of livestock, to mitigate
losses and build park-neighbor relations.
In conclusion, the pandemic has affected econ-
omies globally, leading to large losses in tourism
revenue, and a weakened, under-financed
conservation sector at a time of unprecedented
threats to the biosphere. In such a context, the
message of this study is crucial – countries must
champion sustainable and inclusive tourism in
protected areas in order to recover from the
pandemic, conserve biodiversity, and promote
sustainable development. This study reveals
that conserving biodiversity and promoting tour-
ism can together be compatible with a green,
post-pandemic revival that is driven by govern-
ments and the private sector, and yield high
returns from protected area investments. And in
responding to a pandemic that has heightened
awareness of inequality, protected area tourism
should distribute its benefits fairly in response
to development needs, and losses incurred by
protected area stakeholders.

ex
eC
UtI
ve
sU
MM
AR
y
15PRoMotInG sUstAInABLe PRoteCteD AReA toURIsM to BeneFIt LoCAL eConoMIes

IntR
oD
UC
tIo
n
16 BAnKInG on PRoteCteD AReAs
Introduction1

IntR
oD
UC
tIo
n
17PRoMotInG sUstAInABLe PRoteCteD AReA toURIsM to BeneFIt LoCAL eConoMIes
1.1 the state of biodiversity
Biodiversity has been declining globally at an
alarming rate. Scientists warn that the world may
be in the midst of its sixth mass extinction event,
this time caused by human activity (Barnosky
et al. 2011; Ceballos, Ehrlich, and Raven 2020;
Wake and Vredenburg 2008). A recent report of
the Intergovernmental Science-Policy Platform
on Biodiversity and Ecosystem Services (IPBES)
- Global Assessment Report on Biodiversity and
Ecosystem Services (IPBES 2019) - estimates
that over one million species are threatened with
extinction. The 2020 Living Planet Index reported
an average decline of 68 percent in monitored
vertebrate species populations between 1970
and 2016 (WWF 2020), while only three percent
of the ocean was free from human pressure in
2014 (IPBES 2019).
Biodiversity matters because of its intrinsic
value, and because biodiversity and ecosys-
tem services underpin human well-being,
livelihoods, and many of the Sustainable
Development Goals. As biodiversity declines,
so does the health of ecosystems on which key
sectors such as agriculture, fisheries, and water
utilities rely. Moreover, conserving biodiversity
is important for the world’s poor because their
livelihoods are linked to and dependent on
natural ecosystems, and renewable natural
capital makes up 23 percent of the wealth in
low-income countries (World Bank forthcoming).
Forests and trees provide vital resources to 1.3
billion people (World Bank 2016b), over three
billion people depend on marine and coastal
biodiversity for their livelihoods (UNDP n.d.)
and around 1 billion people depend to some
extent on wild meat, plants, mushrooms and
fish (FAO and UNEP 2020). Biodiversity and
ecosystem services also underpin a significant
number of jobs. Around 60 million people are
employed worldwide in fishing and fish-farming
(FAO 2020), and an estimated 45 million jobs
are provided by the formal forest sector (FAO
and UNEP 2020). Biodiversity and healthy
ecosystems mitigate climate change, while the
conversion of these systems increasingly risks
spillovers i.e. the emergence of zoonotic diseas-
es in humans (Gibb et al. 2020).
The greatest pressures on biodiversity stem
from habitat loss, fragmentation, and degrada-
tion (IPBES 2019). Land use change has caused
70 percent of global biodiversity loss (WWF
2020). Demand for agricultural land to meet
growing food needs has degraded land sur-
rounding protected areas, leading to reductions
in species richness and abundance (Newbold et
al. 2014). Studies also show the impact of roads
and infrastructure development on species
decline (Benítez-López, Alkemade, and Verweij
2010). Other threats to biodiversity include
over-exploitation of natural resources (including
hunting, fishing, and logging), pollution, invasive
species, and climate change (IPBES 2019) (see
Figure 1) (WWF 2020). Similarly, threats to marine
ecosystems include pollution, overfishing, and
figure 1 Drivers of Species Decline for Animal Groups
0% 20% 40% 60% 80% 100%
Reptiles andamphibians
Fishes
Mammals
Birds
Habitat degradation/loss
Exploitation
Invasive species & disease
Pollution
Climate change
Source: WWF 2018

IntR
oD
UC
tIo
n
18 BAnKInG on PRoteCteD AReAs
marine litter. Climate change is expected to drive
biodiversity loss, intensify other drivers, and lead
to higher extinction rates (Newbold 2018).
These threats are significant. One third of the
world’s terrestrial protected areas—2.3 million
square miles—are threatened by road expan-
sion, grazing, and urbanization (Jones et al.
2018), while about two-thirds of the world’s
oceans showed signs of increased human
impact between 2008 and 2013 (Halpern et
al. 2015), with climate change driving most of
these impacts (IPCC 2019). Over 30 percent of
fisheries are overfished (FAO 2020). An average
of 13,000 pieces of plastic litter can be found
on every square kilometer of ocean (UNDP n.d.)
and it is estimated that 4.8–12.7 million metric
tons of plastic waste enters the oceans every
year (Jambeck et al. 2015).
1 J. Reaser et al., (2020) define ‘landscape immunity’ as the ecological conditions that, in combination, maintain and strengthen the immune function of wildlife within an ecosystem.
The year 2020 was positioned to be a “su-
per year” for biodiversity. A number of global
conferences, including the Fifteenth Meeting
of the Conference of the Parties (COP-15) of
the Convention on Biological Diversity (CBD),
were planned to stress threats to biodiversity
and their impacts on development. COP-15
aimed to bring countries together to examine
progress toward the Aichi Biodiversity Targets
and to negotiate a post-2020 global biodiver-
sity framework (CBD 2019) to address growing
threats. The delayed CBD COP-15 will now be
held in 2021 and will deliberate the key roles of
protected areas in conserving biodiversity and
addressing global biodiversity decline.
1.2 benefits of protected areas
Protected areas, defined by IUCN as “area[s]
of land and/or sea especially dedicated to
the protection and maintenance of biological
diversity, and of natural and associated cultural
resources, and managed through legal or other
effective means,” are critical to maintaining the
earth’s biodiversity. Protected areas conserve
biodiversity, maintain habitats and species pop-
ulations, and confer resilience to climate change
(Duraiappah et al. 2005; Edgar et al. 2014;
Geldmann et al. 2013; Leverington et al. 2010;
Melillo et al. 2016; Roberts et al. 2017; Watson
et al. 2014). These areas provide ecosystem
services such as food and water, sediment
retention, and carbon storage. Well-managed
marine protected areas have been shown to
have five times more large fish biomass and
fourteen times more shark biomass than fished
areas (Edgar et al. 2014). In addition, protected
areas provide landscape immunity1 in the form
of undisturbed habitats which separate people
and wildlife, and from which zoonoses are less
likely (Reaser, Tabor, et al. 2020). With increas-
ing urbanization, the role of protected areas in
providing clean water is significant, as a third of
the world’s 100 largest cities rely on protected
areas for drinking water (Dudley and Stolton
2003). Terrestrial protected areas also seques-
ter 0.5 Pg C annually—approximately one-fifth
of the carbon sequestered by all land ecosys-
tems (Melillo et al. 2016). Fully protected marine
areas also build resilience against the effects of
climate change (Roberts et al. 2017).
Protected areas also support development and
are informally dubbed as “engines of develop-
ment,” because of their economic contribution
to communities living around them (den Braber,
Evans, and Oldekop 2018; Ferraro, Hanauer,
and Sims 2011). Naidoo et al. (2019) analyzed
socioeconomic and health data for 87,033 chil-
dren and 60,041 households in 34 developing
countries and concluded that people living near
protected areas are better off; households near
protected areas were on average 20 percent
wealthier, had a 26 percent lower probability of
being poor than those farther away, and were
healthier. Protection of poor areas has also been
found to reduce both poverty and deforestation,
on average (Ferraro, Hanauer, and Sims 2011).
A study in Nepal showed that protected areas
reduce poverty without increasing inequality, and
that these benefits were greater when a larger
proportion of the area was protected (den Braber,
Evans, and Oldekop 2018). Marine protected
areas, too, reduce poverty through improved fish
catches, benefits to health and women (Leisher,
Van Beukering, and Scherl 2007), and improved
human well-being (Ban et al. 2019).

IntR
oD
UC
tIo
n
19PRoMotInG sUstAInABLe PRoteCteD AReA toURIsM to BeneFIt LoCAL eConoMIes
Many countries also reap the benefits of na-
ture-based tourism, and from the perspective
of this report, such tourism arguably constitutes
the single strongest lever to achieve sustain-
able development goals through conservation.
Protected areas receive 8 billion visits a year
(Balmford et al. 2015) and before the COVID-19
pandemic, tourism, including in protected areas,
was a rapidly growing economic sector, provid-
ing 1 in 10 jobs globally (WTTC 2019b). Tourism
not only creates jobs through employment in ho-
tels and hospitality services, but also generates
park fees and other resources for conservation
and community development. In many develop-
ing countries, income derived from protected
areas is important to the economy (Balmford et
al. 2009). In the Galapagos, tourism contributed
to a 78 percent growth in income over six years,
creating the fastest growing economy in the
world (Taylor, Hardner, and Stewart 2009) over
this period. In Rwanda, mountain gorilla trekking
in the Volcanoes National Park is now the
country’s largest source of foreign exchange,
generating US$200 million annually (Maekawa
et al. 2013). Australia’s Great Barrier Reef has
been valued at AU$56 billion, contributes
AU$6.4 billion per year to the economy and
supports 64,000 jobs (Deloitte 2017). According
to the OECD, it is projected that ocean-based
industries such as marine and coastal tourism
will double their contribution to global val-
ue-added tourism by 2030 (OECD 2016). Global
coral reef tourism is valued at US$36 billion per
year—the equivalent of about 70 million tourist
visits to reefs (Spalding et al. 2017). In Africa,
a burgeoning wildlife economy contributes to
employment and revenues through diverse ac-
tivities (see Box 1) (Snyman et al. 2021), and such
nature-based tourism offers countries a means
to use natural resources to pursue sustainable
development.
Wildlife economy sectors and related activities
SECTOR WILDLIFE ECONOMY ACTIVITIES
Agriculture Game farming and ranching; live capture and sale; cropping and culling; wild harvest-ing; crops and livestock
Tourism Wildlife-based tourism; coastal tourism; recreation; sport fishing
Energy Hydro-electric; wave energy
Fisheries Multiple use of marine resources; freshwater fisheries; aquaculture and fish ranching; subsistence fishing
Forestry Timber; non-timber forest products
Health Bioprospecting
Trade and Industry
Commercial film and photography; wildlife products; bioprospecting; nature-based car-bon credits; other payments for ecosystem services; real estate
Other Education; research, including research involving off-take; cultural activities; religious activities
Source: Snyman et al. 2021
A wildlife economy is defined as “wildlife, plants and animals (marine and terrestrial), as an economic asset to create value that aligns with conservation objectives and delivers sustainable growth and economic development” (Snyman et al. 2021). This includes consump-tive and non-consumptive uses, as described in Table 1.
In South Africa, for example, wildlife may be farmed on private land, which has led to an increase in game farming and growth in the wildlife economy. It is estimated that the informal African Traditional Medicine industry is valued at about US$1.4 billion per year; in 2018, South African National Parks (SANParks) revenue from the sale of fauna and flora was US$1.3 million, and between 2005 and 2014, the value of South Africa’s exports of CITES*-listed species was estimated at US$1.1 billion.
box 1 Wildlife-Based
Economy in Africa

IntR
oD
UC
tIo
n
20 BAnKInG on PRoteCteD AReAs
1.3 protected area coverage
2 An OECM is a geographically defined area other than a Protected Area, managed to achieve sustained, long-term, in-situ conservation of biodiversity, ecosystem functions and services; and, where applicable, cultural, spiritual, and socio–economic values (CBD, 2018).
3 More than 90 percent of these losses are from ecosystem services that forests, wildlife and coastal resources provide, and that are not currently priced by the market, such as carbon storage, biodiversity, water filtration, and flood retention (World Bank 2019a).
In recognizing the need to protect biodiversity
and nature, and the role of protected areas
in meeting this goal, several countries have
increased terrestrial and marine areas under
protection over the past decade (see Figure 2).
In part, these increases reflect countries’
commitments to the CBD Aichi Biodiversity
Target 11 to conserve by 2020: “at least 17%
of terrestrial and inland water areas and 10%
of coastal and marine areas, especially areas
of particular importance for biodiversity and
ecosystem services, through effectively and
equitably managed, ecologically representa-
tive and well-connected systems of protected
areas and other effective area-based conser-
vation measures and integrated into the wider
landscape and seascape.” While this target has
not been fully met, countries have made signif-
icant progress, setting aside approximately 15
percent of the planet’s land and 7.6 percent of
its oceans (UNEP-WCMC and IUCN, 2020; see
Figure 3). The post-2020 framework is expected
to be ambitious, and to call on countries to set
aside more land for protection and biodiversity
conservation. Additionally, since 2018, other
effective area-based conservation measures
(OECM)2 have been recognized as essential to
achieve conservation targets outside of protect-
ed area networks. As of September 2020, there
are 146 OECMs covering almost 61,000 km² of
land and over 273,000 km² of ocean (Dudley et
al. 2018).
1.4 protected area challenges
While Figure 3 suggests significant areas under
protection, such areas face challenges which
severely limit their efficacy. For example, in the
Pacific Ocean’s Coral Triangle, an assessment of
coral reefs in marine protected areas found that
only 1 percent of these areas were effectively
managed (Burke et al. 2011). Poor management
of protected areas can lead to deforestation,
which may lead to a loss of formal protection
through downsizing or degazetting (Mascia and
Pailler 2011; Tesfaw et al. 2018).
An analysis of the Global Database on Protected
Area Management Effectiveness reported that
less than a quarter of protected areas had ade-
quate staff and budgets (Coad et al. 2019), and
that this hampered conservation, habitat man-
agement, patrolling, community engagement,
and wildlife monitoring. Other challenges relat-
ed to lack of management plans, equipment and
infrastructure, while the size and designation
of protected areas may also limit conservation
outcomes (Hockings 2006).
The illegal wildlife trade is the fourth larg-
est global criminal enterprise, exceeded
in value only by drug, human trafficking,
and counterfeiting activities. Challenges to
combatting wildlife crime include weak legis-
lation and limited law enforcement capacity
(UNODC 2020). Wildlife crime is a growing
threat to wildlife in protected areas. There are
reports of increased poaching and exploitation
of natural resources in Asia and southern and
eastern Africa (Hockings, Dudley, and Elliott
2020). Poaching in marine protected areas as a
result of poor enforcement has also been doc-
umented (Bergseth et al. 2018). A World Bank
study found that over the period 2010–2016
more than US$2.35 billion was invested in
combatting the illegal wildlife trade in Africa and
Asia, US$948 million of which was dedicated
to protected area management as a strategy to
reduce poaching (World Bank 2016a). This is a
small amount compared to the estimated costs
of illegal logging, fishing and trade in wildlife
which are estimated to be over US$1 trillion
annually3 (World Bank 2019a). Illegal fishing is
responsible for the loss of 11–26 million tons of
fish each year, equivalent to US$10–23 billion
(FAO 2019).
Competition over natural resources intensifies
the challenges to protected area management.

IntR
oD
UC
tIo
n
21PRoMotInG sUstAInABLe PRoteCteD AReA toURIsM to BeneFIt LoCAL eConoMIes
So
urc
e: U
NE
P-W
CM
C a
nd
IUC
N 2
02
0
Figu
re 2
Gro
wth
in
Pro
tect
ed
Are
as
sin
ce 2
010

IntR
oD
UC
tIo
n
22 BAnKInG on PRoteCteD AReAs
Figure 3 Terrestrial and Marine Protected Area Percentages Per Country
Source: Adapted from Maxwell et al. (2020), using data from UNEP-WCMC and IUCN 2020.
Note: The figure is showing the increase in area coverage (%) per year for marine and terrestrial protect-
ed-area estates for countries >25,000 km².

IntR
oD
UC
tIo
n
23PRoMotInG sUstAInABLe PRoteCteD AReA toURIsM to BeneFIt LoCAL eConoMIes
In Latin America, large scale habitat loss from
agricultural expansion, infrastructure develop-
ment, cattle ranching, and fires threaten fragile
ecosystems. Human encroachment is increasing
across the world’s protected areas as well. In
sub-Saharan Africa, cropland coverage inside
protected areas has increased at nearly double
the rate of coverage in non-protected areas.
In Latin America, outside the Amazon biome,
agricultural pressure increased by 10 percent in
protected areas (Geldmann et al. 2019).
Poor management can also increase human-wild-
life conflict, leading to loss of livelihoods for
communities living near protected areas, loss of
wildlife through retaliation, and diminishing sup-
port for conservation (Hill, Osborn, and Plumptre
2002). Over 75 percent of the world’s felid
species are at risk through human-wildlife conflict
(Inskip and Zimmermann 2009).
Lack of finance and community engagement to
support conservation are likely the most critical
challenges to the management of protected
areas and are discussed below.
1.4.1 Protected Area Funding
Research in marine protected areas has shown
that funding is the most robust predictor of suc-
cess for ecological outcomes (Gill et al. 2017),
and that poorly financed protected areas
lose biodiversity through poaching, livestock
incursions, land grabs, and illegal mining and
logging.
Broadly, the global biodiversity funding gap
hovers between US$598 billion and US$824
billion per year (Deutz et al. 2020), and these
gaps are mirrored for protected areas, which are
underfunded worldwide (Coad et al. 2019; Gill et
al. 2017; IUCN ESARO 2020; Waldron et al. 2017;
Watson et al. 2014). Nearly all protected areas
in Africa are inadequately funded, and a deficit
of US$1 billion annually must be addressed to
save iconic species and landscapes (Lindsey
et al. 2018). Protected areas in Latin America
are under-funded by approximately US$700
million annually, and this figure is likely to grow
(Bovarnick et al. 2010). The funding needed for
a global network of marine protected areas cov-
ering 20–30 percent of the seas is estimated to
be between US$5 and US$19 billion per year
(Balmford et al. 2004).
figure 4 Concentration of Biodiversity in the Tropics
Species density distribution cross the world
Source: Pirlea et al. 2020
AMPHIBIANS
BIRDS
MAMMALS

IntR
oD
UC
tIo
n
24 BAnKInG on PRoteCteD AReAs
1.4.2 Community Benefits
The tropics are home to a large share of the
world’s biodiversity, as seen in Figure 4 (Barlow
et al. 2018; Raven et al. 2020). Areas in these
latitudes also have high levels of poverty
(Figure 5). The relationship between protected
areas and poverty is, however, complex. Many
poor, rural communities depend upon natural re-
sources for food, fuel, and livelihoods, and may
be prevented from harvesting these resources
from protected areas; in the short term this may
lead to a loss of support for conservation.
Local communities may bear other costs of bio-
diversity conservation, such as changes in land
tenure or governance, displacement, and the
costs of human-wildlife conflict (see Box 2).
In the absence of benefits from protected-ar-
ea tourism, communities bearing the costs of
human-wildlife conflict are unlikely to support
conservation, while the loss of tourism reve-
nues from local economies, known as revenue
leakage, may further alienate local communities.
In Uganda’s Bwindi Impenetrable National Park,
tourism leakage was estimated at over 75 per-
cent (Sandbrook 2010), while in Botswana, value
chain analysis showed only 37 percent retention
4 Benefit sharing mechanisms include tangible benefits such as jobs, direct income, and revenue sharing from park entrance fees; and intangible benefits include capacity building, skills training, and cultural benefits (Spenceley, Snyman, and Rylance 2019).
of tourism revenues in the local economy
(Rylance and Spenceley 2017).
Many governments recognize the importance
of benefit-sharing mechanisms4 (see Box 3)
to garner local support for protected areas
(Spenceley, Snyman, and Rylance 2019), but
even established mechanisms may fail to deliver
benefits (Spenceley, Snyman, and Rylance 2019)
for reasons including, but not limited to (i) exces-
sive bureaucratic processes, (ii) poorly designed
mechanisms in which benefits do not off-set
costs of conservation, are low, or are captured
by elites, or (iii) lack of agreement on means of
disbursement and recipients. It is also important
to note that benefits of living around protected
areas accrue collectively, while costs are borne
by individual households (Munanura et al. 2016).
Research indicates that equitable and transpar-
ent benefit-sharing may advance development
and conservation goals (Snyman and Bricker
2019), and that conservation and socioeconom-
ic gains are more likely when protected areas
pursue co-management, reduce economic in-
equalities, empower local people, offer cultural
benefits and reduce negative livelihood impacts
(Oldekop et al. 2016).
figure 5 Global Distribution of Extreme Poverty
Source: World Bank 2018

IntR
oD
UC
tIo
n
25PRoMotInG sUstAInABLe PRoteCteD AReA toURIsM to BeneFIt LoCAL eConoMIes
Human-wildlife conflicts typically occur in agricultural and production landscapes which are near protected areas. The impacts of human-wildlife conflict include, but are not limited to, loss of livelihoods from crop raiding, livestock depredation, damage to property and/or loss of life.
In Bhutan, a survey of 274 households living near the Jigme Singye Wangchuck National Park reported a yearly average financial loss equal to 17 percent of the total per capita cash income due to livestock predation (Wang and Macdonald 2006). Around Chebera-Churchura National Park in Ethiopia, a study of 145 house-holds estimated economic losses of US$75,234 caused by wildlife between 2007–2011, with 30 percent of livestock lost over a three year period (Acha, Temesgen, and Bauer 2018). In Uganda, a survey around Kibale National Park estimated that the average financial loss for farmers around
the park over six months was US$74 (1.5 percent of median household capital asset wealth). Approximately 73 percent of respondents expe-rienced crop raids in which 45 percent of their maize was lost to animals from the protected area (Mackenzie and Ahabyona 2012).
Global estimates of the costs of human-wildlife conflict are not available, and only 10 percent of studies on this topic have quantified its economic impacts (Inskip and Zimmermann 2009). These studies reveal that (i) direct costs are unevenly distributed within communities (Thirgood, Woodroffe, and Rabinowitz 2005); (ii) individual/household losses may be severe (Woodroffe et al. 2005); and (iii) economic costs only partially describe social and cultural im-pacts because livestock and produce are forms of wealth which enhance resilience (Dickman, Macdonald, and Macdonald 2011).
box 2 Human-Wildlife
Conflict Costs to Local Communities
To work towards a pro-poor distribution of ben-efits, governments in several African countries have instituted mechanisms to share a per-centage of park and protected area entry fees with neighboring communities. These funds are typically invested in local projects rather than distributed as direct cash transfers (Mitchell and Ashley 2009).
In Kenya, local governments distribute ap-proximately 19 percent of tourism revenues under their jurisdictions to local communities living next to protected areas including Maasai Mara National Reserve, Lake Bogoria National Reserve, and Samburu National Reserve. In parks run by the Kenya Wildlife Service, a percentage of park fees is invested in community projects through their Community Service department (Weru 2007). In Tanzania,
revenue shares of 7.5–25 percent of fees from tourism and hunting benefit local communi-ties through development projects such as schools, clinics, bridges, water infrastructure, and training programs (Mtui 2007). In Rwanda’s National Parks, a 2005 scheme distributed 5 percent of park revenues through local districts (Verdugo 2007), while in Namibia, members of the Namibia Association of Community Based Natural Resource Management Support Organizations (NACSO) receive up to 40 percent of revenues from community conser-vancies in the form of cash incomes, game meat, or development projects (IUCN ESARO 2020). Spenceley, Snyman, and Rylance (2019) describe many more African exam-ples of revenue sharing between protected area authorities/tourism businesses and local communities.
box 3 Efforts to Share Benefits
from Tourism in Protected Areas in Africa

IntR
oD
UC
tIo
n
26 BAnKInG on PRoteCteD AReAs
1.5 rationale for the study
Government spending is generally determined
by limited resources and competing demands,
and under such conditions, governments may
be reluctant to invest in protected areas if they
are unable to quantify the economic returns
provided by such areas to local and national
economies. If returns on public investment are
not demonstrated, this reinforces the perception
that protected areas “do not pay for themselves”
and that funding protected areas funds only
conservation. Thus, it is crucial to be able to
demonstrate to governments that investing in
protected areas helps economic growth, and
that protected area tourism can advance sustain-
able development agendas.
In countries where returns on protected area
investments are tracked, governments have
found wide-reaching benefits. The United States,
for instance, invests US$3 billion annually in
its national park system which contributes up
to US$20 billion to GDP via visitor spending in
gateway communities (Cullinane Thomas and
Koontz 2020). Similarly, Parks Canada gener-
ated returns to GDP of US$3.1 billion, and tax
revenues of almost US$0.4 billion for a public
investment of approximately US$1 billion (Parks
Canada Agency 2019). In countries across
southern Africa, nature-based tourism reportedly
generates revenues comparable to farming, for-
estry, and fisheries combined (Scholes and Biggs
2004). Such evidence vindicates government
investment in national parks and other protected
area systems, and advances conservation and
development goals. However, such evidence is
often lacking in developing countries.
Tourism in protected areas is arguably the most
important lever to deliver economic bene-
fits such as jobs to communities living near
protected areas, and thus, a major objective of
this report is to describe these benefits to local
economies in order to advance the case for
investment in conservation. Tourism activities in
protected areas vary depending upon the IUCN
designation of the protected area (see Figure 6).
In 2018, for example, wildlife tourism contributed
US$120.1 billion in GDP to the global economy
and sustained 21.8 million jobs (WTTC 2019a). An
analysis of over 240 protected areas, covering
40 million hectares, in seven countries in eastern
and southern Africa (Kenya, Tanzania, South
Africa, Namibia, Eswatini, Uganda and Ethiopia)
found that nature-based tourism accounted
for approximately 80 percent of the income
generated by protected areas (IUCN ESARO
2020) (see Figure 7). Such evidence strength-
ens the economic case for public investment
in protected areas, much like investments in
roads and other forms of public infrastructure
and assets needed for development. Describing
the other benefits of protected areas to local
economies, including ecosystem services,
biodiversity conservation, habitat support, and
climate co-benefits, is beyond the scope of this
work. The second main objective of this study is
to understand how tourism helps local communi-
ties, the ripple effects these benefits produce in
local economies, and how these benefits can be
improved and equitably distributed.
It is important to note that tourism is not a pana-
cea for challenges faced by protected areas. Not
all protected areas can attract tourists, who avoid
some destinations out of concern for safety, lack
of infrastructure, or accessibility. The growth
of protected area tourism may also generate
adverse impacts such as degradation of habitats
and pollution (Newsome and Hughes 2018),
and this study draws attention to these impacts
where possible, and offers recommendations
to manage them. The role of private finance will
be key in addressing significant resource gaps
for biodiversity conservation. While beyond the
scope of this study, we draw attention to the re-
port: ‘Mobilizing Private Finance for Nature’ (see
Box 4), which addresses this topic.
objectives of the report
» To assess the effects of protected area tourism on local economies
» To estimate the benefits of tourism for local communities and to explore
how these benefits can be improved
» To assess the impact of COVID-19 and potential for green recovery

IntR
oD
UC
tIo
n
27PRoMotInG sUstAInABLe PRoteCteD AReA toURIsM to BeneFIt LoCAL eConoMIes
figure 7 Tourism Generates Approximately 80% of All Revenues from
Protected Areas in Eastern and Southern Africa
81%Tourismrevenue
15%Other
2%Hunting
Revenue
1%Shop/ Merchandise sales
1%Harvesting and sales of natural products
0%Carbon credits,biodiversity o�sets,other PES
0%Filming and photography
Source: Adapted from IUCN ESARO 2020
Note: Countries included in the figure are Ethiopia, Eswatini, Kenya, Namibia, South Africa,
Tanzania, and Uganda
figure 6 IUCN Protected Area Categories
IUCN Protected Area Category*
Primary goal and protected value(s) Approach to tourism and visitor use
Ia) Strict Nature Reserve Biodiversity or geoheritage protection (ecological and scientific values)
• Public access only possible through organized scientific, citizen science or volunteer service programs
Ib) Wilderness Area Protection of the natural character and condition of unmodified or slightly modified areas (wilderness and ecological values)
• Low-density, self-reliant visitor use is often a management objective
• Restricted public access in terms of amount of use, group size, activity, etc.
• Tourism activity limited and highly regulated (e.g., through special use permits)
II) National Park Protection of an ecosystem and its large-scale ecological processes (ecological, recreation, and community values)
• Visitor use and experience is often a management objective
• A range of recreation opportunities typically provided through zoning, facility development, and visitor services (countries have marked differences in their attitudes to tourism accommodation within protected areas)
III) Natural Monument Conservation of specific natural features (ecological, recreation, and community values)
• Visitor use and experience is often a management objective
• Recreation opportunities are typically provided to facilitate feature protection and public understanding
IV) Habitat/ Species Management Area
Conservation through management intervention (ecological, community, and recreation values)
• Recreation visitation and commercial tourism are usually management objectives
• A range of recreation opportunities is provided with associated facilities and services
• Commercial tourism common for wildlife viewing
V) Protected Landscape/ Seascape
Landscape/ seascape conservation (community, ecological, and recreation values)
• Tourism is usually a management objective
• A range of recreation opportunities is provided with associated facilities and services
• Commercial tourism common
VI) Managed Resource Protected Area
Sustainable use of natural ecosystems (community, recreation, and ecological values)
• Recreation visitation and commercial tourism can be key objectives
• A range of recreation opportunities is provided with associated facilities and services
• Commercial tourism common
Source: World Bank 2020c

IntR
oD
UC
tIo
n
28 BAnKInG on PRoteCteD AReAs
This study comes at a time when the economic
fallout of the COVID-19 pandemic is jeopardizing
conversation efforts, and has impacted tourism
worldwide. The real GDP for tourism-dependent
economies in Africa and the Caribbean nations
is projected to shrink by 12 percent (IMF 2020)
against a projected global average contraction
of 4.4 percent. The tourism sector is the largest
market-based contributor to protected area
financing (Spenceley, Snyman, and Eagles 2017),
and thus, its decline will jeopardize conservation,
protected area management and the financial
stability of the conservation sector (Peter Lindsey
et al. 2020). As the pandemic has tragically
demonstrated, over-dependence on tourism to
fund basic conservation activities can lead to
financial losses which jeopardize protected area
systems and decades-long efforts to promote
conservation. Additionally, communities around
protected areas, many of whom are extremely
poor, and depend on benefits from tourism, are
burdened with the loss of these benefits. Thus,
an additional objective was added to this report:
to assess the impact of the COVID-19 pandem-
ic on tourism in selected sites and propose a
pathway for green recovery.
The audience for this report is wide ranging,
from policy makers in low and middle-income
countries, especially from the Ministries of
Finance, Economic Planning, Tourism, and the
Environment; to conservation practitioners, tour-
ism operators, civil society organizations, and
donors who wish to support protected areas.
A 2020 World Bank report, ‘Mobilizing Private Finance for Nature’, flags the need to attract private finance to address the systemic impacts on economies of the rapid loss of biodiversity and ecosystem services. While public sector financing is insufficient in the face of this challenge, the report highlights the role of the public sector to support an enabling and incentivized regulatory environment, to provide data, and to help investors understand the value of nature and the financial and economic risks associated with its loss.
The report highlights the growing private sector interest in—and capital available for—biodiversi-ty financing, and notes the approaches that are emerging to address the challenges investors face – namely, lack of steady cashflows, below-market returns, and the small scale and heterogeneity of conservation initiatives. Examples include PPPs which blend conservation efforts with commercial nature-based activities, or increase the flow of capital to conservation via diverse commercial revenue streams such as the sale of carbon credits in the voluntary carbon market, tourism projects, and sustainable agriculture, often working with local communities. Private sector stakeholders are also working with public sector managers to attract new sources of revenue for conservation projects and to manage them more effectively. Innovative financing mechanisms, including environmental impact bonds and insurance (such as the para-metric coral reef insurance policy in Quintana Roo, Mexico) can broaden the investor base and reduce funding shortfalls.
Source: World Bank Group 2020a
box 4. Opportunities to Mobilize Private Finance for Nature
IntR
oD
UC
tIo
n
29PRoMotInG sUstAInABLe PRoteCteD AReA toURIsM to BeneFIt LoCAL eConoMIes
Ass
ess
InG
th
e e
Co
no
MIC
IM
PAC
ts
30 BAnKInG on PRoteCteD AReAs
Assessing the Economic Impacts
2

Ass
ess
InG
th
e e
Co
no
MIC
IM
PAC
ts
31PRoMotInG sUstAInABLe PRoteCteD AReA toURIsM to BeneFIt LoCAL eConoMIes
Four country case studies were undertaken to
pursue the objectives of the report as given in
the previous section. Two of these case studies
focused on terrestrial protected areas – in
Zambia and Nepal – and two focused on marine
protected areas (MPAs) – in Fiji and Brazil (see
Table 1). This global report synthesizes the find-
ings of the four country case studies, each of
which is also available as a standalone report.
These four countries cover a mix of economies,
environments and cultures. Ongoing World Bank
engagements on protected areas and tourism
helped to align this study with existing priori-
ties, and protected area sites were selected in
consultation with governments. The criteria for
selecting the sites are provided (see Box 5).
Furthermore, in each country, the study focused
on one or two protected areas due to financial,
logistical and time constraints. At the same time,
the intent was to pilot a robust methodology,
build local capacity, and formalize methods for
similar studies globally.
BRAZILAbrolhos Marine National Park, IUCN Category II
FIJITavarua, Navini, and Malolo (Mamanuca Islands archipelago)
NEPALChitwan National Park, IUCN Category II
ZAMBIALower Zambezi National Park, IUCN Category II
South Luangwa National Park, IUCN Category II
table 1 Protected Area Study Sites
MARINE PROTECTED AREAS TERRESTRIAL PROTECTED AREAS
Box 5. Criteria for Site Selection
i. Tourism numbers are sufficient for sampling purposes
ii. Site is a formally designated protected area or in the process of registration
iii. Government buy-in and/or recommendation for the site
iv. Manageable logistics for site visits
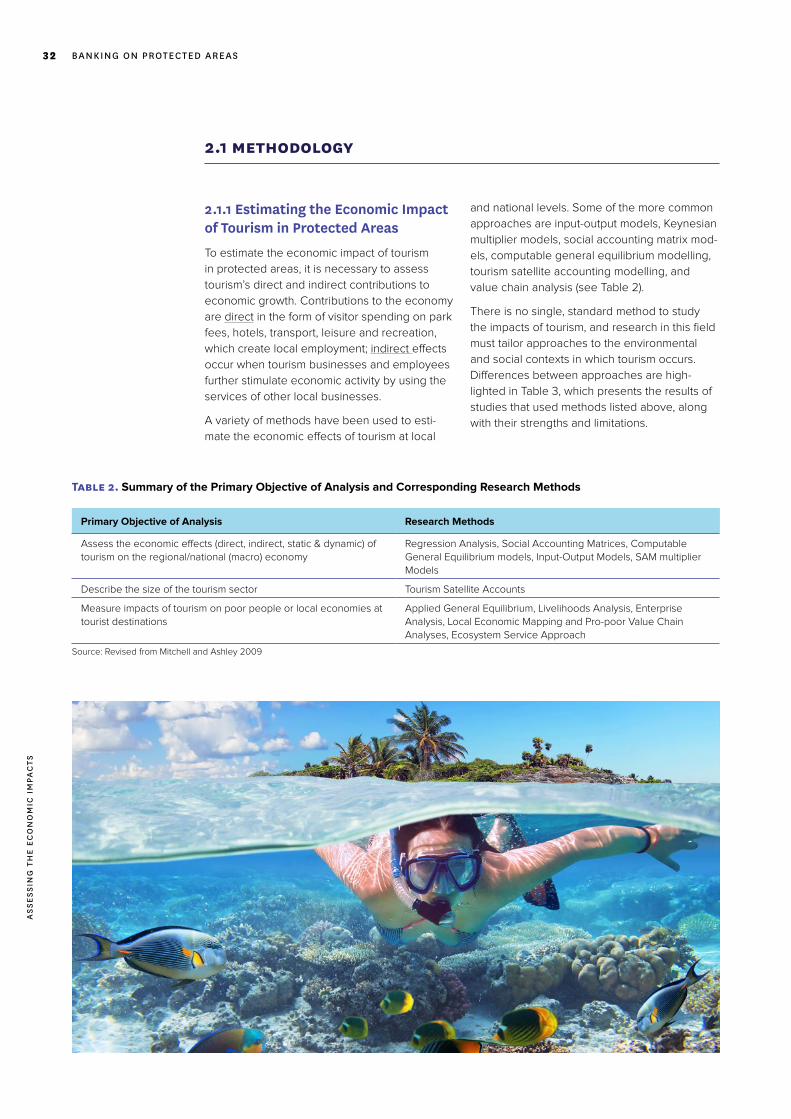
Ass
ess
InG
th
e e
Co
no
MIC
IM
PAC
ts
32 BAnKInG on PRoteCteD AReAs
2.1 methodology
2.1.1 Estimating the Economic Impact of Tourism in Protected Areas
To estimate the economic impact of tourism
in protected areas, it is necessary to assess
tourism’s direct and indirect contributions to
economic growth. Contributions to the economy
are direct in the form of visitor spending on park
fees, hotels, transport, leisure and recreation,
which create local employment; indirect effects
occur when tourism businesses and employees
further stimulate economic activity by using the
services of other local businesses.
A variety of methods have been used to esti-
mate the economic effects of tourism at local
and national levels. Some of the more common
approaches are input-output models, Keynesian
multiplier models, social accounting matrix mod-
els, computable general equilibrium modelling,
tourism satellite accounting modelling, and
value chain analysis (see Table 2).
There is no single, standard method to study
the impacts of tourism, and research in this field
must tailor approaches to the environmental
and social contexts in which tourism occurs.
Differences between approaches are high-
lighted in Table 3, which presents the results of
studies that used methods listed above, along
with their strengths and limitations.
Table 2. Summary of the Primary Objective of Analysis and Corresponding Research Methods
Primary Objective of Analysis Research Methods
Assess the economic effects (direct, indirect, static & dynamic) of tourism on the regional/national (macro) economy
Regression Analysis, Social Accounting Matrices, Computable General Equilibrium models, Input-Output Models, SAM multiplier Models
Describe the size of the tourism sector Tourism Satellite Accounts
Measure impacts of tourism on poor people or local economies at tourist destinations
Applied General Equilibrium, Livelihoods Analysis, Enterprise Analysis, Local Economic Mapping and Pro-poor Value Chain Analyses, Ecosystem Service Approach
Source: Revised from Mitchell and Ashley 2009

Ass
ess
InG
th
e e
Co
no
MIC
IM
PAC
ts
33PRoMotInG sUstAInABLe PRoteCteD AReA toURIsM to BeneFIt LoCAL eConoMIes
Table 3. At a Glance: Key Studies on Local or National Economic Impacts
5 Approach uses IMPLAN multipliers to scale up estimates from individual protected areas to national levels. IMPLAN leverages granular data across industries to calculate multipliers for regions of interest and ensures that the analysis represents complete impact. The foundation upon which IMPLAN economic impact analyses are built is the input-output (I-O) model.
Method Description Strength/ Limitations Case study example
Tourism Expenditure Survey + Input-Output Table
Survey conducted on visitor expenditures among domestic and international tourists at border crossings. These are combined with IO tables (based on a matrix of inter-sectoral flows accounting for the intermediate demand for goods and services between economic sectors) to estimate economic impact of tourist spending at national level.
Strengths: Provides information on tourist expenditures, characteristics, and satisfaction; and estimates impact on value added, wages, employment, tax revenue, and imports.
Limitations: Only direct impacts, and indirect production linkages are considered. Does not consider household consumption linkages. Impacts not disaggregated by households, firms, or other institutions. Factor of production and output prices do not vary.
Zambia - The average protected area tourist spent US$1,100 (2005 US$) per trip in Zambia in 2005, adding up to a total of US$194 million or 3.1% of 2005 GDP for the 176,000 tourists. 19,000 formal jobs were created (World Bank 2007).
Uganda -The analysis shows that tourist exports amounted to US$431 million in 2019 (2019 US$), or 6.3% of total exports (World Bank 2019b).
USA – Visitor Spending Effect Model of the US NPS:5 In 2019, NPS visitor spending directly supported 204,800 jobs, $6.3 billion (2019 US$) in labor income, $10.7 billion in value added, and $17.2 billion in economic output in the national economy. Combined with secondary effects, NPS visitor spending supported a total of 340,500 jobs, $14.1 billion in labor income, $24.3 billion in value added, and $41.7 billion in national economic output (Cullinane Thomas and Koontz 2020).
Tourism Expenditure Survey + Social Accounting Matrix (SAM)
A SAM is a data framework that usually represents the real economy of a country or other entity, distinguishing between activities and commodities, and ensuring revenues are equal to total expenditures (Chikuba, Syacumpi, and Thurlow 2013).
Strengths: Same as above and brings in household consumption linkages. Impacts can be disaggregated by households, firms, and other institutions.
Limitations: Factor of production and output prices do not vary.
Zambia -Tourism in South Luangwa contributed ~US$38 million (2015 US$) in value-added (GDP) and US$19 million in wages and salaries to the country’s economy, and supported ~3,000 jobs (Chidakel, Child, and Muyengwa 2021).
Tourism Expenditure Survey + General Equilibrium Model
Micro economy-wide approach using data from tourist, business and household surveys. SAM and small-economy general-equilibrium models consider direct and indirect income effects. (Taylor, Hardner, and Stewart 2009)
Strengths: Same as above and allows factors of production and output prices to vary.
Limitations: Data intensive. Requires specialized software (e.g., GAMS) and training.
Ecuador – Tourism generated US$62.9 million (2005 US$) on the Galapagos islands and US$113.9 million in Ecuador; US$1000 increase in foreign tourist expenditure raises island income by US$218; US$1000 increase in domestic tourist expenditure results in a US$429 increase in total island income. because most domestic tourists spend money on the island (Taylor, Hardner, and Stewart 2009).
Kenya - Every dollar invested in conservation and wildlife tourism could generate benefits 3 to 20 times higher (Damania et al. 2019).
Tourism Economic Model for Protected Areas – (TEMPA)
As part of a larger effort to assess the socio-economic impacts of GEF-funded protected areas, TEMPA was developed for project managers and stakeholders to present tourism spending data with a spreadsheet-based tool.
Strength: The tool can be used to calculate the economic impact of a park by non-economists, park managers, and other field-based stakeholders operating under budget and staff restrictions.
Limitation: Use of multipliers from the input-output tables of other sectors, which may be outdated or over-estimated.
The TEMPA tool requires three key inputs, namely, the number of visitors, their expenditures, and multipliers, all of which come from different sources.

Ass
ess
InG
th
e e
Co
no
MIC
IM
PAC
ts
34 BAnKInG on PRoteCteD AReAs
2.2. avenues for economic impacts of protected areas
Figure 8 describes the economic pathways within
the local economy (see Box 6 for definition),
including households, tourism and non-tourism
businesses, and the government. Tourism in pro-
tected areas can impact local economies through
direct (shown by arrows a in Figure 8) and indirect
channels. Indirect channels can, in turn, be broadly
classified into two types: production linkages
(shown by arrows b in Figure 8 and income and
consumption linkages (shown by arrows c in
Figure 8).
Box 6. What is a Local Economy?
A local economy could be a village, a collection of villages, a town, region, or even country. The definition of “local economy” will depend on the goals of the study, and wider areas will capture more economic activities and benefits. To be effective, management plans for protected areas should incentivize surrounding communities to support conservation; and thus, for the purpose of this study, the local economy is defined by the communities which lie within the protected area’s sphere of economic in-fluence as determined by community members, tourism operators and the government. Section 3.1 defines the local economy for each of the project sites. Moreover, because village households and businesses routinely visited a nearby market town to purchase goods and services, market towns nearest to each park were included as part of the local economy for the study.
Direct ImpactsProtected areas attract tourists who pay park entry fees, stay at lodg-
es, and spend money on game drives, walking safaris, scuba-diving,
snorkeling and many other services provided either through lodges
or other tourism facilities. Purchasing goods and services directly
from local businesses and households is the only channel through
which tourists contribute directly to the local economy. A conven-tional impact analysis based on tourist spending would stop here, and thus capture only a fraction of protected area tourism’s local economic impacts.
Beyond tourism benefits, protected areas affect the economic
behavior of people by influencing their use of natural resources, for
example, through restrictions on hunting, fishing, or wood gathering.
By regulating these activities, protected areas can have an adverse
effect on the incomes of households that otherwise would rely on
local resources, and these effects should be considered when de-
scribing the contributions of tourism to local economies.
Indirect Impacts Through Production LinkagesAs tourism activities expand and resource extraction contracts, these
activities’ demand for intermediate inputs will change, producing a
first round of indirect effects in the local economy through production
linkages. For example, more tourists increase the demand for lodg-
ing and restaurant meals, creating greater demand for everything
from ingredients (meat, fish, fruits, vegetables, etc.) to beverages,
napkins, and workers. To the extent that lodges and tour operators
hire workers locally, and purchase goods and services from local
farms and businesses, this increase in demand will have positive
linkage effects on the local economy. Inputs purchased from outside
the local economy will create positive linkages for other parts of the
country, or potentially in other countries and not for the local econo-
my. Similar outcomes are realized when park authorities hire locals
for security or park management jobs, or when communities receive
a share of protected area-related income which stimulates local eco-
nomic activity. When tourist services, protected area management
activities, and those promoted by community programs expand, they
create positive indirect impacts on the local economy. On the other
hand, restrictions on natural resource use may reduce local econom-
ic stimuli. An input-output (IO) analysis would stop here and capture only direct and indirect impacts through production linkages.
A critical issue when analyzing these production linkages is whether
the local supply of goods and services can expand to meet the
new demand. If not, growth in demand around protected areas may
increase prices, reducing the real, or inflation-adjusted income gains
from protected areas. The estimation of indirect impacts must take
these potential inflationary effects into account.
Indirect Impacts Through Income and Consumption LinkagesIn addition, production in local economies supported by tourism in
protected areas generates wages and profits which lead to positive
indirect effects by stimulating local spending. Earnings from locally
owned tourist facilities and the businesses which supply them flow
into local households who in turn feed this income into the local
economy. However, where conservation efforts prevent harvesting of
natural resources the indirect income effects of protected areas may
be negative.
As local activities expand to meet growing household demands,
new rounds of demand, income, and expenditure follow, elevating
incomes, and demand in the local economy. Successive rounds of
impacts become smaller and smaller, and the total (direct and indirect)
effect of a growing tourism market eventually converges to an income
multiplier, defined as the change in local household incomes per unit
of fresh infusion of cash into the economy through tourist spending.
The general equilibrium (GE) model will capture all of these effects i.e., the direct impacts and both channels of indirect impacts.
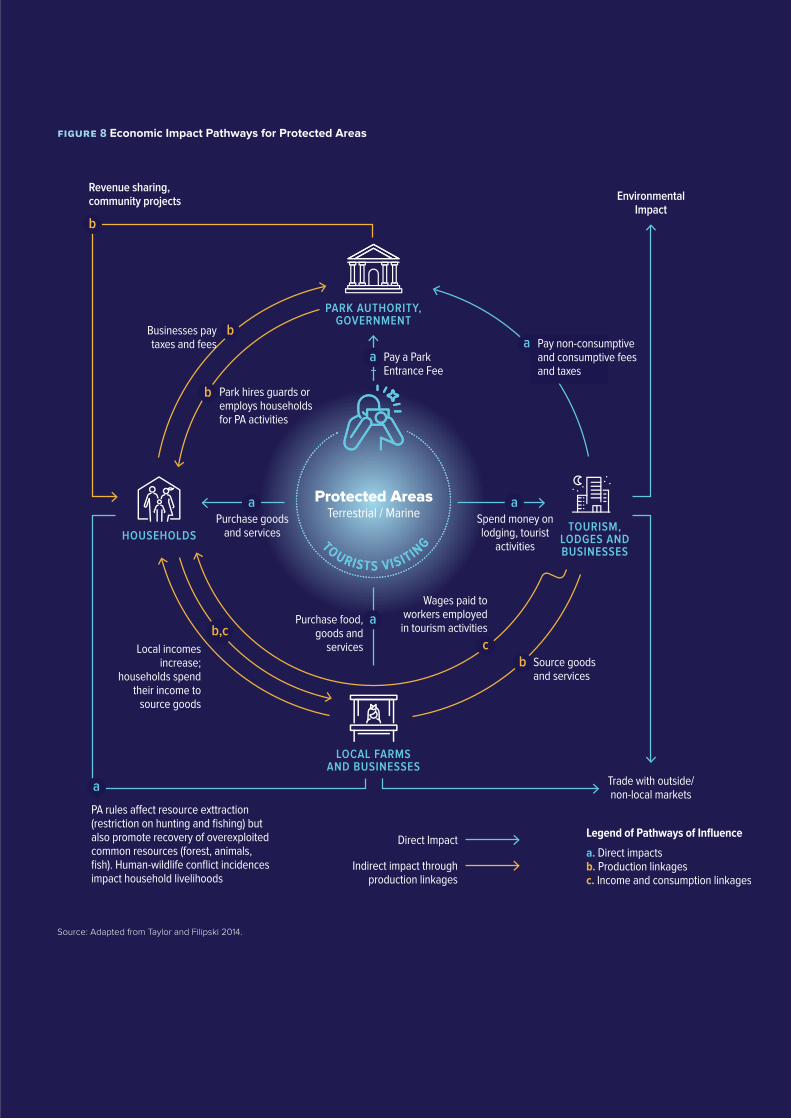
Ass
ess
InG
th
e e
Co
no
MIC
IM
PAC
ts
35PRoMotInG sUstAInABLe PRoteCteD AReA toURIsM to BeneFIt LoCAL eConoMIes
figure 8 Economic Impact Pathways for Protected Areas
TOURISTS VISITIN
GTOURISTS VISITIN
G
PARK AUTHORITY,GOVERNMENT
LOCAL FARMSAND BUSINESSES
HOUSEHOLDSTOURISM,
LODGES ANDBUSINESSES
aa
a
Pay non-consumptive and consumptive fees and taxes
Pay a Park Entrance Fee
bBusinesses pay taxes and fees
Revenue sharing, community projects Environmental
Impact
Trade with outside/ non-local markets
Park hires guards or employs households for PA activities
aPurchase food, goods and
servicesb Source goods
and services
Purchase goods and services
aSpend money on lodging, tourist
activities
b
Wages paid to workers employed in tourism activities
cb,c
Local incomes increase;
households spend their income to
source goods
Protected AreasTerrestrial / Marine
a
PA rules a�ect resource exttraction (restriction on hunting and fishing) but also promote recovery of overexploited common resources (forest, animals, fish). Human-wildlife conflict incidences impact household livelihoods
b
Direct Impact
Indirect impact through production linkages
Legend of Pathways of Influencea. Direct impactsb. Production linkagesc. Income and consumption linkages
Source: Adapted from Taylor and Filipski 2014.

Ass
ess
InG
th
e e
Co
no
MIC
IM
PAC
ts
36 BAnKInG on PRoteCteD AReAs
2.3. lewie model
Quantifying the direct and indirect impacts of
tourism in protected areas on local economies
therefore requires an applied GE approach.
For this global study, a GE method called “local
economy-wide impact evaluation—LEWIE”
was used across the four country case studies
(Taylor and Filipski 2014). LEWIE uses simulation
methods to estimate the direct and indirect (or
“spillover”) effects of tourism in protected areas
on local economies (see Box 7); it also uses a
structural approach that integrates models of
actors (businesses and households) within a GE
model of the local economy in which businesses
include locally-owned businesses and those not
owned by locals but typically employing some
local workers and purchasing some locally
supplied inputs.
The focus on the local economy illuminates
the potential of protected areas to benefit local
households, which are often unable to harvest
natural resources, suffer human-wildlife conflict,
and whose cooperation is critical to maintain
protected areas by discouraging encroach-
ment, poaching, illegal fishing, and other
threats. Local economic development is also a
goal in-and-of itself, and an additional reason to
have a local focus.
LEWIE builds upon econometric methods of
agricultural household modelling (e.g., Singh,
Squire, and Strauss, 1986), and uses micro-sur-
vey data to model firms, households, and
agricultural households within local economies
that are both producers and consumers of food.
These micro-models are “nested” within a GE
model of the local economy, and draw from a
long period of GE modeling in economics (Dixon
and Jorgenson 2012). The models of firms de-
scribe how businesses combine various factors
(e.g., hired labor, family labor, land, capital) and
intermediate inputs (fertilizer, seed, and a variety
of purchased inputs) to produce an output
(corn, prepared meals, a service) which may
be consumed locally or sold. The household
and household-farm models describe each
household group’s production, income, and
consumption/expenditure. In a typical model,
households participate in activities such as crop
and livestock production, resource harvesting
(e.g., fishing), retail, and other business activities,
as well as in the labor market. Production func-
tions for each activity are the recipes that turn
inputs into outputs.
Micro survey data are required as inputs to the
model and play two main roles in its construc-
tion. They provide initial values for all variables
in the model (production inputs and outputs,
household expenditures on goods and ser-
vices). The data are also used for econometric
estimates of model parameters for each house-
hold group and sector, together with standard
errors for these estimates. The initial values and
parameter estimate interface with the GAMS
(Generalized Algebraic Modeling System) soft-
ware used to program the LEWIE model.
The LEWIE model can be used to quantify
impacts on a local economy. Because its
parameters are econometric estimates, Monte
Carlo methods are used to test significance and
construct confidence intervals around the sim-
ulated impact results as shown by (Taylor and
Filipski 2014). For this study, 500 iterations of
the simulations for each park were conducted
for each country case study; these simulations
require judgements, based on the survey data,
about where and how prices are determined
(i.e., market closure, which is not known with
certainty), and account for nonlinearities and lo-
cal price effects. Sensitivity analysis, combined
with the Monte Carlo method described above,
was used to test the robustness of simulated
impacts to market-closure assumptions.
The impact of protected area tourism on a
local economy is estimated in two steps. First,
the impact of an additional tourist on the local
economy is simulated and provides an estimate
of the income multiplier of an additional dollar
of tourist spending. Secondly, the total impact is
estimated by multiplying the per-tourist estimate
by the number of tourists. There is no way to
know what the counterfactual of these local
economies would be, but this model provides
the best approximation. A comparison between
tourism impact and public investment in the park
also provides an estimate of the rate of return
on public investment.
Box 7. Estimating Economic Impacts of Protected Areas
Under the best of circumstances, it is difficult and costly to estimate spillover effects of public interventions using conventional experimental approaches (e.g., randomized control trials (RCTs) or econometric IV or “quasi-natural” experiments). Given the non-random location of protected areas, RCTs are not a feasible way to quantify their economic impacts. Because baseline data pre-dating protected areas are rare, neither are econometric methods that try to emulate experiments.

Ass
ess
InG
th
e e
Co
no
MIC
IM
PAC
ts
37PRoMotInG sUstAInABLe PRoteCteD AReA toURIsM to BeneFIt LoCAL eConoMIes
The model can also be used to understand the
economic impacts of government policies and
shocks to the economy – such as the economic
fallout of the COVID-19 pandemic. Once the
impact of nature-based tourism on local GDP
has been estimated, it can be compared to
government spending on the protected area to
obtain the local income impact per dollar spent
on the park. This exercise produces evidence
for the argument that investing in protected
areas delivers development outcomes via
tourism and is similar to a partial cost-benefit
analysis of government spending on protected
6 Nepal’s study area had uncharacteristically low international tourist numbers, and so a more representative sample was constructed using known ratios of international to domestic tourists from the previous year (2019) to increase the weight (or importance) of foreign tourists in the sample. Reduced tourism in Brazil’s study area resulted in surveys which were inadequate to provide tourism expenditures. Expenditure shares were obtained from this sample, while per tourist expenditures were collected from secondary sources with larger and more representative samples (SEBRAE’s Pesquisa de Perfil da Demanda Turistica – Costa das Baleias/BA, Brazil 2019 and The Ministry of Tourism International tourist demand Studies 2012–2018).
areas. The difference between the model and
conventional cost-benefit analysis is that LEWIE
simulations capture the total benefits created by
tourism, including indirect effects, whereas con-
ventional cost-benefit analyses do not consider
these indirect impacts (Taylor and Filipski 2014).
Both the method used here, and conventional
cost-benefit analyses face the same questions
concerning attribution, in particular, whether and
to what extent changes in government spending
on the park will affect tourism and the economic
and development benefits it creates.
2.4. data collection
To build the LEWIE model, data were gath-
ered through surveys of tourists, lodges and
resorts, local businesses, and local house-
holds. Information on production, income, and
expenditure, and the locations of transactions
(i.e., whether they are inside or outside the local
economy) was gathered (see Figure 9). The
household and local business survey data were
entered on tablets using the Open Data Kit
(ODK) platform for Android.
Tourist survey information was collected
through questionnaires administered by the
country (as in the case of Fiji’s International
Visitor Survey), by a tourism operator (in Zambia,
Proflight Zambia made the questionnaire
available to passengers on their flights), or
at hotels in which tourists stayed (in the case
of Nepal and Brazil). Tourist surveys in Nepal
and Brazil were impacted by COVID-19, and
required additional work to generate a repre-
sentative sample.6 For
the Household and
business survey, com-
munities in the area
that defined the local
economy were ran-
domly selected from
a master list. In each
village, roughly 45–55
households were ran-
domly selected using
an every-nth house-
hold sampling strategy
based on the size and
geographical disper-
sion of the community.
The household survey
included a module
to gather information
about businesses,
and this was adminis-
tered to households
with businesses.
Figure 9: Survey Data Characteristics and Elements
Source: World Bank

Ass
ess
InG
th
e e
Co
no
MIC
IM
PAC
ts
38 BAnKInG on PRoteCteD AReAs
Businesses in villages and nearby market towns
were surveyed to supplement the household
business samples, and used the same ques-
tions. Lacking a master list, all small businesses
evident in villages were approached (villages
typically had only a few businesses), while in
market towns an every-other-business approach
was adopted. As in the household surveys,
owner-operator participation in the surveys
was voluntary. Tourism business surveys
were collected by the survey team at lodges
or using secondary sources. Government
expenditure on protected areas, including
wage and non-wage expenditure needed to
maintain and manage the protected areas
was obtained from government offices.
Academic collaborations - in each of the coun-
tries, local students were trained to participate
in the survey collection, and partnerships with
local universities grounded the case studies
in the socio-economic context of the country.
In Nepal, the World Bank team collaborated
with Kathmandu University, in Brazil, with the
University of Rio de Janeiro, and in Fiji with the
University of South Pacific. Box 8 elaborates on
these collaborations.
Box 8. Building Capacity while doing Research
In each of the four country case studies, a team of local enu-merators were trained to carry out the business and household surveys. This included a course on the LEWIE methodology and on how to conduct detailed household and business surveys with questionnaires programmed onto tablets using the ODK
platform. These skills were field-tested, and enumerators were given certificates of completion of the LEWIE survey training course and fieldwork. Surveys were administered over two weeks around each protected area.
A team of 15 Zambian university students (8 men and 7 women) and recent graduates were trained to carry out the fieldwork for this study.
ZAMBIA
FIJI BRAZIL
NEPAL
A team of 14 Nepalese students (6 men and 8 women) from the Kathmandu University, and three NTNC staff were trained to carry out the fieldwork for this study.
Collaboration with Prof. Sagar Raj Sharma, Dean, School of Arts, Kathmandu University and Dr. Siddhartha Bajracharya, Executive Director of National Trust for Nature Conservation.
A team of 16 Brazilian students (11 men and 5 women) from the Federal University of Rio de Janeiro were trained to carry out the fieldwork for this study.
Collaboration with Prof. Carlos Eduardo Young, Associate Professor, National University of Rio de Janeiro.
A team of 15 Fijian students (7 men and 8 women) from the University of South Pacific were trained to carry out the field-work for this study.
Collaboration with Prof. Stuart Kininmonth, Senior Lecturer at the School of Marine Studies, University of South Pacific, Fiji.

Findings 3.1 country context and summary statistics
The following section provides a summary of the data from
each of the four countries and an overview of protected
areas and tourism in each country.
3

ZAMBIA protected area
• Protected Areas cover ~40% of the country’s land area
• 20 National Parks, 36 Game Management Areas (GMA) and 1 bird sanctuary
• GMAs are a category of protected areas that are mostly customarily owned lands designated as buffer zones between national parks and open areas. Human settlement is allowed in GMAs, as are other land uses such as agriculture, forestry, hunting, etc.
• Threats: Poor regulation, open access, population growth, demand for fuel and agricultural expansion are leading to habitat degradation
• Human-wildlife conflict reduces support for conservation
• Few visitors due to lack of funding for field staff, accommodation, park management and infrastructure
tourism
• 7% tourism contribution to GDP (WTTC 2019b)
• Zambia scored 3.2 out of a maximum of 7 and was ranked 113 out of 140 countries (WEF 2019a)
» Strengths – natural resources, price competitiveness
» Weaknesses – infrastructure, health and hygiene
• Zambia’s protected area regulations mandate sharing of revenues with community resource boards in GMAs
• Protected areas typically contain a limited number of privately-run lodges that offer accommodation, food, viewing safaris (photo-tourism) within the park, but no human settlements. Villages and lodges are available within GMAs surrounding parks
study sites
1. Lower Zambezi National Park (NP) and adjacent GMAs
• Established in 1983, designated as IUCN Category II
• 6 lodges at Lower Zambezi inside the park
• Airstrip is located inside the park
• Chiawa GMA and the market town of Chirundu constitute the local economy for Lower Zambezi NP
• 11,161 visits were made to Lower Zambezi NP in 2018
2. South Luangwa National Park and adjacent GMAs
• Established in 1972, designated as IUCN Category II
• 21 lodges at South Luangwa inside the park
• The Mfuwe International Airport is the point of entry
• Upper and Lower Lupande GMA and the market town of Chipata constitute the local economy for South Luangwa NP
• 43,469 visits were made to South Luangwa NP in 2018

data Summary
Data Collected:
• 800+ household and local business surveys
• 20+ lodges /tourism business surveys
• 226 tourist surveys
Poverty around both the parks is high:
• 56% of households surveyed in Lower Zambezi were poor
• 83% of households surveyed in South Luangwa were poor
Household income:
• The most common source of income for households is agriculture, followed by livestock rearing, and wage employment
• 40% of poor households in Lower Zambezi and 24% in South Luangwa had some form of wage employment
• Tourism-related jobs include visitor services (restaurant work, employment at hotels/lodges and tour agencies), maintenance (repairs) and craft
Local Business:
• 30% of households in Lower Zambezi and 25% in South Luangwa owned and operated some form of business
• In Lower Zambezi retail businesses make up almost 70% of household businesses
• In South Luangwa retail and services make up over 75% of household business types
Tourists by Origin:
• The largest share of tourists was from the United Kingdom, and Europe
Government revenues and expenditures:
• The Government of Zambia received ~US$1.1 million in visitor fees in 2018 between the two study sites
• The largest single source of revenue from protected areas was animal/trophy hunting fees – ~US$2.5 million
• Other consumptive and non-consumptive fees added US$1.6 million to the revenue generated by the park
• Government expenditure on the two parks was US$4.2 million (54% wages, 41% payments to community resource boards and 5% non-wage expenditures)
• Thus, these two protected areas generated a net of US$1.1 million
Tourist expenditures:
• Majority of the visitors came for tourist activities
• On average, tourists to Lower Zambezi spent US$2,904 per person and US$2,454 per person to visit South Luangwa. Average nights spent in Lower Zambezi was 3 and in South Luangwa 5
• The largest expenditure was on tourism packages that included lodging, meals, and park entry fees
• Hotels purchase ~80% of their daily inputs locally
UK 30%
Europe 22%US/Canada19%
Africa13%
Oceania12%
Asia 4%

NEPAL protected area
• Protected Areas cover ~23% of the country’s land area
• 12 National Parks, 1 Wildlife Reserve, 6 Conservation Areas, 1 Hunting Reserve and 13 Buffer Zones
• Threats: Large infrastructure projects are encroaching on protected areas, land degradation, and insufficient funding and human resources for protected area management
• Land-use and human-wildlife conflict are barriers to community engagement for conservation
• Protected areas lack sufficient infrastructure such as visitor centers and trails, and face a growing challenge of solid waste management
tourism
• 6.7% tourism contribution to GDP (WTTC 2019b)
• Over 45% of tourists visit the country’s protected areas
• Nepal scored 3.3 out of a maximum of 7 and was ranked 102 out of 140 countries (WEF 2019b)
» Strengths – natural resources, price competitiveness, safety & security and prioritization of tourism
» Weaknesses – infrastructure, international openness
• Regulations allow for 30–50% of park income to be channeled to local communities living in buffer zones
• Locally-owned and operated lodging is available in buffer zones but hotel/lodge concessions inside the park have recently been rescinded for environmental reasons
study site
Chitwan National Park
• Declared a UNESCO World Heritage Site in 1984
• Designated as IUCN Category II
• The buffer zone includes 70 community forests tracts covering approximately 11,000 ha managed by local buffer zone user committees
• Chitwan National Park and three municipalities – Bharatpur, Khairahani and Ratnanagar constitute the local economy
• 211,888 visitors to Chitwan in 2019
• Communities are compensated for human-wildlife conflict

data Summary
Data Collected:
• 596 household and local business surveys
• 8 lodges/tourism business surveys
• 67 tourist group surveys
Poverty:
• In Khairahani and Ratnanagar 3.8% of households surveyed were poor
• In Bharatpur 10.4% of households surveyed were poor
Household income:
• Most households grow crops and roughly half own livestock
• 25% of non-poor households own and operate some form of business, compared with 7–8% of poor households
• Roughly half of all households have at least one wage worker
• Employment types include construction, agriculture, hotels, restaurants, and tour operation
Local Business:
• 25% of households owned and operated some form of business. Common business types included grocery shops, and hotels, restaurants and bars
• Construction related businesses were more prevalent in Bharatpur
• Most hotels (74%) purchase inputs locally
Government revenues and expenditures:
• The Government of Nepal received ~US$1.7 million in visitor fees from Chitwan National Park in 2018–2019
• Other revenues (concessions, fees) totaled US$784,000
• The total expenditures were US$5.7 million (58% were wage expenditures)
• The total expenditures incurred by the Government of Nepal are more than double the revenues from the park
Tourist expenditures:
• On average, a tourist spends US$31.6* per day in Chitwan NP, a third of which goes to accommodation and food at a hotel or lodge
• More than 70% of tourists participated in jeep safaris, followed by elephant safaris and the tharu dance and/or cultural programs
International Tourist Visits to Chitwan NP by Fiscal Year: Significant Tourism Rebound Since the 2015 Earthquake
2014
–20
15
2015
–20
16
2016
–20
17
2017
–20
18
2018
–20
19
0
50,000
100,000
150,000
200,000
250,000
* COVID-19 disrupted data collection, and international tourists only represent 12 percent of the sample and were therefore under-represented. To correct for this, a more representative sample was constructed using known ratios of international to domestic tourists from the previous year (2019) to increase the weight (or importance) of foreign tourists in the sample.

FIJI
protected area
• The Government of Fiji set a goal to designate 30% of the country’s inshore and offshore marine areas as protected areas by the end of 2020. However, only 1 percent has been officially designated as a marine protected area
• There is an informal network of MPAs known as tabu, which are established by indigenous communities as protected areas in customary fishing grounds (qoliqoli), and in which fishing rights are restricted
• Tabu areas may also be designated by chiefs, through agreements between communities and tourism operators, or through partnerships with the Fiji Locally Managed Marine Area (FLMMA) Network
• De-facto protected areas can be established when a foreshore lease is issued to a tourism enterprise. No fishing is subsequently permitted in the area
• Threats: Marine pollution, coastal development, over-fishing and over-harvesting of corals
• Hesitation of community groups as designation requires surrender of fishing rights
• Inadequate policy and lack of a Marine Park Authority limits ability to regulate the marine environment
tourism
• 34% tourism contribution to GDP (WTTC 2019b), largest source of foreign exchange
• In the 2018–19 fiscal year, 900,000 visitors spent an estimated US$904 million visiting the country
• LMMAs or tabus do not provide economic incentives for communities
• Formal benefit-sharing mechanisms are limited by regulations, mainly, the Surfing Area Decree (2010) that grants unrestricted access and use of any surfing area by any person and does not require the right-holder to be compensated
study sites
Three islands - Tavarua, Navini, and Malolo – part of the Mamanuca Islands
• All three sites are being considered for formal (“gazetted”) MPA status, either fully (Tavarua, Navini) or in part (Malolo)
• These islands are a popular destination for tourists due to their pristine waters and coral reefs
• Informal marine conservation agreements* exist on all three islands
• The Mamanuca islands, and mainland - western coastal region in Nadroga-Navosa province, including its main city, Nadi - constitute the local economy
• These islands are connected to the main island of Viti Levu and in particular, to the economy in and around Nadi (also the location of the international airport)
• In 2019, close to 900,000 tourists visited Fiji, and of those, 9% visited the Mamanuca islands and 21% visited Nadi
* Formal or informal contractual arrangement to pursue ocean or coastal conservation goals through temporary or permanent no-fishing zones in exchange for voluntary commitment to deliver explicit (direct or indirect) economic incentives.

data Summary
Data Collection
• 527 household and local business surveys
• 8 lodges/tourism business surveys (Tavarua and Navini islands have a single resort and Malolo has a few resorts*)
• 11,465 Tourist group surveys (IVS 2019**)
Poverty
• 19% of households on the mainland (main island, Viti Levu) and 9.5% of households on islands were poor
Household
• 82% of households had at least one wage worker
• A large percentage of households were engaged in agriculture, though the scale of farming was small and
usually at a subsistence level
Tourists by origin
• Around 75% of tourists come from Australia and New Zealand
Local Business
• 24 to 36 percent of households own and operate some form of business
• Approximately 23% of hotel supply purchases are from outside the local economy of Nadroga-Navosa province and the Mamanucas
Tourist Expenditures
• The average tourist spend was US$167 per night
• 61% of mainland non-poor workers, 64% of mainland poor workers, and 85% of island workers were employed by hotels, restaurants, or tour operators
Australia47%
New Zealand25%
US11%
Europe 5%UK 3%
Canada 2%China 2%
Pacific Islands2%
Japan1%
Rest of Asia1%
Others1%
* Due to the small number of hotels in Nadi and the Mamanucas, all hotels nearby were contacted for the survey.
** The International Visitor Survey (IVS) is administered by the Ministry of Commerce, Trade, Tourism & Transport and is undertaken on a rolling basis.

BRAZIL protected area
• Marine protected areas comprise 26.82% of marine and coastal areas
• 158 marine protected areas
• Threats: lack of regulations for the use of natural resources, conversion of natural areas for aquaculture and coastal development, pollution, and deterioration of aquatic habitat quality
• Insufficient finance for protected area management
• Overfishing, unsustainable fishing practices and lack of fisheries management are depleting fish stocks and jeopardizing local livelihoods dependent on the fisheries sector
tourism
• 10.3% tourism contribution to GDP (WTTC 2019b)
• In 2016, 16.8 million tourists visited 209 National (Federal) and State Parks
• While most tourists visit coastal areas for their beaches and cultural offerings, 12% of respondents cited “natural areas” for the purpose of their visit, which can in turn be attributed to the marine protected areas
• Brazil has no mechanisms to share park and concession revenues with local communities; however, the Ecological ICMS provides tax revenues to state and municipal governments
• Brazil scored 4.5 out of a maximum of 7 and was ranked 32 out of 140 countries (WEF 2019b)
study sites
Abrolhos Marine National Park
• Established in 1983, IUCN Category II
• Largest whale nursery in the South Atlantic
• Surrounding the marine national park is the Corumbau Marine Extractive Reserve (RESEX); local fisherfolk have exclusive fishing rights
• The marine area supports the livelihoods of an estimated 20,000 fisherfolk whose main source of income is from small-scale fishing
• Whale watching is the biggest attraction and tourism is seasonal as a result
• The Abrolhos region including the coastline (extending from Nova Viçosa in the south to
the south-west of Caravelas and to Prado in the North) opposite Abrolhos Marine National Park constitutes the local economy
• 1.2 million tourists visited the Abrolhos region in 2019, most of whom were domestic tourists
• 8,044 tourists visited Abrolhos Marine National Park, less than 10% of the maximum allotted capacity. Some visitors to the coast are attracted by the pristine environment of the marine protected area
• The peak season for tourism in Abrolhos runs from July to January (whale watching season)
» Strengths – natural resources, cultural resources and price competitiveness
» Weaknesses – transport infrastructure on land, international openness

data Summary
Data Collected
• 590 household and local business surveys
• 7 lodges/tourism business surveys
• 12 tourist group surveys*
Poverty
• 14.2% of households were poor
Household income
• Over 65% of households had at least one wage earner, while around 22–23% of households fished
• 53% of the poor were employed for more than 150 days in 2019, compared with 73% of the non-poor
• 29% of poor households grew crops compared to 22% of non-poor households
Local Business
• The majority of household businesses were vendors, grocery shops and other retail-type businesses that operated close to year-round
• Only 3% of the businesses surveyed were directly
• related to tourist activities
Government Expenditures
• Total government expenditure on the Abrolhos Marine National Park was US$455,606 (~70% of which was on wages)
Tourist Expenditures
• The average tourist spent close to US$127 per day, mostly on hotels
• Tourism businesses spend 20% of their operating budgets purchasing inputs from outside the local economy
* COVID-19 travel restrictions made it difficult to collect tourist data. To mitigate this, we used data from “SEBRAE/BA (Brazilian Micro and Small Business Support Service), COMTUR and Bahia’s Tourism secretary in 2019, who surveyed tourists in the Whale coast region and had a sample size of 501.

FIn
DIn
Gs
48 BAnKInG on PRoteCteD AReAs
3.2 key findings from country case studies
7 Income figures presented in these findings are inflation-adjusted. Bars represent 95% confidence interval.
8 Poverty headcount calculated as the proportion of households with under $1.90/person/day (ppp adjusted using ppp exchange rate for all countries except Brazil where, because of the small sample size for poor households, the definition of poverty was altered to those living under US$5.8/person/day.
9 Due to the small sample size for island households, these households are not disaggregated into poor and non-poor catego-ries for the LEWIE model in Fiji.
The LEWIE model was applied in each of the
four country case studies. Findings synthesized
here relate to: impacts of tourism in protected
areas on the local economy, returns on govern-
ment spending, impacts of conflicts and shocks,
and effects of government policies.
Effects of Protected Area Tourism on Local Economies
An additional tourist generates economic
activity in the local economy by stimulating local
demand for goods and services, either directly
(as when tourists buy goods and services from
local businesses and households) or indirectly
(as when lodges pay wages to local households,
or source goods from local businesses, who
in turn spend this income on locally-supplied
goods and services). Figure 10 summarizes the
economic impact of an additional tourist on
local incomes for the four country case studies.
While an additional tourist generated a posi-
tive economic impact on the local economy at
all sites, this impact was significantly higher in
Zambia and Fiji, where per tourist spending is
substantially higher than in Nepal and Brazil.
Each additional tourist spends in the high
hundreds or thousands of US dollars in Zambia
and Fiji: US$745 in Lower Zambezi National
Park, US$683 in South Luangwa National Park
in Zambia, and US$1,311 in Nadroga-Navosa and
Mamanucas in Fiji. In contrast, spending per
tourist was just over US$200 in Brazil and under
US$100 in Nepal. These differences indicate
the type of tourism or tourists who visit protect-
ed areas in the four countries. Sites in Fiji and
Zambia draw high-value, international tourists,
the site in Nepal attracts low-value international
and national tourists, and the Brazilian site sees
mid-value domestic tourism.
The economic impact of an additional tourist can
be disaggregated by category of beneficiary
households i.e., poor8 and non-poor. In Zambia,
poor residents, who are the majority of surveyed
households (56% in Lower Zambezi and 83%
in South Luangwa), receive a larger share of
the economic impact of tourist spending on the
local economy than non-poor residents (see
Figure 11). The opposite is true in Nepal, Brazil,
and Fiji, where mainland non-poor residents
receive a larger share of these economic
impacts than poor residents on the mainland
and island residents.9 In each of these cases,
only 20% of surveyed households were poor,
explaining in part the contrast with Zambia’s
figure 10 Annual Contribution to Local Income Per Additional Tourist
(total real income, 2019)7
ZambiaLower Zambezi
ZambiaSouth Luangwa
NepalChitwan
National Park
BrazilAbrolhos
Marine Park
FijiMamanuca Islands
1,3551,045
169
357
2,400
Tota
l inc
ome
cont
ribut
ion
(USD
)
Source: World Bank data
figure 11 Disaggregation of Economic Impact by Household, 2019
500
0
1000
1500
2000
2500
LowerZambezi
SouthLuangwa
ChitwanNational Park
AbrolhosMarine Park
MamanucaIslands
Zambia Nepal Brazil Fiji
Tota
l inc
ome
cont
ribut
ion
(US$
)
Poor Non-poor Island
Source: World Bank data

FIn
DIn
Gs
49PRoMotInG sUstAInABLe PRoteCteD AReA toURIsM to BeneFIt LoCAL eConoMIes
case. As detailed in the country case studies,
in Zambia and Brazil, the largest impact is on
retail activities of mainly small family-owned
enterprises, which is where households around
parks spend the largest share of their incomes.
In Nepal, park revenue is shared with a buffer
zone user committee as part of benefit sharing
arrangements and contributes around US$4.50
per tourist to household incomes. In Fiji, where
mainland non-poor households reap most of
the economic benefits from tourism, over 60
percent of both poor and non-poor mainland
workers and 85 percent of island workers were
employed by hotels, hostels, restaurants, or tour
operator businesses, indicating that wages and/
or indirect linkages of tourism are greater for
non-poor residents.
Another metric that can be used to capture
the impact of tourists on local economies and
communities is the income multiplier. As local
activities grow to meet household demands,
new rounds of increased demand, income, and
household expenditures follow, creating addi-
tional increases in income and demand in the
local economy.
Figure 12 shows the income multipliers for each
of the case studies. In all cases, the multiplier
is greater than one, signaling that local market
linkages are strong, and that each additional
dollar spent by a tourist increases local incomes
by more than a dollar. A local income multipli-
er of less than one would indicate that tourist
demand is met mainly by purchases from other
parts of the country or from abroad, causing
income to “leak out” from the local economy
to where purchases occur or are processed.
This does not appear to be the case in any of
the four case studies, although it is likely that
some leakage occurs. Multipliers across the
four studies are consistent, suggesting that an
active protected area tourism sector provides
similar income gains to local households across
a variety of contexts, despite variations in per
tourist spending and number of visitors. These
multiplier results are similar to those found in
studies of other sectors (see Box 9).
As with the contribution to total income, the
LEWIE methodology can also be used to ex-
amine how an income multiplier is distributed
among households both poor and non-poor,
and near-to and far-from a protected area. In
Zambia, poor households benefited more - each
dollar spent raised their incomes by US$0.99
in Lower Zambezi National Park and US$1.34
in South Luangwa National Park - compared
to non-poor households - each dollar spent
raised their incomes by US$0.83 and US$0.19
in Lower Zambezi and South Luangwa National
Parks, respectively (see Figure 13). In communi-
ties near Nepal’s Chitwan National Park, on the
other hand, the share of the income multiplier
accruing to non-poor households was much
higher than that for poor households: of the total
income multiplier of 1.78, non-poor households
received 1.6 while poor households received
0.18. In Brazil as well, most benefits accrue to
non-poor households which are better able to
increase production to meet growing demands
generated by tourism, and which are a larger
population than poor households. For each
dollar spent by a tourist in the Abrolhos region,
US$1.44 is generated for non-poor households,
while poor households receive US$0.30.
figure 12 Annual Real Inflation-Adjusted Income Multipliers, 2019
ZambiaLower Zambezi
ZambiaSouth Luangwa
BrazilAbrolhos
Marine Park
0.00
0.50
1.00
1.50
2.00
2.50
3.00
Inco
me
mul
tiplie
r
NepalChitwan
National Park
FijiMamanuca
Islands
1.821.53
1.78 1.74 1.83
Error bars represent 95% confidence intervals
Source: World Bank data
Box 9. Strengthening the Economic Case by Comparing our Multiplier Results to Green Stimulus Multipliers
According to the IMF’s latest working paper, the cumulative multipliers for ecosystem conservation or green land use-related spending are greater than those for conservation-incompatible land use after the first year in developing countries. For every dollar spent on conservation, there is a return of almost seven dollars in the medium term (5 years) (Batini et al. 2021). These high multipliers are a result of (i) spending programs mostly financed by donors who supplement domestic spending, (ii) strong labor intensity in the conser-vation sector, and (iii) increased revenues in agriculture because the scarcity of available land following the expansion of areas under protection pushes up the prices paid to producers for their goods and motivates productivity improvement. In contrast, the IMF estimates that multipliers of spending on industrial agriculture are less than one.
Similarly, Waldron et al. (2020) modeled the global economic effects of expanding the global protected area target to 30 percent and noted that revenues from protected areas exceeded their maintenance costs by a factor of five, a multiplier close to the IMF estimates. Their results suggest that protected area revenues are likely to grow faster (4–5 percent per year) than that from agriculture (less than 1 percent).

FIn
DIn
Gs
50 BAnKInG on PRoteCteD AReAs
Finally, in Fiji, non-poor households tend to
benefit more than poor ones because their busi-
nesses profit from the ripple effects of tourist
spending.
Despite the larger multiplier shares of non-poor
households in most cases, tourism appears to
benefit poor residents more than non-poor res-
idents in all but one case. Normalizing multiplier
shares by the populations of poor and non-poor
residents (i.e., dividing the share of the multiplier
by the share of population; see Figure 14) shows
that the multiplier share per resident is actually
higher for poor residents than for non-poor, in all
cases except around Lower Zambezi National
Park in Zambia.
In summary, tourist spending generates income
multipliers for households in the local economy,
benefiting households directly involved in the
tourism sector and those not, and benefitting
poor and non-poor households. Households
benefit directly and indirectly through pro-
duction and income linkages-when tourism
operators hire local people and buy local
goods, and when households spend wages and
businesses spend profits earned through the
tourism sector.
TOTAL IMPACT OF TOURISM ON THE LOCAL ECONOMY
The total impact of protected area tourism on
local incomes can be estimated by multiplying
the impact per tourist by the number of tourists
who visit the protected area. Figure 15 summa-
rizes the total impact of tourism in protected
area sites for the four country case studies. In
Brazil, some tourism in the surrounding Whale
Coast region can be attributed to the ecological
spillover effects of the Abrolhos Marine Park,
such as healthier fish stocks and habitats, but
quantifying these effects requires information on
regional economics beyond the scope of this
study. This accounts for the relatively small total
impact in Brazil.
The total impact of protected area tourism on
the local economy is largest in Fiji because of
the high amount of tourist spending per day and
the large volume of tourists. The Zambian parks
also see high tourist spending on guided safaris
and hunting, but these parks have relatively
few tourists due to a lack of connectivity. Nepal,
on the other hand, generates large revenues
despite low tourist spending, due to high tourist
numbers. While the model generates significant
stimuli for the local economy around Nepal’s
Chitwan National Park, these comes with
trade-offs—if large numbers of tourists degrade
figure 13 Annual Income Multiplier Share by Household Type, 2019
LowerZambezi
SouthLuangwa
ChitwanNational Park
AbrolhosMarine Park
MamanucaIslands
Zambia Nepal Brazil Fiji
0
0.2
0.4
0.6
0.8
1
1.2
1.4
1.6
1.8
2
Inco
me
mul
tiplie
r
Poor Non-poor Island
Source: World Bank data
figure 14 Annual Distribution of Multipliers Across Poor and Non-
poor Communities, 2019
LowerZambezi
SouthLuangwa
ChitwanNational Park
AbrolhosMarine Park
MamanucaIslands
Zambia Nepal Brazil Fiji
0%
20%
40%
60%
80%
100%
Perc
enta
ge o
f Mul
tiplie
r
Poor Non-poor Island
Source: World Bank data
figure 15 Annual Impact of Protected Area Tourism on Local Incomes,
2019
0
50
100
150
200
250
300
ZambiaLower Zambezi
15.1
ZambiaSouth Luangwa
45.4
NepalChitwan
National Park
43.4
BrazilAbrolhos
Marine Park
2.9
FijiMamanuca
Islands
237.6
Tota
l im
pact
of t
ouris
m to
loca
l GD
P,
mill
ions
US$
Error bars represent 95% confidence intervals
Source: World Bank data

FIn
DIn
Gs
51PRoMotInG sUstAInABLe PRoteCteD AReA toURIsM to BeneFIt LoCAL eConoMIes
the natural area that is attracting them, fewer
tourists may visit in the future. As noted, the
Abrolhos Marine Park may benefit tourism in sur-
rounding coastal areas by supporting species
and maintaining a healthy ecosystem, even if
tourists do not visit the park itself. Furthermore,
the 8,044 annual visits to Abrolhos Marine
Park are less than 10 percent of the maximum
allowed capacity, which is 225 visitors per day.
If the Park operated at full capacity during peak
season, then the economic impact of tourism
would increase to US$11.9 million, almost four
times the current estimated impact.
Tourism generates jobs directly through tourism
activities, and indirectly by stimulating the local
economy (see Figure 16). Employment effects
are calculated by taking the impact on labor
income from the LEWIE model simulations
and dividing it by the median annual wage to
obtain the change in year-round equivalent
jobs. This covers tourism-related jobs such as
hotel employees, tour operators, and restaurant
workers, as well as those employed as a result
of increased demand for goods and services
brought on by tourism in sectors such as retail,
services, and in some instances agriculture,
livestock, and fishing.
Beyond the total number of jobs, the share of
employment supported by tourism in protected
areas is significant. In Zambia, tourism in protect-
ed areas generated jobs for 14 percent and 30
percent of working age populations around the
Lower Zambezi and South Luangwa Parks re-
spectively. In Nepal, tourism-related jobs around
Chitwan National Park are held by 3 percent
of the working age population, while in Brazil’s
coastal region - the Whale coast, a total of
46,800 jobs (300 of these jobs can be attributed
to the Abrolhos Marine Park directly) represents
12 percent of the local population. Tourism in
Fiji’s Mamanuca islands created 8,304 jobs
(through direct and indirect channels), em-
ploying 13 percent of the local population in
Nadroga-Navosa and the Mamanucas.
figure 16 Jobs Generated Annually by Protected Area Tourism, 2019
0
5,000
10,000
15,000
20,000
25,000
30,000
35,000
Jobs
gen
erat
ed
ZambiaLower Zambezi
ZambiaSouth Luangwa
NepalChitwan
National Park
BrazilAbrolhos
Marine Park
FijiMamanuca
Islands
Error bars represent 95% confidence intervals
Source: World Bank data

FIn
DIn
Gs
52 BAnKInG on PRoteCteD AReAs
Return on Government Spending
A key motivation for this study is to assess
whether public investment in protected areas is
good for development. Does the benefit of the
investment outweigh the costs? This question is
assessed through financial analysis, where data
permit,10 and economic analysis, for the three
case studies.
The Zambia and Nepal case studies provide
detailed information on the revenues and
expenditures of government departments/
agencies in charge of protected area manage-
ment. In Zambia, government revenues from
tourism in protected areas (park visitor fees,
other fees, and concessions) exceed the value
of current investments in the park (see Table 4).
Thus, these protected areas are a source of12
revenue for the government and not a financial
sink and refute the assumption that protected
areas are not ‘self-financing’. Surplus revenue
10 Note: Government expenditure data were not available for the Fiji case study, and a rate of return could not be calculated.
11 Figures for Zambia are for 2018, while figures for Nepal are June 2018–June 2019.
12 Government expenditures for Zambia are for 2018, June 2018–June 2019 for Nepal, and 2019 for Brazil.
from protected areas that attract tourists can be
used to subsidize investments in other parts of
the protected area network. On the other hand,
in Nepal’s Chitwan National Park, government
revenues from visitor fees and concessions
were significantly less than expenditure on park
protection and maintenance, which also includ-
ed expenses incurred by the army.
However, simply comparing revenues with
expenditures gives an incomplete picture of the
effects of protected areas on local economies, for
which it is necessary to compare park costs with
their broader local economic impacts. The return
on investments are presented in Figure 17, and
were obtained by dividing these total economic
impacts by the sum of wage and non-wage ex-
penditures by governments on the parks.
In all cases in which this could be assessed, the
rate of return on government spending is signifi-
cantly greater than one, making the protected
area a valuable economic asset. These results
indicate that public investment in protected
areas not only helps to conserve biodiversity,
but also helps to make protected areas more
attractive to tourists – for example, by protect-
ing wildlife and habitats, preserving the natural
and cultural integrity of the landscape and
oceanscape, and/or by providing well-main-
tained recreational services such as trails. When
tourists visit protected areas, they not only
spend their money on park entry fees, but also
on hotels, meals, transport, souvenirs and other
services. These expenditures benefit both those
in the tourism sector, and beyond, as tourism
service providers hire labor and source goods
and services from the local economy, triggering
a chain of benefits for local businesses and
households. It is the sum of these direct and
indirect benefit flows that lead to high economic
returns on government investments in protect-
ed areas. Thus, investments in protected areas
are good for biodiversity conservation, good
for local economic development, and provide
favorable returns to governments.
In summary, the analysis flags the importance
of protected area tourism’s broad, and indirect
impacts, which ripple beyond the tourism sector
and into local economies, offering economic
stimuli and development benefits which make
for favorable returns on government invest-
ments in protected areas. These far-reaching
knock-on effects offset leakage and make a
table 4 Annual Government Revenues and Expenditures, 2018/201911
US$ Amounts
Zambia Nepal
Revenue 5,373,327 2,583,041
Expenditure 4,242,227 5,726,025
Surplus 1,131,100 -3,142,984
Source: Government data
Note: Data for Fiji and Brazil unavailable
figure 17 Annual Estimated Rate of Return on Government Spending,
2018/201912
ZambiaLower Zambezi
ZambiaSouth Luangwa
NepalChitwan
National Park
BrazilAbrolhos
Marine Park
0
5
10
15
20
25
30
35
Rate
of R
etur
n
16.7
28.2
6.2 7.6
Error bars represent 95% confidence intervals
Source: World Bank data

FIn
DIn
Gs
53PRoMotInG sUstAInABLe PRoteCteD AReA toURIsM to BeneFIt LoCAL eConoMIes
compelling case for investment in protected areas
as potentially self-financing sources of revenue
which can help governments to pursue sustain-
able development. The need to consider both
direct and indirect mechanisms to assess the
economic impact of tourism in protected areas
on local economies suggests that studies which
look only at tourism expenditures to estimate im-
pacts will underestimate the impacts on the local
economy, and over emphasize the leakage from
tourism activities outside the local economy.
Impact of Conflicts and Shocks
Besides estimating the economic impacts of
tourism on local economies, the LEWIE model
can be used to simulate the local impacts of
economic shocks. The categories of shocks
assessed are those caused by human-wildlife
conflict, and by the economic fall-out of the
COVID-19 pandemic.
HUMAN-WILDLIFE CONFLICT
Just as the benefits of protected area tourism
can incentivize communities to support conser-
vation, the costs of human-wildlife conflict may
reverse these gains.
Living near terrestrial protected areas can lead
to human-wildlife conflict, as seen in Zambia
and Nepal. Such conflict often entails crop loss
and livestock predation, and animals may also
harm or kill humans. The study estimates the
negative impacts of human-wildlife conflict on
a local economy as household income forgone
due to crop losses. Wildlife incursions onto
farms caused crop losses of almost 14 percent at
Lower Zambezi National Park, 11 percent at South
Luangwa National Park in Zambia, and 9 percent
around Chitwan National Park in Nepal. The
LEWIE model uses harvest data reported at the
time of the survey, and the base model therefore
already reflects losses. The cost of human-wildlife
conflict is therefore estimated as a counterfactual:
what would the income of households be if there
was no human wildlife conflict.
Crop losses can have major impacts on house-
holds and send negative ripple effects through
local economies. Figure 18 presents these im-
pacts and shows that animals caused millions of
dollars in lost income, signaling a critical issue for
households living near terrestrial protected areas.
While households suffered significant losses
in the three study contexts, the distribution of
effects varies by country, and between poor and
non-poor households (see Figure 19). In Nepal,
non-poor households, which are in the major-
ity, produce more crops and thus suffer most
losses; while in Zambia, most households are
poor, largely reliant on subsistence farming, and
thus suffer the greatest losses. This distribution
of impacts highlights the need for equitable
approaches to avoid, mitigate and compensate
losses; households most vulnerable to crop
destruction may require compensation, espe-
cially if they are not beneficiaries of protected
area tourism.
Figure 18 Annual Income Losses from Human-Wildlife Conflict in
Protected Areas, 2019
ZambiaLower Zambezi
ZambiaSouth Luangwa
NepalChitwan
National Park
0
0.5
1
1.5
2
2.5
3
3.5
Real
inco
me
loss
in m
illio
ns U
S$
1.81.2
2.9
Error bars represent 95% confidence intervals
Source: World Bank data
Figure 19 Annual Estimated Loss of Household Earnings from Human-
Wildlife Conflict by Location and Income, 2019
ZambiaLower Zambezi
ZambiaSouth Luangwa
NepalChitwan
National Park
0.0
0.5
1.0
1.5
2.0
2.5
3.0
3.5
Mill
ions
USD
Los
t
Poor households Non-poor households
Source: World Bank data
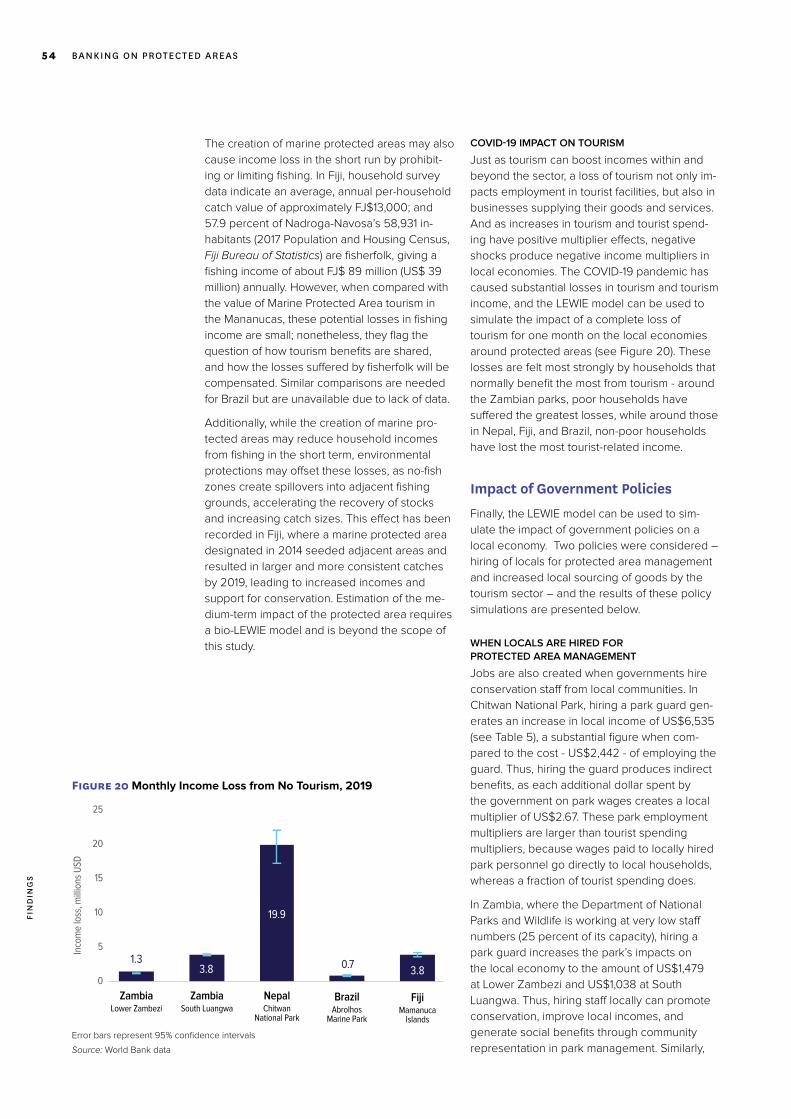
FIn
DIn
Gs
54 BAnKInG on PRoteCteD AReAs
The creation of marine protected areas may also
cause income loss in the short run by prohibit-
ing or limiting fishing. In Fiji, household survey
data indicate an average, annual per-household
catch value of approximately FJ$13,000; and
57.9 percent of Nadroga-Navosa’s 58,931 in-
habitants (2017 Population and Housing Census,
Fiji Bureau of Statistics) are fisherfolk, giving a
fishing income of about FJ$ 89 million (US$ 39
million) annually. However, when compared with
the value of Marine Protected Area tourism in
the Mananucas, these potential losses in fishing
income are small; nonetheless, they flag the
question of how tourism benefits are shared,
and how the losses suffered by fisherfolk will be
compensated. Similar comparisons are needed
for Brazil but are unavailable due to lack of data.
Additionally, while the creation of marine pro-
tected areas may reduce household incomes
from fishing in the short term, environmental
protections may offset these losses, as no-fish
zones create spillovers into adjacent fishing
grounds, accelerating the recovery of stocks
and increasing catch sizes. This effect has been
recorded in Fiji, where a marine protected area
designated in 2014 seeded adjacent areas and
resulted in larger and more consistent catches
by 2019, leading to increased incomes and
support for conservation. Estimation of the me-
dium-term impact of the protected area requires
a bio-LEWIE model and is beyond the scope of
this study.
COVID-19 IMPACT ON TOURISM
Just as tourism can boost incomes within and
beyond the sector, a loss of tourism not only im-
pacts employment in tourist facilities, but also in
businesses supplying their goods and services.
And as increases in tourism and tourist spend-
ing have positive multiplier effects, negative
shocks produce negative income multipliers in
local economies. The COVID-19 pandemic has
caused substantial losses in tourism and tourism
income, and the LEWIE model can be used to
simulate the impact of a complete loss of
tourism for one month on the local economies
around protected areas (see Figure 20). These
losses are felt most strongly by households that
normally benefit the most from tourism - around
the Zambian parks, poor households have
suffered the greatest losses, while around those
in Nepal, Fiji, and Brazil, non-poor households
have lost the most tourist-related income.
Impact of Government Policies
Finally, the LEWIE model can be used to sim-
ulate the impact of government policies on a
local economy. Two policies were considered –
hiring of locals for protected area management
and increased local sourcing of goods by the
tourism sector – and the results of these policy
simulations are presented below.
WHEN LOCALS ARE HIRED FOR PROTECTED AREA MANAGEMENT
Jobs are also created when governments hire
conservation staff from local communities. In
Chitwan National Park, hiring a park guard gen-
erates an increase in local income of US$6,535
(see Table 5), a substantial figure when com-
pared to the cost - US$2,442 - of employing the
guard. Thus, hiring the guard produces indirect
benefits, as each additional dollar spent by
the government on park wages creates a local
multiplier of US$2.67. These park employment
multipliers are larger than tourist spending
multipliers, because wages paid to locally hired
park personnel go directly to local households,
whereas a fraction of tourist spending does.
In Zambia, where the Department of National
Parks and Wildlife is working at very low staff
numbers (25 percent of its capacity), hiring a
park guard increases the park’s impacts on
the local economy to the amount of US$1,479
at Lower Zambezi and US$1,038 at South
Luangwa. Thus, hiring staff locally can promote
conservation, improve local incomes, and
generate social benefits through community
representation in park management. Similarly,
Figure 20 Monthly Income Loss from No Tourism, 2019
ZambiaLower Zambezi
ZambiaSouth Luangwa
NepalChitwan
National Park
BrazilAbrolhos
Marine Park
FijiMamanuca
Islands
0
5
10
15
20
25
Inco
me
loss
, mill
ions
USD
1.33.8
19.9
0.73.8
Error bars represent 95% confidence intervals
Source: World Bank data

FIn
DIn
Gs
55PRoMotInG sUstAInABLe PRoteCteD AReA toURIsM to BeneFIt LoCAL eConoMIes
in Brazil, as shown in Table 5: Annual Effect of
Government Hiring a Local Laborer, 2019, the
economic impact of an additional hire from
the local economy outweighs the cost, with an
income multiplier of 2.7.
SOURCING GOODS LOCALLY
While the income multiplier for visitor spending
in protected areas is significant, leakages occur
when goods and services are sourced from
outside the local economy.
In Zambia, for instance, hotels on average pur-
chase 16 percent of their daily inputs (in value
terms) from non-local sources. While leakages
are low, a simulated five percent increase in
local sourcing boosts local incomes by US$0.21
million in Lower Zambezi and US$0.35 million in
South Luangwa (see Table 6). The largest share
of benefits in Lower Zambezi goes to non-
poor households in the GMA (US$0.14 million).
In Nepal, hotels purchase 26 percent of their
inputs from outside the local economy, and a
five percent increase in local purchasing raises
local incomes by US$3.0 million (see Figure 21).
As in Zambia, most of these benefits accrue to
non-poor households. In Fiji, the five percent in-
crease in local purchasing boosts local incomes
by US$291,374, with most benefits accruing to
non-poor households on the mainland (US$
211,587); the incomes of poor households on
the mainland and of island residents increase
by US$55,500 and US$24,287, respective-
ly. Finally, in Brazil, a 5 percent increase in
local purchasing boosts local incomes by
US$102,045; once again, most benefits accrue
to non-poor households, which increase their
incomes by US$88,700 compared to US$13,345
for poor households. In all four countries, poor
households benefit less than non-poor ones
due to their lesser capacity to take advantage of
economic opportunities.
table 5 Annual Effect of Government Hiring a Local Park Ranger, 2019
US$ amounts
Zambia Nepal Brazil
Changes in local economy incomes
Lower Zambezi
South Luangwa
Chitwan National
Park
Abrolhos Marine
National Park
Real Income 1,479 1,038 6,799 24,045
Poor households 911 668 912 9,875
Non-poor households
567 370 5,887 14,170
Cost to hire additional worker
978 669 2,442 8,963
Source: World Bank data
Note: Government expenditures were not available for Fiji.
table 6 Annual Impacts of 5% Increase in Local Purchasing for
Businesses, 2019US$ amounts
Zambia Nepal Brazil Fiji
Lower
Zambezi South
Luangwa
Chitwan National
Park
Abrolhos Marine
National Park
Mamanuca Islands
Total Real Income
207,573 352,894 3,017,214 102,045 291,374
Poor 10,671 260,175 29,395 13,345 55,500
Non-poor 196,901 92,720 2,987,818 88,700 211,587
Island n/a n/a n/a n/a 24,287
Source: World Bank data
Figure 21: Annual Impacts of 5% Increase in Local Purchasing for
Businesses, 2019
LowerZambezi
SouthLuangwa
ChitwanNational Park
AbrolhosMarine Park
MamanucaIslands
Zambia Nepal Brazil Fiji
0.0
0.5
1.0
1.5
2.0
2.5
3.0
3.5
Inco
me
impa
ct o
f 5%
in
crea
sed
inpu
t, m
illio
ns U
S$
0.210.35 0.29
0.10
3.02
Source: World Bank data

FIn
DIn
Gs
56 BAnKInG on PRoteCteD AReAs
To conclude, the findings from the four country case studies can be summarized in
the following key takeaways:
Protected areas are natural assets that provide substantial economic benefits, and support significant numbers of jobs
Benefits of tourism in protected areas go beyond tourism businesses and households directly involved in the sector
• Impacts are differentiated by poor and non-poor
There are however winner and losers, and policies are required to compensate households which lose income, and to equitably distribute benefits to local communities
Government programs, such as hiring locals to work in protected areas, and locally sourcing goods and services, can strengthen tourism’s economic impacts
Investing in protected areas is good economics-
• In some cases, protected areas are self-financing and not a resource sink
• Economic impacts of protected area tourism outweigh its costs in all four countries
The COVID-19 pandemic has had a significant impact on the tourism sector, and multiple effects on economies

FIn
DIn
Gs
57PRoMotInG sUstAInABLe PRoteCteD AReA toURIsM to BeneFIt LoCAL eConoMIes
3.3 study limitations
While estimations of direct/indirect tourism
impacts provide a better picture of the sector’s
links to surrounding communities, such esti-
mates remain conservative, and may not reflect
the full effects of protected area investment.
Critical to this point, the LEWIE model is not
dynamic, and thus, varying factors like fishery
stocks, which are critical to marine protected
areas, are not considered. Scaling the LEWIE
methodology to fit additional needs can provide
further evidence of the benefits of investment
in protected areas. In marine protected areas,
this includes developing a “bio-LEWIE” model
which incorporates data on fishery stocks, the
sustainability of their harvest, and the supply
and demand of sea products to the local tourist
industry. Unmeasured benefits, such as the
maintenance and supply of ecosystem services
are increasingly revealed to have significant
economic values.
It is also possible that this study understates
the full economic impact of tourism around
parks as only benefits to the local economy
have been estimated. Tourists who visit protect-
ed areas also spend money outside the local
economy, and tourism businesses are likely to
source goods and services from outside the
local economy too. Both these channels add
to returns on government spending and to the
nation’s economy/GDP. Also, the study does not
consider the costs of adverse environmental
impacts or externalities associated with tourists;
however, it recognizes that tourists can degrade
environmental assets. Data limitations detailed
in the report have meant that not all econom-
ic linkages can be captured; as an example,
impacts on the local economy from the expen-
ditures made by protected area managers were
not considered.
Attribution - the link between protected area
status and the desire of tourists to visit - is
another challenge for this kind of study. In the
case of terrestrial protected areas, the reasons
for visits are usually clear, as these areas are
far-removed from competing attractions and are
visited for reasons specific to the site. In marine
protected areas, however, these motivations are
less direct because visitors are drawn to coastal
areas irrespective of the conservation status of
marine environments. Because of this, the evi-
dence linking protected area status with tourist
numbers is not clear, and site-specific data are
needed to cast light on this issue.
Finally, these findings are specific to the pro-
tected areas chosen for this study and may not
apply to other protected areas. As countries
consider the results of this study, they should
assess comparability of their protected areas
with our case studies before adopting recom-
mendations. Scaling this methodology to cover
more parks and more contexts in future studies
can help to overcome this issue.

Po
LIC
y R
eC
oM
Me
nD
AtI
on
s
58 BAnKInG on PRoteCteD AReAs
4
Policy Recommendations

Po
LIC
y R
eC
oM
Me
nD
AtI
on
s
59PRoMotInG sUstAInABLe PRoteCteD AReA toURIsM to BeneFIt LoCAL eConoMIes
As presented in the previous section, analysis of
the country case studies has shown that protect-
ed areas, because they attract tourists, are able
to conserve biodiversity and to stimulate local
economic development in surrounding areas,
providing employment for poor and non-poor
households, and for those directly involved in
the tourism sector, and others.
As countries begin to realize these benefits,
there is great potential for protected areas to
contribute to development goals and to secure
biodiversity assets. While the findings of this
study cannot be applied to all protected areas,
they offer lessons from diverse settings from
which policies can be tailored. Central to all ef-
forts, however, is the need to manage protected
areas well, promote tourism and diversify its
offerings, and share benefits with local commu-
nities fairly. Taken together, these three factors
can promote both development and biodiversity
conservation (see Figure 22).
figure 22 Framework for Sustainable Tourism in Protected Areas
Source: World Bank
Po
LIC
y R
eC
oM
Me
nD
AtI
on
s
60 BAnKInG on PRoteCteD AReAs
4.1 protect natural assets
13 For tools and resources on developing these and other forms of nature-based tourism, see World Bank 2020c.
4.1.1. Formalize Protected Areas
Biodiversity cannot be recovered once lost, and
to conserve ecological assets, it is crucial to for-
malize protection. In Fiji, for example, few marine
areas have been formally protected, and to rem-
edy this situation, it is important, as a first step, to
align these areas with formal (“gazetted”) marine
protected areas in order to build benefit sharing
arrangements and scale up the impacts of these
areas on local economies. Even if formalization
restricts resource use, and prevents local people
from fishing, hunting, or harvesting plants, such
restrictions may be offset in the medium term, as
over-harvested wild populations recover under
formal protection and disperse into surrounding
GMAs, buffer zones and favorable habitats. As
noted in section 3.2, formal marine protection
may cause recovering fish stocks to populate
adjacent areas in which fishermen benefit from
increased catch sizes. Formalization also gives
governments authority to work with local busi-
nesses to pursue environmental standards which
may reduce the impact of tourism on fragile
ecosystems, including reefs.
4.1.2 Increase Public Investment in Protected Area Management
To promote biodiversity conservation and se-
cure the natural assets visitors enjoy, protected
areas must be conserved and well managed.
This requires governments to address the
underlying factors associated with poor per-
formance, and to invest in their management.
Conservation spending can address threats to
natural assets (Waldron et al. 2017; McCarthy
et al. 2012; Waldron et al. 2013), and improve
management when used to hire and train staff,
invest in infrastructure for enforcement and
tourism, manage wildlife and other natural
resources, and promote outreach. Investing in
protected areas with viable tourism can also
subsidize other parks in which tourism is still to
be developed or is not suitable. Some of the
broad categories of investments and activities
are described in Table 7 below.
While investing in protected areas to grow
tourism generates positive impacts for local
economies, there are also tradeoffs that need to
be considered. Higher tourist numbers increase
the environmental footprint of the sector and
may lead to the degradation of natural assets,
reducing the net benefit to local economies. In
Nepal’s mountains, for example, deforestation
for construction, cooking and heating in lodges,
and waste generated by tourists threaten the
quality of the very environment that attracts
visitors from around the world. Similarly, plastic
debris and aquatic litter in marine protected
areas are unsightly, and can harm marine life.
Damage to coral reefs from boat traffic, anchor-
ing, and scuba diving also compromise marine
habitats. Targeted, system-wide investments
can contain impacts on environments and local
economies, and one approach is high-value
low-volume tourism which attracts fewer tourists
that generate more income. Conservation
tourism, ecotourism13, and related activities
may also promote low-impact development of
the industry. Each of these strategies relies on
local community participation and leadership for
stakeholder buy-in and locally tailored actions.
A recent World Bank report provides a review
of tools and knowledge to guide nature-based
tourism practitioners to prepare projects that
promote sustainable tourism practices and pol-
icies, improve visitor management, and reduce
impacts from tourism, among other important
topics (see Box 10) (World Bank 2020c).
While asset protection is largely a public
sector responsibility, government investment
in protected areas demonstrates a commit-
ment which makes private sector funding more
likely. In some African countries, collaborative
approaches have emerged in which the state
delegates authority to manage protected areas
to private or non-profit operators (Baghai et al.
2018). This enabling environment has resulted in
more funding than state budgets allow for, and
increased revenue retention for protected areas
(Lindsey et al. 2021).

Po
LIC
y R
eC
oM
Me
nD
AtI
on
s
61PRoMotInG sUstAInABLe PRoteCteD AReA toURIsM to BeneFIt LoCAL eConoMIes
Table 7 List of Investments and Activities from Increased Public Investment in Protected Areas
Categories Sub-categories Examples of activities in which investments can be made
I. Protected Area Management
Creation of protected areas
Creation and expansion of protected area network.
Infrastructure Infrastructure establishment and support for visitor centers, roads, accessibility and connectivity of protected areas, water holes, wetland management.
Operations Development of budgets, management plans, training & equipment for park guards, anti-poaching initiatives, fire protection, communications, and technology.
Finance Capitalization of conservation trust funds, design of regulatory framework for incentive structures for funding, and financial modeling.
Monitoring, Research & Species Conservation
Implementation of- national and site level wildlife surveys, wildlife and habitat management, buffer zone and corridor management, trans-frontier cooperation, remote sensing and geospatial analysis for monitoring, rehabilitation, marine spatial planning, and reef and forest restoration.
II. Policy Policy & Legal Reforms Development of concessions, benefit sharing mechanisms, park entry fees, CITES compliance, and laws to combat illegal wildlife trade.
Institutional Capacity Building
Staffing, equipment, technical assistance and training, support for administration and management, stakeholder analysis, research, information and knowledge sharing nationally and internationally.
III. Tourism Tourism Development Strategy (“product”)
Technical assistance to develop a business plan and strategy for protected areas, marketing and branding, improving business climate i.e., awareness of nature-based tourism, feasibility studies, private sector investment, tourism opportunities, cultural and heritage conservation.
Tourism Training & Skills Development
Skills development for locals to enter tourism sector, scholarships, sensitization to conservation activities, training local authorities, employment choices in tourism, education program for local youth, small-scale tourism/community-based ecotourism.
IV. Community Engagement
Livelihoods improved livelihoods, conflict mitigation, “entrepreneurial” investments, conservation-linked incentives, sustainable use, and community action plans.
Governance and community-based natural resource management
Sustainable resource management, land zoning, natural resource mapping, capacity building of local community members, indigenous knowledge sharing, governance, awareness, and behavior change.
V. Partnerships Integrated Planning Across Sectors
Landscape and seascape management; cross-sector infrastructure, irrigation, transport, and agriculture; efficiency of complementary sectors (fisheries, climate-smart agriculture, climate change, forestry, pollution, and waste management).
Source: World Bank
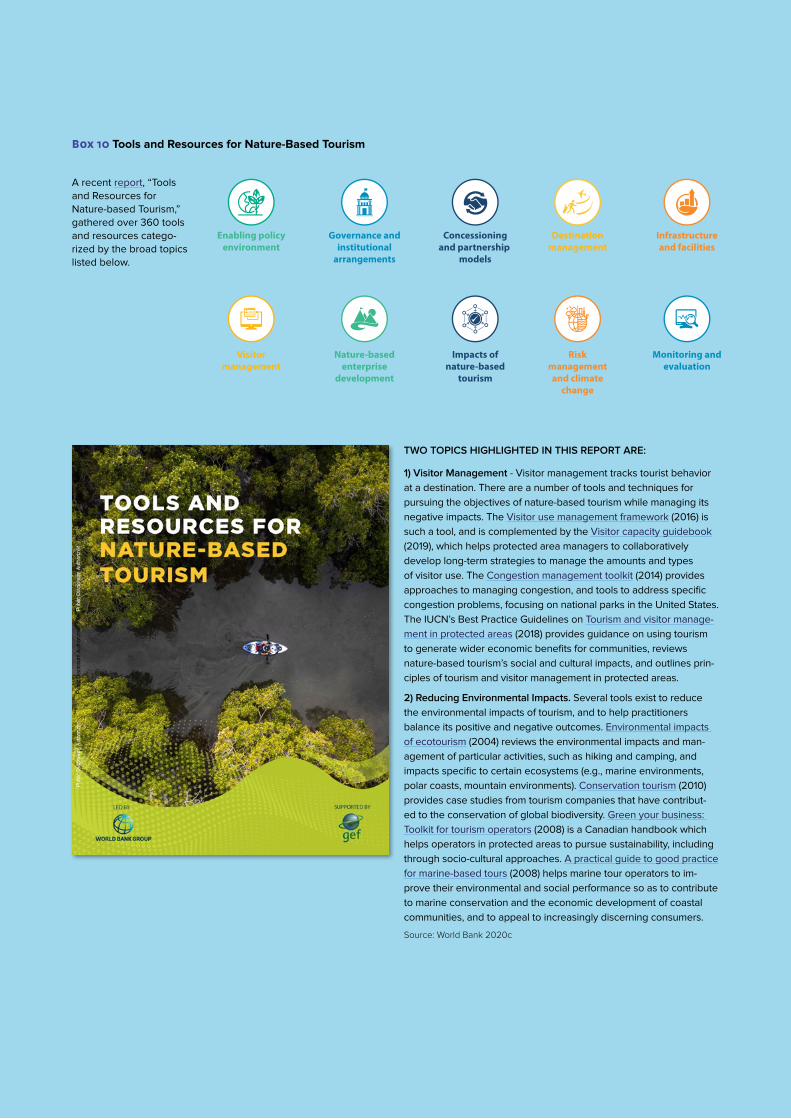
Po
LIC
y R
eC
oM
Me
nD
AtI
on
s
62 BAnKInG on PRoteCteD AReAs
Box 10 Tools and Resources for Nature-Based Tourism
A recent report, “Tools and Resources for Nature-based Tourism,” gathered over 360 tools and resources catego-rized by the broad topics listed below.
TWO TOPICS HIGHLIGHTED IN THIS REPORT ARE:
1) Visitor Management - Visitor management tracks tourist behavior
at a destination. There are a number of tools and techniques for
pursuing the objectives of nature-based tourism while managing its
negative impacts. The Visitor use management framework (2016) is
such a tool, and is complemented by the Visitor capacity guidebook
(2019), which helps protected area managers to collaboratively
develop long-term strategies to manage the amounts and types
of visitor use. The Congestion management toolkit (2014) provides
approaches to managing congestion, and tools to address specific
congestion problems, focusing on national parks in the United States.
The IUCN’s Best Practice Guidelines on Tourism and visitor manage-
ment in protected areas (2018) provides guidance on using tourism
to generate wider economic benefits for communities, reviews
nature-based tourism’s social and cultural impacts, and outlines prin-
ciples of tourism and visitor management in protected areas.
2) Reducing Environmental Impacts. Several tools exist to reduce
the environmental impacts of tourism, and to help practitioners
balance its positive and negative outcomes. Environmental impacts
of ecotourism (2004) reviews the environmental impacts and man-
agement of particular activities, such as hiking and camping, and
impacts specific to certain ecosystems (e.g., marine environments,
polar coasts, mountain environments). Conservation tourism (2010)
provides case studies from tourism companies that have contribut-
ed to the conservation of global biodiversity. Green your business:
Toolkit for tourism operators (2008) is a Canadian handbook which
helps operators in protected areas to pursue sustainability, including
through socio-cultural approaches. A practical guide to good practice
for marine-based tours (2008) helps marine tour operators to im-
prove their environmental and social performance so as to contribute
to marine conservation and the economic development of coastal
communities, and to appeal to increasingly discerning consumers.
Source: World Bank 2020c

Po
LIC
y R
eC
oM
Me
nD
AtI
on
s
63PRoMotInG sUstAInABLe PRoteCteD AReA toURIsM to BeneFIt LoCAL eConoMIes
To reduce over-reliance on tourism and sta-
bilize protected area financing, other sources
of finance such as conservation trust funds
(Doinjashvili, Méral, and Andriamahefazafy 2020),
impact bonds (Withers and Zoltani 2020), and
payment for ecosystem services (Börner et al.
2017) can also be considered. Table 8 provides
an overview of financial instruments, and the
report, “Mobilizing Finance for Nature” provides
detailed guidance on financing mechanisms for
biodiversity conservation (World Bank 2020a).
Robust strategies may involve several of these
approaches in tandem, working towards a sys-
tems approach to protected area finance.
table 8 Financial Instruments for Protected Areas
Instruments Description
Conservation Trust Funds
Conservation Trust Funds are legally independent institutions (i.e., non-government) managed by an independent board of directors, which provide long-term, sustainable funding for conservation and/or protected area agencies through local grants. Trust funds can be endowments, sinking funds, or revolving funds.
Government budget/revenues
Government revenue allocations come from local, regional and national bodies, and/or authorities’ public budgets. They also include earmarked government taxes on tourism, and on commodities such as gasoline, structured debt relief earmarked for conservation, and government bonds.
Carbon Finance Carbon markets serve as a new opportunity for protected area funding but are usually inadequate to meet full management costs.
Revenues from tourism and recreation
Mechanisms include protected area entry and recreation fees, sport hunting and “green” safari fees, hotel and airport taxes, tourist and tourism operator contributions, and public land and tourism concessions, among others. Revenues should ideally be channeled to protected area management.
Compensation payments
Compensation payments are instruments to hold companies accountable for their impacts on ecosystems and biodiversity. They finance conservation by collecting fines for pollution, royalties for natural resource use, compensation for environmental impacts, or even voluntary contributions. Although compensation payments don’t necessarily reflect actual environmental impacts or provide one-for-one compensation, they pay for the use of a natural resource by investing in the conservation of another. They are typically calculated as a percentage of project development costs and pertain to bioprospecting, royalties from resource extraction, fines for environmental damage, voluntary and mandatory payments, mitigation banking and biodiversity offsets.
Revenues from the sale and trade of wildlife
Revenue comes from the legal sale and trade of plants and wildlife products for conservation. International conventions, such as the CITES and associated national laws govern and monitor the legality of such trade. Financing mechanisms such as fines, wildlife auctions, loans, and in-situ-ex-situ partnerships contribute funding to species conservation.
Innovative financing mechanisms
Financial instruments can design and incubate mechanisms to raise and invest new capital which finances conservation and pays for results. These include Wildlife Conservation Bonds such as the Rhino Impact Bond, Lion’s Share Fund, and Conservation Capital’s Umiliki Investment fund, among others.
Collaborative Management Partnerships (CMP)
CMPs between state wildlife agencies and NGOs can attract investment and technical capacity to improve protected area performance. The three main CMP models - financial and technical support, co-management, and delegated management - yield median funds that are 1.5, 2.6 and 14.6 times greater, respectively, than baseline state budgets for protected area management (Lindsey et al. 2021).
Source: World Bank

Po
LIC
y R
eC
oM
Me
nD
AtI
on
s
64 BAnKInG on PRoteCteD AReAs
4.1.3 Build Capacity of Protected Area Managers
Successful protected areas have qualified man-
agers who are well versed in protected area laws
and policies, and also understand the business
needs and obligations to conservation of tourism
operators and commercial entities. For example,
managing concession programs requires skill
sets that go beyond knowledge of wildlife man-
agement, and this capacity must be built.
Experience from many countries has shown that
centralizing conservation at the national level
allows for better access to specialists and deci-
sion makers, and more policy consistency, while
the day-to-day management of concessions
is best accomplished at the protected area
level by trained park managers. Secondly, the
number of staff needed to manage concessions
agreements will depend on the number of
contracts that are under development and/or
operational. However, at a minimum, a national
level program will require a program manager,
project development team member (2–3 de-
pending upon the number of projects), finance
team member, operations and planning team
member, facility management team member
and a legal advisor. And finally, two types of
competencies are needed for concession man-
agement personnel (see Table 9).
Core competencies refer to general skills need-
ed by all staff in commercial services and could
apply to departments/ministries in charge of
protected area management. Fundamental com-
petencies refer to key technical abilities needed
by all staff in concession management.
4.1.4 Regularly Assess the Effects of Visitor Spending
To make the case for public spending, and to
support planning, governments should regularly
assess the impacts of protected area tourism,
and use visitor surveys on a rolling basis to
capture seasonal changes in tourism behavior.
Among the case studies, only Fiji had a regu-
lar International Visitor Survey, which is led by
the Ministry of Commerce, Trade, Tourism and
Transport in partnership with the IFC. Visitor
surveys and information on park visitor numbers
and tourist spending behavior can be used to
inform policies, improve services to tourists,
assist local communities, refine tourism business
models, understand the impacts of tourism and
how they may change over time, and demon-
strate the economic returns of investing in
protected areas.
4.2 grow and diversify tourism businesses
4.2.1 Diversify Tourism Offerings
In the countries we studied, to grow and diver-
sify tourism will require policies, programs, and
investments that go beyond protected areas.
In many countries, nature-based tourism is
clustered around key protected areas, con-
centrating both positive and negative impacts
on these regions. In Zambia, for example, over
40 percent of the country’s land is under some
form of protection, including 20 national parks,
yet 95 percent of tourism is clustered around
just five national parks (Ministry of Tourism and
Arts, Republic of Zambia 2018). Similarly, in
Nepal, tourists predominantly visit only four pro-
tected areas: Shivapuri-Nagarjun National Park
(close to Kathmandu), Annapurna Conservation
Area, Chitwan National Park, and Sagarmatha
National Park, home of Mount Everest. In Brazil
too, tourists are concentrated in a relatively
small number of protected areas. For example,
according to ICMBio (2019), the most visited
national parks in 2018 were Tijuca, with 2.6 mil-
lion visitors, followed by Iguaçu (1.9 million) and
Table 9. Staff Competencies
Core competencies Fundamental competencies
• Organizational Awareness
• Oral and Written Communication
• Problem Solving
• Technological Skills
• Accountability
• Individual Development and Planning
• Flexibility
• Attention to Detail
• Interpersonal Skills
• Integrity/Honesty
• Understanding the legal framework that applies to operators
• Developing contracts or other authorizing instruments, and soliciting bids if applicable
• Monitoring and evaluating operators
• Data collection and analysis
• Business acumen
• Contract negotiation skills, and
• Asset management training if government facilities are used by operators
By developing training and on-the-job education strategies, protected area managers can cultivate and retain the skills of their staff.
Source: Thompson et al. 2014

Po
LIC
y R
eC
oM
Me
nD
AtI
on
s
65PRoMotInG sUstAInABLe PRoteCteD AReA toURIsM to BeneFIt LoCAL eConoMIes
Jericoacoara (1.9 million). The most visited fed-
eral marine protected areas in 2018 were Arraial
do Cabo Extrativist Reserve (1.2 million visitors)
and PN Fernando de Noronha (0.1 million).
In the four countries, this concentration of visitors
at well-known sites makes it important to expand
the number of protected area sites in order
to better manage tourism’s impacts. Thus, the
tourism potential of new sites in each country’s
protected area network needs to be assessed,
and priority sites identified which consider road
access, security, biodiversity, landscape attrac-
tions, and local stakeholder interest in tourism
development. A recent World Bank publication
on Nepal provides guidance on site selection
and private sector inclusion in this process
(see Box 11).
4.2.2 Develop Concession Policies to Promote Tourism in Protected Areas
Another means to promote tourism in protect-
ed areas is through concessioning, which can
help to address tourism infrastructure financing,
managing existing infrastructure (mandate, skills,
personnel), and offering public services. Leases,
management contracts, and licensing (Leung et
al 2018; Thompson et al 2014) may play similar
roles (see Figure 22).
A business will need a concession agreement
to operate inside a protected area, for example.
A concession agreement stipulates key terms
and conditions that the business must oper-
ate under, such as duration, type of operation,
environmental conditions, and fees for access.
A commercial services/concessions program
in any country should include the following
elements:
1. Strong protected area laws and regulations
2. Public support for commercial activity in parks
3. Demonstrated economic benefit
4. Commercial Service/Concession laws drafted
with stakeholders, including potential opera-
tors/concessionaires, environmental groups,
and the general public
5. Legal framework allowing implementing
agency to set policy details
6. Socializing the draft law
7. Implementing the law through regulations
that are clear and thorough; and
8. Modifying these laws/regulations when
necessary.
The regulatory framework of concessions
policies is discussed further in Box 12, in which
current policies in the four country contexts are
outlined.
Figure 23. Instruments to Outsource Tourism
CONCESSION LEASEMANAGEMENT
CONTRACTLICENSE/ PERMIT
Description
Long-term user rights. Concessionaire has responsibility for investment and is usually accountable for management
Lease agreement. Private operator leases facility and assumed operating responsibility
Agreement with operator of payment of an existing fee based on performance
License for undertaking activities in PA that could otherwise be considered illegal and where operators are screened. Permit for legal activities
Duration and Payment
10-40 years, fee
(could include revenue sharing)
More than 5 years, fee
<5 years, government pays fee, might be performance-based fee
Up to 10 years, licenses/ permits paid by operator
Private Operator Functions
Design, rehabilitate, extend, build, finance, maintain and operate. Ownership PA
Maintain, operate, and provide services
Depends on the contract
Depends on the contract
Activities
Accommodation, restaurant, retail
Use of fixed infrastructure
Use of fixed infrastructure
Vehicle-based tour (license), guiding, canoeing, hunting.
Source: World Bank

Po
LIC
y R
eC
oM
Me
nD
AtI
on
s
66 BAnKInG on PRoteCteD AReAs
Box 11. Selecting Protected Area Destinations for Phased Nature-Based Tourism Development
To diversify and expand nature-based tourism in Nepal, the WBG has identified twelve destinations across the seven newly-formed administrative provinces, in consultation with stakeholders (see Map B11.1). Selected destinations can be ranked according to private sector opportunities, based on the desirability of growing key sectors and the feasibility of addressing constraints to this growth. Desirability and feasi-bility can be roughly equated to social returns (desirability) versus risk-adjusted private returns (feasibility) of investment in each sector.
These destinations may be ranked according to the criteria above to identify optimal sites for high private sector develop-ment impact. Such sites need to score highly for both criteria in order for the private sector to contribute to development, as even if social returns are high, private sector involvement is profit-driven. However, the expansion of protected area tourist offerings is critical to manage tourism’s negative impacts and achieve conservation/development goals, and requires private sector participation to complement scarce public funds. By both leveraging the private sector and optimizing the use of public resources, financing for development and growth can be maximized.
In terms of the desirability/feasibility criteria, Provinces 4 and 5 offer the greatest opportunities for private sector engagement, and may be able to develop destinations to attract high-end and mid-range markets. Mid-West (Province 6) and Langtang and Gaurishankar (Province 3) have similar potential, while Far West Nepal (Province 7) and Eastern Nepal destinations (Province 1) are not ranked as highly due to access limita-tions. Kathmandu valley (Province 3), Everest (Province 1), and Chitwan (Province 3) are relatively mature markets with little diversification potential.
Desirability Criteria Feasibility Criteria
Employment creation potential - Potential over 5 years (e.g., from less than 500 jobs to high potential of 5000+ jobs)
Potential for more visitors (market appeal) - Competitive in relation to other natural & cultural destinations
Impact on inclusiveness - Potential impact in addressing poverty, marginalized ethnic groups/gender through direct and indirect benefits
Potential for more spending by visitors - Demand from higher-spending tourists is present but not fully realized due to lack of activities, facilities and access
Private sector investment potential - Potential to attract relatively large investors (FDI, large investor and medium-size investor) in the high-end to mid-range market segment e.g., ‘tourist hotel’ three to five-star accommodation
Access infrastructure - Infrastructure availability, level and planned development
Product innovation and value chain addition - Potential to add value to the destination/tourist activity, be replicable, and improve positioning, brand and appeal
Alignment with national and local government priorities - Alignment with national strategies and local/regional development policies
Cultural and environmental protection – Improved environmental sustainability/protection and protection of cultural assets
Empowerment at destination level - Clarity of local mandates & involvement of local public and private stakeholders and communities
Source: World Bank 2020b
Map B11.1 Twelve
Potential Tourism
Destinations in Nepal

Po
LIC
y R
eC
oM
Me
nD
AtI
on
s
67PRoMotInG sUstAInABLe PRoteCteD AReA toURIsM to BeneFIt LoCAL eConoMIes
table 10 Authority, Law, or Regulation Governing Concession Component
Concession component Authority, law, or regulation governing component
Brazil Fiji Nepal Zambia
Contract Term By policy N/A Law Unknown
Methodology for Determining Appropriate Activities
No, relies on management plan
N/A X No, relies on management plan
Written Regulations and Policies that are legally enforceable
Yes N/A In process Unknown
Solicitation, Selection, Evaluation & Award Procedures
Yes, procurement law
N/A X Unknown
Non-Competitive Award of Concession Contracts
No N/A X Unknown
Unsolicited Applications No N/A Never Unknown
Standard Concession Contract Provisions No, by policy N/A X Unknown
Protection of Concessionaire Investment In contract N/A X Unknown
Franchise Fees Yes N/A X Yes
Community Award of Concession Contracts No, separate law N/A Unknown Unknown
Reasonableness of Rates to Visitors No, by contract N/A X Unknown
Economic Development/Benefit to Indigenous Populations
No, separate law Yes Unknown Unknown
Annual and Periodic Reviews No, by policy N/A Unknown Unknown
Dispute Resolution No, by policy N/A Unknown Unknown
Box 12 Concessions Policies for Protected Areas
Commercial visitor services, or tourism concessions, are facili-ties and services provided to protected area visitors to facilitate their use and enjoyment of a park. Concessions enhance park operations by providing services such as accommodation, food, merchandise, recreational activities, rental equipment, and transpor-tation services. These typically do not include services needed for the operation of the park itself, like park infrastructure, trails, visitor education centers, ranger stations and restrooms. Concessions, rather, provide services and activities that enable visitors to enjoy and explore parks in a manner aligned with the conservation goals of the area.
When concession and commercial service agreements are man-aged well, they benefit the park, the community, and the operator. Private concessions can provide opportunities to communities around protected areas through employment, training, and econom-ic development. Concession operators can be private companies, non-profits, community groups or partnerships.
The US National Park Service was the first national park service to use concessions, starting over one hundred years ago. Since then, concessions policies have come to resemble licenses to operate on government property, in which visitors are customers and the government oversees the operator/concessionaire. In addition to a supportive relationship with the concessioning authority in the pro-tected area, best practices for a commercial services/concessions system include:
1. Well defined, transparent and consistent processes to deal with commercial interests so that parties are treated fairly and consistently.
2. Explicit and transparent criteria should be applied to commer-cial decisions.
3. Decision-makers must be identifiable, and independent from the process.
4. Conflicts of interest should be avoided, and agencies should have processes to prevent these.
5. Separate processing/management and decision making of concession activities, in support of principle four.
Concessions policies from Brazil, Fiji, Nepal, and Zambia were reviewed with respect to the legal frameworks for commercial opera-tions in parks, regulations, and procedures that are publicly available to interested parties (see Table 10). Concessions laws vary between the countries: in Nepal and Zambia, concessions policies are includ-ed in protected areas law, while in Brazil, a separate law exists for concessions in protected areas. Fiji has no specific legislation, but existing laws do not prohibit concessioning. Revenue to govern-ments from commercial concessions totalled US$15M in Brazil (with 11 concessions contracts and over 2,000 commercial use authori-zations) and US$120M in Nepal (with 6,630 concessions contracts). Strong concessions policies allow for sustainable tourism growth in protected areas, especially if governments prioritize these policies and support protected area management staff to uphold them.

Po
LIC
y R
eC
oM
Me
nD
AtI
on
s
68 BAnKInG on PRoteCteD AReAs
4.3 share benefits with local communities
4.3.1 Formalize Benefit Sharing Arrangements
As noted, when communities benefit from pro-
tected areas, particularly through tourism, they
have an incentive to support parks, and become
stakeholders in conservation. Benefit sharing
formalizes this process, and each of the four
countries have different benefit sharing arrange-
ments as seen in Table 11.
It is important to note that not all protected ar-
eas generate tourism revenues for communities,
and that destinations must be sufficiently popu-
lar to provide ongoing economic stimuli to local
economies. Even when tourism generates rev-
enues, these need to be equitably distributed
among beneficiaries in order for these commu-
nities to support the protected areas from which
the benefits are derived. Furthermore, there are
differences between income impacts for women
and men living in protected areas and OECMs,
and it is important that these differences inform
the conservation and use of natural resources.
Table 12 provides an overview of benefit sharing
arrangements along with examples that can
be used by park authorities in discussions with
communities.
table 11 Comparative Benefit Sharing Arrangements in the Four Countries
Country Benefit sharing arrangements
Zambia The Zambia Wildlife Act (2015) states that revenue from consumptive and non-consumptive tourism (hunting) must be shared with communities - 50 percent of the revenue from outfitter licenses, animal fees, and hunting fees, and 20 percent from safari hunting concessions is shared with community resource boards (CRB), and 5 percent is shared with local traditional leaders. Payments to CRBs are split three ways: 20 percent for CRB administrative costs; 35 percent for community development projects (boreholes, toilets and schools); and 45 percent for resource protection, primarily through employing scouts for patrols. In addition, lodges in GMAs participate in social responsibility programs, usually involving reinvestment in the community in the form of schools, hospitals and conservation. This serves as another mechanism for communities to benefit from tourism in protected areas.
Nepal The Buffer Zone Management Regulations (1996) allow for 30–50 percent of park income to be channeled to local communities living in buffer zones for community development and natural resource management. These regulations allow user committees to spend 30 percent of their annual funds on community development, 30 percent on conservation, 20 percent on income generation and skills development, 10 percent on conservation education, and 10 percent on administration. Additionally, tourism is encouraged in community forests in buffer zones, many of which offer a variety of tourist products, including locally owned and operated accommodation. The regulations, however, prohibit land occupation and tree cutting, which restricts construction of lodges in forests, while The Forest Act prevents communities’ forest user groups from mortgaging or transferring their use rights, and thus precludes direct partnerships with private sector concession or lodge operators.
Fiji In Fiji, there are no formal benefit sharing agreements, apart from the Shark Reef Reserve in which a community trust fund receives 20 Fijian dollars per diver; this is in part due to the Surfing Area Decree (2010) which was enacted to promote Fiji as a premier surfing destination. The decree grants unrestricted and uncompensated access to surfing areas and supersedes all other forms of title, meaning that communities cannot charge for the use of traditional fishing grounds for tourism. However, in de-facto protected areas that are established when a foreshore lease is issued to a tourism enterprise, the Department of Land requires that local communities are compensated for their loss of fishing rights.
Brazil Brazilian legislation makes no provision to share park fees and concession revenues with communities living adjacent to national parks.

Po
LIC
y R
eC
oM
Me
nD
AtI
on
s
69PRoMotInG sUstAInABLe PRoteCteD AReA toURIsM to BeneFIt LoCAL eConoMIes
4.3.2 Strengthening Income Multipliers
Communities benefit from the economic activity
spurred by tourists visiting protected areas, and
the economic impact of this activity, through di-
rect and indirect linkages, may be expressed as
an income multiplier. Once these mechanisms
have been understood, government policies
and programs can be designed and imple-
mented to strengthen their economic impact.
Providing opportunities for tourists to interact
with local communities can achieve this, and in
some areas, transport is needed so that tourists
can more easily visit local towns and villages;
strengthening the capacity of local communities
to provide goods and services to tourists also
strengthens income multipliers.
Employment in and through tourism provides
the most tangible demonstration of the value
of protected areas and is arguably the stron-
gest single lever for delivering this value to
local people living near them. For this reason,
governments should invest in projects which
assist households to participate in the tourism
economy through entrepreneurship training,
skills development, credit services and lo-
gistics, among others. Governments should
also support business diversification and local
procurement to strengthen linkages in local
economies, drive production and employment,
prolong circulation of money and thus increase
multipliers. These benefits may be distributed
more fairly by including the poor and disadvan-
taged. More opportunities for benefit sharing
are presented in Table 13.
table 12 Benefit Sharing Arrangements with Local Communities
Benefit Sharing Arrangement
Examples
Direct and indirect employment
Direct: restaurant employees, wait staff, gardeners, taxi/boat drivers, park guides, and handicraft.
Indirect: Construction, food/goods for restaurants etc.
Revenue sharing mechanisms of protected area authorities
Refers to tourism revenues from concessions and partnerships, and income from levies, permits, hunting fees and/or taxes which are allocated to local communities. Such funds may be distributed through organized/formal trusts and used to finance local public goods and community development initiatives such as schools, clinics, small scale infrastructure, energy projects, environmental protection, etc. (Spenceley, Snyman, and Rylance 2019).
Revenue sharing schemes from tourism businesses and partnerships
Approaches or partnership models include public-community initiatives, public-private partnerships, community-owned-and-run enterprises, community-private partnerships, and public-private-community partnerships. Information on roles, responsibilities, challenges and limitations for each of these approaches are detailed in the World Bank report, “Supporting Sustainable Livelihoods through Wildlife Tourism” (Twining-Ward et al. 2018).
Sustainable harvesting of plants and animals
Many communities depend upon natural resources for their livelihoods. Allowing access to and sustainable harvesting of these resources can improve community support for protected areas.
Shared decision-making and capacity building
Local consultation on tourism development and protected area access, and support for communities to start small businesses and conservation enterprises.
Table 13: Opportunities to Increase Benefits for Local Communities Around Protected Areas
Tourism Impact Avenues/Opportunities to increase benefits
Direct • Formalize revenue-sharing mechanisms
• Build capacity and develop skills
• Promote sustainable use of natural resources
• Reduce human-wildlife conflict through mitigation and/or compensation
• Pursue inclusive governance
Indirect • Hire local labor for tourism and protected area management
• Encourage local sourcing of goods by tourism establishments
• Strengthen market linkages
• Offer small grants for businesses and enterprises
• Provide agricultural extension and increase capacity of local communities to supply goods and services

Po
LIC
y R
eC
oM
Me
nD
AtI
on
s
70 BAnKInG on PRoteCteD AReAs
4.3.3 Mitigate and Compensate for Human-Wildlife Conflict
Mitigation and compensation are fundamental
to the management of human-wildlife conflict,
and to secure constituencies for conservation
in communities surrounding protected areas.
However, the management of compensa-
tion payouts is important, and some studied
communities expressed concern that they
do not receive revenue shares in a timely or
appropriate manner. In Zambia, for instance,
distrust between park authorities and com-
munities arises through delays in the timing of
payouts, which do not coincide with peaks in
human-wildlife conflicts. The positive effects of
other benefit-sharing mechanisms may be less-
ened by operational and financial weaknesses,
or lack of transparency in the transfer of funds to
communities.
In Nepal, over a million people depend on
resources in buffer zone community forests,
and thus, conflicts arise over land use and
resources. Buffer zone user committee groups
compensate farmers for a portion of their crop
losses through cash transfers, but the estimation
of crop damage is very difficult, and surveys
from the six buffer zones indicate that payments
cover only a small fraction of losses. Other
approaches to mitigation include investment in
local level strategies (seasonal fences, livestock
corrals, etc.), and while these may be effective,
further research is needed, along with standard-
ized methods for the estimation of crop losses.
4.4 green recovery
The economic impacts of COVID-19 are
far-reaching, with monthly losses recorded in
all study sites. Fiji, where tourism accounts for
over one-third of the country’s economy (WTTC
2020), showed the greatest monthly losses. In
each site, the pandemic has resulted in lost jobs
and income following declines in tourism, an
industry previously known for its global growth.
These losses do not signal a volatile or risky
sector, but rather the effects of the pandemic;
nonetheless, they flag the need for strong gov-
ernance, built-in resilience, and a social safety
net. They also indicate the added imperative to
make the case for protected area tourism as a
means towards a green economic recovery. In
making such arguments, evidence is needed to
persuade governments that, through tourism,
protected areas can play a role in economic
recovery from the pandemic and attract private
sector participation to deliver economic and
development outcomes aligned with conserva-
tion objectives.
Large-scale investments in protected areas can
create jobs and boost economic recov-
ery and resilience. In the United States, the
Civilian Conservation Corps (CCC) was estab-
lished during the Great Depression, and created
jobs, infrastructure, and an industry which
thrives to this day. The initiative was a govern-
ment-wide partnership between the Forest
Service, the National Parks Service, the Labor
Department, and the US Army (see Box 13).
The world currently faces a crisis with similar
features: pressures on the environment are
unprecedented, and COVID-19 has resulted in
large-scale unemployment, making the CCC
as relevant as a green recovery model now as
it was in 1933. This year, the U.S. Government
has repurposed this initiative. The new Civilian Climate Corps aims to put Americans to work
through conservation and restoration of public
lands and water, and addressing climate change
(The White House 2021). Similarly, countries
with potential to grow their nature-based
tourism sectors, such as those in this study,
could benefit from CCC-like schemes to kick-
start their protected area tourism sectors to
maximize benefits to protected area-adjacent
communities.
The COVID-19 pandemic provides a win-
dow-of-opportunity for countries to develop
management settings and systems while
demand and use pressure are low. Frameworks
can be devised that are not immediately binding
(due to lower demand), which will give manag-
ers time to trial, consult and lay a foundation
for what sustainable tourism may look like. As
demand returns, systems can gradually become
binding, following testing of new operations
that prioritize long-term, sustainable, and sys-
tem-wide approaches. Similarly, the low demand
period will give park authorities time to collect
data on social, ecological and tourism impacts
for later evaluation.

Po
LIC
y R
eC
oM
Me
nD
AtI
on
s
71PRoMotInG sUstAInABLe PRoteCteD AReA toURIsM to BeneFIt LoCAL eConoMIes
box 13 Transforming Landscapes, Creating Jobs and Laying the Foundation for Long-Term Economic Growth - Learning from the Civilian Conservation Corps: a Green Economic Recovery Initiative
Context
In 1933, the Great Depression had left about 25% of Americans unemployed, and America had endured years of drought, forest fires, severe land deg-radation, and rampant soil erosion. The CCC was established as part of the New Deal Program, and while tasked with generating employment, was more than a cash-for-work program. It restored natural capital, correcting years of forestry mismanagement, deforestation and land degradation, and invested in physical capital, laying a foundation for economic growth.
During the CCC’s nine-year operation, it employed approximately 5 percent of the US male workforce (about three million people) as skilled and unskilled labor, training them to build and man-age businesses in construction and landscape design, for example, some of which persist to this day. The CCC led to the creation and expansion of the nationwide state parks system. It invested in the infrastructure for almost all of America’s national parks, and increased visitor numbers to national and state parks from 3.2 to 20.4 million in nine years.
ACHIEVEMENTS
JOB CREATION ECOLOGICAL RESTORATION
TOURISM DEVELOPMENT
• Employed ~3 million people (~5% of the U.S. male workforce)
• 250,000 hired in the first 3 months
• Mostly urban recruits, aged 18–25 years
• Professionals - landscape architects, engineers, historians, foresters, geologists, ecologists, administrators – also
employed and trained
• College students were recruited through the internship program
• 3.5 billion trees planted
• 3,470 fire towers built, 97,000 miles of fire roads constructed, 4,235,000 person-hours fighting fires
• Erosion arrested on > 20 million acres (e.g., check dams, terracing, re-vegetation)
• Investments in flood control, irrigation, and
drainage
• 28,000 miles of hiking trails
• 63,000 visitor buildings
• 711 state parks established
• Investments in infrastructure for the iconic Yellowstone and Grand Canyon National Parks
• Hoover Dam was built with funding and labor
(21 000 men) from CCC; the largest reservoir in the US. CCC involved in the construction, artwork, sculptures, excavation, and building of the tourist museum
ECONOMIC LEGACY
• Expansion of U.S. Recreation and Heritage Tourism Sector
» Visitors to national and state parks increased from 3.2 to 20.4 million in nine years
» Today, parks receive over 320 million visitors per year who spend an estimated US$21 billion in local gateway regions, supporting more than 340,500 jobs, generating US$41.7 billion in economic output
• Some of the entrepreneurs trained through the CCC created businesses that exist to this day
• The CCC became a model for future conservation programs
» More than 100 present-day corps programs operate at local, state, and national levels, engaging young adults in community service and conservation activities
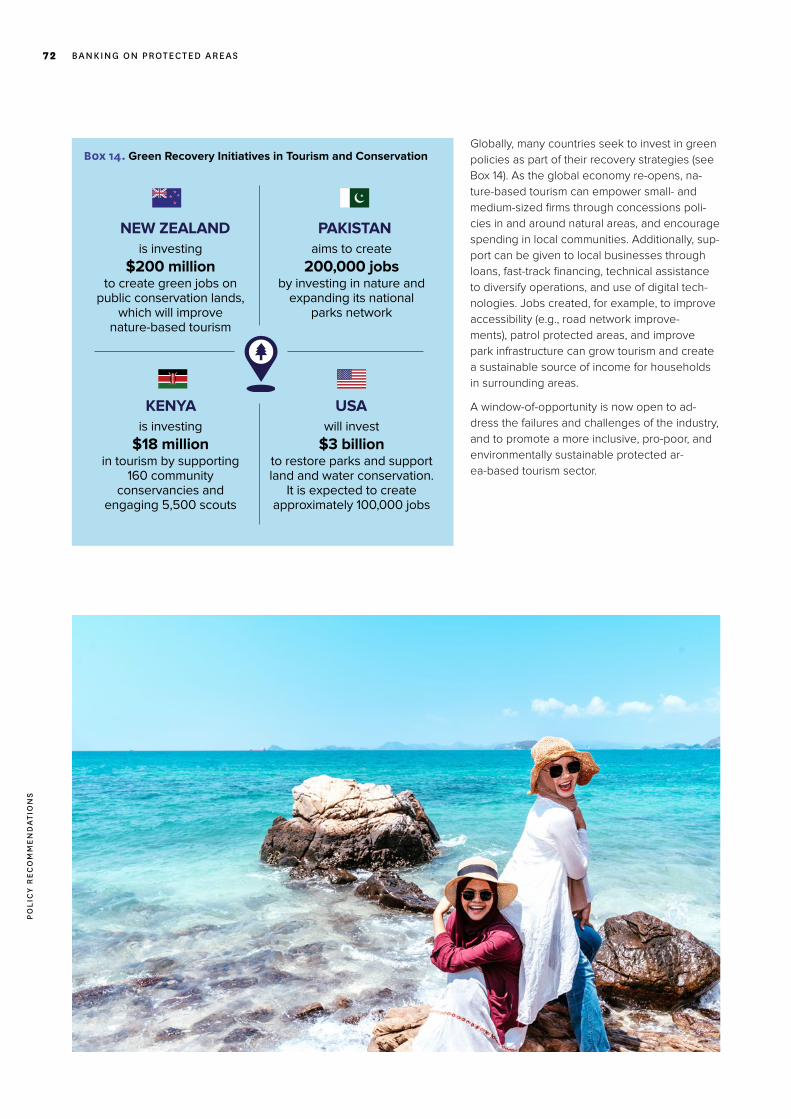
Po
LIC
y R
eC
oM
Me
nD
AtI
on
s
72 BAnKInG on PRoteCteD AReAs
Globally, many countries seek to invest in green
policies as part of their recovery strategies (see
Box 14). As the global economy re-opens, na-
ture-based tourism can empower small- and
medium-sized firms through concessions poli-
cies in and around natural areas, and encourage
spending in local communities. Additionally, sup-
port can be given to local businesses through
loans, fast-track financing, technical assistance
to diversify operations, and use of digital tech-
nologies. Jobs created, for example, to improve
accessibility (e.g., road network improve-
ments), patrol protected areas, and improve
park infrastructure can grow tourism and create
a sustainable source of income for households
in surrounding areas.
A window-of-opportunity is now open to ad-
dress the failures and challenges of the industry,
and to promote a more inclusive, pro-poor, and
environmentally sustainable protected ar-
ea-based tourism sector.
Box 14. Green Recovery Initiatives in Tourism and Conservation
is investing
$200 millionto create green jobs on
public conservation lands, which will improve
nature-based tourism
NEW ZEALAND
is investing
$18 millionin tourism by supporting
160 community conservancies and
engaging 5,500 scouts
KENYA will invest
$3 billionto restore parks and support land and water conservation.
It is expected to create approximately 100,000 jobs
USA
aims to create
200,000 jobsby investing in nature and
expanding its national parks network
PAKISTAN

Po
LIC
y R
eC
oM
Me
nD
AtI
on
s
73PRoMotInG sUstAInABLe PRoteCteD AReA toURIsM to BeneFIt LoCAL eConoMIes

Co
nC
LUsI
on
74 BAnKInG on PRoteCteD AReAs
Conclusion5

Co
nC
LUsI
on
75PRoMotInG sUstAInABLe PRoteCteD AReA toURIsM to BeneFIt LoCAL eConoMIes
The COVID-19 pandemic has led to a global recession,
while at the same time, biodiversity loss poses a growing
jeopardy to the biosphere. In the wake of the pandemic, the
tourism and conservation sectors have suffered setbacks,
with tourism dwindling worldwide, and the funding deficit for
conservation growing ever larger. In this context, the question
was posed: can countries afford to maintain and expand their
protected area networks under such economic duress, and
while so many development challenges remain intractable?
The report’s answer to this question is ‘yes’ –the promotion of
inclusive, sustainable tourism in protected areas offers a way
for countries to arrest biodiversity loss, assist post-pandemic
recovery, and address longstanding development challenges.
To back this argument, the report quantifies some of the
economic impacts of protected area tourism to show that pro-
tected areas promote conservation and development. From
case studies covering a mix of economies and contexts, the
report draws on survey data and modelling to show how tour-
ism catalyzes expanding patterns of cross-sectoral demand
and supply which support growing shares of employment
among poor and non-poor households. This research con-
cludes that protected area tourism is associated with growing
local economies, job creation, high income multipliers, pover-
ty reduction, and attractive returns on public investment.
While caution is warranted in interpreting results and
over-generalizing findings, protected areas prove to be
valuable economic assets, high-return investments, and a
promising means to protect biodiversity and to recover from
the pandemic via greener development pathways.
To secure these potentials, however, the report recommends
that conservation areas receive formal protection, increased
public and private investment, close monitoring, and capacity
support for managers if their role as ‘engines of develop-
ment’ is to be realized. In addition, and to dilute tourism’s
negative impacts, the report calls for an expanded network
of protected areas to host a diversifying tourist sector which
attracts private investment and strengthens its operations
through concessions and similar instruments. Finally, and in
response to a pandemic which has laid bare the persistence
of global inequalities, the report notes that protected area
neighbors are crucial conservation allies and beneficiaries,
and argues strongly to formalize benefit sharing, strengthen
income multipliers, and manage human-wildlife conflict.
COVID-19 has led to a global recession, reversed devel-
opment gains, crippled the tourism industry, and shrunk
conservation funding in the face of dire threats to the bio-
sphere. In such a context, the conclusions of this report are of
vital importance – they ask that decisionmakers view protect-
ed areas and the tourists who visit them as an opportunity to
act wisely and sustainably in response to these challenges.

References
Acha, Alemayehu, Mathewos Temesgen, and Hans Bauer. 2018. “Human–Wildlife Conflicts and Their
Associated Livelihood Impacts in and Around Chebera-Churchura National Park, Ethiopia.”
Society & Natural Resources 31 (2): 260–75. https://doi.org/10.1080/08941920.2017.134797
4.
Baghai, Mujon, Jennifer R. B. Miller, Lisa J. Blanken, Holly T. Dublin, Kathleen H. Fitzgerald, Patience
Gandiwa, Karen Laurenson, James Milanzi, Alastair Nelson, and Peter Lindsey. 2018.
“Models for the Collaborative Management of Africa’s Protected Areas.” Biological Conservation 218 (February): 73–82. https://doi.org/10.1016/j.biocon.2017.11.025.
Balmford, Andrew, James Beresford, Jonathan Green, Robin Naidoo, Matt Walpole, and Andrea
Manica. 2009. “A Global Perspective on Trends in Nature-Based Tourism.” PLOS Biology 7
(6): e1000144. https://doi.org/10.1371/journal.pbio.1000144.
Balmford, Andrew, Pippa Gravestock, Neal Hockley, Colin J. McClean, and Callum M. Roberts. 2004.
“The Worldwide Costs of Marine Protected Areas.” Proceedings of the National Academy of Sciences 101 (26): 9694–97. https://doi.org/10.1073/pnas.0403239101.
Balmford, Andrew, Jonathan M. H. Green, Michael Anderson, James Beresford, Charles Huang,
Robin Naidoo, Matt Walpole, and Andrea Manica. 2015. “Walk on the Wild Side: Estimating
the Global Magnitude of Visits to Protected Areas.” PLOS Biology 13 (2): e1002074. https://
doi.org/10.1371/journal.pbio.1002074.
Ban, Natalie C., Georgina Grace Gurney, Nadine A. Marshall, Charlotte K. Whitney, Morena Mills,
Stefan Gelcich, Nathan J. Bennett, et al. 2019. “Well-Being Outcomes of Marine Protected
Areas.” Nature Sustainability 2 (6): 524–32. https://doi.org/10.1038/s41893-019-0306-2.
Barlow, Jos, Filipe França, Toby A. Gardner, Christina C. Hicks, Gareth D. Lennox, Erika Berenguer,
Leandro Castello, et al. 2018. “The Future of Hyperdiverse Tropical Ecosystems.” Nature
559 (7715): 517–26. https://doi.org/10.1038/s41586-018-0301-1.
Barnosky, Anthony D., Nicholas Matzke, Susumu Tomiya, Guinevere O. U. Wogan, Brian Swartz,
Tiago B. Quental, Charles Marshall, et al. 2011. “Has the Earth’s Sixth Mass Extinction
Already Arrived?” Nature 471 (7336): 51–57. https://doi.org/10.1038/nature09678.
Batini, Nicoletta, Mario Di Serio, Matteo Fragetta, Giovanni Melina, and Anthony Waldron.
2021. “Building Back Better: How Big Are Green Spending Multipliers?” IMF Working
Paper WP/21/87. International Monetary Fund. https://www.imf.org/en/Publications/WP/
Issues/2021/03/19/Building-Back-Better-How-Big-Are-Green-Spending-Multipliers-50264.
Benítez-López, Ana, Rob Alkemade, and Pita A. Verweij. 2010. “The Impacts of Roads and Other
Infrastructure on Mammal and Bird Populations: A Meta-Analysis.” Biological Conservation
143 (6): 1307–16. https://doi.org/10.1016/j.biocon.2010.02.009.
Bergseth, Brock J., Georgina G. Gurney, Michele L. Barnes, Adrian Arias, and Joshua E. Cinner.
2018. “Addressing Poaching in Marine Protected Areas through Voluntary Surveillance and
Enforcement.” Nature Sustainability 1 (8): 421–26. https://doi.org/10.1038/s41893-018-0117-x.
Börner, Jan, Kathy Baylis, Esteve Corbera, Driss Ezzine-de-Blas, Jordi Honey-Rosés, U. Martin
Persson, and Sven Wunder. 2017. “The Effectiveness of Payments for Environmental
Services.” World Development 96 (August): 359–74. https://doi.org/10.1016/j.
worlddev.2017.03.020.
Bovarnick, Andrew, Jaime Fernandez-Baca, Jose Galindo, and Helen Negret. 2010. “Financial
Sustainability of Protected Areas in Latin America and the Caribbean: Investment Policy
Guidance.” United Nations Development Programme (UNDP) and The Nature Conservancy
(TNC). https://www.cbd.int/financial/finplanning/g-planscorelatin-undp.pdf
Buckley, Ralf. 2004. Environmental impacts of ecotourism. https://portals.iucn.org/library/node/27855
Buckley, Ralf. 2010. Conservation Tourism. https://www.cabi.org/bookshop/book/9781845936655/
Burke, Lauretta, Katie Reytar, Mark Spalding, and Allison Perry. 2011. Reefs at Risk Revisited. https://
www.wri.org/publication/reefs-risk-revisited.
CBD. 2018. Decision Adopted by the Conference of the Parties to the Convention on Biological
Diversity: 14/8 Protected areas and other effective area-based conservation measures.
CBD/COP/DEC/14/8. Sharm El-Sheikh, Egypt. https://www.cbd.int/doc/decisions/cop-14/cop-
14-dec-08-en.pdf
CBD. 2019. “Biodiversity Year in Review.” Convention on Biological Diversity. 2019. https://www.cbd.
int/article/2019-12-20-16-57-49.
Ceballos, Gerardo, Paul R. Ehrlich, and Peter H. Raven. 2020. “Vertebrates on the Brink as Indicators
of Biological Annihilation and the Sixth Mass Extinction.” Proceedings of the National Academy of Sciences 117 (24): 13596–602. https://doi.org/10.1073/pnas.1922686117.
Chidakel, Alexander, Brian Child, and Shylock Muyengwa. 2021. “Evaluating the Economics of Park-
Tourism from the Ground-up: Leakage, Multiplier Effects, and the Enabling Environment at
South Luangwa National Park, Zambia.” Ecological Economics 182 (April): 106960. https://
doi.org/10.1016/j.ecolecon.2021.106960.
Chikuba, Zai, Malunga Syacumpi, and James Thurlow. 2013. “A 2007 Social Accounting Matrix (SAM)
for Zambia.” Lusaka, Zambia; and Washington, D.C.: Zambia Institute for Policy Analysis
and Research; and International Food Policy Research Institute (IFPRI). https://www.ifpri.org/
publication/2007-social-accounting-matrix-sam-zambia.
Coad, Lauren, James E.M. Watson, Jonas Geldmann, Neil D. Burgess, Fiona Leverington, Marc
Hockings, Kathryn Knights, and Moreno Di Marco. 2019. “Widespread Shortfalls in
Protected Area Resourcing Undermine Efforts to Conserve Biodiversity.” Frontiers in Ecology and the Environment 17 (5): 259–64.
Conservation International. 2008. A practical guide to good practice for marine-based tours. http://
cpps.dyndns.info/cpps-docs-web/planaccion/docs2011/oct/turismo_biodiv/Doc.18.Best-
practice-tourism-galapagos.pdf
Cullinane Thomas, Catherine, and Lynne. Koontz. 2020. “2019 National Park Visitor Spending
Effects: Economic Contributions to Local Communities, States, and the Nation. Natural
Resource Report.” NPS/NRSS/EQD/NRR—2020/2110. Fort Collins, Colorado: National Park
Service. https://www.nps.gov/subjects/socialscience/vse.htm.
Damania, Richard, Sebastien Desbureaux, Pasquale Lucio Scandizzo, Mehdi Mikou, Deepali Gohil,
and Mohammed Said. 2019. “When Good Conservation Becomes Good Economics :
Kenya’s Vanishing Herds.” Washington D.C.: World Bank. https://openknowledge.world-
bank.org/handle/10986/33083.
Deloitte. 2017. “At What Price? The Economic, Social and Icon Value of the Great Barrier Reef.”
Brisbane, Australia: Deloitte Australia.

den Braber, Bowy, Karl L. Evans, and Johan A. Oldekop. 2018. “Impact of Protected Areas on
Poverty, Extreme Poverty, and Inequality in Nepal.” Conservation Letters 11 (6): e12576.
https://doi.org/10.1111/conl.12576.
Deutz, Andrew, Geoffrey M. Heal, Rose Niu, Eric Swanson, Terry Townshend, Zhu Li, Alejandro
Delmar, Alqayam Meghji, Suresh A. Sethi, and John Tobin-de la Puente. 2020. “Financing
Nature: Closing the Global Biodiversity Financing Gap.” The Paulson Institute, The
Nature Conservancy, and the Cornell Atkinson Center for Sustainability. https://www.
paulsoninstitute.org/wp-content/uploads/2020/09/FINANCING-NATURE_Full-Report_Final-
Version_091520.pdf.
Dickman, Amy J., Ewan A. Macdonald, and David W. Macdonald. 2011. “A Review of Financial
Instruments to Pay for Predator Conservation and Encourage Human–Carnivore
Coexistence.” Proceedings of the National Academy of Sciences 108 (34): 13937–44.
https://doi.org/10.1073/pnas.1012972108.
Dixon, Peter, and Dale Jorgenson. 2012. “Handbook of Computable General Equilibrium Modeling.”
Handbook of Computable General Equilibrium Modeling. Elsevier. https://econpapers.
repec.org/bookchap/eeehacgem/1.htm.
Doinjashvili, Pikria, Philippe Méral, and Fano Andriamahefazafy. 2020. “Sustaining Protected
Areas through Conservation Trust Funds: A Review.” International Journal of Sustainable Development & World Ecology 0 (0): 1–10. https://doi.org/10.1080/13504509.2020.1762257.
Dudley, Nigel, Holly Jonas, Fred Nelson, Jeffrey Parrish, Aili Pyhälä, Sue Stolton, and James E. M.
Watson. 2018. “The Essential Role of Other Effective Area-Based Conservation Measures
in Achieving Big Bold Conservation Targets.” Global Ecology and Conservation 15 (July):
e00424. https://doi.org/10.1016/j.gecco.2018.e00424.
Dudley, Nigel, and Sue Stolton. 2003. Running Pure : The Importance of Forest Protected Areas to Drinking Water. World Bank/WWF Alliance for Forest Conservation and Sustainable Use.
https://openknowledge.worldbank.org/handle/10986/15006.
Duraiappah, Anantha Kumar, Shahid Naeem, Tundi Agardy, Neville J. Ash, H. David Cooper, Sandra
Diaz, Daniel P. Faith, et al. 2005. “Ecosystems and Human Well-Being: Biodiversity
Synthesis; a Report of the Millennium Ecosystem Assessment.” https://experts.umn.edu/en/
publications/ecosystems-and-human-well-being-biodiversity-synthesis-a-report-o.
Edgar, Graham J., Rick D. Stuart-Smith, Trevor J. Willis, Stuart Kininmonth, Susan C. Baker, Stuart
Banks, Neville S. Barrett, et al. 2014. “Global Conservation Outcomes Depend on
Marine Protected Areas with Five Key Features.” Nature 506 (7487): 216–20. https://doi.
org/10.1038/nature13022.
FAO. 2019. “Illegal, Unreported and Unregulated (IUU) Fishing.” Food and Agriculture Organization
of the United Nations. 2019. http://www.fao.org/iuu-fishing/en/.
———. 2020. The State of World Fisheries and Aquaculture 2020. FAO. https://doi.org/10.4060/
ca9229en.
FAO and UNEP. 2020. “The State of the World’s Forests 2020.” Rome: FAO and UNEP. https://doi.
org/10.4060/CA8642EN.
Ferraro, Paul J., Merlin M. Hanauer, and Katharine R. E. Sims. 2011. “Conditions Associated with
Protected Area Success in Conservation and Poverty Reduction.” Proceedings of the National Academy of Sciences 108 (34): 13913–18. https://doi.org/10.1073/pnas.1011529108.

Fiji Bureau of Statistics. 2017. Population and Housing Census.
Geldmann, Jonas, Megan Barnes, Lauren Coad, Ian D. Craigie, Marc Hockings, and Neil D.
Burgess. 2013. “Effectiveness of Terrestrial Protected Areas in Reducing Habitat Loss and
Population Declines.” Biological Conservation 161 (May): 230–38. https://doi.org/10.1016/j.
biocon.2013.02.018.
Geldmann, Jonas, Andrea Manica, Neil D. Burgess, Lauren Coad, and Andrew Balmford. 2019.
“A Global-Level Assessment of the Effectiveness of Protected Areas at Resisting
Anthropogenic Pressures.” Proceedings of the National Academy of Sciences 116 (46):
23209–15. https://doi.org/10.1073/pnas.1908221116.
Gibb, Rory, David W. Redding, Kai Qing Chin, Christl A. Donnelly, Tim M. Blackburn, Tim Newbold,
and Kate E. Jones. 2020. “Zoonotic Host Diversity Increases in Human-Dominated
Ecosystems.” Nature 584 (7821): 398–402. https://doi.org/10.1038/s41586-020-2562-8.
Gill, David A., Michael B. Mascia, Gabby N. Ahmadia, Louise Glew, Sarah E. Lester, Megan Barnes,
Ian Craigie, et al. 2017. “Capacity Shortfalls Hinder the Performance of Marine Protected
Areas Globally.” Nature 543 (7647): 665–69. https://doi.org/10.1038/nature21708.
Halpern, Benjamin S., Melanie Frazier, John Potapenko, Kenneth S. Casey, Kellee Koenig, Catherine
Longo, Julia Stewart Lowndes, et al. 2015. “Spatial and Temporal Changes in Cumulative
Human Impacts on the World’s Ocean.” Nature Communications 6 (1): 7615. https://doi.
org/10.1038/ncomms8615.
Hill, Catherine, Ferrel Osborn, and Andrew Plumptre. 2002. Human-Wildlife Conflict: Identifying the Problem and Possible Solutions. Albertine Rift Technical Reports Series. Vol. 1.
Hockings, Marc. 2006. Evaluating Effectiveness: A Framework for Assessing Management Effectiveness of Protected Areas. IUCN.
Hockings, Marc, Nigel Dudley, and Wendy Elliott. 2020. “Editorial Essay: COVID-19 and Protected
and Conserved Areas.” PARKS, no. 26.1 (June): 7–24. https://doi.org/10.2305/IUCN.
CH.2020.PARKS-26-1MH.en.
IMF. 2020. “Regional Economic Outlook. Sub-Saharan Africa: A Difficult Road to Recovery.” ISBN
9781513557601. Washington, DC: International Monetary Fund. https://www.imf.org/-/media/
Files/Publications/REO/AFR/2020/October/English/text.ashx.
Inskip, Chloe, and Alexandra Zimmermann. 2009. “Human-Felid Conflict: A Review of Patterns and
Priorities Worldwide.” Oryx 43 (1): 18–34. https://doi.org/10.1017/S003060530899030X.
Interagency Visitor Use Management Council. 2016. Visitor Use Management Framework: A Guide
to Providing Sustainable Outdoor Recreation. https://visitorusemanagement.nps.gov/con-
tent/documents/lowres_VUM%20Framework_Edition%201_IVUMC.pdf
Interagency Visitor Use Management Council. 2019. Visitor Capacity Guidebook: Managing
the Amounts and Types of Visitor Use to Achieve Desired Conditions. https://
visitorusemanagement.nps.gov/Content/documents/IVUMC_Visitor_Capacity_Guidebook_
newFINAL_highres.pdf
IPBES. 2019. Global Assessment Report on Biodiversity and Ecosystem Services of the Intergovernmental Science-Policy Platform on Biodiversity and Ecosystem Services. Edited
by E. S. Brondizio, J. Settele, S. Díaz, and H. T. Ngo. Bonn, Germany: IPBES Secretariat.
https://ipbes.net/global-assessment.

IPCC, 2019. “IPCC Special Report on the Ocean and Cryosphere in a Changing Climate.”
Intergovernmental Panel on Climate Change. https://www.ipcc.ch/srocc/.
IUCN ESARO. 2020. “Closing the Gap. The Financing and Resourcing of Protected and Conserved
Areas in Eastern and Southern Africa.” Nairobi, Kenya: IUCN ESARO; BIOPAMA. https://por-
tals.iucn.org/library/node/49045.
Jambeck, Jenna R., Roland Geyer, Chris Wilcox, Theodore R. Siegler, Miriam Perryman, Anthony
Andrady, Ramani Narayan, and Kara Lavender Law. 2015. “Plastic Waste Inputs from Land
into the Ocean.” Science 347 (6223): 768–71. https://doi.org/10.1126/science.1260352.
Jones, Kendall R., Oscar Venter, Richard A. Fuller, James R. Allan, Sean L. Maxwell, Pablo Jose
Negret, and James E. M. Watson. 2018. “One-Third of Global Protected Land Is under
Intense Human Pressure.” Science 360 (6390): 788–91. https://doi.org/10.1126/science.
aap9565.
Leisher, Craig, P.J.H. Van Beukering, and Lea Scherl. 2007. “Nature’s Investment Bank. Marine
Protected Areas Contribute to Poverty Reduction.” The Nature Conservancy, January.
Leung, Yu-Fai, Anna Spenceley, Glen Hvenegaard, and Ralf Buckley (eds.). 2018. “Tourism and
Visitor Management in Protected Areas: Guidelines for Sustainability.” Gland. https://www.
sprep.org/attachments/VirLib/Global/tourism-protected-areas.pdf.
Leverington, Fiona, Katia Lemos Costa, Helena Pavese, Allan Lisle, and Marc Hockings. 2010.
“A Global Analysis of Protected Area Management Effectiveness.” Environmental Management 46 (5): 685–98. https://doi.org/10.1007/s00267-010-9564-5.
Lindsey, P., M. Baghai, G. Bigurube, S. Cunliffe, A. Dickman, K. Fitzgerald, M. Flyman, et al. 2021.
“Attracting Investment for Africa’s Protected Areas by Creating Enabling Environments for
Collaborative Management Partnerships.” Biological Conservation 255 (March): 108979.
https://doi.org/10.1016/j.biocon.2021.108979.
Lindsey, Peter A., Jennifer R. B. Miller, Lisanne S. Petracca, Lauren Coad, Amy J. Dickman, Kathleen
H. Fitzgerald, Michael V. Flyman, et al. 2018. “More than $1 Billion Needed Annually to
Secure Africa’s Protected Areas with Lions.” Proceedings of the National Academy of Sciences 115 (45): E10788. https://doi.org/10.1073/pnas.1805048115.
Lindsey, Peter, James Allan, Peadar Brehony, Amy Dickman, Ashley Robson, Colleen Begg, Hasita
Bhammar, et al. 2020. “Conserving Africa’s Wildlife and Wildlands through the COVID-19
Crisis and Beyond.” Nature Ecology & Evolution 4 (10): 1300–1310. https://doi.org/10.1038/
s41559-020-1275-6.
Mackenzie, Catrina A., and Peter Ahabyona. 2012. “Elephants in the Garden: Financial and Social
Costs of Crop Raiding.” Ecological Economics 75 (March): 72–82. https://doi.org/10.1016/j.
ecolecon.2011.12.018.
Maekawa, Miko, Annette Lanjouw, Eugène Rutagarama, and Douglas Sharp. 2013. “Mountain Gorilla
Tourism Generating Wealth and Peace in Post-Conflict Rwanda.” Natural Resources Forum
37 (2): 127–37. https://doi.org/10.1111/1477-8947.12020.
Mascia, Michael B., and Sharon Pailler. 2011. “Protected Area Downgrading, Downsizing, and
Degazettement (PADDD) and Its Conservation Implications.” Conservation Letters 4 (1):
9–20. https://doi.org/10.1111/j.1755-263X.2010.00147.x.

Maxwell, S. L., Cazalis, V., Dudley, N., Hoffmann, M., Rodrigues, A. S. L., Stolton, S., Visconti, P.,
Woodley, S., Kingston, N., Lewis, E., Maron, M., Strassburg, B. B. N., Wenger, A., Jonas, H.
D., Venter, O., & Watson, J. E. M. 2020. Area-based conservation in the twenty-first century.
Nature, 586 (7828), 217–227. https://doi.org/10.1038/s41586-020-2773-z.
McCarthy, Donal P, Paul F Donald, Jörn PW Scharlemann, Graeme M Buchanan, Andrew Balmford,
Jonathan MH Green, Leon A Bennun, Neil D Burgess, Lincoln DC Fishpool, and Stephen
T Garnett. 2012. “Financial Costs of Meeting Global Biodiversity Conservation Targets:
Current Spending and Unmet Needs.” Science 338 (6109): 946–49.
Melillo, Jerry M., Xiaoliang Lu, David W. Kicklighter, John M. Reilly, Yongxia Cai, and Andrei P.
Sokolov. 2016. “Protected Areas’ Role in Climate-Change Mitigation.” Ambio 45 (2): 133–45.
https://doi.org/10.1007/s13280-015-0693-1.
Ministry of Tourism and Arts, Republic of Zambia. 2018. “Zambia Tourism Master Plan 2018-2038.”
https://www.mota.gov.zm/wp-content/uploads/2020/03/Zambia-Tourism-Master-Plan.pdf.
Mitchell, Jonathan, and Caroline Ashley. 2009. “Tourism and Poverty Reduction: Pathways to
Prosperity.” Tourism and Poverty Reduction: Pathways to Prosperity, December, 1–157.
https://doi.org/10.4324/9781849774635.
Mtui, Elibariki. 2007. “Towards Initiating and Implementing Incentives for Pro-Poor Tourism in
Tanzania.” In Tourism and Development: Agendas for Action, 85–110. Nairobi, Kenya:
SNV East & Southern Africa. https://land.igad.int/index.php/documents-1/countries/kenya/
investment-3/669-tourism-and-development/file.
Munanura, Ian E., Kenneth F. Backman, Jeffrey C. Hallo, and Robert B. Powell. 2016. “Perceptions
of Tourism Revenue Sharing Impacts on Volcanoes National Park, Rwanda: A Sustainable
Livelihoods Framework.” Journal of Sustainable Tourism 24 (12): 1709–26. https://doi.org/10.
1080/09669582.2016.1145228.
Naidoo, R., D. Gerkey, D. Hole, A. Pfaff, A. M. Ellis, C. D. Golden, D. Herrera, et al. 2019. “Evaluating
the Impacts of Protected Areas on Human Well-Being across the Developing World.”
Science Advances 5 (4): eaav3006. https://doi.org/10.1126/sciadv.aav3006.
National Park Service, U.S. Department of the Interior. 2016. Congestion Management Toolkit. https://
parkplanning.nps.gov/showFile.cfm?projectID=97506&MIMEType=application%252Fpdf&-
filename=NPS%5FCMS%5FToolkit%2Epdf&sfid=440147.
Newbold, Tim. 2018. “Future Effects of Climate and Land-Use Change on Terrestrial Vertebrate
Community Diversity under Different Scenarios.” Proceedings. Biological Sciences 285
(1881). https://doi.org/10.1098/rspb.2018.0792.
Newbold, Tim, Lawrence N. Hudson, Helen R. P. Phillips, Samantha L. L. Hill, Sara Contu, Igor
Lysenko, Abigayil Blandon, et al. 2014. “A Global Model of the Response of Tropical and
Sub-Tropical Forest Biodiversity to Anthropogenic Pressures.” Proceedings of the Royal Society B: Biological Sciences 281 (1792): 20141371. https://doi.org/10.1098/rspb.2014.1371.
Newsome, David, and Michael Hughes. 2018. “The Contemporary Conservation Reserve Visitor
Phenomenon!” Biodiversity and Conservation 27 (2): 521–29. https://doi.org/10.1007/
s10531-017-1435-4.
OECD. 2016. The Ocean Economy in 2030. https://doi.org/10.1787/9789264251724-en.

Oldekop, J. A., G. Holmes, W. E. Harris, and K. L. Evans. 2016. “A global assessment of the social and
conservation outcomes of protected areas.” Conservation Biology 30 (1): 133–41. https://doi.
org/10.1111/cobi.12568.
Parks Canada Agency, Government of Canada. 2019. “Economic Impact of Parks Canada -
Parks Canada Agency.” June 3, 2019. https://www.pc.gc.ca/en/agence-agency/bib-lib/
rapports-reports/econo2011.
Pirlea, A.F., U. Serajuddin, D. Wadhwa, M. Welch, and A. Whitby. 2020. “Atlas of the Sustainable
Development Goals 2020: From World Development Indicators.” 2020. https://datatopics.
worldbank.org/sdgatlas/.
Raven, Peter H., Roy E. Gereau, Peter B. Phillipson, Cyrille Chatelain, Clinton N. Jenkins, and Carmen
Ulloa Ulloa. 2020. “The Distribution of Biodiversity Richness in the Tropics.” Science Advances 6 (37): eabc6228. https://doi.org/10.1126/sciadv.abc6228.
Reaser, Jamie, Brooklin E. Hunt, Manuel Ruiz-Aravena, Gary M. Tabor, Jonathan A. Patz, Daniel
Becker, Harvey Locke, Peter Hudson, and Raina Plowright. 2020. “Reducing Land Use-
Induced Spillover Risk by Fostering Landscape Immunity: Policy Priorities for Conservation
Practitioners.” EcoEvoRxiv. https://doi.org/10.32942/osf.io/7gd6a.
Reaser, Jamie, Gary M. Tabor, Daniel J. Becker, Philip Muruthi, Arne Witt, Stephen J. Woodley, Manuel
Ruiz-Aravena, Jonathan Alan Patz, Valerie Hickey, and Peter J. Hudson. 2020. “Land Use-
Induced Spillover: Priority Actions for Protected and Conserved Area Managers.”
Roberts, Callum M., Bethan C. O’Leary, Douglas J. McCauley, Philippe Maurice Cury, Carlos M.
Duarte, Jane Lubchenco, Daniel Pauly, et al. 2017. “Marine Reserves Can Mitigate and
Promote Adaptation to Climate Change.” Proceedings of the National Academy of Sciences 114 (24): 6167–75. https://doi.org/10.1073/pnas.1701262114.
Rylance, Andrew, and Anna Spenceley. 2017. “Reducing Economic Leakages from Tourism: A Value
Chain Assessment of the Tourism Industry in Kasane, Botswana.” Development Southern Africa 34 (3): 295–313. https://doi.org/10.1080/0376835X.2017.1308855.
Sandbrook, Chris G. 2010. “Putting Leakage in Its Place: The Significance of Retained Tourism
Revenue in the Local Context in Rural Uganda.” Journal of International Development 22
(1): 124–36. https://doi.org/10.1002/jid.1507.
Scholes, Robert, and Reinette Biggs. 2004. “Ecosystem Services in Southern Africa: A Regional
Assessment,” January.
Singh, Inderjit, Lyn Squire, and John Strauss. 1986. Agricultural Household Models : Extensions, Applications, and Policy. World Bank. https://documents1.worldbank.org/curated/
pt/621291468739297175/pdf/multi-page.pdf
Snyman, Susan, and Kelly S. Bricker. 2019. “Living on the Edge: Benefit-Sharing from Protected Area
Tourism.” Journal of Sustainable Tourism 27 (6): 705–19. https://doi.org/10.1080/09669582.
2019.1615496.
Snyman, Susan, Daudi Sumba, Francis Vorhies, Elizabeth Gitari, Christina Ender, Albert Ahenkan,
Aurelie Flore Koumba Pambo, and N Bengone. 2021. “The State of the Wildlife Economy in
Africa.” Kigali, Rwanda: African Leadership University School of Wildlife Conservation.
https://sowc.alueducation.com/
state-wildlife-economy-africa-report-south-africa-country-case-study-published-2/.

Spalding, Mark, Lauretta Burke, Spencer A. Wood, Joscelyne Ashpole, James Hutchison, and Philine
zu Ermgassen. 2017. “Mapping the Global Value and Distribution of Coral Reef Tourism.”
Marine Policy 82 (August): 104–13. https://doi.org/10.1016/j.marpol.2017.05.014.
Spenceley, Anna, Susan Snyman, and Paul Eagles. 2017. Guidelines for Tourism Partnerships and Concessions for Protected Areas: Generating Sustainable Revenues for Conservation and Development. Report to the Secretariat of the Convention on Biological Diversity and IUCN. https://www.cbd.int/tourism/doc/tourism-partnerships-protected-areas-web.pdf.
Spenceley, Anna, Susan Snyman, and Andrew Rylance. 2019. “Revenue Sharing from Tourism in
Terrestrial African Protected Areas.” Journal of Sustainable Tourism 27 (6): 720–34. https://
doi.org/10.1080/09669582.2017.1401632.
Taylor, J. Edward, and Mateusz J. Filipski. 2014. Beyond Experiments in Development Economics: Local Economy-Wide Impact Evaluation. Oxford, New York: Oxford University Press.
Taylor, J. Edward, Jared Hardner, and Micki Stewart. 2009. “Ecotourism and Economic Growth
in the Galapagos: An Island Economy-Wide Analysis*.” Environment and Development Economics 14 (2): 139–62. https://doi.org/10.1017/S1355770X08004646.
Tesfaw, Anteneh T., Alexander Pfaff, Rachel E. Golden Kroner, Siyu Qin, Rodrigo Medeiros, and
Michael B. Mascia. 2018. “Land-Use and Land-Cover Change Shape the Sustainability and
Impacts of Protected Areas.” Proceedings of the National Academy of Sciences 115 (9):
2084–89. https://doi.org/10.1073/pnas.1716462115.
The White House. 2021. “FACT SHEET: President Biden Takes Executive Actions to Tackle the
Climate Crisis at Home and Abroad, Create Jobs, and Restore Scientific Integrity Across
Federal Government.” The White House. January 27, 2021. https://www.whitehouse.gov/
briefing-room/statements-releases/2021/01/27/fact-sheet-president-biden-takes-executive-
actions-to-tackle-the-climate-crisis-at-home-and-abroad-create-jobs-and-restore-scientific-
integrity-across-federal-government/.
Thirgood, Simon, Rosie Woodroffe, and Alan Rabinowitz. 2005. “The Impact of Human–Wildlife
Conflict on Human Lives and Livelihoods.” In People and Wildlife, Conflict or Co-Existence?, edited by Alan Rabinowitz, Rosie Woodroffe, and Simon Thirgood, 13–26.
Conservation Biology. Cambridge: Cambridge University Press. https://doi.org/10.1017/
CBO9780511614774.003.
Tourism Industry Association of Canada, Canadian Tourism Commission and Parks Canada. 2008.
Green your Business: Toolkit for Tourism Operators. https://tiac-aitc.ca/_Library/documents/
green_your_business_toolkit.pdf.
Thompson, A., P.J. Massyn, J. Pendry, and J. Pastorelli. 2014. “Tourism Concessions in Protected
Natural Areas: Guidelines for Managers.” United Nations Development Programme.
Twining-Ward, Louise, Wendy Li, Hasita Bhammar, and Elisson Wright. 2018. Supporting Sustainable Livelihoods through Wildlife Tourism. World Bank, Washington, DC. https://doi.
org/10.1596/29417.
UNDP. n.d. “Goal 14: Life below Water.” UNDP. Accessed June 9, 2021. https://www1.undp.org/
content/singapore-global-centre/en/home/sustainable-development-goals/goal-14-life-be-
low-water.html.
UNEP-WCMC and IUCN. 2020. “Protected Planet: The World Database on Protected Areas (WDPA).”
Protected Planet Digital Report. 2020. www.protectedplanet.net.

UNODC. 2020. “World Wildlife Crime Report 2020: Trafficking in Protected Species.”
Verdugo, Dominique. 2007. “An Analysis of Government Incentives for Increasing the Local
Economic Impacts of Tourism in Rwanda.” In Tourism and Development: Agendas for Action, 57–84. Nairobi, Kenya: SNV East & Southern Africa. https://land.igad.int/index.php/
documents-1/countries/kenya/investment-3/669-tourism-and-development/file.
Wake, David B., and Vance T. Vredenburg. 2008. “Are We in the Midst of the Sixth Mass Extinction?
A View from the World of Amphibians.” Proceedings of the National Academy of Sciences
105 (Supplement 1): 11466–73. https://doi.org/10.1073/pnas.0801921105.
Waldron, Anthony, Vanessa Adams, James Allan, Andy Arnell, Juliano Palacios Abrantes, Scott
Atkinson, A. Baccini, et al. 2020. “Protecting 30 Percent of the Planet: Costs, Benefits and
Economic Implications.” https://doi.org/10.13140/RG.2.2.19950.64327.
Waldron, Anthony, Daniel C Miller, Dave Redding, Arne Mooers, Tyler S Kuhn, Nate Nibbelink, J
Timmons Roberts, Joseph A Tobias, and John L Gittleman. 2017. “Reductions in Global
Biodiversity Loss Predicted from Conservation Spending.” Nature 551 (7680): 364–67.
Waldron, Anthony, Arne O Mooers, Daniel C Miller, Nate Nibbelink, David Redding, Tyler S Kuhn, J
Timmons Roberts, and John L Gittleman. 2013. “Targeting Global Conservation Funding to
Limit Immediate Biodiversity Declines.” Proceedings of the National Academy of Sciences
110 (29): 12144–48.
Wang, Sonam, and David Macdonald. 2006. “Livestock Predation by Carnivores in Jigme Singye
Wangchuck National Park, Bhutan.” Biological Conservation 129 (May): 558–65. https://doi.
org/10.1016/j.biocon.2005.11.024.
Watson, James E. M., Nigel Dudley, Daniel B. Segan, and Marc Hockings. 2014. “The Performance
and Potential of Protected Areas.” Nature 515 (7525): 67–73. https://doi.org/10.1038/
nature13947.
WEF. 2019a. “Country Profiles.” Travel and Tourism Competitiveness Index 2019 edition. https://wef.
ch/30jMj2Q.
———. 2019b. “The Travel & Tourism Competitiveness Report 2019.” https://www.weforum.org/
reports/the-travel-tourism-competitiveness-report-2019.
Weru, James. 2007. “Government Incentives for Boosting Impacts on Pro-Poor Tourism in
Kenya.” In Tourism and Development: Agendas for Action, 15–32. Nairobi, Kenya: SNV
East & Southern Africa. https://land.igad.int/index.php/documents-1/countries/kenya/
investment-3/669-tourism-and-development/file.
Withers, Oliver, and Tenke Zoltani. 2020. “Chapter 37 - Leveraging Support for Pangolin
Conservation and the Potential of Innovative Finance.” In Pangolins, edited by Daniel
W. S. Challender, Helen C. Nash, and Carly Waterman, 579–95. Biodiversity of World:
Conservation from Genes to Landscapes. Academic Press. https://doi.org/10.1016/
B978-0-12-815507-3.00037-X.
Woodroffe, Rosie, Peter Lindsey, Stephanie Romañach, Andrew Stein, and Symon M. K. ole
Ranah. 2005. “Livestock Predation by Endangered African Wild Dogs (Lycaon Pictus)
in Northern Kenya.” Biological Conservation 124 (2): 225–34. https://doi.org/10.1016/j.
biocon.2005.01.028.
World Bank. 2007. “Zambia: Economic and Poverty Impact of Nature-Based Tourism.” Washington,
D.C.: World Bank. https://openknowledge.worldbank.org/handle/10986/7553.
———. 2016a. “Analysis of International Funding to Tackle Illegal Wildlife Trade.” 2016. http://appso-
lutelydigital.com/WildLife/chapter3.html.
———. 2016b. “Why Forests Are Key to Climate, Water, Health, and Livelihoods.” Text/
HTML. World Bank. 2016. https://www.worldbank.org/en/news/feature/2016/03/18/
why-forests-are-key-to-climate-water-health-and-livelihoods.
———. 2018. “Poverty Data.” 2018. https://data.worldbank.org/topic/11.
———. 2019a. “Illegal Logging, Fishing, and Wildlife Trade : The Costs and How to Combat
It.” Washington D.C.: World Bank. https://openknowledge.worldbank.org/han-
dle/10986/32806#:~:text=Illegal%20wildlife%20trade%20directly%20causes,the%20
deterioration%20of%20ecosystem%20functions.&text=The%20national%20risk%20
assessment%20tools,and%20other%20natural%20resources%20crimes.
———. 2019b. “Statistical and Economic Analysis of Uganda’s Tourism Expenditure and Motivation
Survey 2019.” Washington D.C.: World Bank. https://openknowledge.worldbank.org/
handle/10986/34754.
———. 2020a. “Mobilizing Private Finance for Nature.” Washington, D.C.: World Bank Group. http://pub-
docs.worldbank.org/en/916781601304630850/Finance-for-Nature-28-Sep-web-version.pdf.
———. 2020b. “Sustainable Tourism Development in Nepal.” Washington D.C.: World Bank.
———. 2020c. “Tools and Resources for Nature-Based Tourism.” Report. World Bank, Washington,
DC. https://openknowledge.worldbank.org/handle/10986/34433.
———. forthcoming. “The Changing Wealth of Nations 2021: Managing Assets for the Future.”
Washington D.C.: World Bank.
WTTC. 2019a. “The Economic Impact of Global Wildlife Tourism.” https://wttc.org/Portals/0/
Documents/Reports/2019/Sustainable%20Growth-Economic%20Impact%20of%20
Global%20Wildlife%20Tourism-Aug%202019.pdf?ver=2021-02-25-182802-167.
———. 2019b. “Travel and Tourism Performance, 2019.” 2019. https://wttc.org/Research/
Economic-Impact.
———. 2020. “Fiji 2020 Annual Research: Key Highlights.” London: World Travel & Tourism Council.
https://wttc.org/Research/Economic-Impact.
WWF. 2018. Living Planet Report - 2018: Aiming Higher. Edited by M. Grooten and R.E.A. Almond.
Gland, Switzerland: WWF.
WWF. 2020. “Living Planet Report 2020- Bending the Curve of Biodiversity Loss.” WWF. https://liv-
ingplanet.panda.org/en-us/.

Re
FeR
en
Ce
s
86 BAnKInG on PRoteCteD AReAs