pt astra international tbk laporan... · 2016-08-08 · the material in this presentation has been...
TRANSCRIPT

PT Astra International Tbk1H 2016 - Results Presentation

The material in this presentation has been prepared by PT Astra International Tbk (Astra) and is generalbackground information about Astra activities current as at the date of this presentation and are subject to changewithout prior notice.
This information is given in summary form and does not purport to be complete. Information in this presentation,including forecast financial information, should not be considered as advice or a recommendation to investors orpotential investors in relation to holding, purchasing or selling securities or other financial products or instrumentsand does not take into account your particular investment objectives, financial situation or needs. Before acting onany information you should consider the appropriateness of the information having regard to these matters, anyrelevant offer document and in particular, you should seek independent financial advice.
This presentation may contain forward looking statements including statements regarding our intent, belief orcurrent expectations with respect to Astra businesses and operations, market conditions, results of operation andfinancial condition, capital adequacy, specific provisions and risk management practices. Readers are cautioned notto place undue reliance on these forward looking statements, past performance is not a reliable indication offuture performance. Astra does not undertake any obligation to publicly release the result of any revisions tothese forward looking statements to reflect events or circumstances after the date hereof to reflect the occurrenceof unanticipated events.
We disclaim any responsibility or liability whatsoever arising which may be brought or suffered by any person as aresult of acting in reliance upon the whole or any part of the contents of this report and neither Astra and/or itsaffiliated companies and/or their respective employees and/or agents accepts liability for any errors, omissions,negligent or otherwise, in this report and any inaccuracy herein or omission here from which might otherwisearise.
Disclaimer
2

3
6 months ended 30th June 2016
2016 2015 Change
Net revenue (Rp bn) 88,208 92,505 (5%)
Net income (Rp bn)* 7,116 8,052 (12%)
Net earnings per share (Rp) 176 199 (12%)
As at 30th
June 2016As at 31st
December 2015Change
Shareholders’ funds (Rp bn)** 104,251 102,043 2%
Net asset value per share (Rp)** 2,575 2,521 2%
*Net income is profit attributable to owners of the parent, i.e. Astra International shareholders. ** Shareholders' funds and net asset value per share are based on equity attributable to owners of the parent.The financial results for the six months ended 30th June 2016 and 2015 as well as the financial position as at 30th June 2016 have been prepared in accordance with Indonesian Financial Accounting Standards and are unaudited. The financial position as at 31st December 2015 has been prepared in accordance with Indonesian Financial Accounting Standards and audited in accordance with the auditing standards established by the Indonesian Institute of Certified Public Accountants.
Car unit sales up 4%& Motorcycle unit
sales up 1%
Lower volumes in heavy equipment and
mining
Significant increase in loan loss provisions at
PermataBank
HighlightsNet earnings per share down by
12% at Rp176/share

Business Structure
Automobile•Toyota• Daihatsu• Isuzu• BMW• Peugeot• UD Trucks
Component
Other
Motorcycle•Honda
Component•Astra Otoparts
Others•Astraworld
Automotive
Automobile•Astra Credit
Companies•Toyota Astra
Finance
Motorcycle• Federal
InternationalFinance
Financial Services
Heavy Equipment • SAN Finance• Komatsu Astra
Finance
Banking• Bank Permata
Insurance• Asuransi Astra
Buana• Astralife
Heavy Equipment & Mining
Construction Machinery• United Tractors• Traktor Nusantara
Mining Contracting• Pamapersada Nusantara
Coal Mining • Tuah Turangga Agung
Construction Industry• Acset Indonusa
Agribusiness
Palm Oil Plantation• Astra Agro Lestari
Olein Refinery• TanjungSarana Lestari
• Kreasijaya Adhikarya
Commodity Trading• Astra-KLK Pte.Ltd
Infrastructure, Logistics & Others
Toll Road• MMS• MHI• MTN• TMJ• TBS
Logistics• SERA / TRAC• Mobil 88 (used)• SELOG• Toyofuji Logistics
Indonesia
Water Utility• Palyja
Sea Port• Eastkal
Property• Menara Astra• Anandamaya
Residences
Document Solution•Astra Graphia
IT Solution• Astra Graphia Information
Technology
Office Services• Astra Graphia Xprins Indonesia
Information Technology
4

Toyota33%
Daihatsu17%Isuzu
1%
Mitsubishi10%
Suzuki9%
Nissan1%
Honda21%
Others8%
Car
• Astra’s car market share increased from 50% to 51% and Astra’s motorcycle market shareincreased from 67% to 73%.
• Komatsu maintained its leading market position with a 34% market share, down from 38% lastyear.
5
Source : Gaikindo
Honda73%
Yamaha24%
Suzuki1%
Kawasaki2%
Motorcycle
Source : AISI
Source: United Tractors – Internal Market Research
Heavy Equipment
Komatsu 34%
Caterpillar17%
Hitachi 18%
Kobelco15%
Others 16%
Market Position as at 30 June 2016

6
Corporate Actions
Jun ‘16 • Permata Bank completed a rights issue which raised Rp5.5 trillion in order tostrengthen its capital base.
Jun ‘16 • General contractor Acset Indonusa, a 50.1% subsidiary of United Tractors,completed a rights issue raising Rp600 billion to support its business growth.
Jun ‘16 • Astra Agro Lestari completed a Rp4.0 trillion rights issue to strengthen itsbalance sheet.

7
Financial Performances

In Billion Rupiah 1H16 1H15 Change
IDR / USD, average 13,419 13,009 3%
Net Revenue 88,208 92,505 (5%)
Gross Profit 16,847 17,918 (6%)
Selling, General and Administrative Expenses
(9,381) (9,794) (4%)
Other Income (Expense) 695 1,481 (53%)
Shares of Results of Joint Ventures andAssociates
2,071 2,468 (16%)
Income Tax Expenses (1,922) (2,315) (17%)
Non-controlling Interests (1,194) (1,706) (30%)
Net Income 7,116 8,052 (12%)
“The first half challenges of soft commodity prices, weak heavy equipment demand,declines in mining contracting volumes and increases in non-performing loans atPermataBank are likely to persist for the remainder of the year. Nevertheless, steadyperformances are expected from the consumer finance and automotive businesses.”
- Prijono Sugiarto, President Director -
8
Consolidated Income Statement

2001 2014 2015 1H16
Auto (Incl. autorelated Financial Services)
89% 63% 76% 79%
Non-Auto 11% 37% 24% 21%
Share of Net Income (%) Ownership %1H16 1H15
Auto Non-Auto Auto Non-Auto
4W AutomotiveSO – Toyota, Daihatsu, IsuzuToyota Astra MotorAstra Daihatsu MotorIsuzu Astra Motor Indonesia
100513250
31 25
2W AutomotiveAstra Honda MotorHonda SO
50100
21 16
ComponentAstra Otoparts 80 2 2
Financial ServicesAstra Sedaya FinanceFederal International FinanceToyota Astra Financial ServicesKomatsu Astra FinanceSAN FinanceAsuransi Astra BuanaPermata BankAstra Life
86100505060964550
25 (7) 21 5
Heavy Equipment & MiningUnited TractorsPamapersada NusantaraTuah Turangga AgungAcset IndonusaTraktor Nusantara
6060603050
16 25
AgribusinessAstra Agro Lestari 80 9 4
Infrastructure, Logistics, IT & OthersSERAPalyjaMarga MandalasaktiAstra Graphia
100497977
3 2
Astra Portfolio as at 30 June 2016
9

• Astra’s net asset value per share of Rp2,575 at 30 June 2016 was 2% higher than at the end of 2015.
• Net cash, excluding the Group’s financial services subsidiaries, was Rp2.0 trillion, compared to net cashof Rp1.0 trillion at the end of 2015. The Group’s financial services subsidiaries had net debt of Rp44.2trillion, compared to Rp44.6 trillion at the end of 2015.
In Billion Rupiah 30-Jun-16 31-Dec-15 ChangeCash and Cash Equivalents 29,203 27,102 8%
Trade Receivables 18,937 17,776 7%
Inventories 15,477 18,337 (16%)
Financing Receivables 61,629 60,105 3%
Investment in Joint Ventures and Associates 32,075 29,640 8%Fixed Assets 41,588 41,702 0%
Other Assets 50,645 50,773 0%
Total Assets 249,554 245,435 2%
Short-term Borrowings 15,287 11,975 28%
Trade Payables 19,600 20,557 (5%)
Long-term Debt 56,060 58,674 (4%)
Other Liabilities 28,610 27,696 3%
Total Liabilities 119,557 118,902 1%
Equity Attributable to the Owners of The Parent 104,251 102,043 2%
Non – controlling Interest 25,746 24,490 5%
Total Equity 129,997 126,533 3%
Net Debt 42,144 43,547 (3%)
Net Cash (Excl. Financial Services) (2,016) (1,034) 95%
Consolidated Balance Sheet
10

In Billion Rupiah 1H16 1H15 ChangeCash generated from operations 11,013 14,893 (3,880)
Tax Payments (2,684) (3,152) 468
Interest Received 685 695 (10)
Dividend Received 2,366 2,600 (234)
Net Cash flow provided from Operating Activities 11,380 15,036 (3,656)
Net Capex (3,364) (3,969) 605
Net Investment (3,293) (1,312) (1,981)
Other Investing 209 (968) 1,177
Net Cash flow used in Investing Activities (6,448) (6,249) (199)
Net Proceeds of Debt 2,840 (2,861) 5,701
Finance Costs Paid (960) (269) (691)
Dividend Payments (5,539) (7,529) 1,990
Other Financing 1,079 21 1,058
Net Cash flow used in Financing Activities (2,580) (10,638) 8,058
Increase / (Decrease) in Cash 2,352 (1,851) 4,203
Opening Cash Balance (incl. Bank Overdraft) 27,072 20,728 6,344
Exchange Rate Adjustment (571) 1,051 (1,622)
Closing Cash Balance (incl. Bank Overdraft) 28,853 19,928 8,925
Consolidated Cash Flow
11
As at 30 June 2016, Astra’s booked cash surplus of Rp2.4 trillion, with ending consolidatedcash balance (incl. Bank Overdraft) as at 30 June 2016 of Rp29 trillion.

Business Updates
12

1H16 1H15
525,491531,929
Astra’s car sales were 4% higher at 273,000 units, resulting in an increase in market sharefrom 50% to 51%.
Automotive – Wholesale Car Market
13
1%
Source: Gaikindo
Astra 273,46151.4%
Astra 262,77450.0%
Others 258,46848.6%
Others262,71750.0%
4x2 & 4x486.3%
4x2 & 4x479.2%
Commercial12.3%
Commercial 18.8%
Toyota32.9%
Toyota31.1.%
Daihatsu16.8% Daihatsu
16.9%
Isuzu 1.5%
Isuzu 2.0%
Mitsubishi9.6% Mitsubishi
11.5%
Suzuki 9.3%Suzuki 11.9%
Honda 20.6%
Honda 15.5%
Nissan 1.5%
Nissan 3.0%
Others 7.8%
Others 8.1%
Sedan 1.3%
Sedan1.9%
4x2 & 4x4421,17279.2%
4x2 & 4x4369,55670.3%
Commercial103,57819.5%
Commercial145,79427.7%
Sedan 54.7% Sedan 51.2%
4x2 & 4x455.9%
4x2 & 4x456.3%
Commercial 32.5%
Commercial33.9%
M/S1H16
AI Product Segment
Brand Segment AI Product M/S
M/S1H15
AI Product Segment
Brand Segment AI Product M/S
Sedan 1.4% Sedan 2%

BMW M2April 2016
Isuzu Elf NMRMay 2016
Lexus GSF March 2016
Toyota All New FortunerJanuary 2016
Daihatsu Terios Custom February 2016
During first semester 2016, Astra has launched 6 new models and 5 revamped models.
Automotive – Car Product Launches
14

Honda, 2,158,388
72.8%
Honda, 2,131,062
67.1%
Yamaha719,30224.3%
Yamaha, 919,38029.0%
Suzuki, 1.1%
Suzuki, 1.9%Others, 1.8%
Others, 2.0%
Cub190,635
8.8%
Cub190,151
8.9%
Scooter1,795,352
83.2%
Scooter1,837,941
85.2%
Sport/Others8%
Sport/Others4.9%
Cub190,63567.5%
Cub187,32650.4%
Scooter1,795,352
78%
Scooter570,72376.3%
Sport/Others45.3%
Sport/Others26.6%
Cub282,307
9.6%
Cub377,47711.9%
Scooter2,300,402
77.6%
Scooter2,408,664
75.9%
Sport & Others 12.8%
Sport & Others 12.2%
Brand1H16
Honda Segment Honda Product M/S
Segment Brand1H15
Honda Segment Honda Product M/S
Segment
Source: AISI
1H16 1H15
3,174,1622,962,888
Astra Honda Motor’s domestic sales were 1% higher at 2.2 million units, resulting in itsmarket share increasing from 67% to 73%.
Automotive – Wholesale Motorcycle Market
15
7%

Honda CBR150RFebruary 2016
Honda BeAT POP EspJanuary 2016
Honda PCX 150February 2016
Honda CB 650 FFebruary 2016
Honda Vario 150 eSPFebruary 2016
Honda Supra GTR 150May 2016
During first semester 2016, Astra Honda Motor has launched 3 new models and 7 revampedmodels.
Automotive – Motorcycle Product Launches
16

143
80
9
72
Shares of Results of Joint Ventures & AssociatesConsolidated Income
48% 48%
42%42%
10%
10%
Export After Market OEM
Net Income (IDR billion)
152
Revenue (IDR billion)
12%
1H16 1H15 1H16 1H15
5,724
6,435 152
Net Income of Astra Otoparts was little changed at Rp152 billion with increased revenuefrom its OEM, after market, and export segments largely offset by higher operating costsand foreign exchange translation loss in its associated companies.
Automotive – Components
17
0%

Amount Financed (Rp bio) 1H16 1H15 %
Auto
ACC (Incl. HE) 13,266 12,498 6
TAFS 6,580 5,520 19
Total 4W 19,846 18,018 10
FIF 15,880 13,646 16
Total Auto 35,726 31,664 13
HE
SANF 1,203 1,838 (35)
KAF* 680 289 136
Total HE 1,883 2,127 (11)
• 1H16 consolidated net loss Rp836 billion (1H15: net income Rp837 billion)
• Loan book decreased by 8% to Rp121 trillion.
• LDR 86% & CAR 19%.
• Gross-NPL ratio up from 2.7% at the end of 2015
to 4.6%.
Asuransi Astra Buana
• Lower net income by 17% to Rp407 billion.
• 1H16 Gross Written Premium down by 15% year on year to Rp1.9 trillion.
• RBC : 234%, requirement 120%.
PermataBank
Unit Financed 1H16 1H15 %
Auto
ACC (new & used cars) 90,215 91,867 (2)
TAFS 39,003 36,860 6
Total 4W 129,218 128,727 0
FIF (Incl.Electronics)’000 1,713 1,557 10
HE
ACC (HE - Fleet) 257 539 (52)
SANF 222 941 (76)
KAF 153 25 512
Total SANF & KAF 375 966 (61)
Net income from the Group’s financial services businesses declined 40% to Rp1.3 trillion. Higher earningsat Federal International Finance and Toyota Astra Financial Services were more than offset by a decline inthe contribution from the Group’s other financial services businesses, particularly PermataBank whichrecorded a loss following a significant increase in loan-loss provisions.
Financial Services
* Average exchange rate USD/IDR: 13,419 (1H16) & 13,009 (1H15) 18
49.8 52.0
Coal Production (mn tonnes)
339.2 373.7
Overburden Removal (mn bcm)
4,457
2,812
TTA Mine (all in thousand tonnes)
6,864 7,291
11,563 14,741
3,193 2,370
Construction Machinery Mining Contracting
Mining Construction Contracting
23%32%
15%
21%52%
33%10%
14%
Mining Forestry Construction Agro
Mining Contracting
Coal Mines: SalesKomatsu Unit Sales1,375
Revenue (Rp bio)
1H16 1H15 1H16 1H15
1,036
944
1H16 1H15 1H16 1H15
547
10%
Coal Prod:
4%
OB Removal:
9%
58%25%
z
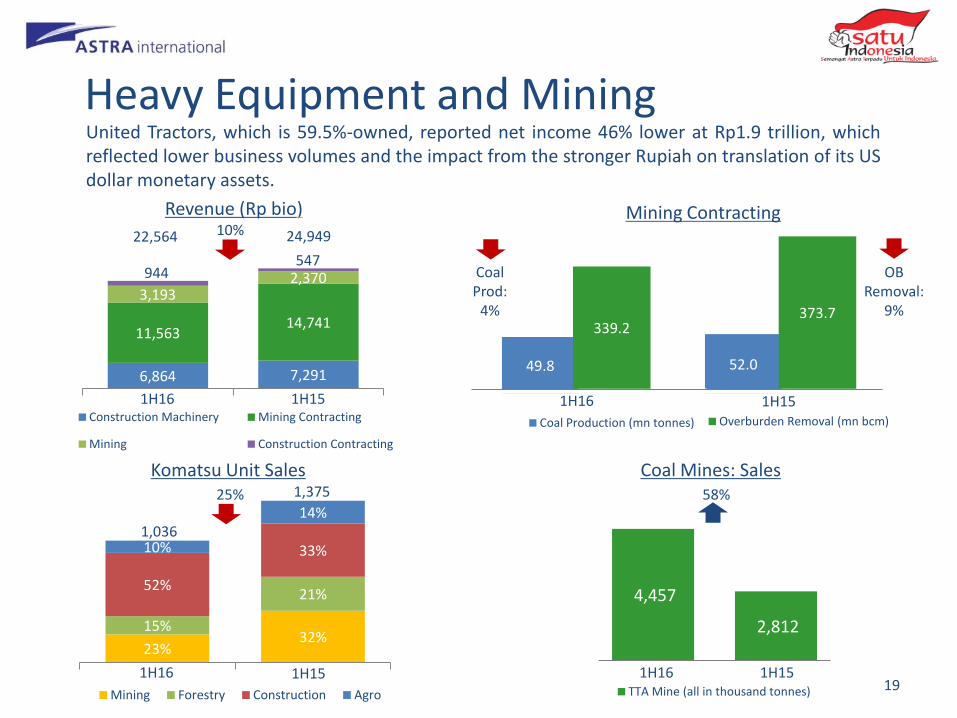
United Tractors, which is 59.5%-owned, reported net income 46% lower at Rp1.9 trillion, whichreflected lower business volumes and the impact from the stronger Rupiah on translation of its USdollar monetary assets.
Heavy Equipment and Mining
19
22,564 24,949

259 256
39 42
Immature
Mature670
845
502 551
184 194
Production Sales Olein Sales
1.68
2.24
4,248 5,036
2,097
2,193
Export
Local
Area Maturity (‘K Ha) *
Revenue (Rp bio)
CPO Production & Sales (‘K tonnes)298 298
* Incl. plasma plantation
CPO Yield (tonne/Ha)
7,229
1H16 1H15
12% 25%
CPO Prod: 21%
6,345
1H16 1H15
1H16 1H15 1H16 1H15
CPO Sales:
9%
Astra Agro Lestari reported net income up 78% to Rp792 billion, despite lower sales volume andcrude palm oil prices, due to the benefit of a stronger Rupiah on translation of its US dollarmonetary liabilities.
Agribusiness
20

23,972 26,158
SERA Unit in Contract (unit)
23,396 22,483
MMS Vehicle Traffic Volume (‘K unit)
1H16 1H15
1H16 1H15
8%
4%
54% 69%
46%31%
Astragraphia Revenue (Rp bio)
1H16 1H15
AGDS
1%
The 72.5km Tangerang-Merak toll road, operated by79.3%-owned Marga Mandalasakti, reported a 4%increase in traffic volume to 23 million vehicles.
1,213
957
Serasi Autoraya’s revenue increased by 4% and netincome increased by 63% to Rp44 billion. Higherused vehicle sales and logistics volumesoutweighed the effect of an 8% decline incontracted vehicles in its car leasing and rentalbusiness.
Astragraphia booked higher revenue by 27% onhigher performance in IT Solutions.
Infrastructure, Logistics & IT
21
AGIT
89%

Appendices
22

Divisional Net Revenue
In Billion Rupiah 1H16 1H15 Change
Automotive 46,273 47,848 (3%)
Financial Services 8,529 8,456 1%
Heavy Equipment & Mining 22,366 24,890 (10%)
Agribusiness 6,345 7,229 (12%)
Infrastructure, Logistics & Others 3,640 3,213 13%
Information Technology 1,055 869 21%
Total 88,208 92,505 (5%)
Divisional Net IncomeIn Billion Rupiah 1H16 1H15 Change
Automotive 3,864 3,422 13%
Financial Services 1,253 2,085 (40%)
Heavy Equipment & Mining 1,121 2,048 (45%)
Agribusiness 631 354 78%
Infrastructure, Logistics & Others 174 68 156%
Information Technology 73 75 (3%)
Total 7,116 8,052 (12%)
Divisional Net Revenue and Net Income
23

Models Launched Launching Period Engine Capacity Prices (Rp mio)
Toyota All New Fortuner Jan’16 2,400cc – 2,700cc 442-631.5
Daihatsu Sirion Sport Jan’16 1,300cc 168.3-179.3
Toyota Rush Feb’16 1,500cc 237.8-262.5
Daihatsu Terios Feb’16 1,500cc 228.1-242.2
Lexus GSF Mar’16 2,000cc 1,245
Lexus GS Mar’16 2,000cc 1,185
Lexus LX Mar’16 5,700cc 3,015
BMW M2 Apr’16 3,000cc 1,349*
Isuzu NMR 71T May’16 4,500cc 387.5-302.5
BMW X1 18i May’16 1,500cc 619*
BMW X1 18i xLine May’16 1,500cc 659*
Car Products Launched in 1H16
24
*off the road price

Models Launched Launching Period Engine Capacity Prices (Rp mio)
Honda BeAT POP eSP Jan’16 110cc 14.3-15
Honda CBR 150 R Feb’16 150cc 32.5-33.3
Honda CBR 500 R Feb’16 500cc 144
Honda PCX 150 Feb’16 150cc 39.8
Honda Vario 150 eSP Feb’16 150cc 20.7
Honda Vario 125 eSP Feb’16 125cc 17.7-18.3
Honda CB 500 F Feb’16 500cc 133-139
Honda CB 500 X Feb’16 500cc 147
Honda CB 650 F Feb’16 650cc 235
Honda Supra GTR 150 May’16 150cc 21.3-21.5
Motorcycle Products Launched in 1H16
25

1H6 1H15Major Brands
Wholesale Astra Wholesale Astra
Car
Sedan 7,179 54.7% 10,141 51.2%Toyota - Vios/Limo, Camry, Altis; Honda - City, Civic,Accord; BMW - 3 Series, 5 Series
4X2 & 4X4 421,172 55.9% 369,556 56.3%
Toyota - Avanza, Agya, Innova, RushDaihatsu - Xenia, Ayla, Terios; Honda – Mobilio, HR-V, Jazz; Suzuki - Ertiga, Karimun Wagon - R, APV;Datsun – Go Panca; Mitsubishi – Pajero Sport, Mirage, Outlander Sport; Nissan – Livina, X-Trail,March
Pick Up / Truck / Bus 99,222 31.7% 141,320 33.8%Daihatsu – Gran Max; Suzuki – Carry, APV; Mitsubishi – Canter, L-300, Strada; Isuzu – Elf, Giga;Panther; Toyota – Hi-Lux, Dyna, Hi-Ace
Double Cabin 4,356 51.8% 4,474 38.3%Toyota - Hilux; Mitsubishi - Strada; Ford - Ranger; Isuzu - D-Max; Nissan - Frontier
Total 531,929 51.3% 525,491 50%
Mo
torc
ycle
Cub 282,307 67.5% 377,477 50.4%Honda - Supra X 125, Revo Series, Blade; Yamaha –Jupiter MX King, Jupiter ZX, Vega Force; Suzuki –Shooter, Shogun Axelo
Scooter 2,300,402 78% 2,409,664 76.3%Honda - BeAT, Vario, Scoopy; Yamaha - Mio, X Ride, GT 125; Suzuki – Address
Sport & Others 380,179 45.3% 387,021 26.6%Yamaha - V-ixion R - 15, Byson; Honda – CB 150 R Street Fire, CBR 150R, Verza, Sonic 150R; Suzuki -Satria F 150
Total 2,962,888 72.8% 3,174,162 67.2%
National Market Data
26

No Brokerage Analyst Email 1 Bahana Securities Leonardo Henry Gavaza [email protected] 2 BCA Sekuritas Darmawan Halim [email protected] CIMB Securities Indonesia Erindra Krisnawan [email protected] 4 Ciptadana Securities Arief Budiman [email protected] Citigroup Investment Research Ferry Wong [email protected] 6 CLSA Indonesia Sarina Lesmina [email protected] 7 Credit Suisse Securities Indonesia Jahanzeb Naseer [email protected] Danareksa Sekuritas Stefanus Darmagiri [email protected] DBS Vickers Maynard Priajaya Arif [email protected]
10 Deutsche Verdhana Securities Nicholas Nugroho [email protected] Goldman Sachs Ben Hartwright [email protected] HSBC Tarun Bhatnagar [email protected] IndoPremier Securities Chandra Pasaribu [email protected] J.P. Morgan Aditya Srinath [email protected] Mandiri Sekuritas Ariyanto Kurniawan [email protected] Macquarie Capital Securities Indonesia Lyall Taylor [email protected] Maybank Kim Eng Securities Isnaputra Iskandar [email protected] Merrill Lynch Swati Chopra [email protected] Morgan Stanley Andri Ngaserin [email protected] Nomura Indonesia Elvira Tjandrawinata [email protected] Onix Capital Bagus Hananto [email protected] 22 Reliance Securities Robertus Yanuar Hardi [email protected] RHB OSK Securities Indonesia Andrey Wijaya [email protected] 24 Trimegah Securities Frederick Daniel [email protected] UBS Securities Indonesia Ronald Liem [email protected] UOB Kay Hian Securities Stevanus Juanda [email protected]
27 Valbury Asia Securities Budi Rustanto [email protected] Yuanta Securities Indonesia Kim Kwie Sjamsudin [email protected]
Equity Research Contact Details
27

For further information please contact:
PT Astra International Tbk
Corporate Investor Relations
P: (+62 21) 652 2555
F: (+62 21) 6530 4953
28