psychometric assessment of a weight management social
TRANSCRIPT

Psychometric Assessment of a WeightManagement Social Provisions Survey in a Sampleof Adults with PrediabetesKathryn E. Wilson ( [email protected] )
Georgia State University https://orcid.org/0000-0001-5847-5461Tzeyu L. Michaud
University of Nebraska Medical CenterCynthia Castro Sweet
Omaha Health, IncJeffrey A. Katula
Wake Forest UniversityFabio A. Almeida
University of Nebraska Medical CenterFabiana A. Brito
University of Nebraska Medical CenterRobert Schwab
University of Nebraska Medical CenterPaul A. Estabrooks
University of Nebraska Medical Center
Research Article
Keywords: social support, perceived support, diabetes prevention, factorial validity, measurementinvariance
Posted Date: October 14th, 2021
DOI: https://doi.org/10.21203/rs.3.rs-966071/v1
License: This work is licensed under a Creative Commons Attribution 4.0 International License. Read Full License

1
Psychometric Assessment of a Weight Management Social Provisions Survey in a Sample
of Adults with Prediabetes
Kathryn E. Wilson,1,2 Tzeyu L. Michaud,3,4 Cynthia Castro Sweet,5 Jeffrey A. Katula,6 Fabio A.
Almeida,3,4 Fabiana A. Brito,3,4 Robert Schwab,3,7 & Paul A. Estabrooks3,4
Author Affiliations:
1Department of Kinesiology and Health, College of Education and Human Development,
Georgia State University, Atlanta, GA, USA
2Center for the Study of Stress, Trauma, and Resilience, College of Education and Human
Development, Georgia State University, Atlanta, GA, USA
3Department of Health Promotion, College of Public Health, University of Nebraska Medical
Center, Omaha, NE, USA
4Center for Reducing Health Disparities, College of Public Health, University of Nebraska
Medical Center, Omaha, NE, USA
5Omada Health, Inc., Medical Affairs, San Francisco, CA, USA
6 Department of Health and Exercise Science, Wake Forest University, Winston-Salem, NC,
USA
7Internal Medicine Division of General Medicine, University of Nebraska Medical Center,
Omaha, NE, USA
Corresponding Author: Kathryn E. Wilson, PhD, 125 Decatur St. SE, Sports Arena, Suite 137,
Atlanta, GA 30303, USA. E-mail: [email protected]. Tel: 404-413-8110
Running head: Social Provisions Scale
Keywords: social support, perceived support, diabetes prevention, factorial validity,
measurement invariance

2
Acknowledgements: We would like to acknowledge the entire UNMC and Wake Forest School
of Medicine research team who has been instrumental in the development and implementation of
the PREDICTS trial, including Amir Alexander, Jennifer Alquicira, Kathryn Aquilina, Ashley
Boggs, Priyanka Chaudhary, Patty Davis, Emily Dressler, Carrie Fay, Destiny Gamble, Kumar
Gaurav, Tristan Gilmore, Cody Goessl, Caitlin Golden, Kalynn Hamlin, Rachel Harper, Lea
Harvin, Haydar Hasan, Xiaolu Hou, Markisha Jackson, Amanda Kis, Carol Kittle, LuAnn
Larson, Emiliane Pereira, Gwenndolyn Porter, Tiffany Powell, Ashley Raposo-Hadley,
Kaylee Schwasinger, Camia Sellers, Sharalyn Steenson, Mariam Taiwo, Lindsay
Thomsen, Jessica Tran, Akou Vei, Thomas Ward, and Norah Winter.
Statement of Interests: Omada Health, Inc. provided the funding for this trial through contracts
with Wake Forest University and the University of Nebraska Medical Center. This included
investigator time, travel for investigator meetings, data management, trial implementation,
analysis and quality control, and manuscript preparation. Dr. Castro Sweet is employed by
Omada Health and receives salary and stock options.

3
Abstract
Background: The relevance of social support for weight management is not well documented in
people with prediabetes. An important consideration is the adequate assessment of social
provisions related to weight management in this population. Purpose: To assess the factor
structure and measurement invariance of an adapted Social Provisions Scale specific to weight
management (SPS-WM) in adults with prediabetes (n=599) . Methods: Participants of a diabetes
prevention trial completed a demographic survey, and the SPS-WM. Confirmatory analyses
tested the factor structure of the SPS-WM, and measurement invariance was assessed for gender,
weight status, education level, and age. Results: Removal of two collinear items resulted in
acceptable model fit, supporting six correlated factors for social provisions specific to weight
management. Measurement invariance was supported across all subgroups. Conclusion: Results
support score interpretations for these scales reflecting distinct components of social support
specific to weight management in alignment with those of the original survey.
Keywords: social support, perceived support, diabetes prevention, factorial validity,
measurement invariance

4
Introduction
The development of translatable weight-loss and diabetes prevention programs is a public
health priority [1-3] as an estimated 1 in 3 US adults have prediabetes and are therefore at risk
for developing Type 2 Diabetes [3]. Modest weight loss resulting from lifestyle modification can
substantially improve risk associated with diabetes and other weight related illnesses [4, 5]. An
important consideration for behavioral interventions is assessing the impact of relevant
psychosocial factors predictive of or related to successful behavior change. One such
psychosocial factor that is related to health and successful behavior change is perceived social
support [6, 7].
Generally, social support can be viewed as a multidimensional construct reflective of “the
comfort, assistance, and/or information one receives through formal or informal contacts with
individuals or groups” [8, p. 369]. Studies demonstrate that higher levels of social support have a
positive impact on clinical outcomes, such as a reduced HbA1c, as they are related to improved
physical activity and dietary behaviors, medication adherence, health-care decision making,
motivation, and glucose monitoring among patients with diabetes [7, 9-12]. Cumulatively, the
evidence supports a moderate association between social support and overall self-care among
patients with Type 1 and Type 2 Diabetes [7], though less work has been done to quantify these
effects in patients with prediabetes. An important preliminary step to assessing such effects is the
confirmation of factorial validity and measurement invariance of scales designed to capture
component factors of social support for weight management outcomes in representative samples
of patients with prediabetes.

5
The Social Provisions Scale [13] was developed to assess the dimensions of social
support postulated in R. S. Weiss’s [29] theoretical model: (1) Guidance (advice or information),
(2) Reliable Alliance (the assurance that others will provide assistance when needed), (3)
Reassurance of Worth (the sense that one is viewed as competent and that their skills are valued
by others), (4) Opportunity for Nurturance (the sense that others rely on oneself for their
wellbeing), (5) Attachment (a sense of security derived from emotional closeness with another),
and (6) Social Integration (a sense of belonging with others that share similar interests). Each
scale includes four items (two of which are positively worded and two of which are negatively
worded) and asks people to indicate their degree of agreement with each statement on a four-
point Likert-type scale (4 – Strongly agree, 3 – Agree, 2 – Disagree, 1 – Strongly disagree). The
scales are published in full as an appendix to Cutrona & Russell [13].
The scores of the Social Provision Scale have demonstrated evidence of reliability and
predictive and convergent validity [13]. However, internal consistency reliability coefficients
are, in some cases, marginal and the latent factor structure has been a topic of some controversy
[14]. Initial factor analyses supported the presence of six strongly correlated factors reflective of
the unique provisions targeted by these scales and the possibility that strong inter factor
correlations reflect a higher order factor for general social support [13]. This is the structure
reflected by the scoring paradigm published with the scales themselves. There is also some
evidence that the scales capture variance related to four unique factors rather than six [15].
Mancini & Blieszner [15] were unable to fit a six-factor model to their data from a sample of
older adults. Upon examining inter-item correlations they collapsed items from the Reliable
Alliance, Guidance, and Attachment scales into a single “Intimacy” factor and found acceptable
model fit [15]. Most recently, however, a bi-factor solution was supported indicating that items

6
load onto a general social support factor independent of their unique variance reflective of
individual subscales [14]. It is possible that difference in latent factor structure reflect sample
differences or shifting societal norms. Nevertheless, tests of the latent factor structure of the
Social Provisions Scale have not yet been performed in samples undergoing diabetes prevention
efforts and are an important precursor to examining the role of social provisions in diabetes
prevention programs.
The purpose of the current investigation was to assess the underlying factor structure of
an adaptation of the Social Provisions Scale in a sample of adults with prediabetes enrolled in a
digital diabetes prevention program. Items of the Social Provisions Scale were contextualized to
weight management paradigms, and a cross-sectional design was used to test the intended factor
structure of the survey (i.e., six correlated factors) compared to alternative factor structures.
Tests of measurement equivalence/invariance according to gender, age, education level and BMI
status, as well as bivariate associations between scale scores and behavioral outcomes were also
conducted. It was expected that the factor structure would reflect a hierarchical model with a
single second-order factor of generalized perceived social support related to weight management
reflected by six first order factors representative of the survey subscales for social provisions. It
was also expected that measurement invariance will be supported across demographic subgroups,
supporting the continued use of the Social Provisions Scale in similar clinical samples.
Methods
Scale adaptation. Items of the Social Provisions Scale [13] were carefully revised to
focus on social provisions specific to weight management for use in the PREventing Diabetes
with dIgital health and Coaching for Translation and Scalability (PREDICTS) trial, a parent
7
hybrid effectiveness/implementation trial delivered through the Nebraska Medicine System. An
interdisciplinary team of investigators with over 20 years of experience delivering behavioral
physical activity, nutrition, and weight-loss intervention trials considered the potential to either
create a new scale to reflect the specific study or adapt an existing scale assessing the
components of social provisions while allowing for the contextualization of items to weight
management specifically. Items are closely worded to those presented in the original scale [13],
with slight adjustments to focus on social provisions related to weight management. The entire
scale is presented in Supplemental Appendix A.
Sample. A total of 599 adult patients with prediabetes were recruited for PREDICTS
trial. Recruitment and intervention protocols are described elsewhere [16]. Eligibility extended to
patients who were overweight and obese (Body mass index [BMI] > 25 kg/m2), >19 years old,
with a glycated hemoglobin (HbA1c) blood test in the prediabetes range (5.7% - 6.4%).
Individuals with a diagnosis of Type 1 or 2 diabetes, who were identified as medically unstable
or having contraindications to physical activity or weight loss as indicated by their primary care
physician, were pregnant or planning to become pregnant, did not speak English, or were
diagnosed with congestive heart failure, coronary artery disease, chronic obstructive pulmonary
disease, pulmonary hypertension, dementia, Alzheimer’s disease, chronic kidney disease, or
were in active cancer treatment were excluded from participation. Informed consent was
provided by all participants.
Procedure. This study was part of a randomized clinical trial for which procedures are
described elsewhere [16]. All data used in this assessment was obtained at the baseline visit of
the trial.

8
Measures. Demographic information (i.e. gender, age, race, education level) was
gathered by self-report survey.
Social Provisions. The weight management social provisions scale (SPS-WM), presented
in Supplemental Appendix A was used to assess six weight management related perceived
provisions: Guidance, Reassurance of Worth, Social Integration, Attachment, Nurturance, and
Reliable Alliance. Each scale was composed of four items, rated using a 4-point forced answer
scale ranging from (1) strongly disagree to (4) strongly agree, in alignment with the original
scale format [13].
BMI. A calibrated scale and stadiometer were used to objectively assess body weight
and height at the baseline visit, which were used to calculate BMI (kg/m2).
Physical activity. Typical weekly engagement in strenuous, moderate, or mild exercise
was assessed by the four item Godin-Shepard Leisure Time Physical Activity Questionnaire
[17]. An index score for physical activity was calculated in accordance with published standard.
A score of 24 or higher is considered sufficiently active for health benefit according to national
guidelines [17-20].
Dietary intake. Eating patterns of study participants were indexed using the 8-item
“Starting the Conversation” Brief Dietary Assessment screening tool designed to detect dietary
behaviors within the context of diabetes self-management [21]. This measure assesses frequency
of consumption of fast food, fruits and vegetables, sugar sweetened beverages, lean protein, and
foods high in fat, sugar and salt, corresponds well with more in-depth food frequency
questionnaires, and is supported in the assessment of overall healthiness of an individual’s
dietary behaviors [22]. Lower dietary intake scores indicate a healthier diet than higher scores.

9
Statistical analysis. All models were estimated using full information robust maximum
likelihood estimation using Mplus 7.11 [23]. Significance of relations between variables (p <
.05) was assessed using critical z-scores (parameter estimate/SE).
Confirmatory factor analyses. An iterative process was used to assess factorial validity
by comparing increasingly complex model specifications using confirmatory factor analysis
(CFA). The simplest model specification was the null model, which reflected the absence of
systematic relationships between item responses which, if supported, would suggest that
covariance observed between items is random. It was expected that the null model would
demonstrate worse model fit than all other model specifications. Next, a single-factor model was
specified to test the possibility that items reflect a single underlying factor of perceived social
provisions. If supported, this model would suggest that the scale measures social provisions
without distinguishing between the factors intended in scale development (i.e. Guidance,
Reassurance of Worth, Social Integration, Attachment, Nurturance, and Reliable Alliance).
Support for the single-factor model would suggest that items supposed to measure provisions for
different social needs (e.g., Guidance and Reassurance of Worth) covary just as strongly with
items across scales as they do with items within scales. An orthogonal six-factor model was
specified to distinguish between the six social provisions subscales as intended, but in opposition
of the postulate that social provision factors are related – rather correlations between factors were
restricted to zero to reflect the absence of association between factors. A correlated six-factor
model was specified in alignment with the expectation that the six social provision factors are
significantly correlated. In extension, a hierarchical model was specified such that items loaded
onto their respective first-order factors, and those first-order factors loaded onto a single second-
order factor for total perceived social provision. This model aligns with the intended structure of

10
the scale as it was developed [13], and reflects both the specificity of social provision factors, as
well as their generalizability to overall perceived social support. Finally, a four-factor model
reflective of the factor structure supported by Mancini & Bleiszner [15] was fit to the data.
Support for this model would indicate that the scales for Guidance, Attachment, and Reliable
Alliance in fact capture variance from a single common construct, previously labeled “Intimacy”.
It was not possible to estimate a bi factor model with these data.
Measurement equivalence/invariance. Measurement invariance was also tested
iteratively beginning with an omnibus test of invariance of covariance matrices. Should
equivalence of covariance matrices not have been supported, levels of invariance would have
been tested in decreasing order of restrictiveness to identify the highest level of measurement
equivalence/invariance reflected in these data [24]. Tests of invariance were conducted for the
following grouping variables: gender, age, education level, and BMI status. Insufficient cell sizes
for race prohibited a corresponding test of measurement invariance. Age groups were stratified
as follows: 1) those > 1 SD below the sample mean, 2) those < 1 SD from the mean, and 3) those
> 1 SD above the mean. Education level was categorized as 1) those with less than a 4-year
college degree, 2) those with a 4-year college degree, and 3) those with postgraduate education.
Finally, participants obesity status was classified as ‘obese class 1’ (BMI of 30.0-34.9), ‘obese
class 2’ (BMI of 35.0-39.9), or ‘obese class 3’ (BMI>40).
Model fit. Several fit indices were examined to evaluate model fit. Absolute and relative
model fit were assessed using the chi-square (χ2) statistic, comparative fit index (CFI), root mean
square error of approximation (RMSEA) and its 90% confidence interval, and standardized root
mean square residual (SRMR) [25, 26]. Concurrent values ≥0.95 for CFI and ≤0.08 for SRMR
reportedly provide optimal protection from type I and type II error rates [25]. Values of CFI

11
approximating 0.90 are judged to be acceptable, while values > 0.95 indicate good fit, and values
of the RMSEA ≤ 0.06 and ≤ 0.08 are commonly interpreted as indicating close and acceptable
fit, respectively. The Bayesian Information Criterion (BIC), which is a relative fit statistic which
approximates the Bayes factor and is conservative for comparing complex models, was also used
to compare CFA models [27]. In the case of a non-positive definite covariance matrix, factor
correlations and residual variances were scrutinized for specification problems. Modification
indices were then examined for multicollinearity and/or cross-loading of problematic items. The
item which demonstrated extreme inter-item collinearity and cross-loading was removed from
the factor model specification and model fit was re-assessed. Modification indices were further
examined for item multicollinearity or cross-loadings when model estimation properly converged
but model fit was observed to be marginal.
Bivariate associations. Bivariate correlations between SPS-WM scale scores and the
physical activity index score, dietary intake score, and body weight were assessed. Summary
scores for the SPS-WM component scales were calculated by averaging all four items on each
scale. In the case of item removal from any of the component scales during the preceding
assessment of factor structure of the survey, scale scores were recalculated as the average of the
retained items for the respective scale, and bivariate correlations were recalculated and reported
herein.
Results
Descriptive statistics for demographic variables are reported in Table 1. The sample of
adults with prediabetes enrolled in a digital diabetes prevention program were predominantly
non-Hispanic (96.3%) white (90.5%) females (61.3%) with a mean(sd) age of 55.8(12.6) years,

12
most of whom were classified as Obese category 1 (i.e. BMI between 30 to 34.9 kg/m2; 41.7%)
and had less than a four-year college education (43.9%). Additional sample details are available
elsewhere [28].
Confirmatory factor analyses. Table 2 displays model fit statistics for all confirmatory
factor analyses. Generally, model fit improved with increasing model complexity. As expected,
the single-factor model demonstrated improved fit compared to the null model, and the six
orthogonal factor model demonstrated improved fit compared to the single-factor model. The
model specifying six correlated factors demonstrated a non-positive definite covariance matrix
resulting from a correlation of greater than one between latent factors for Guidance and Reliable
Alliance. Item correlations revealed collinearity between several items from differing subscales.
Modification indices highlighted item 3 of the Guidance subscale (i.e. “There is no one I can turn
to for guidance on managing my weight in times of stress”) as the greatest contributor to model
misspecification. Upon re-specification of the model with removal of item 3, the model
converged successfully and demonstrated marginal model fit. Re-examination of modification
indices supported the removal of survey item 1 of the Reliable Alliance subscale (i.e. “There are
people I know who will help me with managing my weight if I really need it.”). A second model
re-specification removing item 1 resulted in acceptable model fit.
The hierarchical model and the four-factor model demonstrated poor model fit, though fit
was better than that of the single-factor and null models. Unlike the correlated six-factor model,
the hierarchical model and four-factor model converged without removing any subscale items.
To assess comparative fit, these models were re-specified with the removal of item 3, then again
with the removal of item 1. As was observed in the correlated six-factor model, model fit
improved very slightly with each re-specification. Nonetheless, model fit was best for the

13
correlated six-factor model after removal of items 3 and 1. In fact, model fit of the correlated six-
factor model after removing just item 3 was superior to that of the hierarchical model and four-
factor model after removal of items 3 and 1.
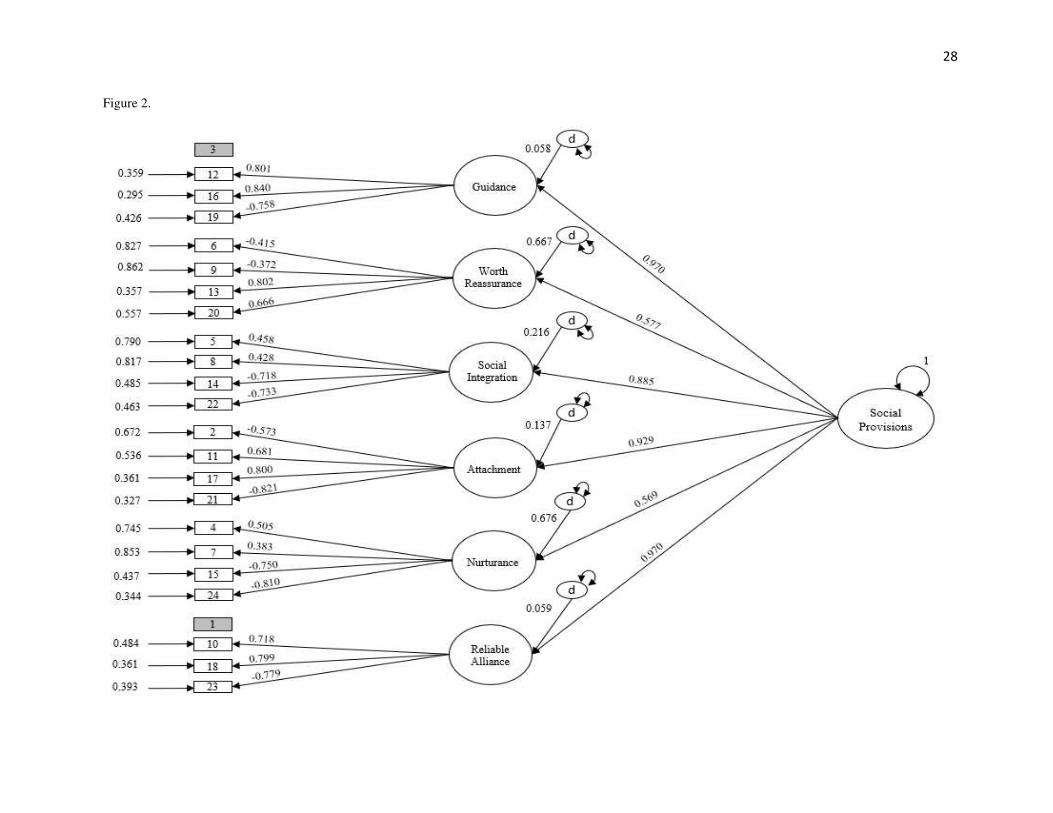
The final model parameter estimates for the correlated six-factor model, the hierarchical
model, and the four-factor model after removing items 1 and 3 are illustrated in Figures 1, 2, and
3 respectively. Item numbers are reflective of their presentation in Appendix A, which aligns
with that of the original scale publication [see appendix of 13], and parameter estimates reflect
the standardized solution. Parameter estimates of models not displayed are available upon
request to the corresponding author. Mean(sd) subscale scores, computed from raw data are
presented in Table 3 for full subscales as well as subscales after removal of items 3 and 1.
Further, Cronbach’s alpha for the scales prior to item removal, and composite factor reliabilities
for all six factors after removal of items 3 and 1 are also presented in Table 3.
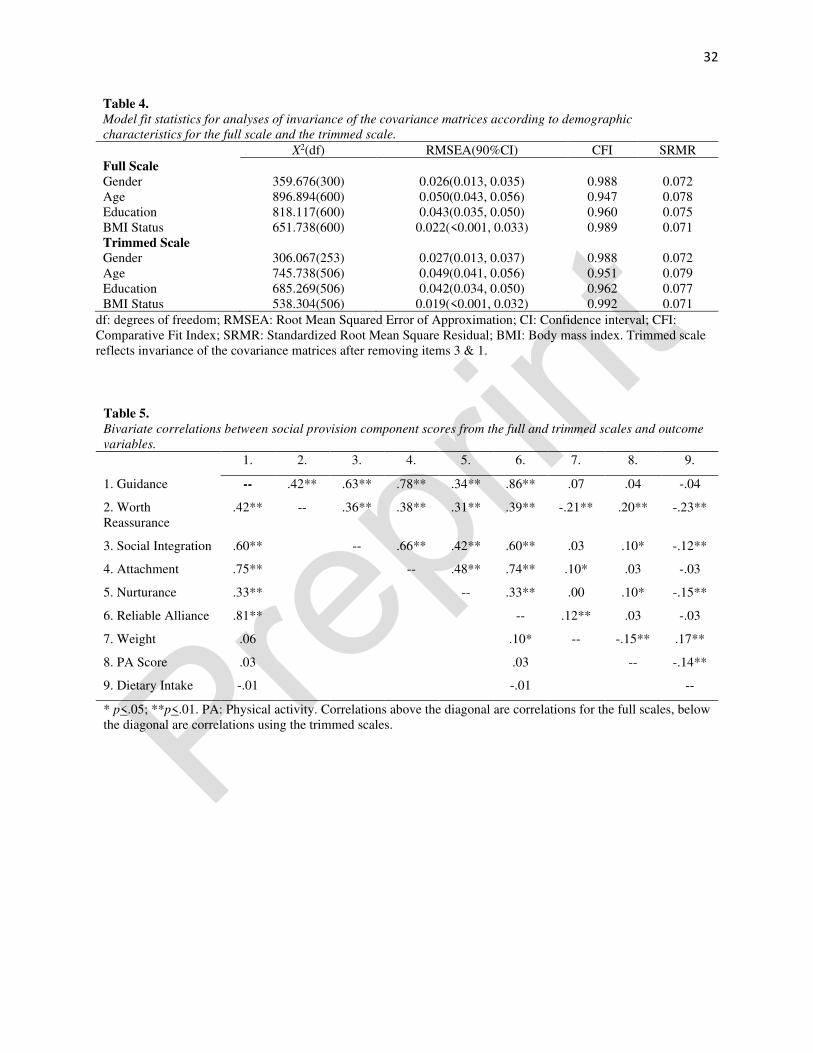
Measurement equivalence/invariance. Equivalence of the covariance matrices was
supported for all subgroup analyses (i.e., between genders, age groups, education, and BMI
status) for the full survey as well as after removing items 3 and 1. Model fit statistics for each
test of measurement invariance of the covariance matrices are reported in Table 4.
Bivariate associations. Bivariate correlations between component scale scores and
weight, physical activity score, and dietary intake score are displayed in Table 5. Associations
between component scores as well as between component scores and relevant outcomes did not
meaningfully differ depending on whether component scores were calculated with or without
items 3 and 1. As was observed in the factor models, all component scores were significantly
related to each other. Notably, Worth Reassurance was the only component score significantly

14
related to all three outcomes of interest (weight r = -.21, p< .01; physical activity r = .20, p < .01;
dietary intake r = -.23, p < .01). Physical activity and dietary intake were also significantly
related to Social Integration (r’s = .10 and -.12, respectively) and Nurturance (r’s = .10 and -.15,
respectively), while weight was related to Attachment (r = .10) and Reliable Alliance (r = .10 to
.12, for the full and trimmed scale scores, respectively). Guidance was not significantly related to
any of the outcomes of interest.
Discussion
This study provides evidence on the factor structure of the Social Provisions Scale adapted to
focus on social provisions related to weight management in a clinical diabetes prevention trial.
Our results indicate that, after removing two items with extreme collinearity, the expected
structure with six correlated first-order factors was supported with these data. Model fit was best
when allowing the six first order factors to correlate freely, and was only slightly reduced when
specifying a hierarchical, second-order factor structure. Further, a four-factor structure collapsing
scales for Guidance, Reliable Alliance, and Attachment demonstrated comparable fit to the
hierarchical model. Nonetheless, model fit was still inferior to the six-factor model even after
corresponding item removal. This study also provides support for the measurement
equivalence/invariance of the scales according to gender, age, education level and BMI status in
a large sample of adults with prediabetes participating in a hybrid effectiveness/implementation
diabetes prevention trial. Bivariate correlations provide support that component scores from this
scale relate to concurrently measured weight management related outcomes (i.e., body weight,
physical activity and dietary behavior).

15
Factor analyses were conducted to replicate and compare the expected factor structure with
alternative model specifications observed for the original scale in previous literature [13, 15]. As
expected, the worst fitting model was the null model, which specified no interitem covariance.
Model fit improved when testing a single-factor model which specified that all 24 survey items
covaried as a result of a single underlying factor in contrast of the theoretical postulate of
multidimensional components of social support [29]. However, model fit was still poor for this
specification.
The first model to test the multidimensional structure of social provisions was the orthogonal
six-factor model, which, if supported, would have indicated that Guidance, Reliable Alliance,
Reassurance of Worth, Social Integration, Nurturance, and Attachment are independent and
unrelated constructs. Model fit worsened compared to the single-factor model, though fit did
remain superior to the null model. Considering the expectation that the unique components of
social provision are related to one another, this observation makes sense. That is, the single-
factor model aligns with this expectation in that all items are free to covary, as they are specified
to be reflective of a single underlying factor. This is not the case in the orthogonal six-factor
model; item covariances are restricted to zero for items that belong to different subscales (i.e.
items on the Guidance subscale are restricted from covarying with items on any of the other five
subscales, and so on for all item covariances across subscales). Only one fit statistic of the
orthogonal six-factor model was improved compared to the single-factor model. The CFI, or
comparative fit index, reflects the relative improvement in fit of the specified model compared to
the null model [30]. The slight improvement in the CFI for this model compared to the single-
factor model therefore suggests that the orthogonal six-factor model specification is a better
approximation of the covariance observed in these data than that of the single-factor model with

16
respect to a model in which no item covariances were present. This observation favors the
multidimensional nature of social provisions, but the improvement in this fit index is negligible,
and overall model fit remained poor.
The specification of a correlated, six-factor model revealed a non-positive definite covariance
matrix. Inspection of factor and item correlations revealed collinearity between items for the
Guidance and Reliable Alliance scales. The items “There is no one I can turn to for guidance on
managing my weight in times of stress” and “There are people I know who will help me with
managing my weight if I really need it” demonstrated collinearity across subscales and were
highlighted by modification indices as contributing heavily to model misspecification. Removal
of these items resolved the misspecification and revealed acceptable model fit across indices.
Mancini and Blieszner [15] also reported collinearity between items of these component scales in
the original survey. Perera [14] reported strong inter factor correlations and cross factor item
collinearity for Guidance and Reliable Alliance calling into question the discriminant validity of
these two factors. In both cases, structural changes were applied rather than attempting to
identify whether a single item or two might be responsible for model misspecification or extreme
inter-factor correlations. Mancini & Blieszner respecified their model to collapse items from
three scales into a single factor for “Intimacy” (as reflected in our specification of the four-factor
model). On the other hand, Perera noted that despite strong inter-factor correlations and item-
cross loadings, there are items from each scale that have substantial loadings per factor,
supporting the scientific utility of retaining the intended factor structure of the survey. Our
approach corresponds to this goal by iteratively eliminating items identified as strong
contributors to model misspecification, rather than immediately exploring the possibility of
alternative factor structures to accommodate cross-loading and item collinearity. Removal of

17
items 1 & 3 from our six-factor model specification supported the presence of six unique factors
for social support, as intended by the survey.
Our observations corroborate earlier results questioning the presence of a salient second-
order factor accounting for first-order factor correlations. Cutrona and Russell (1987) reported
significant factor loadings of the six first-order factors of the original scale onto a general factor
reflective of overall social support. They noted, however, that a substantial proportion of factor
variance for most factors is not accounted for by a global, second-order factor of social support,
suggesting that first-order factors are distinct and highly correlated beyond the influence of a
general level of support available to the person. Though factor loadings did indicate a substantial
amount of variance (R2 ranged from 32% to 94%) from each first order factor being accounted
for by a global social support construct in the current investigation, model fit for six correlated
factors remained superior, albeit marginally, to that of the hierarchical model and the four-factor
model proposed by Mancini & Blieszner (even after corresponding item removal).
In contrast, Chiu, Motl, & Ditchman [31] found close fit of their data to the hierarchical
model in a sample of 292 individuals with multiple sclerosis (MS). Extreme inter-factor
correlations and multicollinearity previously reported for the original scale [13-15] were not
observed in this sample. Other investigations have produced mixed results. Motl & colleagues
found additional support for the hierarchical model tested here among a sample of White
adolescent females, but only after specifying an orthogonal method factor to account for variance
related to positive vs negative worded items within and between first order factors of the original
scale [32]. On the other hand, in the same investigation, factor structure differed significantly for
a sample of Black adolescent girls such that a hierarchical model with four first-order factors
(one factor generated by collapsing items from Attachment, Social Integration, and Reliable

18
Alliance subscales), a single second-order factor and an orthogonal method factor [32]. We did
not consider the specification of an orthogonal method factor, which may have improved model
fit of across models tested.
Perera [14] conducted a bi-factor analysis of the original scale which parsed out common
item variance prior to allowing items to load on their respective scale factors. This model would
suggest that there is some general source of common variance beyond that which is shared
between items within factors. Perera conceptualized this as a global factor for social support,
reflected by common variance across all items, leaving residual variance reflective of their
unique factors. We were unable to fit a bi-factor model to our data as the model failed to
converge, even after allowing up to 10,000 iterations of the model specification.
It remains unclear whether a global factor reflecting overall weight management related
social support could be derived from this measure. The single-factor model tested here speaks
against the presence of a global factor accounting for shared variance across all items. The
hierarchical model we tested also did not demonstrate close fit to our data. The amount of
variance of each first order factor that is accounted for by a second-order factor differs
substantially in our samples compared to others. Second-order factor loadings of the original
scale reported by Chui and colleagues [31] ranged from λ = .65-.90, whereas in the current
investigation factor loadings for the weight management specific scale ranged from λ = .57-.97.
Though this may seem negligible, the pattern of differences between samples with regard to
specific factor loadings is a point of interest. For example, among adults with MS, Reassurance
of Worth loaded onto the global factor for social support at λ = .90 whereas in our sample this
parameter was only λ =.58. In the solution supported in the sample of White adolescent females
second-order factor loadings ranged between λ = .58-.94 [32]. Again, the range of factor loadings

19
is similar to those observed in our sample, but the weakest factor loading in this sample was for
Nurturance (λ = .58) which is consistent with observations by Cutrona & Russell [13]. Such a
wide variability of second-order factor loadings between samples across these scales suggests
that the use of a summary score for global social support derived from individual factor scores
would require the application of a unique weighting coefficient to subscale scores. This is an
impractical consideration, however, as factor analysis is beyond the scope of practice of many
who would use this scale in smaller samples in applied settings. Due to the apparent need to
derive weighting coefficients for each sample in which the scale is used, a reliable summary
score reflective of overall perceptions of social support across diverse samples will remain
elusive. Taken in the context of other factor analyses of the Social Provisions Scale, these
analyses demonstrate the utility of using scale scores independently, rather than summing or
averaging scale scores to reflect a global indicator for social support related to weight
management.
Encouragingly, analyses of the measurement equivalence/invariance of this survey according
to gender, age, education level, and BMI provide support for its use in similar samples of adults
with prediabetes. Tests supported equivalence of covariance matrices provide the most rigorous
assessment of measurement invariance [24] and indicate that subgroups interpret the survey
items in similar ways. These results provide confidence that any between group differences in
scale scores in this sample are free of bias resulting from to demographic characteristics.
Generalizability to more diverse samples is limited, however, as our sample was relatively
homogenous.
Composite factor reliabilities indicate that there may be some problems with some items on
subscales for Reassurance of Worth, Social Integration, and possibly Nurturance (range .661-

20
.718). Similar deficits were observed by Perera [14] who reported internal consistency reliability
of α = .710 for Nurturance, α = .641 for Reassurance of Worth, and α = .795 for Social
Integration. Considering that items aligned very closely with the original publication, perhaps
this is not surprising. Cutrona & Russell [13] reported internal consistency reliabilities between α
= .653 - .760 for the scales in the Social Provisions Scale. Nonetheless, factor loadings from our
sample were moderate to strong (λ = |.365 - .839|) and statistically significant (p<.001). More
work should be done to test the internal consistency of these scales; items should be scrutinized
for content validity and amended to improve internal consistency of the scales.
Conclusion
Overall, analyses provided support for the intended first-order factor structure of the
measure. The issue of whether a higher order factor reflective of global social support related to
weight management can be derived from scores for the first order factors remains unclear. Factor
loadings for the hierarchical model allow for a weighted solution for computing global social
support in this sample but are not recommended for use more generally. More work is needed to
assess the proper weighting of scale scores for the derivation of a global social support score in
the general population. Measurement invariance was strongly supported for this survey in the
sample of patients with prediabetes, extending support for this scale as being interpreted
uniformly across demographic subgroups. Finally, bivariate correlations suggest that these scales
are relevant for understanding behaviors related to weight management, and support continued
use of this measure in clinical trials to assess predictive validity related to weight loss and
management.
21
Evidence provided by this study supports the psychometric validity of these scales in people
with prediabetes engaged in community-based weight-loss trials. Continued assessment of the
psychometric performance of this survey in samples of adults with prediabetes of varying size
and diversity is encouraged to confirm or refute these factorial observations and to corroborate
the applicability of these scales across demographic subgroups. Tests of convergent and
discriminant validity with other supported measures of social provisions in samples with
prediabetes are recommended to assess whether this is the most appropriate measure to capture
component factors of social support related to weight management in populations with
prediabetes.
References
1. World Health Organization, Global status report on noncommunicable diseases 2010.
2011: World Health Organization.
2. Wadden, T.A., K.D. Brownell, and G.D. Foster, Obesity: responding to the global
epidemic. Journal of consulting and clinical psychology, 2002. 70(3): p. 510.
3. Centers for Disease Control and Prevention, National Diabetes Statistics Report, 2020.
2020, Atlanta, GA: Centers for Disease Control and Prevention, US Department of
Health and Human Services.
4. Diabetes Prevention Program Research Group, Reduction in the incidence of type 2
diabetes with lifestyle intervention or metformin. New England journal of medicine,
2002. 346(6): p. 393-403.
5. Diabetes Prevention Program Research Group, 10-year follow-up of diabetes incidence
and weight loss in the Diabetes Prevention Program Outcomes Study. The Lancet, 2009.
374(9702): p. 1677-1686.

22
6. Uchino, B.N., et al., Social Support and Physical Health: Models, Mechanisms, and
Opportunities, in Principles and Concepts of Behavioral Medicine: A Global Handbook,
E.B. Fisher, et al., Editors. 2018, Springer New York: New York, NY. p. 341-372.
7. Song, Y., et al., The Impact of Social Support on Self-care of Patients With Diabetes:
What Is the Effect of Diabetes Type? Systematic Review and Meta-analysis. The Diabetes
Educator, 2017. 43(4): p. 396-412.
8. Wallston, B.S., et al., Social support and physical health. Health Psychology, 1983. 2(4):
p. 367-391.
9. Strom, J.L. and L.E. Egede, The impact of social support on outcomes in adult patients
with type 2 diabetes: a systematic review. Current diabetes reports, 2012. 12(6): p. 769-
781.
10. Stopford, R., K. Winkley, and K. Ismail, Social support and glycemic control in type 2
diabetes: a systematic review of observational studies. Patient education and counseling,
2013. 93(3): p. 549-558.
11. Zhou, G., et al., The Role of Social Support and Self-efficacy for Planning Fruit and
Vegetable Intake. Journal of Nutrition Education and Behavior, 2017. 49(2): p. 100-
106.e1.
12. McMahon, S.K., et al., Assessing the Effects of Interpersonal and Intrapersonal Behavior
Change Strategies on Physical Activity in Older Adults: a Factorial Experiment. Annals
of Behavioral Medicine, 2017. 51(3): p. 376-390.
13. Cutrona, C.E. and D.W. Russell, The provisions of social relationships and adaptation to
stress. Advances in personal relationships, 1987. 1(1): p. 37-67.

23
14. Perera, H.N., Construct Validity of the Social Provisions Scale:A Bifactor Exploratory
Structural Equation Modeling Approach. Assessment, 2016. 23(6): p. 720-733.
15. Mancini, J.A. and R. Blieszner, Social Provisions in Adulthood: Concept and
Measurement in Close Relationships. Journal of Gerontology, 1992. 47(1): p. P14-P20.
16. Almeida, F.A., et al., Preventing diabetes with digital health and coaching for translation
and scalability (PREDICTS): A type 1 hybrid effectiveness-implementation trial protocol.
Contemporary Clinical Trials, 2020. 88: p. 105877.
17. Godin, G., The Godin-Shephard leisure-time physical activity questionnaire. The Health
& Fitness Journal of Canada, 2011. 4(1): p. 18-22.
18. Amireault, S. and G. Godin, The Godin-Shephard Leisure-Time Physical Activity
Questionnaire: Validity Evidence Supporting its Use for Classifying Healthy Adults into
Active and Insufficiently Active Categories. Perceptual and Motor Skills, 2015. 120(2): p.
604-622.
19. Garber, C.E., et al., Quantity and Quality of Exercise for Developing and Maintaining
Cardiorespiratory, Musculoskeletal, and Neuromotor Fitness in Apparently Healthy
Adults: Guidance for Prescribing Exercise. Medicine & Science in Sports & Exercise,
2011. 43(7): p. 1334-1359.
20. Dishman, R.K., et al., Meeting U.S. Healthy People 2010 levels of physical activity:
Agreement of 2 measures across 2 years. Annals of Epidemiology, 2010. 20(7): p. 511-
523.
21. Paxton, A.E., et al., Starting the conversation: performance of a brief dietary assessment
and intervention tool for health professionals. American journal of preventive medicine,
2011. 40(1): p. 67-71.

24
22. Beck, J., et al., 2017 National Standards for Diabetes Self-Management Education and
Support. The Diabetes Educator, 2018. 44(1): p. 35-50.
23. Muthén, L. and B. Muthén, Mplus. Statistical analysis with latent variables. Version,
2012. 7.
24. Vandenberg, R.J. and C.E. Lance, A Review and Synthesis of the Measurement
Invariance Literature: Suggestions, Practices, and Recommendations for Organizational
Research. Organizational Research Methods, 2000. 3(1): p. 4-69.
25. Hu, L.t. and P.M. Bentler, Cutoff criteria for fit indexes in covariance structure analysis:
Conventional criteria versus new alternatives. Structural Equation Modeling: A
Multidisciplinary Journal, 1999. 6(1): p. 1-55.
26. Bollen, K.A., A new incremental fit index for general structural equation models.
Sociological Methods & Research, 1989. 17(3): p. 303-316.
27. Bollen, K.A., et al., BIC and alternative bayesian information criteria in the selection of
structural equation models. Structural Equation Modeling: A Multidisciplinary Journal,
2014. 21(1): p. 1-19.
28. Wilson, K.E., et al., Using a population health management approach to enroll
participants in a diabetes prevention trial: reach outcomes from the PREDICTS
randomized clinical trial. Translational Behavioral Medicine, 2021. In press.
29. Weiss, R.S., The provisions of social relationships. Doing unto others, 1974: p. 17-26.
30. Kline, R.B., Principles and practice of structural equation modeling. third edition ed.
2011, New York: The Guilford Press.
31. Chiu, C.-Y., R.W. Motl, and N. Ditchman, Validation of the Social Provisions Scale in
people with multiple sclerosis. Rehabilitation psychology, 2016. 61(3): p. 297.

25
32. Motl, R.W., et al., Measuring social provisions for physical activity among adolescent
black and white girls. Educational and Psychological Measurement, 2004. 64(4): p. 682-
706.

26
Figure 1. Illustration of the Six Correlated Factor Model after removing items 3 & 1.
Item numbers are reflective of survey presentation in Appendix A which aligns with the original
scale publication (Cutrona & Russell, 1987).
Figure 2. Illustration of the Hierarchical Model after removing items 3 & 1.
Item numbers are reflective of survey presentation in Appendix A which aligns with the original
scale publication (Cutrona & Russell, 1987).
Figure 3. Illustration of the Four-factor model after removing items 3 & 1.
Item numbers are reflective of survey presentation in Appendix A which aligns with the original
scale publication (Cutrona & Russell, 1987).

27
Figure 1.
28
Figure 2.

29
Figure 3.
1

30
Table 1.
Descriptive statistics of the study sample.
M(sd)
Age (yrs) 55.5(12.7) BMI (kg/m2) 36.0(6.4)
N(%)
Female 367(61.3) Age groups <43 years old 108(18.0) 43-68 years old 395(65.9) >68 years old 96(16.0) Education groups <4 yr degree 263(43.9) 4 yr degree 185(30.9) Advanced degree 149(24.9) BMI Status Overweight 73(12.2) Obese class 1 250(41.7) Obese class 2 141(23.5) Obese class 3 135(22.5) Race African American 39(6.5) American Indian/Native Hawaiian 2(0.3) Asian 6(1.0) Unknown 10(1.7) White 542(90.5) Ethnicity Hispanic 19(3.2) Non-Hispanic 577(96.3) Unknown 3(0.5) Two participants did not report education level.

31
Table 2.
Model fit statistics for all models.
N χ2 (df) RMSEA (90% CI) CFI SRMR BIC
CFAs
Null Model 598 4993.430(276) 0.169(0.165, 0.173) <0.001 0.336 33283.249
Single Factor 598 1302.319(252) 0.083(0.079, 0.088) 0.777 0.073 28180.214
Six Orthogonal Factors 598 1385.526(242) 0.089(0.084, 0.093) 0.758 0.206 28355.091
Six Correlated Factors 598 -- -- -- -- --
Six Correlated Factors a 598 669.446(215) 0.059(0.054, 0.065) 0.896 0.062 26475.553
Six Correlated Factors b 598 603.978(194) 0.059(0.054, 0.065) 0.900 0.061 25258.044
Hierarchical Model 598 877.616(246) 0.066(0.061, 0.070) 0.866 0.067 27647.106
Hierarchical Model a 598 773.666(224) 0.064(0.059, 0.069) 0.874 0.066 26553.317
Hierarchical Model b 598 704.591(203) 0.064(0.059, 0.070) 0.878 0.066 25333.069
Four Correlated Factors 598 870.723(246) 0.065(0.061, 0.070) 0.868 0.064 27642.499
Four Correlated Factors a 598 776.946(224) 0.064(0.059, 0.069) 0.873 0.064 26562.233
Four Correlated Factors b 598 711.158(203) 0.065(0.060, 0.070) 0.876 0.064 25346.147
CFAs: Confirmatory Factor Analyses; df: degrees of freedom; RMSEA: Root Mean Squared Error of Approximation; CI: Confidence interval; CFI: Comparative Fit Index; SRMR: Standardized Root Mean Square Residual; BIC: Bayesian Information Criteria. Italics indicate model specifications with a non-positive definite covariance matrix. Bolded values reflect the model with the best fit to these data. a Item 3 removed. b Items 3 & 1 removed.
Table 3.
Baseline values of social prevision scale scores from the full and trimmed scales.
M(sd) Composite Factor Reliability
Guidance 12.65(2.52)/9.39(1.92) .842 Worth Reassurance 10.10(2.12) .661 Social Integration 11.61(2.05) .681 Attachment 11.98(2.60) .813 Nurturance 9.36(2.39) .718 Reliable Alliance 12.62(2.40)/9.40(1.87) .810 Bolded scale scores reflect the mean score of scales after item removal. Composite factor reliability was calculated for the scales after item removal.
32
Table 4. Model fit statistics for analyses of invariance of the covariance matrices according to demographic
characteristics for the full scale and the trimmed scale. X2(df) RMSEA(90%CI) CFI SRMR Full Scale Gender 359.676(300) 0.026(0.013, 0.035) 0.988 0.072 Age 896.894(600) 0.050(0.043, 0.056) 0.947 0.078 Education 818.117(600) 0.043(0.035, 0.050) 0.960 0.075 BMI Status 651.738(600) 0.022(<0.001, 0.033) 0.989 0.071 Trimmed Scale Gender 306.067(253) 0.027(0.013, 0.037) 0.988 0.072 Age 745.738(506) 0.049(0.041, 0.056) 0.951 0.079 Education 685.269(506) 0.042(0.034, 0.050) 0.962 0.077 BMI Status 538.304(506) 0.019(<0.001, 0.032) 0.992 0.071
df: degrees of freedom; RMSEA: Root Mean Squared Error of Approximation; CI: Confidence interval; CFI: Comparative Fit Index; SRMR: Standardized Root Mean Square Residual; BMI: Body mass index. Trimmed scale reflects invariance of the covariance matrices after removing items 3 & 1.
Table 5.
Bivariate correlations between social provision component scores from the full and trimmed scales and outcome
variables.
1. 2. 3. 4. 5. 6. 7. 8. 9.
1. Guidance -- .42** .63** .78** .34** .86** .07 .04 -.04
2. Worth Reassurance
.42** -- .36** .38** .31** .39** -.21** .20** -.23**
3. Social Integration .60** -- .66** .42** .60** .03 .10* -.12**
4. Attachment .75** -- .48** .74** .10* .03 -.03
5. Nurturance .33** -- .33** .00 .10* -.15**
6. Reliable Alliance .81** -- .12** .03 -.03
7. Weight .06 .10* -- -.15** .17**
8. PA Score .03 .03 -- -.14**
9. Dietary Intake -.01 -.01 --
* p<.05; **p<.01. PA: Physical activity. Correlations above the diagonal are correlations for the full scales, below the diagonal are correlations using the trimmed scales.

33
Appendix A. The Weight Management Related Social Provisions Scale
Instructions to participants: This questionnaire is about you and your relationships with other
people. It is focused on weight management. Weight management is about either trying to lose
weight or maintain a healthy weight. Please indicate how much you agree or disagree with each
statement.
If you feel a statement is VERY TRUE you would mark Strongly Agree. If you feel a statement
REALLY does not describe your relationships, you would answer Strongly Disagree.
Rating Scale:
1 2 3 4
Strongly Disagree Disagree Agree Strongly Agree
1. There are people I know who will help me with managing my weight if I really need it. 2. I do not have close personal relationships with other people interested in my weight
management goals. 3. There is no one I can turn to for guidance on managing my weight in times of stress. 4. There are people who call on me for help managing their weight. 5. There are people who watch their weight that enjoy the same social activities that I do. 6. Other people do not think I am good at managing my weight. 7. I feel responsible for taking care of someone else who is working on getting to a healthy
weight. 8. I am with a group of people who think the same way I do about managing their weight. 9. I do not think other people respect how I work on managing my weight.
10. If something went wrong, no one would help me with my weight management goals. 11. I have close relationships that make me feel good about managing my weight. 12. I have someone to talk to about weight management decisions in my life. 13. There are people who value my weight management skills and abilities. 14. There is no one who has the same weight management interests and concerns as me. 15. There is no one who needs my help managing their weight. 16. I have a trustworthy person to turn to it I have problems with managing my weight. 17. I feel a strong emotional tie with at least on other person who is working on weight
management. 18. There is no one I can count on for help with my weight management goals if I really need
it. 19. There is no one I feel comfortable talking about weight management problems with. 20. There are people who admire my weight management talents and abilities. 21. I do not have a feeling of closeness with anyone working on weight management.

34
22. There is no one who likes to do the things that I like to do to manage my weight. 23. There are people I can count on when sticking with my weight management goals gets
really tough. 24. No one needs me to help them with their weight management goals.
Scoring:
A summary score for each component is calculated such that a high score indicates that the
individual is receiving that provision. Items that are asterisked should be reverse scored before
summing. Sum the following items to derive the respective component score:
Guidance: 3*, 12, 16, 19*
Reassurance of Worth: 6*, 9*, 13, 20
Social Integration: 5, 8, 14*, 22*
Attachment: 2*, 11, 17, 21*
Nurturance: 4, 7, 15*, 24*
Reliable Alliance: 1, 10*, 18*, 23