psychological health before, during, and after an economic crisis health before.pdf ·...
TRANSCRIPT

Policy ReseaRch WoRking PaPeR 4386
Psychological Health Before, During, and After an Economic Crisis:
Results from Indonesia, 1993 – 2000
Jed FriedmanDuncan Thomas
The World BankDevelopment Research GroupPoverty TeamNovember 2007
WPS4386P
ublic
Dis
clos
ure
Aut
horiz
edP
ublic
Dis
clos
ure
Aut
horiz
edP
ublic
Dis
clos
ure
Aut
horiz
edP
ublic
Dis
clos
ure
Aut
horiz
ed
Produced by the Research Support Team
Abstract
The Policy Research Working Paper Series disseminates the findings of work in progress to encourage the exchange of ideas about development issues. An objective of the series is to get the findings out quickly, even if the presentations are less than fully polished. The papers carry the names of the authors and should be cited accordingly. The findings, interpretations, and conclusions expressed in this paper are entirely those of the authors. They do not necessarily represent the views of the International Bank for Reconstruction and Development/World Bank and its affiliated organizations, or those of the Executive Directors of the World Bank or the governments they represent.
Policy ReseaRch WoRking PaPeR 4386
The 1997 Indonesian financial crisis resulted in severe economic dislocation and political upheaval, and the detrimental consequences for economic welfare, physical health, and child education have been previously established in numerous studies. We also find the crisis adversely impacted population psychological well-being. We document substantial increases in several different dimensions of psychological distress among male and female adults across the entire age distribution over
This paper—a product of the Poverty Team, Development Research Group—is part of a larger effort in the department to explore the welfare impacts of economic shocks. Policy Research Working Papers are also posted on the Web at http://econ.worldbank.org. The author may be contacted at [email protected].
the crisis period. In addition, the imprint of the crisis can be seen in the differential impacts of the crisis on low education groups, the rural landless, and residents in those provinces that were hit hardest by the crisis. Elevated levels of psychological distress persist even after indicators of economic well-being such as household consumption had returned to pre-crisis levels suggesting long-term deleterious effects of the crisis on the psychological well-being of the Indonesian population.

Psychological Health Before, During, and After an Economic Crisis:
Results from Indonesia, 1993 – 2000
Jed Friedman, World Bank
Duncan Thomas, Duke University
This research was supported in part by NICHD grant HD040245.

1
Introduction
The 1997 Asian currency crisis, arguably one of the most disruptive global economic events in
several decades, caused severe economic damage across much of East and Southeast Asia. No country
was more affected than Indonesia. After several decades of sustained economic growth with low inflation,
a stable exchange rate and three decades of President Suharto in power, Indonesian society was torn apart
by the 1997 crisis. The Indonesian rupiah collapsed, falling from around Rp 2,500 per US$ in late 1997 to
Rp 15,000 per US$ in mid 1998. GDP declined 12 percent in 1998 and the economy did not grow again
until 2000. Prices spiraled up with inflation in 1998 reaching 80% while food prices increased by 160%.
Economic upheaval was accompanied by political turmoil. President Suharto resigned after street protests
in early 1998 which presaged historic changes in the system of national and local government. The vast
majority of Indonesian households struggled to cope with both the immediate economic adversities they
faced at the onset of the crisis as well as tremendous uncertainty over their economic, social, and political
futures. Living through the stresses of the crisis potentially took a substantial toll on the psychological
well-being of the population. This project examines the evidence and seeks to identify those subgroups of
the Indonesian population who paid the highest price in terms of their psychological and psychological
health.
The impacts of the crisis on economic well-being were far from uniform. In many ways the crisis
was centered in urban areas and disadvantaged urban households bore the brunt of the crisis (Frankenberg
et al., 1999; Friedman and Levinsohn, 2002). Household consumption declines and increases in poverty
rates were much greater in urban areas than in rural areas.1 In large part, this is a reflection of the rise in
the relative price of food, particularly rice, which benefited net food producers and the concomitant
collapse of real wages which took its toll on urban workers and the rural landless. The economic impacts
of the crisis also varied dramatically across the 27 Indonesian provinces and numerous island groups even
within urban and rural areas (Levinsohn et al., 2003). More urbanized provinces in Java, such as Jakarta
and West Java, suffered the largest contractions whereas the deleterious economic effects of the crisis
were substantially more muted in those provinces that produced exports and export-related services such
as tourism (in Bali, for example) and the production of oil, timber, and fishing (on Sumatra). Variation
across provinces and between rural and urban areas is a fundamental aspect of Indonesia’s economic
crisis and is important for understanding how the economic crisis affected psychological well-being.
A series of studies have described the effects of the crisis on multiple dimensions of the economic
well-being and physical health of the Indonesian population. Taken together, those studies indicate a
1 Household per capita expenditure declined 34% among urban households and 13% among rural households (Frankenberg et al., 1999). Poverty rates more than doubled in urban areas and rose about 50% in rural areas (Suryahadi et al. 2000).
2
dramatic but short-lived decline in the living standards of most Indonesians suggesting an enormously
resilient population that took great efforts to weather the storm.2
In sharp contrast, the impact of the financial crisis on psychological and mental health has not
been explored. The goal of this paper is to provide empirical evidence on the extent to which the manifold
upheavals and associated stresses of the Indonesian crisis affected the psychological health of the
Indonesian population and whether any such effects were long-lasting. In so doing, we contribute new
evidence on the psycho-social costs of economic insecurity in developing countries.
Using data from the Indonesia Family Life Survey, we track indicators of psychological distress
of the same individuals who were assessed in up to three interviews over a period before, during and after
the onset of the crisis. This evidence is contrasted with changes in general health status of the same
individuals. We find there are substantively large and significant increases in the prevalence of
psychological distress among both male and female adults after the onset of the crisis and this increase
persists well beyond the beginning of the crisis. While the effects are apparent across the entire age range,
there is a suggestion that older adults are slightly more vulnerable to elevated distress. We also find levels
of anxiety are higher after the onset of the crisis among those with less education. The impact of the crisis
is also greatest among the rural landless and those who were living in provinces that suffered the greatest
toll in terms of the economic costs of the crisis.
Psychological health in developing countries
Although it is generally recognized that psychological health is an important component of
individual well-being, there is limited evidence at a population level regarding the prevalence of psycho-
social disability in developing countries or its variation within those countries. Over and above the direct
consequences on human welfare of poor psychological health, the literature suggests there may be
significant economic costs, both for the individual and society at large. Global Burden of Disease
estimates indicate that neuro-psychiatric diseases account for about 10% of the total burden of disease and
injury (measured in disability-adjusted life years) in low and middle income countries and over 12% of
the disease burden in East Asia and the Pacific. About one-third of that diseases burden is attributed to
depression. (Lopez et al. 2006). Other leading contributors to the global disease burden that are associated
with psychological health include schizophrenia, bipolar disorder and substance abuse.3
2Studies have described the impact of the crisis on of poverty, consumption and wealth, labor supply, wages and earnings, schooling, physical health and health care utilization (Frankenberg et al. 1999; Suryahadi et al. 2000; Frankenberg et al. 2003; Thomas et al. 2004; Strauss et al., 2004). 3 As will be discussed in detail later in the paper, our measures of psychological health are designed to assess overall psycho-social well-being and not specific manifestations of mental illness. While the majority of studies cited are more clinical in nature and hence measure specific classifications of mental illness our results pertain to a generalized notion of psychological health. Specific mental illnesses, such as bipolar depression or generalized anxiety disorder, are subsumed in this general category of psychological distress or ill psychological health.

3
Studies in both developed and developing countries suggest psychological health problems tend
to be more prevalent among those with lower socio-economic status although it has been a challenge to
pin down the causal mechanisms that underlie these associations. It is likely that economic insecurity and
poverty contributes to poor psychological health and, conversely, the evidence suggests that people
suffering from psychological health problems tend to perform less well in the labor market and in school
(Ettner et al. 1997; Dooley et al. 2000, Kessler et al. 1995). Health care service providers across the globe
report that depression and anxiety are more prevalent among lower educated groups (Goldberg and
LeCrubier, 1995; Patel and Kleinman, 2003). Poorer and more disadvantaged groups typically have little
or no access to psychological health care services, especially in the developing world, thus potentially
exacerbating the circular relationship of poverty and mental illness (Saraceno and Barbui, 1997).
Emerging research indicates that it is not necessarily poverty itself but adverse changes in socio-
economic status that are predictive of psychological stress (Das et al., 2007). If that is correct, the
transitions, dislocations and uncertainties that are part of daily life for many people living in the
developing world today are likely to carry with them an elevated burden of psycho-social health
problems. Indeed, even as the physical health of a population improves, the same development process
may lead to elevated social and psychological pathologies as societies undergo pronounced changes such
as rapid urbanization, which tend to weaken traditional rural social bonds (Sugar et al., 1991). It has been
suggested that the highest levels of psychological pathologies are found in countries emerging from
conflict, where levels of post-traumatic stress disorder (PTSD) are high among the general population
(Joop et al., 2001). Populations in regions that have suffered from natural disaster also suffer significantly
more psychological distress in terms of depression, somatization, and anxiety (Wang et al., 2000;
Frankenberg et al., 2007). Given this evidence, it is plausible to suppose that severe economic dislocation
may have adverse effects on health in general and psychological health in particular. Tangcharoensathien
et al. (2000) provide some evidence on the immediate aftermath of the 1997 financial crisis in Thailand.
Although the overall impacts on physical and psychological health in this specialized study sample are
mixed, the reported prevalence of severe stress, suicidal ideation, and hopeless feelings increased
substantially among the sub-group of unemployed. The Thai crisis was not as deep, far-reaching, or long-
lasting as the Indonesian crisis and so the impact of the Indonesian crisis on the psychological well-being
of the population may have been more widespread. We turn now to assess that evidence.
The data
The Indonesia Family Life Survey (IFLS) is an on-going multi-purpose individual-, household-
and community-level longitudinal survey. The first wave of IFLS was fielded in 1993 and collected
information on over 30,000 individuals living in 7,200 households. The original sample covered 321
communities in 13 provinces and is representative of the population residing in those provinces, about
83% of the national population. The same respondents were re-interviewed in 1997 (IFLS2), a few
4
months before the beginning of Indonesia’s currency crisis, and again in 2000 (IFLS3). A 25% sub-
sample of individuals was re-interviewed in 1998 (IFLS2+) in order to measure the immediate impacts of
the crisis.4
In addition to collecting extensive information on the socio-economic and demographic
characteristics of respondents and their families, IFLS assesses the psychological well-being of its
respondents using an interview-based survey instrument. The measurement of psychological health in this
way has a long history in the mental health research community and several survey tools, both for
diagnostic and screening purposes, have been developed over the past decades. Some of these efforts have
resulted in extensive diagnostic assessments such as the Composite International Diagnostic Interview
(CIDI) which use a battery of a small number of screener questions that feed into a more extensive sub-
questionnaire pertaining to specific psychological pathologies. An alternative assessment of psychological
health through survey is the brief screening scale typically developed to assess population-level
prevalence in non-specific psychological distress. One example of such a scale can be found in Kessler et
al. (2002) who present a method for developing a new 10-question screening scale of psychological
distress for the National Health Interview Survey (NHIS).
While these survey tools have been developed to study the populations of developed countries, a
recent WHO consortium (2000) using the CIDI has compiled a cross-national study of the prevalence and
correlates of psychological disorder including samples from Brazil, Mexico, and Turkey. They find that
the prevalence of disorders such as depression or anxiety is widespread throughout the world. While it is
generally difficult to import these survey tools wholesale into a developing country setting, many
researchers have translated and adapted the tools specifically for the local context. Recent locally-rooted
studies in the developing world have found the prevalence of several psychological disorders to be as high
as or higher than those found in the west. Almeida-Filho and others (1997) find the overall prevalence
patterns by age and gender of DSM-III psychiatric diagnoses in 3 urban centers in Brazil to be similar to
those found in the US Epidemiological Catchment Area studies (based on results cited in Robins and
Regier, 1991). In rural Ethiopia the prevalence of psychiatric morbidity is quite high and similar to levels
found in urbanized, developed countries (Awas et al. 1999). Using locally developed screening tools,
Abas and Broadhead (1997) find a depression and anxiety prevalence of 31% among women living in a
Harare slum – a higher prevalence than that found for the same demographic category in London. In
general, developing country based studies find that the same covariates of psychological illness and
psychological distress observed in developed countries – female gender, low income, older age, and lower
4 Considerable attention has been placed on minimizing attrition in IFLS. In each re-survey, about 95% of households have been re-contacted, thus minimizing data concerns that can arise from selective attrition. Around 10-15% of households moved from the location in which they were interviewed in the previous wave and concerted effort was made to track these households to their new location. In addition, individuals who moved out of their original IFLS household have been followed. This has added around 1,000 households to the sample in 1997 and about 3,000 households in 2000.
5
education – are also associated with common psychological disorders in low and middle income countries
(Patel et al. 1999; Patel and Kleinman, 2003).5
To measure psychological well-being in Indonesia, IFLS adopted a short screening survey of
psychological distress. The psychological health component of IFLS is not intended to diagnose a specific
psychological illness per se, but rather to assess the population prevalence of various symptoms of
psychological distress. These symptoms are typically highly correlated with specific forms of
psychological illness. The particular IFLS psychological health questions are adapted from the General
Health Questionnaire (GHQ) and attempt to measure symptoms of two globally common categories of
psychiatric disorder- depression and anxiety (Goldberg, 1972). Appendix Table 1 presents the IFLS
questions used in this study. They focus on general feelings of sadness or anxiety as well as specific
symptoms of distress.6 These questions have been translated and back-translated to ensure accuracy, as
well as extensively tested in the field in order to ensure comprehension among study subjects. Appendix
Table 1 also includes a question on self-perceived general health status. This standard health survey
question is a summary measure of health that encompasses physical and non-physical domains of well-
being. It provides a contrast with which to compare our markers of psycho-social well-being against a
broader summary of health.
In terms of survey implementation, the psychological health questions were assessed in full in the
1993 and 1998 survey waves and a subset of the questions were assessed in the 2000 wave. (The subset is
marked with an asterisk in Appendix Figure 1). For much of the following analysis, we exploit the panel
nature of the data to contrast the general psychological health of each individual at two points in time,
1993 and 2000 (the 1998 results from the 25% sub-sample will also be used).
This seven year period brackets the financial, political and social crisis which, given its
magnitude, is likely the dominant factor underlying changes in psychological health over this period. An
advantage of using 1993 for comparison is that our estimates will not be contaminated by the impact of
expectations regarding an impending crisis.
Psychological distress, pre- and post-crisis
We begin with an overview of our psychological well-being indicators before and after the onset
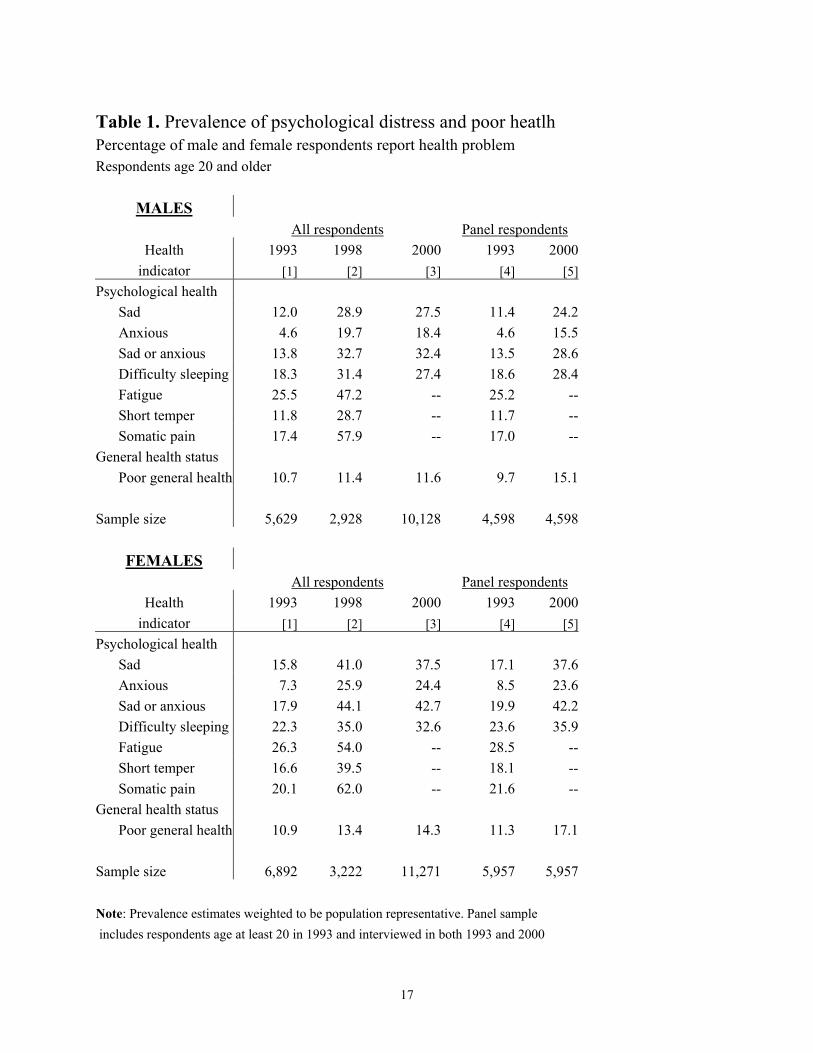
of the 1997 crisis. Table 1 reports the overall prevalence of psychological distress in the population of
5 More recent research (Das et al., 2007) fails to find this coincident relationship between psychological health and low socio-economic status in five developing countries, although it does replicate the earlier findings in regards to demographic correlates. 6 The questions ask about a broader array of symptoms than that indicated by the DSM-IV and, although questions relate to symptoms of depression and anxiety, the prevalence of a symptom or multiple symptoms within an individual are not sufficient information to produce a diagnosis (Bir and Frank, 2001). Although validation studies with the US based GHQ have concluded that if a clustering of symptoms within an individual is identified, psychiatrists are likely to make a diagnosis (Goldberg, 1972), the IFLS data do not provide diagnostic information and we interpret out measures as indicative of general psychological well-being in the population.
6
adults age 20 and above at the time of each wave of the survey along with the percentage of respondents
who report they were in poor general health status.7 The upper panel reports results for males and the
lower panel for females. The left hand panel reports estimates that draw on reports from all respondents in
each wave of the survey. The estimates are weighted so that they are representative of the underlying
population.8
The onset of the 1997 crisis was accompanied by a dramatic increase in all of the psychological
distress indicators measured in IFLS. For both males and females, between 1993 and 1998, the prevalence
of distress almost doubled for each indicator except one, difficulty sleeping, which increased by about
50%. For example, in 1993, about 12% of men reported feeling sad in the prior four weeks; in 1998,
nearly 30% of men reported feeling sad. Women were slightly more likely to feel sad in 1993 (16%) and
much more likely to feel sad in 1998 (41%). There were even larger proportionate increases in the
prevalence of anxiety which rose three- to four-fold (from a lower base). Combining both markers into an
index identifying those who report feeling either sad or anxious, about one in six respondents reported
such feelings in 1993. In 1998, one in three males and almost one of every two females reported these
feelings. In 1993, one in five respondents had difficulty sleeping and by 1998 this affected one in three
adults. The prevalence of fatigue nearly doubled and short temper more than doubled. For both males and
females, the prevalence of reported somatic pain tripled from around 20% to 60% of respondents.
The increase in prevalence of psychological problems between 1993 and 1998 suggests a
substantial rise in underlying psychological and emotional distress over this period which, as shown in the
third column of the table, persisted well beyond the onset of the crisis. There is only a small decline in the
prevalence of psychological distress between 1998 and 2000 for both men and women. This persistence is
noteworthy since by 2000 the Indonesian economy had begun to recover and mean household
consumption levels had already returned to the pre-crisis levels of 1997. (Ravallion and Lokshin, 2007)
In contrast with the increase in psychological problems, self-reported general health status
changes very little over the entire seven year period. Around 11% of males and between 11 and 14% of
females reports themselves as being in poor health. The relative stability of this general health measure
suggests that the psychological distress indicators identify a change in a different dimension of health and
7 For ease of exposition, we have dichotomized the psychological distress and general health status questions. We combine respondents that report the experience of a particular psychological distress indicator either often or sometimes over the past four weeks. Likewise if a respondent reported their general health status as ‘somewhat unhealthy’ or ‘very unhealthy’ we recode to being in ‘poor general health’. One approach to measurement of health problems with survey data is to aggregate responses to several questions and create a summary index (see Das et al., forthcoming, for an example in psychological health). We present results for two domains of psychological problems – feeling sad or anxious – and suffering from sleep difficulties. Those are the only questions that are repeated across all three survey waves. Our results are qualitatively unchanged if we combine all six questions into an index and compare 1993 with 1998 or if we combine the three common questions across the three surveys into an index and compare 1993 with 1998 and 2000. 8 The sample sizes vary across the waves because of the survey design. In 1993, a subsample of adults was interviewed in each household. In 1998 and 2000, all adults were individually interviewed. The 1998 wave was restricted to a 25% sub-sample of households for cost reasons.

7
well-being than general health and that the crisis differentially affected these separate dimensions. In the
subsequent analysis, general physical health status results will provide a useful comparison with
psychological health indicators and emphasize the potentially unique impacts of the crisis on
psychological well-being.
The analyses thus far provide evidence on the prevalence of health problems in the population. It
is useful to explore transitions in health over this period which requires following the same individual
over time. The right hand panel of Table 1 reports the prevalence of psychological problems and poor
general health among respondents who were individually assessed in both 1993 and 2000 and were age at
least 20 in the 1993 baseline. Over 80% of the 1993 respondents were also interviewed in 2000.
Comparing prevalence rates for the population (in the first column) with the rates for the panel sample at
baseline (in the fourth column) provides insights into the representativeness of the panel sample. For both
males and females, the prevalence rates in 1993 are very similar across the columns. The rates in 2000 are
not directly comparable in the cross-section and panel samples because the respondents are seven years
older in the latter. For the psychological indicators, the rates are close. Thus the panel sample replicates
the large increase in psychological distress between 1993 and 2000 that was observed in the cross-section
sample. In contrast, in the panel sample, a larger fraction of respondents report themselves as being in
poor health relative to the cross-section sample. This is largely a reflection the fact that poor health rises
with age and provides further evidence that time effects are minor relative to age effects in the case of
general health status.
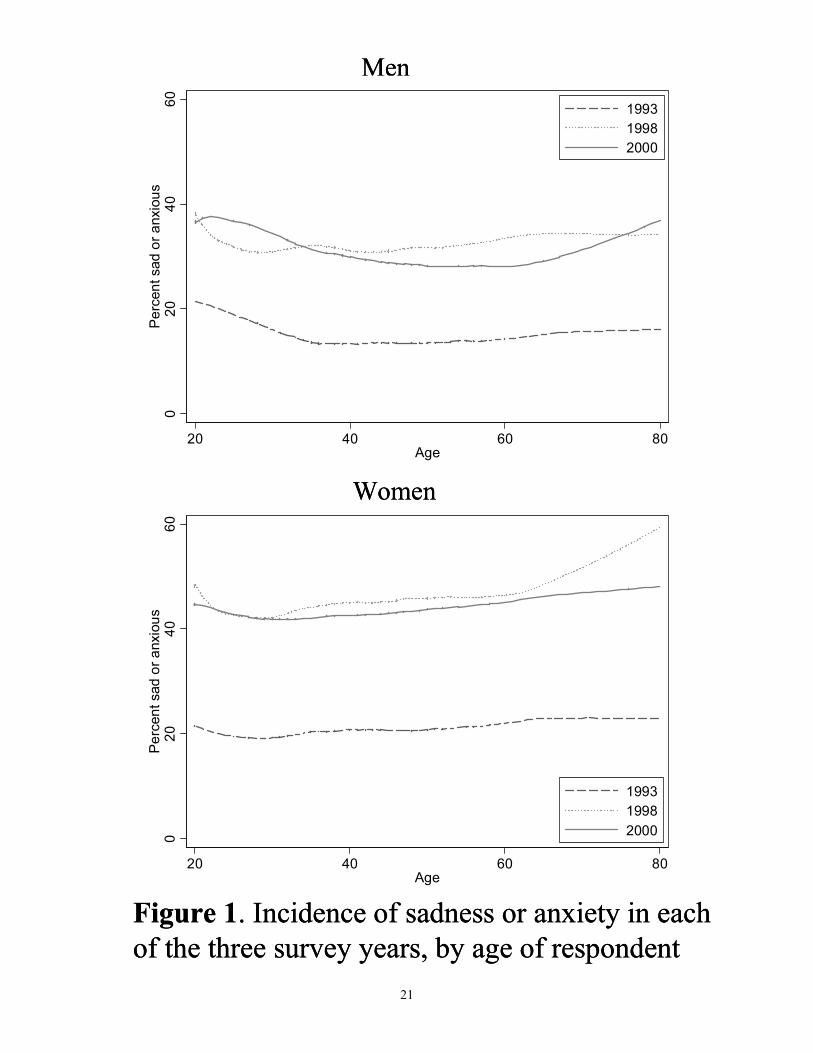
To explore the variation in psychological distress over the life course, Figure 1 provides non-
parametric estimates of the relationship between reporting either sadness or anxiety and age for males (in
the upper panel) and females (in the lower panel). The relationships are estimated separately for the three
waves of IFLS with the cross-section samples using locally weighted smoother scatter plots (Cleveland &
Devlin, 1988). The prevalence of sadness or anxiety varies little with age although prevalence rates are
higher among younger and older males in 1998 and 2000 and among older females in 1998. These modest
age differences are dwarfed by the dramatic shift upwards in the entire profile between 1993 and 1998. At
every age, the prevalence of sadness or anxiety approximately doubled between 1993 and 1998 indicating
a profound increase in psychological distress for adults across the entire age distribution. The estimates
for 1998 and 2000 are nearly co-incident indicating persistence of crisis effects on psychological health
across all ages, even as the Indonesian economy had begun to recover.
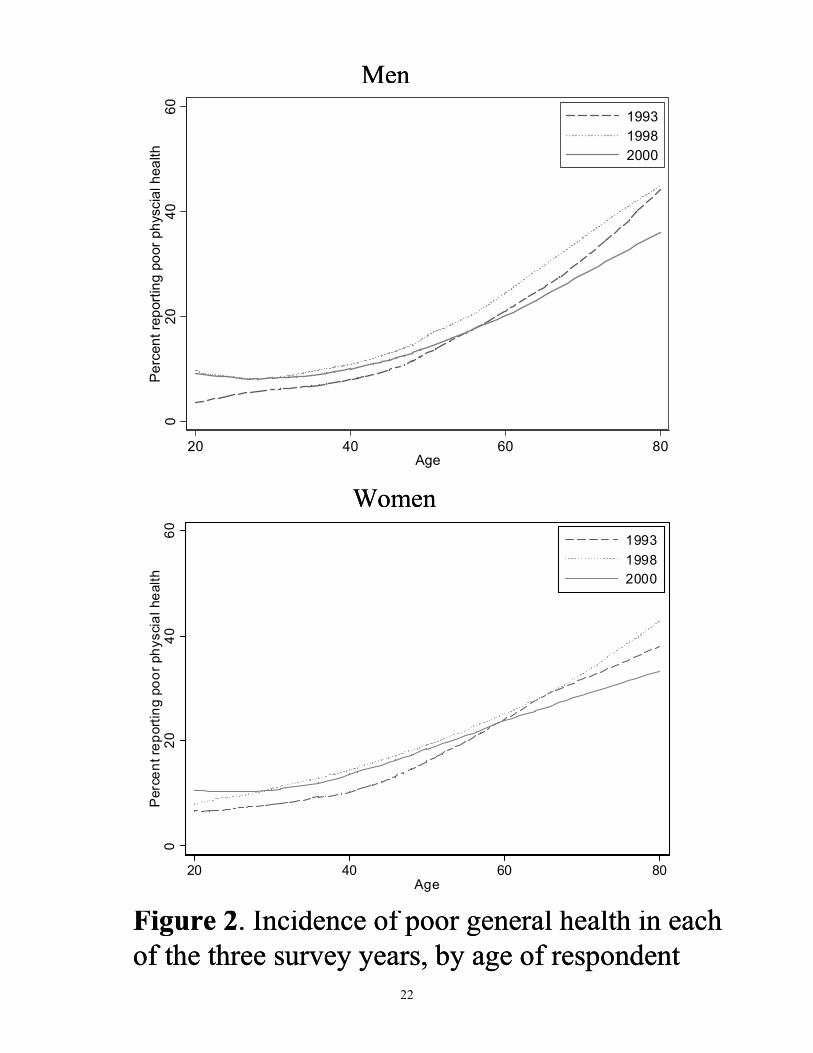
These results in Figure 1 stand in contrast to those in Figure 2, which present the same non-
parametric analysis this time for general health status. A clearer age gradient is readily observed in Figure
2 – as respondents age they are more likely to report poor general health. This result, consistent with the
broader empirical literature, highlights the different domains of well-being identified by GHS and by the
psychological health questions. Another difference concerns the relative lack change in the GHS measure
over the 1993-2000 period. There does appear to be an increase in reported poor general health in 1998 in

8
comparison to 1993, although one not close to the magnitude witnessed for the psychological distress
measures. Yet a third difference is a decline in poor GHS for middle-aged and older respondents between
1998 and 2000 while psychological distress remains at elevated levels. Understanding the determinants of
change in the GHS measure, especially the flattening of the age gradient from 1993 – 2000, lies beyond
the focus of this paper. What is clear is that the general and sustained rise in the population’s
psychological distress is not mirrored by changes in the population’s perceived general health.
Individual transitions in psychological distress and the crisis
We turn next to an investigation of the transitions into and out of psychological distress
exploiting the repeat observation dimension of the panel data to examine changes in well-being of the
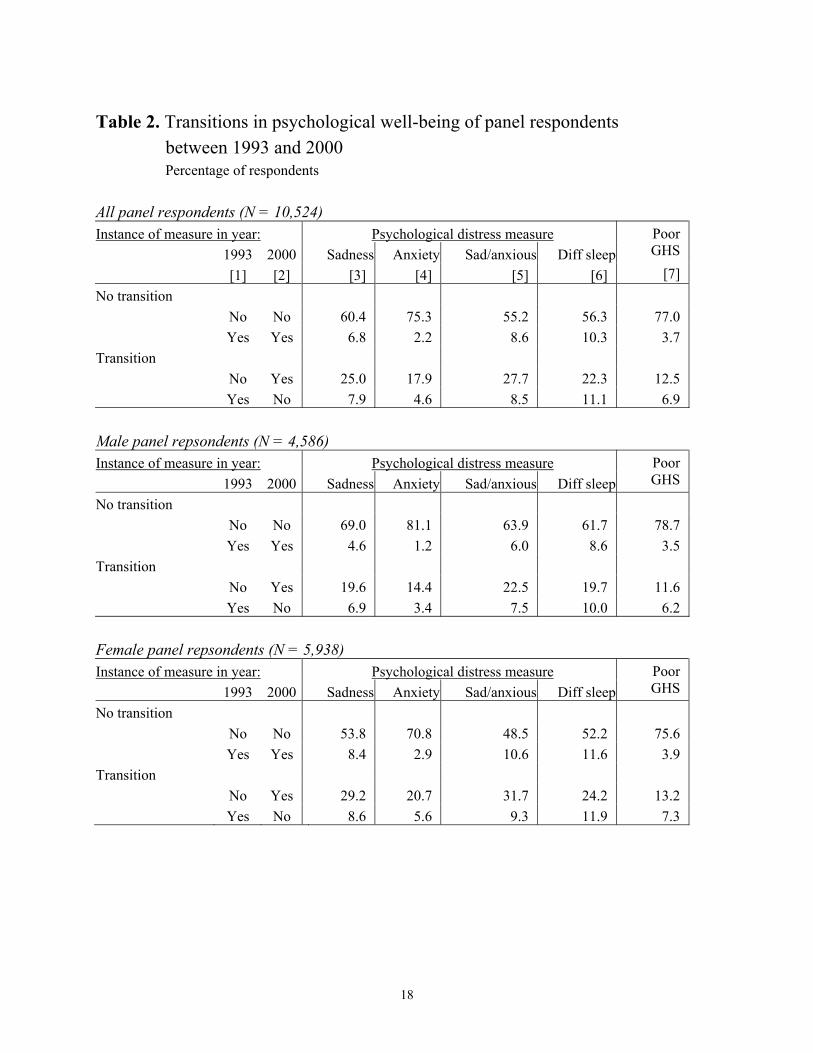
same individuals over time. Table 2 summarizes the results for transitions between 1993 and 2000. For
each measure of psychological distress, the percentage of people in each of four possible categories is
listed – those who report psychological distress in both survey years, those who report no distress in
either year, those who transit into distress and those who transit out of distress.
As is apparent in the aggregate data, a substantial fraction of males and females have transitioned
into being psychologically distressed during this period. However, over half the population – and in some
cases three-quarters – had no transitions with the vast majority of these people never reporting that they
felt psychological distress. A small but significant fraction of the population moved out of feeling
distressed during this period. For example, among the 12% of males who felt sad in 1993, over half did
not feel sad in 2000. Among the 17% of women who felt sad, half did not feel sad in 2000. At the same
time, about 20% of males and 30% of females moved from not feeling sad in 1993 to feeling sad in 2000.
The patterns are broadly similar for the other indicators of psychological well-being.9 Females are more
likely to transition into and out of distress and, in general, the fraction of the population that transitions
into psychological distress during this period is between 2 and 5 times greater than the fraction that
transitioned out of distress. In contrast with the psychological indicators, relatively few people transition
into poor health and around two-thirds of those who were in poor health in 1993 report they are not in
poor health in 2000.
Psychological distress and individual characteristics
The combination of measures of psychological well-being along with demographic and socio-
economic characteristics of individuals collected in IFLS between 1993 and 2000 provides unique
opportunities to identify those sub-groups of the population who are at elevated risk of suffering from
9 The patterns are also similar for transitions in the 25% sub-sample over the 1993 – 1998 period. When looking at the 1998 – 2000 period, the relative persistence of distress in contrast to either the 1993 – 2000 or 1993 – 1998 period is clear. The ratio of those individuals reporting distress in both 1998 and 2000 vis a vis those who transit out of a distressed state is higher than the same ratio calculated for the periods that span the crisis.
9
psychological distress. We use multivariate regression to identify those at greatest risk before and after
the onset of the crisis as well as those people who are most likely to transitioning into or out of
psychological distress.
We focus on the role of age, education and religion (all of which are measured in 1993) while
controlling gender in the models. Not all changes between 1993 and 2000 can be attributed to the 1997
crisis. We therefore also exploit the fact that the impact of the 1997 crisis differed dramatically across the
Indonesian archipelago and relate differences in responses to the crisis to a measure of the magnitude of
the crisis for the area in which each respondent was living in 1993. Specifically, we distinguish not only
province of residence but also those living in urban areas, the rural landed and rural landless households
because research on the crisis has demonstrated that the impact of the crisis differed substantially between
those who were net food producers and those who were net food consumers. Under the plausible
assumption that the crisis was unanticipated in 1993, the impact of location of residence in 1993 on
psychological distress can be interpreted as capturing impacts that are unrelated to responses to the
crisis.10
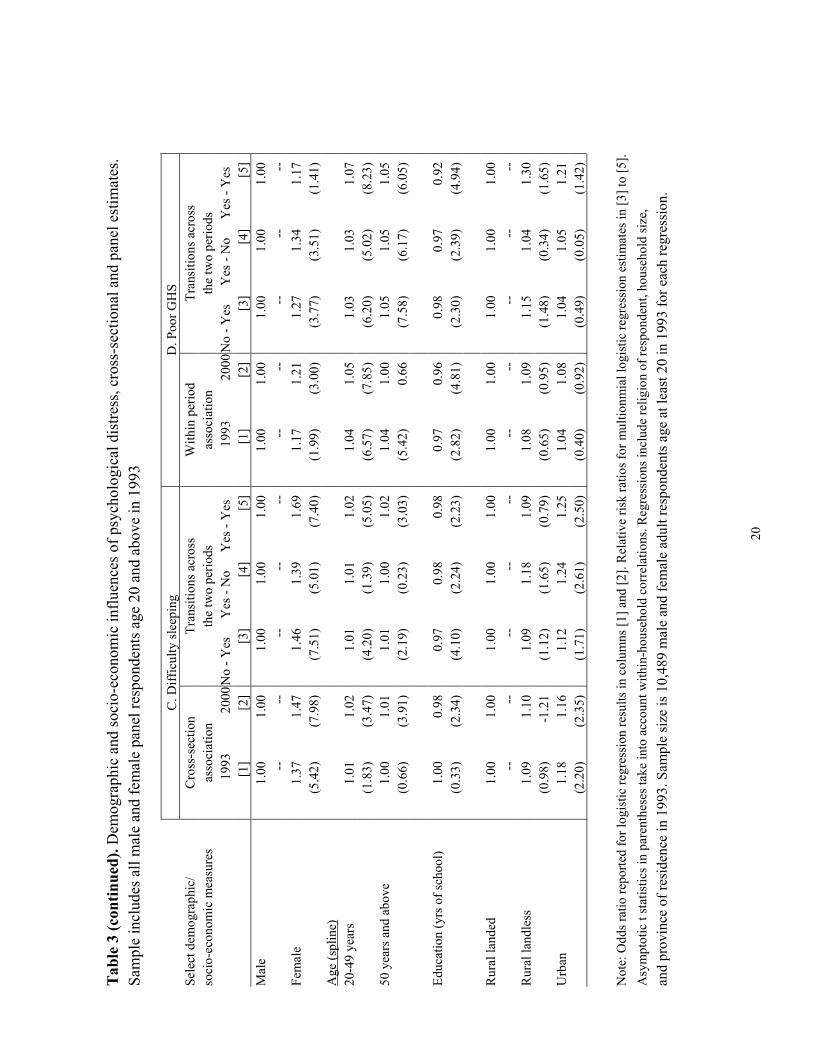
Regression results are reported in Table 3 for three indicators of psychological distress, sadness,
anxiety, and difficulty sleeping, and also for poor general health using the sample of respondents who
were age 20 in 1993 and interviewed in both 1993 and 2000. Columns 1 and 2 in each block examine the
correlates associated with psychological distress or poor health in 1993 and 2000, respectively. We report
odds ratios from logistic regressions with the dependent variable being unity if the respondent reports
being in poor psychological or physical health. Columns 3, 4 and 5 in each block report the results of the
transition models which are estimated by multinomial logistic regression. We report risk ratios relative to
not being in poor psychological or physical health in either 1993 or 2000. Standard errors take into
account correlations of unobserved factors that are common within households. The table presents results
for gender, age, education, and rural/urban location. Differences by province are summarized in Figure
2.11
10 The data affords a broader set of socio-economic controls than those included in these parsimonious specifications. We do not include measures of individual work (and therefore earnings) because they may be determined in part by contemporaneous psycho-social well-being (Ettner et al., 1997; Dooley et al., 2000) The same reasoning applies to measures of household resources such per capita expenditures, which is the combination of earnings (and other income) of each individual and the choice of living arrangements which may both influence and be influenced by psychological health. We assume the included socio-economic factors such as educational attainment, location of residence, and ownership of land are largely fixed before psycho-social well-being in 1993 is determined. 11 Religion is an important characteristic that may condition the experience and reporting of psychological distress indicators and is also mostly fixed over the crisis period. Indeed the multivariate analysis finds important differences in reported psychological well-being across Indonesia’s major religious groups – Muslim, Christian, and Hindu. It is difficult to understand exactly how religion affects the interpretation and expression of states of psychological distress, and indeed this task is beyond the scope of this paper. Nevertheless we include religion in our multivariate framework because of the revealed influence on our psychological distress indicators. If we exclude religion from the analysis, the coefficients on the other covariates are largely unchanged with the exception of the Bali province coefficient, where the vast majority of Indonesian Hindus reside.

10
As noted above, gender plays an important role in both the prevalence and the transitions of
psychological distress controlling other characteristics. Females are significantly more likely to report
being sad, anxious, suffering from sleep difficulties and being in poor general health in either survey year
than are males. In addition, females are significantly more likely to transit between states of poor
psychological or physical health (in either direction) and to remain in poor health in both survey years
than are males.
To allow for differential response among the young and old, age is modeled as a linear spline
function with a knot at 50 years of age. The influence of age varies with the particular psychological
distress indicator. For example, feelings of sadness do not appear to vary by age in either survey year,
although the probability of transiting from not being sad to being sad is an increasing function of age for
those aged 50 and over. Age is an important determinant of changes in anxiety, particularly the most
common transition from not being anxious prior to the crisis to being anxious after the onset of the crisis.
For this transition, the spline function indicates a U-shaped pattern where the probability of experiencing
anxiety in 2000, given no anxiety in 1993, first declines and then increases with age. These results
highlight an advantage of examining transitions in psychological well-being. As shown here, and in
Figure 1, there is little evidence that age is associated with the risk of being sad or anxious before or after
the onset of the crisis. However, older adults are slightly but significantly more likely to transition into
either state after the onset of the crisis. In terms of the other well-being measures, both sleep difficulties
and poor general physical health tend to increase with age and older adults are more likely to transition
into suffering from sleep difficulties or poor health.
Education, which is an indicator of socio-economic status, is measured by years of completed
schooling. Better educated adults are less likely to be sad both before and after the onset of the crisis –
with the latter effect being significant. The better educated are also less likely to transition into or out of
feeling sad indicating that education tends to protect against swings in feelings of sadness. The pattern for
sleep difficulties is essentially the same. The better educated are less likely to have difficulty sleeping
after the onset of the crisis and they are less likely to experience a transition into or out of sleeping
difficulties. The better educated tend to be in better general health in 1993 and 2000 and they are also less
likely to experience a transition into or out of poor general health.
The relationship between education and anxiety is different. In 1993, the association is not
significant. By 2000, the better educated are less likely to feel anxious. Similarly, the better educated are
significantly less likely to become anxious between 1993 and 2000 and they are significantly more likely
to transition from being anxious to not suffering from anxiety. Thus the crisis period witnessed a
disproportionate increase in anxiety among the less educated. Studies discussed above suggest the most
vulnerable groups during a crisis are the poorer and less educated groups. This is reflected in our evidence
for anxiety which likely most closely reflects concerns about economic insecurity.
11
The last three rows of Table 3 investigate the relationship between health and sector of residence
prior to the onset of the crisis. Rural dwellers who owned land in 1993 are the reference category. They
are, on average, the group that was most protected from the deleterious impact of the crisis because they
are net food producers and the relative price of foods rose dramatically during the crisis. Within the rural
sector, the landless were substantially more vulnerable to the negative impact of the crisis since they
relied on wage labor during a time when wages collapsed.
This difference in crisis vulnerability is apparent in the increasing relative likelihood of sadness
and/or anxiety for the rural landless. Before the crisis, the rural landless were neither more nor less likely
to report feelings of sadness or anxiety than the rural landed. Post-crisis, the landless were significantly
more likely to be sad or anxious and significantly more likely to transit into sadness or anxiety. The buffer
of land assets most likely protected landed households from severe income shocks and increased
psychological distress.
Urban residents have a consistently higher likelihood to report sadness, anxiety, or sleep
difficulties than landed rural residents before the crisis, and this is largely true after the crisis as well (with
the possible exception of anxiety where urban residents still have a higher likelihood of anxious feelings,
although the difference does not meet standard levels of significance). Urban residents are also more
likely to transition across states of psychological distress and non-distress than their rural counterparts.
Clearly, urban status influences the psychological distress indicators and constitutes an important
conditioning variable, however the relative importance of urban residence in determining psychological
health does not change over the crisis period, at least in relation to landed rural households.
Regional variations in psychological health transitions
Besides education or landlessness, region is another variable that mediates the severity of crisis
exposure. The previously cited studies that investigate the consequences of the crisis have noted large
geographic variations in crisis indicators such as inflation or declines in real household resources. That
literature highlights the important role of location within Indonesia in assessing the impact of the crisis on
well-being. For example provinces on the island of Java as well as southern provinces in Sumatra were
among the most affected while Bali, due to it’s reliance on tourism, and provinces to the east, due to the
importance of resource-intensive export industries, were comparatively less affected.
The spatial pattern in the changes in psychological distress indicators largely reflects these
geographic differences in crisis severity. The models reported in Table 3 include controls for province of
residence in 1993 (results not shown). As expected given the previous discussion, there are pronounced
differences in the psychological distress indicators by province of residence. This is the case even after
controlling for education, religion, and urban/rural location. In order to provide a context for interpreting
the differences in risk ratios for provinces based on the models in Table 3, we relate those effects to a
measure of the impact of the financial crisis.
12
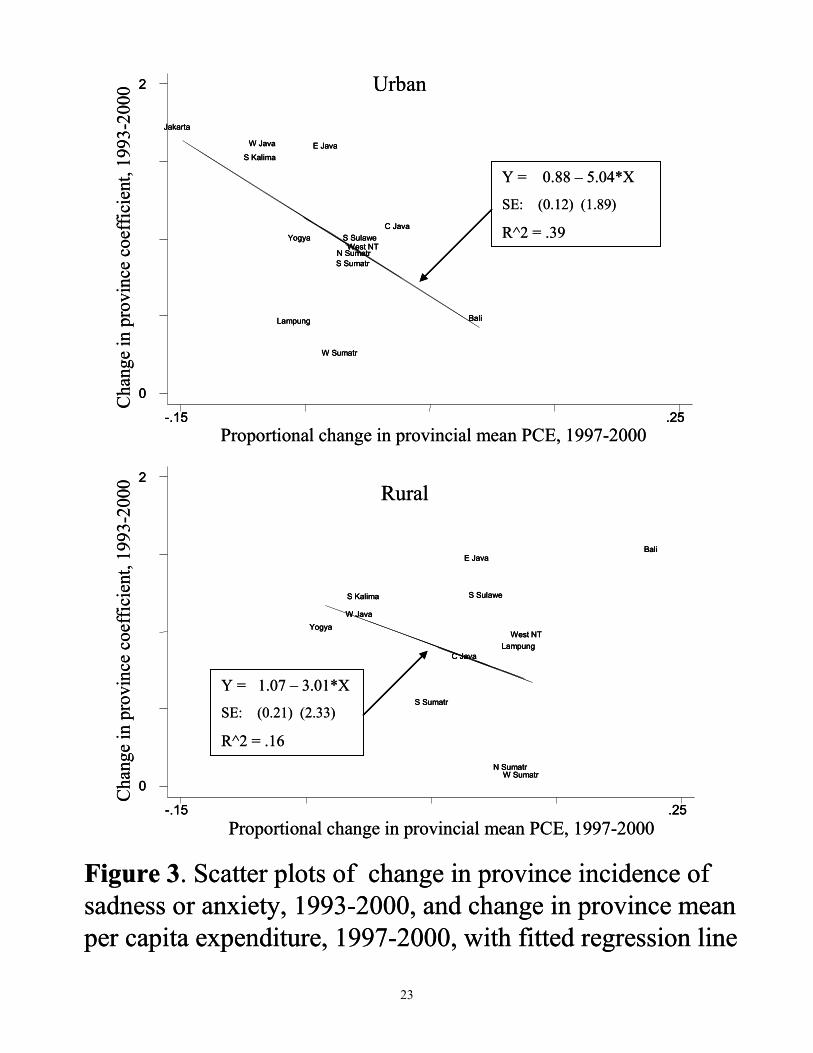
Results are reported in Figure 3 which relates the change in the estimated province effects
between 1993 and 2000 to the proportional change in the average level of household per capita
expenditure (PCE) at the province level between 1997 and 2000. The distress prevalence measure in
Figure 3 is unity if the respondent reports being sad or anxious and the province effects are based on
logistic regressions of the form reported in Table 3 except that the regressions are estimated separately for
urban and rural households.12
The results show a similar pattern for rural and urban areas although the relationship is more
pronounced in urban areas. Moving from left to right on the X-axis indicates higher levels of positive
change in PCE and, therefore, a more mild impact of the crisis. In urban areas, for the provinces included
in IFLS, Jakarta experienced a 15% decline in PCE between 1997 and 2000 whereas PCE rose in urban
Bali. An increase in the Y-axis indicates an increase in sadness or anxiety.
There is a positive relationship between crisis severity and change in relative prevalence of
psychological distress. Among urban areas, Jakarta, West Java, and South Kalimantan experienced the
largest declines in mean income and also exhibit the largest rise in relative prevalence of sadness or
anxiety. On the other end of the spectrum, Bali fared relatively well over the crisis period and also posts
one of the smallest increases in overall prevalence. This general relationship between crisis severity and
change in prevalence is also apparent in the fitted regression line which has a significantly negative slope
(in spite of our small sample size of 13) and an R-square statistic of 0.39. While the crisis affected the
psychological health of many Indonesians, those that lived in cities most affected by crisis experienced
the greatest increases in distress.
Rural residents in areas most affected by crisis also experienced the greatest increases in
psychological distress although the relationship is not as pronounced as that for urban residents, even after
we exclude the outlier of rural Bali (where relative distress increased substantially even though mean
household incomes increased by almost 25%). Rural Yogyakarta, West Java, and South Kalimantan
experienced negative or zero mean income growth over the 1997-2000 period and also witnessed some of
the largest increases in psychological distress. In contrast, North and West Sumatra, containing some of
the fastest growing rural areas, experienced the smallest increases in relative distress. Overall the
relationship between income growth and psychological distress is weaker in the rural areas than urban;
indeed the slope of the rural fitted regression line is not significant at conventional levels. This is, in part,
due to the fact that rural areas in general had not fared as poorly over the crisis period as urban areas had
for the reasons discussed earlier.13
12 The conclusions are unchanged if we look at the prevalence of sadness or anxiety separately, or pool urban and rural households. 13 Identical analysis investigating the covariation of GHS with provincial measures of crisis impact does not find any observable relationship.

13
Conclusions
The 1997 financial crisis was the most disruptive socio-economic event to confront Indonesians
for at least three or four decades, if not longer. The effects of the crisis were wide ranging. While some
households prospered given the new opportunities afforded by rapid price changes, shifts in the structure
of the economy and the political landscape, overall poverty increased and mean incomes fell. This study
is the first to look at the Indonesian crisis impacts on psychological health and it does so using a high
quality longitudinal socio-economic survey. We find that the severe economic dislocation and political
uncertainty engendered by the crisis adversely impacted psychological health in the overall population.
We document substantial increases in distress indicators at all ages and for either gender over the
crisis period. In addition, the imprint of the crisis on psychological well-being can be seen in the
relatively large increase in poor psychological health for those groups most adversely affected: the less
educated, the rural landless, and residents in regions hit hardest by crisis. Our analysis has focused on
characteristics such as age, gender, education, and location prior to the crisis in order to avoid the
difficulties associated with interpreting correlations with characteristics that might respond to the crisis.
Complications associated with co-determinacy arise in many studies of the relationship between
psychological health and economic outcomes such as labor force participation or income.
An additional important observation that emerges from this research concerns the persistence of
psychological distress from the immediate post-crisis period in 1998 to the recovery period in 2000. By
2000, mean household consumption had already recovered to 1997 levels and the overall economy had
returned to pre-crisis growth rates, however psychological distress remained at elevated levels. The
finding that psychological distress persists following an economic shock while income and consumption
recover suggests that psychological well-being is at least partially orthogonal to more standard measures
of economic welfare.
These standard measures include at least one common measure of subjective welfare: happiness.
The burgeoning literature on the economics of happiness (see Layard (2005) and Kahneman and Krueger
(2006) for reviews) commonly finds that an individual’s happiness measure rapidly habituates to changes
in income – any change in happiness as a result of a change in income is temporary and happiness soon
returns to the pre-change level. Clearly the findings here suggest, especially when considered alongside
other recent work on the persistence of psychological health changes resulting from life-events (Das &
Das, 2006; Stillman et al., 2006), that psychological health stands distinct from happiness and other
common subjective measures and may represent an independent domain of individual welfare.
This paper presents evidence that the internal life of the Indonesian population, as measured by
psychological distress indicators, suffered over the crisis period. Indeed when judged by the duration of
impact, population psychological health may have been one domain of welfare most affected by the crisis
and its aftermath.

14
References
Abas, Melanie A., and Jeremy C. Broadhead. 1997. “Depression and Anxiety Among Women in an Urban Setting in Zimbabwe”. Psychological Medicine, 27:59-71. Almeida-Filho, Naomar, and others. 1997. “Brazilian Multicentric Study of Psychiatric Morbidity: Methodological Features and Prevalence Estimates”. British Journal of Psychiatry, 171: 524-529. Awas, M., D. Kebede, A. Alem. 1999. “Major mental disorders in Butajira, southern Ethiopia”. Acta Psychiatr Scand, 100:56-64. Bir, Anupa and Richard G. Frank. 2001. “Mental Illness and the Labor Market in Developing Nations”. Commission on Macroeconomics and Health Working Paper Number 6, WHO. Cleveland, William and Susan Devlin. 1988. “Locally Weighted Regression: An Approach to Regression Analysis by Local Fitting”. JASA 83:596-610. Costello, E.J., S.N. Compton, G. Keeler, and A. Angold. 2003. “Relationships Between Poverty and Psychopathology: A Natural Experiment”. JAMA, 290(15):2023-2029. Das, J. and Das, V. 2006. Mental Health in Urban India: Patterns and Narratives. The World Bank. Processed. Das, Jishnu, Quy Toan Do, Jed Friedman, and David McKenzie. “Mental Health Patterns and Consequence: Results from Survey Data in Five Developing Countries”. 2007. Forthcoming Policy Research Working Paper Series. The World Bank. Das, Jishnu, Quy Toan Do, Jed Friedman, David McKenzie, and Kinnon Scott. Forthcoming. “Poverty and Mental Health in Developing Countries: Revisiting the Relationship”. Social Science and Medicine. Dooley, D., Prause, J., & Ham-Rowbottom, K. A. (2000). Underemployment and Depression: Longitudinal Relationships. Journal of Health and Social Behavior, 41(4), 421-436. Ettner, Susan L., Richard G. Frank, and Ronald C. Kessler. 1997. “The Impact of Psychiatric Disorders on Labor Market Outcomes” Industrial and Labor Relations Review, 51(1):64-81. Fadden, G. P. Bebbington, and L. Kuipers. 1987. “The Burden of Care: The Impact of Functional Psychiatric Illness on the Patient’s Family”. British Journal of Psychiatry, 150: 285-292. Frankenberg, Elizabeth, Duncan Thomas, and Kathleen Beegle. 1999. “The Real Costs of Indonesia’s Economic Crisis: Preliminary Findings from the Indonesia Family Life Surveys.” RAND Working Paper No. 99-04. Santa Monica, Calif. Frankenberg, Elizabeth, James P. Smith, and Duncan Thomas. 2003. “Economic Shocks, Wealth, and Welfare”. Journal of Human Resources, 38(2): 280-321. Frankenberg, Elizabeth, Jed Friedman, Thomas Gillespie, Duncan Thomas, and others. 2007. “Mental Health in Sumatra after the Tsunami”. Mimeo. Friedman, Jed and James Levinsohn. 2002. “The Distributional Impacts of Indonesia’s Financial Crisis on Household Welfare: A ‘Rapid Response’ Methodology”. The World Bank Economic Review, 16(3): 397-423.

15
Goldberg, D. 1972. The Detection of Psychiatric Illness by Questionnaire. London, Oxford University Press. Goldberg, D. and Y. LeCrubier. 1995. “Form and Frequency of Mental Disorders across Centres”. In Mental Illness in General Health Care: An International Study, edited by T.B. Ustun and N. Sartorius, John Wiley and Sons publishers. Joop, T.V. M. de Jong, et al. 2001. “Lifetime Events and Posttraumatic Stress Disorder in 4 Postconflict Settings”. JAMA, 286(5):555-562. Kessler, Ronald, Cindy Foster, William Saunders, and Paul Stang. 1995. “Social Consequences of Psychiatric Disorders, I: Educational Attainment”. American Journal of Psychiatry, 152(7):1026-1032. Kessler, R., G. Andrews, LJ Colpe, Hiripi E., and others. 2002. “Short screening scales to monitor population prevalences and trends in non-specific psychological distress”. Psychological Medicine, 32:959-976. Levinsohn, James, Steven Berry, and Jed Friedman. 2002. “The Impacts of the Indonesian Economic Crisis: Price Changes and the Poor”. In Managing Currency Crises in Emerging Markets, edited by Michael Dooley and Jeffrey A. Frankel, University of Chicago Press, Chicago. Pp. 393-428. Lopez, Alan D., Colin D. Mathers, Majid Ezzati, Dean T. Jamison, Christopher J. L. Murray. 2006. “Global Burden of Disease and Risk Factors”. Oxford University Press and World Bank. Patel, Vikram, Ricardo Araya, et al. 1999. “Women, Poverty and Common Mental Disorders in Four Restructuring Societies”. Social Science and Medicine 49: 1461-1471. Patel Vikram, and Michael Kleinman, 2003. “Poverty and Common Mental Disorders in Developing Countries”. Bulletin of the World Health Organization, 81(8): 609-615. Ravallion, Martin and Michael Lokshin. 2007. “Lasting Local Impacts of an Economywide Crisis”.Forthcoming, Economic Development and Cultural Change. Robins, L. and D. Regier. 1991. Psychiatric Disorders in America. The Free Press, New York. Saraceno, Benedetto and Corrado Barbui. 1997. “Poverty and Mental Illness”. Canadian Journal of Psychiatry. 42(3): 285-290. Stillman, S., D. McKenzie and J. Gibson. 2006. "Migration and Mental Health: Evidence from a Natural Experiment", BREAD Working Paper No. 123. Strauss, John, Kathleen Beegle, Agus Dwiyanto, and others. 2002. “Indonesian Living Standards Three Years after the Crisis: Evidence from the Indonesia Family Life Survey”. Manuscript. Sugar, Jonathan, Arthur Kleinman, and Kristian Heggenhougen. 1991. “Development’s ‘Downside’: Social and Psychological Pathology in Countries Undergoing Social Change”. Health Transitions Review, 1(2): 211-219. Suryahdi, Asep, Sudarno Sumarto, Yusuf Suharso, and Lant Pritchett. 2000. “The Evolution of Poverty During the Crisis in Indonesia, 1996-1999.” Policy Research Working Paper No. 2435. World Bank, Washington DC.
16
Tangcharoensathien, Viroj, et al. 2000. “Health Impacts of Rapid Economic Changes in Thailand”. Social Science and Medicine 51:789-807. Thomas, Duncan, Kathleen Beegle, Elizabeth Frankenberg, Bondan Sikoki, John Strauss,a nd Graciela Teruel. 2004. “Education in a Crisis”. Journal of Development Economics, 74(1): 53-85 Wang, Xiangdong, et al. 2000. “Post-earthquake quality of life and psychological well-being: Longitudinal evaluation in a rural community sample in Northern China”. Psychiatry and Clinical Neurosciences, 54:427-433. WHO International Consortium in Psychiatric Epidemiology. 2000. “Cross-national comparisons of the prevalences and correlates of mental disorders”. Bulletin of the World Health Organization, 78(4):413-426.
17
Table 1. Prevalence of psychological distress and poor heatlh Percentage of male and female respondents report health problem Respondents age 20 and older
MALES All respondents Panel respondents
Health 1993 1998 2000 1993 2000 indicator [1] [2] [3] [4] [5]
Psychological health Sad 12.0 28.9 27.5 11.4 24.2 Anxious 4.6 19.7 18.4 4.6 15.5 Sad or anxious 13.8 32.7 32.4 13.5 28.6 Difficulty sleeping 18.3 31.4 27.4 18.6 28.4 Fatigue 25.5 47.2 -- 25.2 -- Short temper 11.8 28.7 -- 11.7 -- Somatic pain 17.4 57.9 -- 17.0 --
General health status Poor general health 10.7 11.4 11.6 9.7 15.1
Sample size 5,629 2,928 10,128 4,598 4,598
FEMALES All respondents Panel respondents
Health 1993 1998 2000 1993 2000 indicator [1] [2] [3] [4] [5]
Psychological health Sad 15.8 41.0 37.5 17.1 37.6 Anxious 7.3 25.9 24.4 8.5 23.6 Sad or anxious 17.9 44.1 42.7 19.9 42.2 Difficulty sleeping 22.3 35.0 32.6 23.6 35.9 Fatigue 26.3 54.0 -- 28.5 -- Short temper 16.6 39.5 -- 18.1 -- Somatic pain 20.1 62.0 -- 21.6 --
General health status Poor general health 10.9 13.4 14.3 11.3 17.1
Sample size 6,892 3,222 11,271 5,957 5,957 Note: Prevalence estimates weighted to be population representative. Panel sample includes respondents age at least 20 in 1993 and interviewed in both 1993 and 2000
18
Table 2. Transitions in psychological well-being of panel respondents between 1993 and 2000 Percentage of respondents All panel respondents (N = 10,524) Instance of measure in year: Psychological distress measure 1993 2000 Sadness Anxiety Sad/anxious Diff sleep
Poor GHS
[1] [2] [3] [4] [5] [6] [7] No transition No No 60.4 75.3 55.2 56.3 77.0 Yes Yes 6.8 2.2 8.6 10.3 3.7 Transition No Yes 25.0 17.9 27.7 22.3 12.5 Yes No 7.9 4.6 8.5 11.1 6.9 Male panel repsondents (N = 4,586) Instance of measure in year: Psychological distress measure 1993 2000 Sadness Anxiety Sad/anxious Diff sleep
Poor GHS
No transition No No 69.0 81.1 63.9 61.7 78.7 Yes Yes 4.6 1.2 6.0 8.6 3.5 Transition No Yes 19.6 14.4 22.5 19.7 11.6 Yes No 6.9 3.4 7.5 10.0 6.2 Female panel repsondents (N = 5,938) Instance of measure in year: Psychological distress measure 1993 2000 Sadness Anxiety Sad/anxious Diff sleep
Poor GHS
No transition No No 53.8 70.8 48.5 52.2 75.6 Yes Yes 8.4 2.9 10.6 11.6 3.9 Transition No Yes 29.2 20.7 31.7 24.2 13.2 Yes No 8.6 5.6 9.3 11.9 7.3

Tab
le 3
. Dem
ogra
phic
and
soci
o-ec
onom
ic in
fluen
ces o
f psy
chol
ogic
al d
istre
ss, c
ross
-sec
tiona
l and
pan
el e
stim
ates
. Sa
mpl
e in
clud
es a
ll m
ale
and
fem
ale
pane
l res
pond
ents
age
20
and
abov
e in
199
3
A
. Sad
ness
B
. Anx
iety
Se
lect
dem
ogra
phic
/ C
ross
-sec
tion
Tran
sitio
ns a
cros
s W
ithin
per
iod
Tran
sitio
ns a
cros
s so
cio-
econ
omic
mea
sure
s as
soci
atio
n th
e tw
o pe
riods
as
soci
atio
n th
e tw
o pe
riods
1993
20
00N
o - Y
es
Yes
- N
o Y
es -
Yes
19
93
2000
No
- Yes
Y
es -
No
Yes
- Y
es
[1
] [2
] [3
] [4
] [5
] [1
] [2
] [3
] [4
] [5
] M
ale
1.00
1.
00
1.00
1.
00
1.00
1.
00
1.00
1.
00
1.00
1.
00
--
--
--
--
--
--
--
--
--
--
Fe
mal
e 1.
39
1.74
1.
88
1.59
2.
33
1.80
1.
54
1.61
1.
90
2.84
(4.9
0)
(11.
39)
(13.
06)
(6.1
5)
(9.7
4)
(5.8
0)
(7.6
2)
(8.7
2)
(6.2
4)
(6.6
7)
Age
(spl
ine)
20
-49
year
s 1.
00
1.01
1.
00
1.01
1.
00
0.99
1.
00
0.99
0.
99
0.98
(1.0
2)
(1.4
9)
(0.7
5)
(1.1
3)
(0.7
8)
(1.1
8)
(0.3
5)
(2.0
0)
(1.7
9)
(1.8
8)
50 y
ears
and
abo
ve
0.99
1.
00
1.01
0.
99
1.01
0.
98
1.00
1.
02
1.00
1.
01
(1
.14)
(1
.27)
(2
.51)
(0
.77)
(1
.09)
(1
.36)
(0
.15)
(4
.12)
(0
.42)
(0
.83)
Educ
atio
n (y
rs o
f sch
ool)
0.98
0.
98
0.97
0.
98
0.97
1.
02
0.98
0.
98
1.03
1.
01
(1
.82)
(3
.17)
(3
.74)
(2
.12)
(2
.57)
(1
.55)
(2
.94)
(3
.30)
(2
.25)
(0
.49)
Rur
al la
nded
1.
00
1.00
1.
00
1.00
1.
00
1.00
1.
00
1.00
1.
00
1.00
--
--
--
--
--
--
--
--
--
--
Rur
al la
ndle
ss
1.03
1.
17
1.19
1.
03
1.22
0.
86
1.15
1.
17
0.88
1.
30
(0
.30)
(2
.18)
(2
.43)
(0
.23)
(1
.54)
(0
.95)
(1
.65)
(1
.92)
(0
.73)
(1
.11)
U
rban
1.
32
1.17
1.
16
1.41
1.
47
1.54
1.
10
1.12
1.
48
1.66
(3.1
5)
(2.4
5)
(2.3
4)
(3.5
6)
(3.7
6)
(3.5
3)
(1.3
1)
(1.6
4)
(3.3
6)
(2.8
1)
N
ote:
Odd
s rat
io re
porte
d fo
r log
istic
regr
essi
on re
sults
in c
olum
ns [1
] and
[2].
Rel
ativ
e ris
k ra
tios f
or m
ultio
nmia
l log
istic
regr
essi
on e
stim
ates
in [3
] to
[5].
Asy
mpt
otic
t st
atis
tics i
n pa
rent
hese
s tak
e in
to a
ccou
nt w
ithin
-hou
seho
ld c
orre
latio
ns. R
egre
ssio
ns in
clud
e re
ligio
n of
resp
onde
nt, h
ouse
hold
size
, an
d pr
ovin
ce o
f res
iden
ce in
199
3. S
ampl
e si
ze is
10,
489
mal
e an
d fe
mal
e ad
ult r
espo
nden
ts a
ge a
t lea
st 2
0 in
199
3 fo
r eac
h re
gres
sion
.
19
20
--
--
--
--
[2]
[1
] [2
]
Tab
le 3
(con
tinue
d). D
emog
raph
ic a
nd so
cio-
econ
omic
influ
ence
s of p
sych
olog
ical
dis
tress
, cro
ss-s
ectio
nal a
nd p
anel
est
imat
es.
Sam
ple
incl
udes
all
mal
e an
d fe
mal
e pa
nel r
espo
nden
ts a
ge 2
0 an
d ab
ove
in 1
993
C. D
iffic
ulty
slee
ping
D
. Poo
r GH
S Se
lect
dem
ogra
phic
/ C
ross
-sec
tion
Tran
sitio
ns a
cros
s W
ithin
per
iod
Tran
sitio
ns a
cros
s so
cio-
econ
omic
mea
sure
s as
soci
atio
n th
e tw
o pe
riods
as
soci
atio
n th
e tw
o pe
riods
1993
20
00N
o - Y
es
Yes
- N
o Y
es -
Yes
19
93
2000
No
- Yes
Y
es -
No
Yes
- Y
es
[1]
[3
] [4
] [5
]
[3]
[4]
[5]
Mal
e 00
1.
00
00
1.00
1.
00
1.00
1.
00
1.00
00
00
1.
1.1.
1.--
--
--
--
--
--
--
--
Fe
mal
e 37
1.
47
46
1.39
1.
69
1.17
1.
21
1.27
34
17
1.
1.1.
1.
2)
(78)
1)
(5
1)
(70)
(1
9)
(30)
(3
7)
1)
1)
(5.4
.9(7
.5.0
.4.9
.0.7
(3.5
(1.4
Age
(spl
ine)
20
-49
year
s 01
1.
02
01
1.01
1.
02
1.04
1.
05
1.03
03
07
1.
1.1.
1.
3)
(37)
0)
(1
9)
(55)
(6
7)
(75)
(6
0)
2)
3)
(1.8
.4(4
.2.3
.0.5
.8.2
(5.0
(8.2
50 y
ears
and
abo
ve
00
1.01
01
1.
00
1.02
1.
04
1.00
1.
05
05
05
1.1.
1.1.
6)
(3
1)
9)
(03)
(3
3)
(52)
(78)
7)
5)
(0
.6.9
(2.1
.2.0
.40.
66.5
(6.1
(6.0
Ed
ucat
ion
(yrs
of s
choo
l) 00
0.
0.
97
0.
98
0.
96
98
0.97
1.98
980.
970.
0.0.
92
3)
(24)
0)
(2
4)
(23)
(2
2)
(41)
(2
0)
9)
4)
(0.3
.3(4
.1.2
.2.8
.8.3
(2.3
(4.9
R
ural
land
ed
00
1.00
00
1.
00
1.00
1.
00
1.00
1.
00
00
00
1.1.
1.1.
--
--
--
--
--
--
--
--
Rur
al la
ndle
ss
09
1.10
09
1.
18
1.09
1.
08
1.09
1.
15
04
30
1.1.
1.1.
8)
1
2)
(15)
(0
9)
(05)
(0
5)
(18)
4)
5)
(0
.9-1
.2(1
.1.6
.7.6
.9.4
(0.3
(1.6
Urb
an
18
12
1.
24
1.25
1.
04
1.08
1.
04
05
21
1.1.
161.
1.1.
0)
(2
5)
1)
(21)
(2
0)
(00)
(0
2)
(09)
5)
2)
(2
.2.3
(1.7
.6.5
.4.9
.4(0
.0(1
.4
Not
e: O
dds r
atio
repo
rted
for l
ogis
tic re
gres
sion
resu
lts in
col
umns
[1] a
nd [2
]. R
elat
ive
risk
ratio
s for
mul
tionm
ial l
ogis
tic re
gres
sion
est
imat
es in
[3] t
o [5
].A
sym
ptot
ic t
stat
istic
s in
pare
nthe
ses t
ake
into
acc
ount
with
in-h
ouse
hold
cor
rela
tions
. Reg
ress
ions
incl
ude
relig
ion
of re
spon
dent
, hou
seho
ld si
ze,
and
prov
ince
of r
esid
ence
in 1
993.
Sam
ple
size
is 1
0,48
9 m
ale
and
fem
ale
adul
t res
pond
ents
age
at l
east
20
in 1
993
for e
ach
regr
essi
on.
Men
Women
Figure 1. Incidence of sadness or anxiety in each of the three survey years, by age of respondent
020
4060
Per
cent
sad
or a
nxio
us
20 40 60 80Age
199319982000
020
4060
Per
cent
sad
or a
nxio
us
20 40 60 80Age
199319982000
Men
Women
Figure 1. Incidence of sadness or anxiety in each of the three survey years, by age of respondent
020
4060
Per
cent
sad
or a
nxio
us
20 40 60 80Age
199319982000
020
4060
Per
cent
sad
or a
nxio
us
20 40 60 80Age
199319982000
21
Men
Women
Figure 2. Incidence of poor general health in each of the three survey years, by age of respondent
020
4060
Per
cent
repo
rting
poo
r phy
scia
l hea
lth
20 40 60 80Age
199319982000
020
4060
Per
cent
repo
rting
poo
r phy
scia
l hea
lth
20 40 60 80Age
199319982000
Men
Women
Figure 2. Incidence of poor general health in each of the three survey years, by age of respondent
020
4060
Per
cent
repo
rting
poo
r phy
scia
l hea
lth
20 40 60 80Age
199319982000
020
4060
Per
cent
repo
rting
poo
r phy
scia
l hea
lth
20 40 60 80Age
199319982000
22
Proportional change in provincial mean PCE, 1997-2000
Proportional change in provincial mean PCE, 1997-2000
Cha
nge
in p
rovi
nce
coef
ficie
nt, 1
993-
2000
Cha
nge
in p
rovi
nce
coef
ficie
nt, 1
993-
2000
Urban
Rural
Figure 3. Scatter plots of change in province incidence of sadness or anxiety, 1993-2000, and change in province mean per capita expenditure, 1997-2000, with fitted regression line
Y = 0.88 – 5.04*X
SE: (0.12) (1.89)
R^2 = .39
Y = 1.07 – 3.01*X
SE: (0.21) (2.33)
R^2 = .16
-.15 .25
0
2
N Sumatr
W Sumatr
S Sumatr
Lampung
Jakarta
W Java
C JavaYogya
E Java
Bali
West NT
S Kalima
S Sulawe
-.15 .25
0
2
N SumatrW Sumatr
S Sumatr
Lampung
W Java
C Java
Yogya
E JavaBali
West NT
S Kalima S Sulawe
Proportional change in provincial mean PCE, 1997-2000
Proportional change in provincial mean PCE, 1997-2000
Cha
nge
in p
rovi
nce
coef
ficie
nt, 1
993-
2000
Cha
nge
in p
rovi
nce
coef
ficie
nt, 1
993-
2000
Urban
Rural
Figure 3. Scatter plots of change in province incidence of sadness or anxiety, 1993-2000, and change in province mean per capita expenditure, 1997-2000, with fitted regression line
Y = 0.88 – 5.04*X
SE: (0.12) (1.89)
R^2 = .39
Y = 1.07 – 3.01*X
SE: (0.21) (2.33)
R^2 = .16
-.15 .25
0
2
N Sumatr
W Sumatr
S Sumatr
Lampung
Jakarta
W Java
C JavaYogya
E Java
Bali
West NT
S Kalima
S Sulawe
-.15 .25
0
2
N Sumatr
W Sumatr
S Sumatr
Lampung
Jakarta
W Java
C JavaYogya
E Java
Bali
West NT
S Kalima
S Sulawe
-.15 .25
0
2
N SumatrW Sumatr
S Sumatr
Lampung
W Java
C Java
Yogya
E JavaBali
West NT
S Kalima S Sulawe
-.15 .25
0
2
N SumatrW Sumatr
S Sumatr
Lampung
W Java
C Java
Yogya
E JavaBali
West NT
S Kalima S Sulawe
23

24
Appendix Table 1. IFLS psychological and general physical health status questions Indicators of Psychological distress In the last four weeks, have you… a. experienced sadness? 1. often 2. sometimes 3. never b. experienced anxiety or fear? 1. often 2. sometimes 3. never c. had a hard time sleeping? 1. often 2. sometimes 3. never d. felt fatigue or exhaustion?* 1. often 2. sometimes 3. never e. been short-tempered or hypersensitive?* 1. often 2. sometimes 3. never f. felt bodily pains?* 1. often 2. sometimes 3. never (*not asked in 2000) Indicator of general health status In general, how is your health? 1. very healthy 2. somewhat healthy 3. somewhat unhealthy 4. very unhealthy