province of mpumalanga department of public works, … · annual 1. province of mpumalanga...
TRANSCRIPT

ANNUAL
1
PROVINCE OF MPUMALANGA
DEPARTMENT OF PUBLIC WORKS, ROADS AND TRANSPORT
Vote No. 08
ANNUAL REPORT2012/13
Annual Report 201213.indb 1 8/19/2013 7:56:22 AM

ANNUAL
2
CONTENTSPART A: GENERAL INFORMATION 3
1. GENERAL INFORMATION 4 2. LIST OF ABBREVIATIONS/ACRONYMS 43. STRATEGIC OVERVIEW 5
3.1. Vision 5 3.2. Mission 5 3.3. Values 5 3.4. Strategic outcome orientated goals 5
4. LEGISLATIVE AND OTHER MANDATES 65. ORGANISATIONAL STRUCTURE 76. FOREWORD BY MEC 87. OVERVIEW OF THE ACCOUNTING OFFICER 10
PART B: PERFORMANCE INFORMATION 11
1. STATEMENT OF RESPONSIBILITY FOR PERFORMANCE INFORMATION 122. AUDITOR GENERAL’S REPORT: PREDETERMINED OBJECTIVES 133. OVERVIEW OF DEPARTMENTAL PERFORMANCE 13
3.1. Service Delivery Environment 13 3.2. Organisational environment 14 3.3. Key policy developmentents and legislative changes 15
4. STRATEGIC OUTCOME ORIENTED GOALS 155. PERFORMANCE INFORMATION BY PROGRAMME 15
5.1. Programme 1: Administration 15 5.2. Programme 2: Public Works 17 5.2. Programme 3: Transport Infrastructure 22 5.2. Programme 4: Transport Operations 25 5.2. Programme 5: Community Based Programmes 30
6. SUMMARY OF FINANCIAL INFORMATION 32 6.1. Departmental receipts 32 6.2. Programme Expenditure 33 6.3. Conditional grants and earmarked funds received 33 6.4. Capital investment, maintenance and asset management plan 34
PART C: GOVERNANCE 51
1. INTRODUCTION 522. RISK MANAGEMENT 523. FRAUD AND CORRUPTION 524. MINIMISING CONFLICT OF INTEREST 525. CODE OF CONDUCT 526. HEALTH SAFETY AND ENVIRONMENTAL ISSUES 53
PART D: HUMAN RESOURCE MANAGEMENT 55
1. LEGISLATURE THAT GOVERN HR MANAGEMENT 562. INTRODUCTION 563. HUMAN RESOURCE OVERSIGHT STATISTICS 57
3.1. Personnel related expenditure 57 3.2. Employment and Vacancies 58 3.3. Job Evaluation 60 3.4. Employment Changes 61 3.5. Employment Equity 66 3.6. Performance Rewards 69 3.7. Foreign Workers 71 3.8. Leave utilisation 72 3.9. HIV/AIDS and Health Promotion Programmes 73 3.10. Labour Relations 74 3.11. Skills developmentent 75 3.12. Injury on duty 76
PART E: FINANCIAL INFORMATION 77
Annual Report 201213.indb 2 8/19/2013 7:56:22 AM

ANNUAL
3
PART A: GENERAL INFORMATION
Annual Report 201213.indb 3 8/19/2013 7:56:25 AM

ANNUAL
4
1. GENERAL INFORMATION
Physical Address: Department of Public Works, Roads and Transport Building No. 7
Riverside Government Complex Government Boulevard Nelspruit 1200
Postal Address: Mpumalanga Provincial GovernmentDepartment of Public Works, Roads and TransportPrivate Bag X11302
Nelspruit 1200
Telephone Number: +27 13 766 6696Fax Number: +27 13 766 8453Website Address: dpwrt.mpg.gov.za
2. LIST OF ABBREVIATIONS/ACRONYMS
AFS Annual Financial StatementsAGSA Auditor General of South AfricaAPP Annual Performance PlanBBBEE Broad Based Black Economic EmpowermentCFO Chief Financial OfficerCIDB Construction Industry Development BoardCOGTA Cooperative Governance and Traditional AffairsDCSR Department of Culture, Sports and Recreation DoE Department of EducationDoH Department of HealthDPSA Department of Public Service and AdministrationDPWRT Department of Public Works, Roads and TransportDSD Department of Social DevelopmentEPWP Expanded Public Works ProgrammeEWP Employee Wellness ProgrammeEXCO Executive CouncilFFP Fraud Prevention PlanGMT Government Motor TransportHDI Historical Disadvantaged IndividualHIV/ Aids Human immune-deficiency virus/ acquired immune-deficiency syndromeHOD Head of DepartmentHRM Human Resource ManagementHRU&CD Human Resource Utilisation and Capacity DevelopmentICTIDT
Information Communication TechnologyIndependent Development Trust
IPMP Implementation Project Management PlanIRMA Integrated Rural Mobility and AccessibilityIRPTN Integrated Rapid Public Transport NetworkIRS Integrated Reporting SystemIT Information TechnologyMEC Member of Executive CouncilMMS Maintenance Management SystemMPAT Management Performance Assessment ToolMTEF Medium Term Expenditure FrameworkNYS National Youth ServicesOLAS Operating Licence Administrative SystemOSD Occupation Specific DispensationPAIA Promotion of Access to Information Act
Annual Report 201213.indb 4 8/19/2013 7:56:25 AM

ANNUAL
5
PFMA Public Finance Management ActPLWDPWD
People Living With DisabilitiesPeople With Disabilities
PMU Project Management UnitRAMS Road Asset Management SystemRGC Riverside Government ComplexTB Tuberculoses UAMPVO
User Asset Management PlansVariation Order
WOE Women Owned Enterprise
3. STRATEGIC OVERVIEW
3.1. Vision
An integrated transport system and infrastructure that promotes socio-economic development.
3.2. Mission
To effectively and efficiently implement all mandates relating to-
• traffic management*;• asset and property management;• public and freight transport; and • roads and building infrastructure to the benefit of all end-users.
3.3. Values
Service Excellence An exceptional service delivery is required to attain the goals of the Department
Innovation Is required to ensure that the processes utilised remain state of the art and allows the Department to attain its goals
Accountability Being answerable and responsible for its actions to the public
Integrity Being honest, truthful and straightforward in dealing with the community and acting in a manner beyond reproach
Diversity Accepting and acknowledging the cultural mix of its community
Team Work Continuously cooperating and collaborating with all spheres of Government and stakeholders
Best Practice Applying international best practice methods and good corporate governance in dealings
Loyalty Expressing allegiance to community, central Government and the people of South Africa
Value for Money All the customers paying for the real value attained
3.4. Strategic outcome orientated goals
• To manage resources prudently • To provide, manage and maintain building and transport infrastructure • To ensure effective public and freight transport management • To coordinate the implementation of the EPWP 2 in the Province • To continually improve our systems and procedures
* The mandate relating to traffic management is now implemented by the Department of Community Safety, Security and Liaison as of November 2011.
Annual Report 201213.indb 5 8/19/2013 7:56:25 AM

ANNUAL
6
4. LEGISLATIVE AND OTHER MANDATES
• Architectural Profession Act, 2000 (Act No. 44 of 2000)• Basic Conditions of Employment Act, 1997 (Act No. 75 of 1997)• Broad-Based Black Economic Empowerment Act, 2003 (Act No. 53 of 2003)• Compensation for Occupational Injuries and Diseases Act, 1993 (Act No. 130 of 1993)• Constitution of the Republic of South Africa,1996• Construction Industry Development Board Act, 2000 (Act No. 38 of 2000)• Council for the Built Environment Act, 2000 (Act No. 43 of 2000)• Criminal Procedure Act, 1977 (Act No. 51 of 1977)• Deeds Registries Act, 1997 (Act No. 47 of 1997)• Division of Revenue Act, 2008 (Act No. 2 of 2008)• Electronic Communications Act, 2005 • Electronic Communications and Transition Act, 2002 (Act No. 25 of 2002)• Electronic Communications Security (PTY)LTD Act, 2002 (Act No. 68 of 2002) • Employment Equity Act, 1998 (Act No. 55 of 1998)• Engineering Profession Act, 2000 (Act No. 46 of 2000)• Environment Conservation Act, 1989 (Act No. 73 of 1989)• Firearm Control Act, 2000 (Act No. 60 of 2000)• Government Immovable Asset Management Act, 2007 (Act No. 19 of 2007)• Labour Relations Act, 1995 (Act No. 66 of 1995)• Landscape Architectural Profession Act, 2000 (Act No. 45 of 2000)• Mpumalanga Roads Act, 2008• Mpumalanga Road Traffic Act, 1998 (Act No. 4 of 1998)• National Archives of South Africa Act, 1996 (Act No. 43 of 1996)• National Building Regulations and Building Standards Amendment Act, 1995 (Act No. 49 of 1995)• National Environmental Management, 2008 (Act No. 62 of 2008)• National Heritage Council Act, 1999 (Act No. 11 of 1999)• National Heritage Resources Act, 1999 (Act No. 25 of 1999)• National Land Transport Transition Act, 2009 (Act No. 5 of 2009)• National Road Traffic Act, 1996 (Act No. 93 of 1996)• National Waste Management Act, 1996 (Act No. 59 of 2008)• Occupational Health and Safety Act, 1993 (Act No. 85 of 1993)• Preferential Procurement Policy Framework Act, 2000 (Act No. 5 of 2000)• Prevention and Combating of Corrupt Activities Act, 2004 (Act No. 12 of 2004)• Project and Construction Management Professions Act, 2000 (Act No. 48 of 2000)• Promotion of Administrative of Justice Act, 2000 (Act No. 3 of 2000)• Promotion of Access to Information Act, 2000 (Act No. 2 of 2000)• Property Valuers Profession Act, 2000 (Act No. 47 of 2000)• Public Finance Management Act,1999 (Act No. 1 of 1999)• Public Service Act, 1994 (Proclamation No. 103 of 1994)• Quantity Surveying Profession Act, 2000 (Act No. 49 of 2000)• Road Transportation Act, 1977 (Act No. 74 of 1977)• Skills Development Act, 1998 (Act No. 97 of 1998)• Skills Development Levies Act, 1999 (Act No. 9 of 1999)• South African Qualifications Authority Act, 1995 (Act No. 58 of 1995)• South African Schools Act, 1996 (Act No. 84 of 1996)• State Information Technology Agency Act, 1998 (Act No. 88 of 1998)• Town and Regional Planning Act, 2002 (Act No. 36 of 2002)• Transport Appeal Tribunal Act, 1998 (Act No. 39 of 1998)• Transvaal Roads Ordinance, 1957 (Ordinance No. 22 of 1957)
Annual Report 201213.indb 6 8/19/2013 7:56:25 AM

ANNUAL
7
5. ORGANISATIONAL STRUCTURE
MEC:DG MAHLANGU
STRATEGIC MANAGEMENT: GENERAL MANAGER:
TF NTULI (ACTING)
HOD:KM MOHLASEDI
DDG: CORPORTE SERVICES:W MTHOMBOTHI
DDG: PUBLIC FREIGHT TRANSPORT: (VACANT)
DDG: INFRASTRUCTURE: M MOROLO
Financial Management Government Motor Transport District Services Integrated Planning Human Resource Management
and Development
Public Transport and Freight Programme Management UnitBuilding InfrastructureProperty ManagementRoads InfrastructureCommunity Based Programme
Internal AuditCommunicationLegal ServicesSecurity Services
Annual Report 201213.indb 7 8/19/2013 7:56:29 AM

ANNUAL
8
6. FOREWORD BY THE MEC
It is with great sense of honour and pride that I am once again afforded the opportunity to present the Department of Public Works, Roads and Transport Annual Report for the 2012/13 financial year. The Department continued to strive to achieve its vision of providing an integrated transport system and infrastructure that promotes socio-economic development. The Annual Report presents a platform for the Department to demonstrate to the public how commitments and plans made over the previous financial year have been achieved. Although several challenges were encountered during the year under review, I am happy with the overall achievement by the Department.
Infrastructure delivery remains a key priority area in achieving the growth and developmental imperatives of the Province. The Department completed a number of key infrastructure projects, including the Provincial Archives Building, Hluvukani Community Health Centre just to mention a few. In all, a total number of 124 building infrastructure projects were completed on behalf of 4 client Departments.
In addition, the following roads Infrastructure projects were completed, construction of Goromane Bridge, upgrading of the road from Mooiplaas to Ekulindeni (9.6 km); upgrading of road D1869 and D1870 between Marloth Park and Komatipoort (18.5 km) and numerous roads that provide reliable access to communities of Mpumalanga.
To stimulate the Provincial economy, a coordinated infrastructure development cannot be overemphasised. In this regard the Department has developed the Mpumalanga Infrastructure Master Plan (MIMP) in order to translate our policy, strategy and planning outputs into tangible deliverables. MIMP builds on and informs other infrastructure strategies and plans, and it is a critical element in delivering integrated and value-for-money infrastructure.
The Department commenced with the roll-out of the new scholar transport vehicles in Gert Sibande and Bohlabela districts. By 31 March 2013, 55 vehicles had been introduced in the Gert Sibande (45) and Bohlabela (10) districts respectively. The roll-out will ensure that the management and administration of scholar transport involves the school governing bodies. In order to ensure effective utilization of scholar transport, adherence to the Mpumalanga Scholar Transport Policy is required. In this regard the support of parents and the school principals is essential.
The Expanded Public Works Programme (EPWP) remains a flagship in the creation of job opportunities, enterprise and skills development. To this end, a total of 85 024 job opportunities were created across the Province. Local and emerging contractors also benefited from the increased capital investment related to this programme. The Department will continue to facilitate the mainstreaming of EPWP through the four sectors: infrastructure; social; environment & culture; and non-state sector. However, there is still a need to improve EPWP coordination across all sectors. An Integrated Reporting System (IRS) was inproduced to improve overall reporting on this strategic programme.
In the year ahead, we will increase our capacity to plan, implement, monitor and provide the required oversight on project delivery. We will also review various policies to strengthen internal controls, systems and processes to enhance good governance. In addition, we will continue to address issues raised in the Auditor General’s report in an endeavour to achieve a clean audit in 2013/14 financial year.
In conclusion I would like to thank the Head of Department and entire staff for their steadfast commitment and hard work towards the realization of our mandate. The role and commitment of the Department is critical in ensuring that the burden of unemployment, poverty and inequalities is minimized. By working together, I believe we will continue to make a difference in the lives of people of Mpumalanga.
______________DG Mahlangu MEC of the Department of Public Works, Roads and Transport Date: 31 July 2013
Annual Report 201213.indb 8 8/19/2013 7:56:29 AM

ANNUAL
9
7. OVERVIEW OF THE ACCOUNTING OFFICER
The Annual Report for the financial year 2012/13 reflects on the Department of Public Works, Roads and Transport performance against the set targets. The report also demonstrates the Department’s capacity to implement its programs towards the achievement of its set strategic objectives.
The Department provided its services in a competitive environment where costs and demands are constantly increasing. Notwithstanding this, we managed our fiscal responsibility prudently and delivered on our target outputs within the constraints of
the Departmental resources. The total expenditure for the Department was R3,523,082,000 against a budget of R3,527,481, 000 thus indicating a surplus of R 4,399,000 at year end. This information is reflected in the comprehensive Annual Financial Statement included in this report.
During the year under review, the Department improved on the following core administrative competencies:
• Signing of performance agreements which improved from 98.6% to 99.7%. This is mandatory and critical in tracking individual staff performance. Furthermore, it enabled the various business units to align their operations to the strategic direction of the Department.
• Human resources management through enhancement of the internship and other capacity building initiatives.
• Good governance based on several routine audits on financial and operational areas within the Department.
• Timeous responding to all formal requests for access to Departmental records under the Promotion of Access to Information and Act 2000 (PAIA).
The Department will continue to improve governance of public infrastructure delivery by implementing more efficient project planning, coordination and program management. This includes the use of Information Technology (IT) developed and web-enabled tools such as Road Asset Management System (RAMS) and Maintenance Management System (MMS), etc. These systems will provide scientifically established data to guide and inform infrastructure planning, budgeting and forecasting.
In addition to the IT planning tools, we are committed to developing high-quality transport modeling tools that assess the different modes of transport options to support evidence-based planning across Mpumalanga. This will be done to ensure that mobility of the citizens is enhanced.
The Department will also improve its governance and management systems to support strong decision making. Furthermore, the Department will develop improvement plans based on an assessment of the 2012/13 performance.
One of the Department’s key priorities for 2013–14 is to rebuild the rural access road network to make it better and safer. The Department will increase its contribution to the improvement of mobility within the rural parts of the Province. To this end, infrastructure plans to address challenges facing municipalities, flood damaged infrastructure and improving access to social facilities such as schools and hospitals has been developed. Plant and equipment will be procured in order to enhance the capacity of the Department to provide the necessary Municipal Support.
I want to thank the MEC for Public Works, Roads and Transport for her continued support to the administration of the Department. I am exceptionally proud of the hard work and dedication of our staff – none of our projects or outcomes could be delivered without them. I would also like to thank the Audit Committee for its advice on governance, risk management and internal control practices.
_______________KM MOHLASEDI Accounting OfficerDate: 31 July 2013
Annual Report 201213.indb 9 8/19/2013 7:56:30 AM

ANNUAL
10
Annual Report 201213.indb 10 8/19/2013 7:56:31 AM

ANNUAL
11
PART B: PERFORMANCE INFORMATION
Annual Report 201213.indb 11 8/19/2013 7:56:35 AM

ANNUAL
12
1. STATEMENT OF RESPONSIBILITY FOR PERFORMANCE INFORMATION
The Accounting Officer is responsible for the preparation of the Department’s performance information and for the judgements made in this information.
The Accounting Officer is responsible for establishing, and implementing a system of internal control designed to provide reasonable assurance as to the integrity and reliability of performance information.
In my opinion, the performance information fairly reflects the performance information of the Department for the financial year ended 31 March 2013.
_______________KM MOHLASEDIAccounting OfficerDate: 31 July 2013
Annual Report 201213.indb 12 8/19/2013 7:56:35 AM

ANNUAL
13
2. AUDITOR GENERAL’S REPORT: PREDETERMINED OBJECTIVES
The AGSA currently performs the necessary audit procedures on the performance information to provide reasonable assurance in the form of an audit conclusion. The audit conclusion on the performance against predetermined objectives is included in the report to management, with material findings being reported under the Predetermined Objectives heading in the Report on other legal and regulatory requirements section of the auditor’s report.
Refer to Part E: Financial Information for the Report of the Auditor General.
3. OVERVIEW OF DEPARTMENTAL PERFORMANCE
3.1 Service delivery environment
An integrated transport system and infrastructure that promotes socio-economic development is vital for achieving job creation, efficient transportation of commuters and learners and access to goods and services. During 2012/13, many factors influenced the Department’s ability to deliver its mandate, including the following:
World-wide economic activity slowing down The global economic meltdown presented new challenges, requiring a strong response from Governments around the world – and Mpumalanga was no exception. In such an economic turmoil climate, it was important to invest in capital projects that would stimulate local economic growth while providing a sustainable environment for the much needed employment and business opportunities. These investments did not only help the public to weather the current economic situation but formed the foundation of a stronger future for South Africa as a whole. During 2012/13 the Department had approximately 251 active projects (including 231 from client Departments) of which 128 were completed.
Technical skills shortageThe shortage of technical skills and capacity in South Africa has been identified as one of the main impediments to achieving the stated economic growth and productivity rates of the Government. The history of the current situation can be partly traced back to the apartheid regime. In this era, there was total negligence of developing the marginalized groups. Also, there has been brain drain from the country’s skills base due to emigration to other countries. The private sector has compounded the matter by poaching the best of what the public service can offer through competitive remuneration packages. Within the Department, this challenge was addressed by a number of strategies including: training of employees, affirmative action, Occupation Specific Dispensation (OSD), etc.
OverloadingDue to the large traffic volumes and heavy loads on coal haul roads, the condition of these roads is worse than the rest of the provincial road network. As part of a Government initiative to safeguard sustainable energy provision, special funding was made available to rehabilitate and maintain the coal haul road network. The purpose of this funding is to maintain the condition of the coal haulage routes at minimum acceptable standards and mitigate the onset of deterioration in ways that provide the “least cost over the life-cycle” of the infrastructure. The Mpumalanga Provincial Government and other Government agencies collaborated with private sector to rehabilitate and maintain the coal haulage network.
Increasing access to free and quality education The Constitution guarantees the right of all South Africans to a basic education. Government is therefore bound by the Constitution to provide compulsory schooling and progressively improved learning conditions and access to learning institutions. In support of this, the Department made a provision for Scholar Transport Services. However during the year, this budget came under pressure mainly due to learners being transported further distances and with identification of new routes. The shortfall was addressed through internal budget adjustments.
Reporting on job creationOver the past 12 months, Mpumalanga created a total of 85 024 job opportunities through projects undertaken by the State, Organs of the State, Provincial departments and municipalities. As a result, an incentive grant of R56,049,000 (R16,617,000 DPWRT) was disbursed to the various role players during the year under review. The Province however failed to derive maximum benefit from this grant due to under reporting in most instances. Public Works, Roads and Transport as lead Department for coordinating EPWP in the Province will introduce various reporting reforms in the next financial year.
Annual Report 201213.indb 13 8/19/2013 7:56:35 AM

ANNUAL
14
3.2 Organisational environment
The past year has been one of significant challenges, with severe budget constrains emanating from the 2011/12 accruals. The Department’s capacity to deliver essential services was threatened and these include amongst others: improvement of security measures at the Riverside Government Complex (RGC), provision of scholar transport services, maintenance of yellow fleet and other equipment, maintenance of buildings and road network as well as the coordination of the expanded public works programme.
To counter this, major interventions with minimal impact on service delivery were introduced during the year. Amongst these were: cost curtailment measures - resulted in savings that were used to settle part of the accruals, reduction in the number of posts to be filled – only critical posts were prioritized and streamlining of the Department’s operations – eliminated redundancies and wastage which ensured value for money spent. Lastly, minor alignments were made on the plans to accommodate the above-mentioned intervention.
In the 2012/13 financial year, measures were introduced to enhance an ethical workplace culture through the design, development and roll out of relevant policies, processes and procedural systems to raise ethical awareness and prevent misconduct. The Policy Unit conducted a series of policy advocacy and ethics sessions to provide employees with the relevant information and materials to assist in making better-informed decisions.
To complete the above, all circulars from National Treasury and the other public bodies were considered during the year. Amongst these, was the DPSA’s directive for abolishment of unfunded posts on the Personnel and Salary System (PERSAL). The clean-up was intended to identify and remove unfunded vacant posts from organizational establishments so that there is reliable data about the total number of public servants and “real” vacancy rate.
Since 2009/10, the Department has seen an increase in the proportion of women, and people with disabilities within its workforce. In 2012/13, women made up 39.5 percent; women in senior management made up 34 per cent and 2.4 per cent of the workforce were made up of people with disabilities. Refer to Figure 01 for analysis on Employment Equity performance.
Figure 01: Employment equity performance
0
10
20
30
40
50
2009/10 2010/11 2011/12 2012/13
% Women inDepartment% Women in SMSposition
0
0.5
1
1.5
2
2.5
3
2009/10 2010/11 2011/12 2012/13
% People with Disability inDepartment% of People with Disabilityin SMS position
Annual Report 201213.indb 14 8/19/2013 7:56:35 AM

ANNUAL
15
3.3 Key policy developments and legislative changes
List of transversal policies/manuals developed and reviewed in the 2012/13 financial year:Policy developed Policy reviewed Policy manuals developedAdvance Policy Information Technology (IT) Policy Performance Management
Procedure ManualSports Policy Recruitment Policy Procedure Manual for Leave
PolicySubsidised Transport PolicyTelephone and Cellphone PolicyUniform and Protective Clothing Policy
4. STRATEGIC OUTCOME ORIENTED GOALS
The table below describes the Department’s strategic outcome oriented goals as reflected in the Strategic Plan and the progress made towards the achievement of these goals.
Goal Progress to dateTo manage resources prudently
• Spent 100% of the budget allocation• 100% of invoices paid within 30 days of receipt• 99.7 % of performance agreements signed
To provide, manage and maintain building and transport infrastructure
• Developed 5 Infrastructure Project Implementation Plans (IPIPs)• Finalized the planning and design of 150 building and 7 roads
infrastructure projects• Completed 124 buildings and 3 roads projects • Updated the provincial immovable assets with 99 assets
To ensure effective transport operations management
• Subsidized 6 bus operators to enable affordable and accessible public transport
• Provided financial assistance to the Provincial Taxi Council (R 6 million)• Contracted 101 operators to transport learners 66 615 learners• Completed 1 infrastructure project in support of non-motorized transport
To coordinate the implementation of the EPWP 2 in the Province
• Created 85 024 job opportunities • Enrolled 600 beneficiaries on National Youth Service (NYS) co-operatives• Registered 14 NYS co-operatives
To continually improve our systems and procedures
• Audit action plan developed to address the issues raised by Auditor General
• Risk register developed and monthly evaluations conducted on management of identified risks
Progress towards achievement of National Development Plan priorities and Outcome 6 In pursued of employment and economic priorities, tremendous strides were made in the delivery of responsive infrastructure network. These served as a catalyst for provincial economic growth and job creation. Details of the achievements are contained in the latter part of this report. The Province has also completed the inaugural Mpumalanga Infrastructure Master Plan which will guide provincial future capital investments.
5. PERFORMANCE INFORMATION BY PROGRAMMES
The following section provides performance information per programme. Reasons for non-material variances (less than 2%) are not provided.
5.1. PROGRAMME 1: ADMINISTRATION
Purpose
The purpose of the Programme is to provide the Department with administrative, strategic, financial and corporate support services in order to ensure that it delivers on its mandate in an integrated, efficient, effective and sustainable manner.
Sub-programmes
• Office of the MEC• Management of the Department• Corporate Support
Annual Report 201213.indb 15 8/19/2013 7:56:35 AM

ANNUAL
16
Strategic objectives
• To optimally utilise financial and physical resources• To provide integrated communication services• To improve risk management, control and good governance• To establish and manage the trading account for the Provincial fleet
Strategic objectives, performance indicators, planned targets and actual achievementsStrategic objective
Actual achievement 2011/2012
Planned target2012/2013
Actual achievement2012/2013
Deviation from planned target to actual achievement for 2012/2013
Comment on deviations
To optimally utilise financial and physical resources
99% Expenditure 100% Expenditure
100% Expenditure
None None
To provide integrated communication services
71 000 Newsletters
50 000 Newsletters
50 000 Newsletters
None None
To improve risk management, control and good governance
Unqualified audit opinion
Unqualified audit opinion
Awaiting audit opinion
None None
To establish and manage the trading account for the Provincial fleet
Trading Account not yet established
Trading Account established
Trading Account not established
Trading Account not established
Funding for billing system not secured
Summary of reasons for deviations
• Delays in establishment of a trading accountThere were budgetary constraints emanating from the accruals of 2011/12 financial year. As a result the Department could not secure a revolving or working capital fund to kick start the billing which is required for the recovery of fleet costs from client Departments. Alternative billing systems will be explored to ensure cost effective provision and use of fleet assets.
Programme performance indicatorsPerformance indicator
Actual achievement 2011/2012
Planned target2012/2013
Actual achievement2012/2013
Deviation from planned target to actual achievement for 2012/2013
Comment on deviations
% of Invoices received and paid within 30 days
99% 100% 100% None None
Total amount of revenue collected
R 22,2 Million
R48 million
R26 million
R22 million
Refer to summary of reasons for deviations
% of Performance Agreements signed
98.6% 100% 99.7% 0.3% None
Number of interns recruited
45 20 20 None None
Number of learners recruited
39 20 None 20 Not implemented due to budgetary constraints
Annual performance plan approved
Annual Performance Plan approved
Annual Performance Plan
Annual Performance Plan: 2013/14 approved
None None
Annual Report 201213.indb 16 8/19/2013 7:56:35 AM

ANNUAL
17
Performance indicator
Actual achievement 2011/2012
Planned target2012/2013
Actual achievement2012/2013
Deviation from planned target to actual achievement for 2012/2013
Comment on deviations
Annual report compiled
Annual report printed and tabled
Annual report Annual report: 2011/12 tabled
None None
Summary of reasons for deviations
• Under collection of revenue The projection for revenue collection was based on MTEF trends which were done before
the transfer of Traffic Management to the Department of Community Safety, Security and Liaison.
• Budgetary constraints The spill-over effect of the 2011/12 accruals resulted in a budget deficit for Programme 1.
As a result, the Learnership Programme was suspended in the 2012/13 financial year.
Strategies to overcome areas of under performance Areas of under performance Strategies to overcome areas of under performanceAppointment of learners Future targets will be set high to compensate for the under-achievement
of 2012/13 financial year.Collection of revenue To address this, all revenue sources will be re-analyzed to ensure realistic
target setting. Furthermore, the Department applied and was granted approval to be registered as a revenue collection agency for rentals on all state owned houses. This will commence in the 2013/14 financial year.
Linking performance with budgetsThe Programme had accruals of R18, 943 million from the 2011/12 financial year which resulted in budgetary constraints for the financial year 2012/13. The non-appointment of learners (20) can be directly attributed to the resultant budgetary constraints. Notwithstanding this, the available budget was used efficiently to achieve other Programme’s outputs.
Sub-programme expenditureSub- programme name
2012/2013 2011/2012Final appropriationR’000
ActualexpenditureR’000
(Over)/ under expenditureR’000
Final appropriationR’000
ActualexpenditureR’000
(Over)/ under expenditureR’000
Office of the MEC
7,675 7,620 55 5,919 5,919 0
Management of the Department
3,534 3,440 94 3,281 3,242 39
Corporate Support
333,062 332,894 168 445,079 445,047 32
TOTAL 344,271 343,954 317 454,279 454,208 71
5.2. PROGRAMME 2: PUBLIC WORKS
Purpose
The purpose of the Programme is to provide a balanced and equitable provincial government building infrastructure by promoting accessibility that is sustainable, integrated and environmentally sensitive which supports economic development and social empowerment.
Sub-programmes
• Programme Support • Design• Construction• Maintenance• Property Management
Annual Report 201213.indb 17 8/19/2013 7:56:36 AM

ANNUAL
18
Strategic objectives
• To provide effective infrastructure programme management services• To provide project planning and design services• To provide effective infrastructure implementation• To maintain Provincial immovable assets and equipment• To manage the immovable property and facility portfolio
Strategic objectives, performance indicators, planned targets and actual achievementsStrategic objective
Actual achievement 2011/2012
Planned target2012/ 2013
Actual achievement2012/ 2013
Deviation from planned target to actual achievement for 2012/2013
Comment on deviations
To provide effective infrastructure Programme management services
4 IPMPs received 6 IPMPs received 5 IPMPs received -1 IPMP not received
Non submission by DCSR
To provide project planning and design services
134 Designs 142 Designs 150 Designs 8 Designs Additional projects received from client Departments
To provide effective infrastructure implementation
321 Projects registered
130 Projects registered
27 Projects registered
-103 Projects notregistered
Registered only those projects advertised and implemented by DPWRT
To maintain Provincial immovable assets and equipment
5 428 Immovable assets
5 428 Immovable assets
5 527 Immovable assets
99 Immovable Assets
More assets identified and received from National Public Works
To manage the immovable property and facility portfolio
Updated asset register
Updated asset register
Asset register updated
None None
Summary of reasons for deviations
• Non-registration of projects on CIDB’s Register of Projects exceeding R200 000 By law, clients must within one month of the award of the project register it on the CIDB’s
Register of Projects. In compliance with this, 27 of the advertised building infrastructure projects were registered with CIDB using i-Tender. This figure excludes projects that were allocated to IDT and Sakh’abakhi or implemented by the Department of Education.
• More immovable assets identified More properties were identified through physical verification and additional projects were
received from National Public Works. Subsequently, the asset register was updated with these assets.
Programme performance indicatorsPerformance indicator
Actual achievement 2011/2012
Planned target2012/2013
Actual achievement2012/2013
Deviation from planned target to actual achievement for 2012/2013
Comment on deviations
Sub-programme: Planning and DesignNumber of infrastructure project management plans received
4 IPMPs 6 (IPMPs received (DOH, DSD, DOE, DCSR, DEDET and DCSSL)
5 (DOH, DSD, DOE, DEDET and DCSSL)
-1(DCSR)
Non submission by DCSR
Annual Report 201213.indb 18 8/19/2013 7:56:36 AM
ANNUAL
19
Performance indicator
Actual achievement 2011/2012
Planned target2012/2013
Actual achievement2012/2013
Deviation from planned target to actual achievement for 2012/2013
Comment on deviations
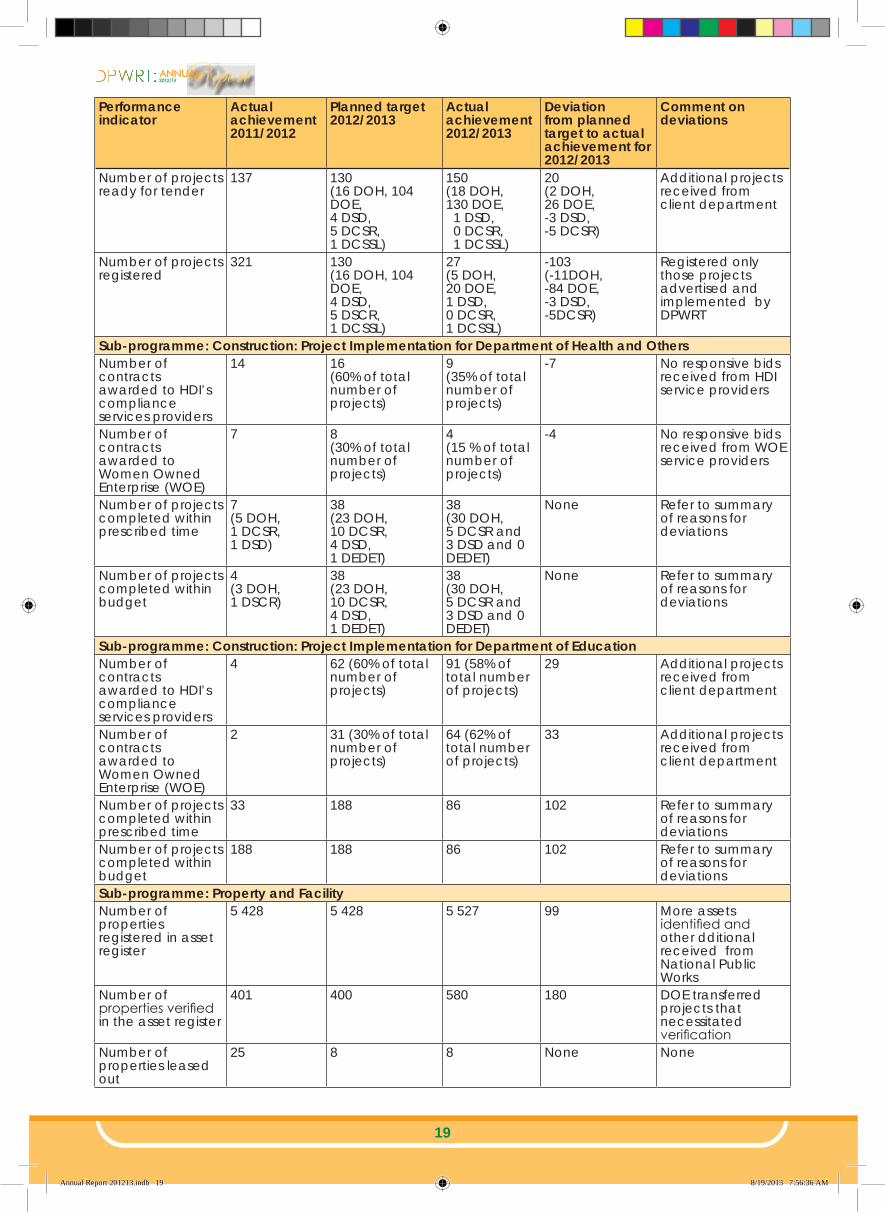
Number of projects ready for tender
137 130 (16 DOH, 104 DOE, 4 DSD,5 DCSR,1 DCSSL)
150(18 DOH, 130 DOE, 1 DSD, 0 DCSR, 1 DCSSL)
20(2 DOH,26 DOE,-3 DSD, -5 DCSR)
Additional projects received from client department
Number of projects registered
321 130 (16 DOH, 104 DOE, 4 DSD,5 DSCR,1 DCSSL)
27(5 DOH,20 DOE, 1 DSD,0 DCSR,1 DCSSL)
-103(-11DOH,-84 DOE, -3 DSD,-5DCSR)
Registered only those projects advertised and implemented by DPWRT
Sub-programme: Construction: Project Implementation for Department of Health and OthersNumber of contracts awarded to HDI’s compliance services providers
14 16 (60% of total number of projects)
9(35% of total number of projects)
-7 No responsive bids received from HDI service providers
Number of contracts awarded to Women Owned Enterprise (WOE)
7 8(30% of total number of projects)
4(15 % of total number of projects)
-4 No responsive bids received from WOE service providers
Number of projects completed within prescribed time
7(5 DOH,1 DCSR,1 DSD)
38(23 DOH, 10 DCSR,4 DSD,1 DEDET)
38 (30 DOH, 5 DCSR and 3 DSD and 0 DEDET)
None Refer to summary of reasons for deviations
Number of projects completed within budget
4(3 DOH,1 DSCR)
38(23 DOH, 10 DCSR,4 DSD,1 DEDET)
38 (30 DOH, 5 DCSR and 3 DSD and 0 DEDET)
None Refer to summary of reasons for deviations
Sub-programme: Construction: Project Implementation for Department of EducationNumber of contracts awarded to HDI’s compliance services providers
4 62 (60% of total number of projects)
91 (58% of total number of projects)
29 Additional projects received from client department
Number of contracts awarded to Women Owned Enterprise (WOE)
2 31 (30% of total number of projects)
64 (62% of total number of projects)
33 Additional projects received from client department
Number of projects completed within prescribed time
33 188 86 102 Refer to summary of reasons for deviations
Number of projects completed within budget
188 188 86 102 Refer to summary of reasons for deviations
Sub-programme: Property and Facility Number of properties registered in asset register
5 428 5 428 5 527 99 More assets identified and other dditional received from National Public Works
Number of properties verified in the asset register
401 400 580 180 DOE transferred projects that necessitated verification
Number of properties leased out
25 8 8 None None
Annual Report 201213.indb 19 8/19/2013 7:56:36 AM

ANNUAL
20
Performance indicator
Actual achievement 2011/2012
Planned target2012/2013
Actual achievement2012/2013
Deviation from planned target to actual achievement for 2012/2013
Comment on deviations
Number of request received for new accommodation from user Departments in UAMP
None 5 5 None None
Number of new accommodation funding approved by PT
None None None None No set target
Number of residential properties leased-out
1 100 1 098 1 098 None None
Number of buildings in a very good state
None 7 44 37 Fewer projects assessed due to budgetary constraints. Refer to summary for reasons of deviations
Number of buildings in the average state
None 833 701 -132
Number of buildings in a poor state
None 47 109 62
Number of leases concluded in respect of provincially owned properties
76 1 111 1 179 68 New properties identified during the vesting process
Number of lease agreements in respect of office accommodation not renewed
5 10 1 -9 No responsive bids for alternative office accommodation
Number of properties acquired
5 3 1 -2 Properties not acquired due to budgetary constraints
Number of new commercial leases concluded
None 5 21 16 Leases for Pilgrim’s Rest not part of the target, but included in achievement
Number of tenders awarded for bill board advertising on road reserves
None None None None Bill board advertising not allowed on road reserves as stated in the Mpumalanga Roads Act
Summary of reasons for deviations
• Over-achievement on number of projects ready for tender The Department received a list of urgent projects for implementation from client
departments. However, not all of these projects went through the tender process because term contractors were appointed in accordance with procurement procedures and with the client Department’s approval.
• Non-responsive bids on some infrastructure projects Some of the bids received did not respond to the HDI and WOE requirements.
• More education projects awarded to HDI companies The client department prioritized an additional 26 projects during the year hence there were
more projects that were awarded to HDI companies.
Annual Report 201213.indb 20 8/19/2013 7:56:36 AM

ANNUAL
21
• Failure to complete projects on time and budget Client Departments faced increasing constraints on their resources as they battle to prioritize
between infrastructure investments and delivering their core mandates. Contractual and institutional problems were also identified as significant causes behind cost and time overruns.
• Condition assessment done on fewer buildingsThe building stock was assessed to obtain information about the condition of buildings, costs to bring them into good condition; plans for repairs, renovations and replacements. However, focus was limited to the public works portfolio due to budgetary constraints.
• No responsive bids received for alternative office accommodationA total number of 14 bids were advertised for alternative office accommodation as per client departments’ requests. However, there was only 1 successful bid meaning that the rest of the existing contracts could not be terminated before securing alternative accommodation.
• Budget shortfallsThe plan to acquire 2 hospitals on behalf of DoH was put on hold due to shortfalls within their budget.
• Commercial leases concludedThe lease agreements for Pilgrim’s Rest were planned for conclusion in 2011/12. However, they were delayed due to legal and procurement challenges. As a result, the target for 2012/13 could not be corrected timeously.
Strategies to overcome areas of under performance Areas of under performance Strategies to overcome areas of under performanceRegistration of projects on CIDB Identify projects during planning that will be implemented and
reported by other implementing agencies.Awarding of contracts to HDI and WOE companies
Align reporting and awarding of contracts as per the new BBBEE ratings.
Project implementation Reform the overall planning processes and introduction of cost review programmes to ensure quicker delivery of projects.
Condition assessment on buildings Increase scope to the other available portfolios such as roads and other buildings. This will be complemented by adequate budgeting.
Termination of office accommodation leases
The sector has since removed the related indicator due to its inappropriateness.
Acquisition of properties Proper planning and adequate budgetingCommercial leases Sector has since removed the related indicator due to its
inappropriateness.
Linking performance with budgets
The Programme had accruals of R14, 767 million from the 2011/12 financial year which resulted in budgetary constraints for the financial year 2012/13. The failure to do condition assessment on all planned properties can be directly attributed to the resultant budgetary constraints. Nevertheless, the available budget was used efficiently to achieve other programme’s outputs.
Sub-programme expenditureSub- programme Name
2012/2013 2011/2012Final appropriationR’000
ActualexpenditureR’000
(Over)/ under expenditureR’000
Final appropriationR’000
ActualexpenditureR’000
(Over)/ under expenditureR’000
Programme Support
2,970 2,970 0 3,240 3,227 13
Design 15,188 15,188 0 12,672 12,653 19
Construction 25,449 25,386 63 19,498 19,505 -7
Maintenance 17,976 17,893 83 18,297 18,261 36
Property Management
463,744 463,709 -35 384,880 384,903 -23
TOTAL 525,327 525,146 181 438,587 438,549 38
Annual Report 201213.indb 21 8/19/2013 7:56:36 AM
ANNUAL
22
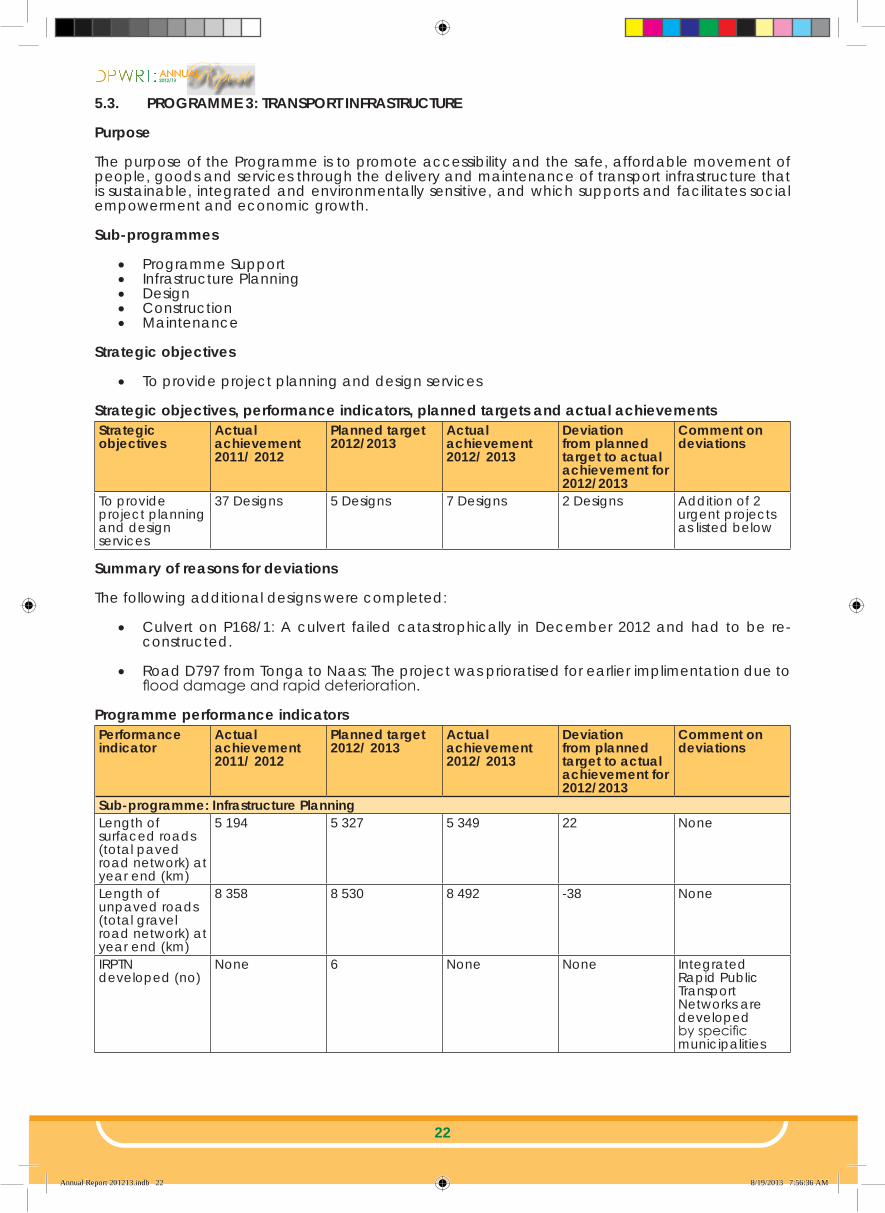
5.3. PROGRAMME 3: TRANSPORT INFRASTRUCTURE
Purpose
The purpose of the Programme is to promote accessibility and the safe, affordable movement of people, goods and services through the delivery and maintenance of transport infrastructure that is sustainable, integrated and environmentally sensitive, and which supports and facilitates social empowerment and economic growth.
Sub-programmes
• Programme Support • Infrastructure Planning • Design • Construction • Maintenance
Strategic objectives
• To provide project planning and design services
Strategic objectives, performance indicators, planned targets and actual achievementsStrategic objectives
Actual achievement 2011/ 2012
Planned target2012/2013
Actual achievement 2012/ 2013
Deviation from planned target to actual achievement for 2012/2013
Comment on deviations
To provide project planning and design services
37 Designs 5 Designs 7 Designs 2 Designs Addition of 2 urgent projects as listed below
Summary of reasons for deviations
The following additional designs were completed:
• Culvert on P168/1: A culvert failed catastrophically in December 2012 and had to be re-constructed.
• Road D797 from Tonga to Naas: The project was prioratised for earlier implimentation due to flood damage and rapid deterioration.
Programme performance indicatorsPerformance indicator
Actual achievement 2011/ 2012
Planned target2012/ 2013
Actual achievement 2012/ 2013
Deviation from planned target to actual achievement for 2012/2013
Comment on deviations
Sub-programme: Infrastructure PlanningLength of surfaced roads (total paved road network) at year end (km)
5 194 5 327 5 349 22 None
Length of unpaved roads (total gravel road network) at year end (km)
8 358 8 530 8 492 -38 None
IRPTN developed (no)
None 6 None None Integrated Rapid Public Transport Networks are developed by specific municipalities
Annual Report 201213.indb 22 8/19/2013 7:56:36 AM

ANNUAL
23
Performance indicator
Actual achievement 2011/ 2012
Planned target2012/ 2013
Actual achievement 2012/ 2013
Deviation from planned target to actual achievement for 2012/2013
Comment on deviations
Sub-programme: Infrastructure DesignInfrastructure designs completed (no)
37 5 7 2 Addition of 2 urgent projects
Sub-programme: ConstructionLength of (new) surfaced roads constructed (km)
None None None None No set target
Length of gravel roads upgraded to surfaced roads (km)
45 43 42 -1 None
Length of (new) gravel roads constructed (km)
None None None None No set target
Length of surfaced roads rehabilitated (km)
65 60 63 3 On aggregate contractors performed slightly above the projection
Sub-programme: MaintenanceArea of paved roads resealed (m2)
None 829 000 159 758 -669 242 Budget directed towards emergency blacktop patching Length of paved
roads resealed (km)
47 95 29 -66
Length of gravel roads re-gravelled (km)
385 330 185 -145 Budgetary constraints
Area of paved road patched (black-top patching) (m2)
263 388 75 000 248 286 173 286 Budget directed towards emergency blacktop patching
Length of gravel road bladed (frequency x km bladed, reported as km)
34 718 52 114 33 216 -18 898 Budgetary constraints
Percentage of surfaced network in very good condition: (VCI)
6% 5% 267km
9%460km
4%193km
Effect of rehabilitation of roads
Percentage of surfaced network in good condition: (VCI)
20% 20% 1 045km
23%1 204km
3%159km
Effect of blacktop patching
Percentage of surfaced network in fair condition: (VCI)
28% 37% 1 931km
35%1 863km
-2%-68km
None
Percentage of surfaced network in poor condition: (VCI)
32% 28%1 448km
28%1 499km
0%51km
None
Annual Report 201213.indb 23 8/19/2013 7:56:37 AM

ANNUAL
24
Performance indicator
Actual achievement 2011/ 2012
Planned target2012/ 2013
Actual achievement 2012/ 2013
Deviation from planned target to actual achievement for 2012/2013
Comment on deviations
Percentage of surfaced network in very poor condition: (VCI)
14% 10%508km
5%250km
-5%-258km
Emergency blacktop patching and rehabilitation of roads contributed positively to condition of road network
Percentage of gravel network in very good condition
0% 0% 0% None None
Percentage of gravel network in good condition
7% 4%331km
7%557km
3%226km
Slight improvement due to maintenance done as well as less rainfall than anticipated in some areas
Percentage of gravel network in fair condition
35% 32%2 726km
36%3 032km
4%306km
Slight improvement due to maintenance done as well as less rainfall than anticipated in some areas
Percentage of gravel network in poor condition
58% 64%5 429km
57%4 809km
-7%-620km
Less rainfall than anticipated in some areas
Percentage of gravel network in very poor condition
0% 0% 0% None None
Maintenance sub-programme as a percentage of Infrastructure Budget (excl. COAL roads)
39% Incl. Coal: 32.5%Excl Coal: 38.6%
Incl. Coal: 37%Excl. Coal: 37%
Incl. Coal: 4.5%Excl. Coal: -1.6%
Increase in maintenance activities on coal roads, which is part of PRMG budget
Number of weighbridges maintained/ calibrated
None 1 0 1 Actual output will be reported by DCSSL
Summary of reasons for deviations
• Over achievement on rehabilitation and blacktop patchingThe contractors for rehabilitation of surfaced roads slightly over-achieved on this indicator. A substantial part of the budget for maintenance was directed to black-top patching to avert further deterioration of strategic roads.
• Budget shortfallsThe roads maintenance programme saw a substantial amount of its allocation surrendered towards upgrading and rehabilitation of roads. This inevitably, hindered achievement of some performance targets for maintenance.
Annual Report 201213.indb 24 8/19/2013 7:56:37 AM

ANNUAL
25
Strategies to overcome areas of under performance Areas of under performance Strategies to overcome areas of under performanceResealing, re-gravelling and blading
Measures were put in place to reduce accruals flowing into 2013/14 which would prevent a repeat of the problem. Adequate budget will be allocated to meet planned targets.
Surfaced roads as per Visual Conditional Index (VCI)
The change in VCI related targets in fact indicate an improvement of the surfaced network. The net effect of the capital investment on rehabilitation and upgrading was positive.
Gravel roads as per Visual Conditional Index (VCI)
The targets were based on anticipated heavy rainfall during the year. However, less rain fell hence the overall condition of the gravel network was better off at year end.
Linking performance with budgets
The Programme had accruals of R115,409 million from the 2011/12 financial year which resulted in a budgetary constraints for the financial year 2012/13. The spill-over effect disrupted the planned programme of works and this was in the form of delayed awards, postponement and withdrawal of some infrastructure projects.
During the financial year, the Equitable Share portion of the budget was under pressure due to over commitment on capital projects. This necessitated an application from National Treasury for the reclassification of Provincial Road Maintenance Grant (PRMG) projects to include some capital projects funded from Equitable Share. The subsequent approval relieved the pressure and assisted the Programme to achieve successes against some planned outputs.
Sub-programme expenditureSub- programme Name
2012/2013 2011/2012Final appropriationR’000
ActualexpenditureR’000
(Over)/ under expenditureR’000
Final appropriationR’000
ActualexpenditureR’000
(Over)/ under expenditureR’000
Programme Support
1,568 1,375 193 1,547 1,544 3
Infrastructure Planning
58,361 58,299 62 45,911 45,909 2
Design 32,218 32,202 16 37,347 37,309 38Construction 848,350 845,799 2,551 795,325 795,325 0Maintenance 689,894 689,776 118 890,191 890,178 13TOTAL 1,630,391 1,627,451 2,940 1,770,321 1,770,265 56
1.4 PROGRAMME 4: TRANSPORT OPERATIONS
Purpose
The purpose of the Programme is to plan, regulate and facilitate the provision of integrated land transport services through co-ordination and co-operation with national planning authorities, CBOs, NGOs and the private sector in order to enhance the mobility of all communities particularly those currently without or with limited access.
Sub-programmes
• Programme Support • Public Transport Subsidies• Transport Safety and Compliance• Transport Systems• Infrastructure Operations
Strategic objectives
• To manage scholar transport• To provide integrated transport planning• To develop and maintain public transport infrastructure• To manage public transport operations
Annual Report 201213.indb 25 8/19/2013 7:56:37 AM

ANNUAL
26
Strategic objectives, performance indicators, planned targets and actual achievementsStrategic objectives
Actual achievement 2011/2012
Planned target2012/2013
Actual achievement2012/2013
Deviation from planned target to actual achievement for 2012/2013
Comment on deviations
To manage scholar transport
None 66 615 Learners 66 615 Learners None None
To provide integrated transport planning
None 2 •Provincial Land Transport Framework•Provincial Freight Plan
None None
To develop and maintain public transport infrastructure
8 IRMA projects 5 IRMA projects 1 IRMA project -4 IRMA projects
Budget redirected to fund contractual obligations of scholar transport
To manage public transport operations
11 030 Operators registered
11 200 Operators registered
10 102 Operators registered
1 098 Operators registered
actual output depends on the number of applications received and processed
To regulate public transport
924 Operating Licenses
1 157 Operating Licenses
581 Operating Licenses
-576 Operating Licenses
1 775 Roadblocks
1 340 Roadblocks
1 886 Roadblocks
546 Roadblocks
Increased emphasis on roadblocks
Summary of reasons for deviations
• Delays in implementation of IRMA projectsThe start of Steynsdorp Culvert Bridge and Kwaggafontein Sidewalk was delayed due to budgetary constraints. This means that the projects will now be completed in the next financial year. The budget was redirected to fund contractual obligations for scholar transport services.
• Dependable variablesThe actual outputs related to the registration of public transport operators and conversion of permits to operating licenses was dependent on the number of applications received. These were also depended on the economic climate that prevailed during the 2012/13 financial year.
• Increase in the number of roadblocksRoadblocks proved to be an effective tool to raise road safety awareness and to deter impaired drivers. A clear correlation existed between roadblocks and the decrease of accidents and fatalities involving public transport vehicles.
Programme performance indicatorsPerformance indicator
Actual achievement 2011/2012
Planned target2012/2013
Actual achievement2012/2013
Deviation from planned target to actual achievement for 2012/2013
Comment on deviations
Sub-programme: Public Transport ServicesNumber of km of Public Transport routes issued
35 419 957 38 444 630 28 231 474 -10 213 156 Number of kilometres issued, subsidised and monitored are less due to the introduction of articulated and bi-articulated buses
Number of km of Public Transport routes subsidized
35 280 536 36 148 260 28 231 474 -7 916 786
Number of subsidized km monitored
None 36 148 260 28 231 474 -7 916 786
Sub-programme: Public Transport ContractsNumber of scholar transport operators contracted
None 101 101 None None
Annual Report 201213.indb 26 8/19/2013 7:56:37 AM

ANNUAL
27
Performance indicator
Actual achievement 2011/2012
Planned target2012/2013
Actual achievement2012/2013
Deviation from planned target to actual achievement for 2012/2013
Comment on deviations
Number of scholar transport kilometres travelled
None 181 808 181 808 None None
Number of scholar transport routes monitored
None 561 716 155 Enhancement of scholar transport monitoring
Number of learners transported to school
None 66 615 66 615 None None
Number of public transport operators subsidized
6 6 6 None None
Number of registered Public Transport vehicles
13 678 583 16 187 15 604 Target was based on the number of buses subsidised
Number of public transport operators (per year)
11 030 11 000 10 102 -898 Actual output depends on the number of applications received and granted by the Board
Number of projects completed
8 5 1 -4 Budget redirected to fund contractual obligations for scholar transport
Number of transport operators trained
500 400 0 -400 Budget redirected to fund contractual obligations for scholar transportNumber of
training courses offered
5 5 0 -5
Number of subsidized trips monitored
541 476 541 476 569 425 27 949 Introduction of articulated and bi-articulated buses
Number of accidents involving public transport vehicles
633 675 618 -57 Increased enforcement and road safety campaigns
Number of roadblocks
1 775 1 340 1 886 546 Increased enforcement and road safety campaigns
Number of fatalities due to accidents involving public transport vehicles
173 239 170 -69 Increased enforcement and road safety campaigns
Number of subsidized trips
831 433 833 040 876 039 42 999 Introduction of articulated and bi-articulated buses
Annual Report 201213.indb 27 8/19/2013 7:56:37 AM
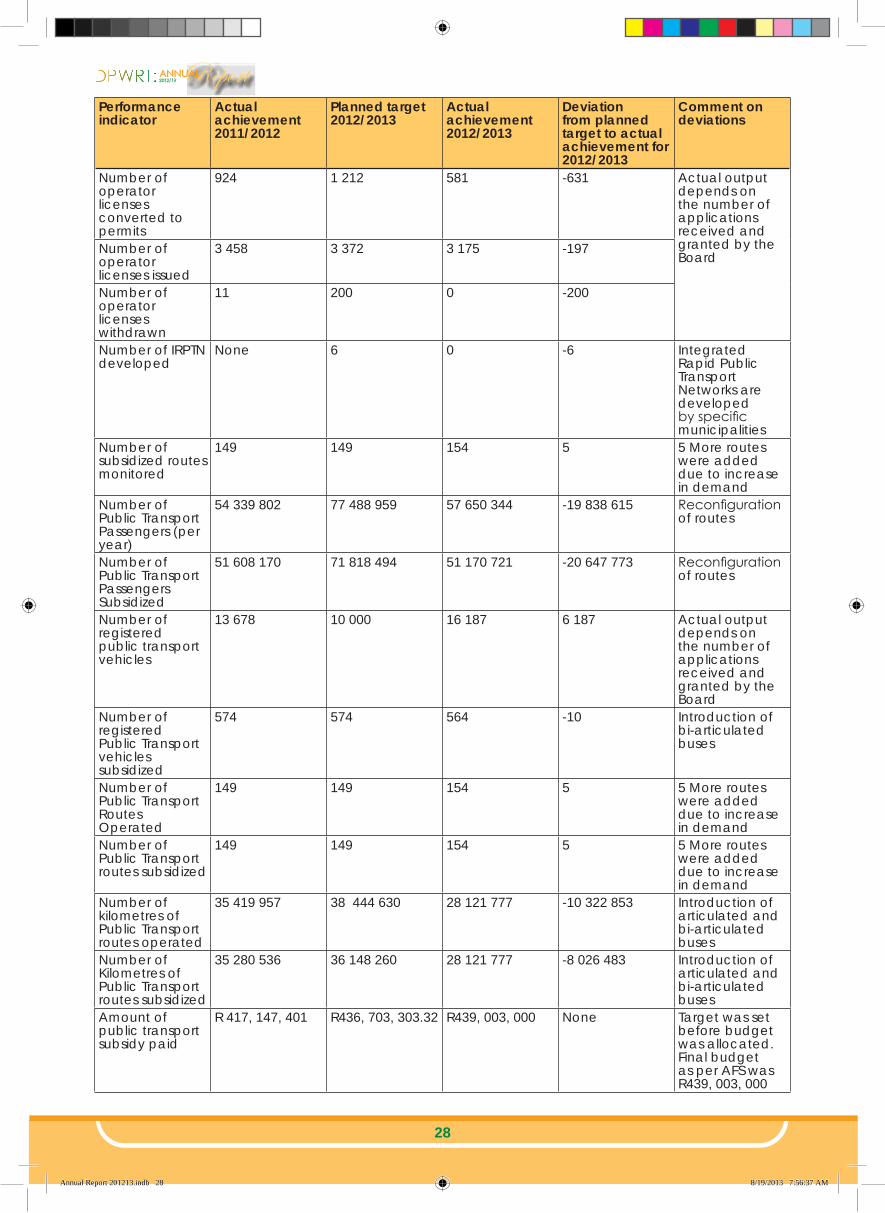
ANNUAL
28
Performance indicator
Actual achievement 2011/2012
Planned target2012/2013
Actual achievement2012/2013
Deviation from planned target to actual achievement for 2012/2013
Comment on deviations
Number of operator licenses converted to permits
924 1 212 581 -631 Actual output depends on the number of applications received and granted by the BoardNumber of
operator licenses issued
3 458 3 372 3 175 -197
Number of operator licenses withdrawn
11 200 0 -200
Number of IRPTN developed
None 6 0 -6 Integrated Rapid Public Transport Networks are developed by specific municipalities
Number of subsidized routes monitored
149 149 154 5 5 More routes were added due to increase in demand
Number of Public Transport Passengers (per year)
54 339 802 77 488 959 57 650 344 -19 838 615 Reconfiguration of routes
Number of Public Transport Passengers Subsidized
51 608 170 71 818 494 51 170 721 -20 647 773 Reconfiguration of routes
Number of registered public transport vehicles
13 678 10 000 16 187 6 187 Actual output depends on the number of applications received and granted by the Board
Number of registered Public Transport vehicles subsidized
574 574 564 -10 Introduction of bi-articulated buses
Number of Public Transport Routes Operated
149 149 154 5 5 More routes were added due to increase in demand
Number of Public Transport routes subsidized
149 149 154 5 5 More routes were added due to increase in demand
Number of kilometres of Public Transport routes operated
35 419 957 38 444 630 28 121 777 -10 322 853 Introduction of articulated and bi-articulated buses
Number of Kilometres of Public Transport routes subsidized
35 280 536 36 148 260 28 121 777 -8 026 483 Introduction of articulated and bi-articulated buses
Amount of public transport subsidy paid
R 417, 147, 401 R436, 703, 303.32 R439, 003, 000 None Target was set before budget was allocated. Final budget as per AFS was R439, 003, 000
Annual Report 201213.indb 28 8/19/2013 7:56:37 AM

ANNUAL
29
Performance indicator
Actual achievement 2011/2012
Planned target2012/2013
Actual achievement2012/2013
Deviation from planned target to actual achievement for 2012/2013
Comment on deviations
Number of passenger kilometres of public transport routes operated
35 419 957 38 729 665 28 121 777 -8 607 888 Introduction of articulated and bi-articulated buses
Number of passenger kilometres of public transport routes subsidized
35 419 957 36 433 295 28 231 474 -7 916 786 Introduction of articulated and bi-articulated buses
Subsidy per passenger
R 7.74 R 9.66 R 7.71 R1.95 Bi-articulated buses transported more passengers
Subsidy per vehicle
R 58, 324.81 R 44,192. 92 R 64, 863. 32 R 20, 670.40 Introduction of articulated and bi-articulated buses
Number of vehicles kilometres subsidized
35 419 956.6 273 124 131 28 231 474 -244 892 657 Target overstated
Summary of reasons for deviations
• Introduction of articulated and bi-articulated busesThe introduction of articulated and bi-articulated buses significantly reduced the number of buses on Mpumalanga roads. As a result, the number of kilometres covered by subsidized bus operators decreased. Furthermore, the amount of subsidy per vehicle increased whilst the subsidy per passenger decreased. These high-capacity buses were used in high frequency core routes thus improving the provision of safe and reliable public transportation.
• Budgetary ConstraintsThe spill-over effect of the accruals resulted in budget shortfalls for training of public transport operators and construction of IRMA projects.
• Overstated targetsBaseline information was not used during the setting of some targets.
Strategies to overcome areas of under performance Areas of under performance Strategies to overcome areas of under performanceConstruction of IRMA projects Improve overall financial management in order to minimize budget
overruns.Overstated targets Use baseline information to set feasible targets and develop data
definition to improve understanding performance indicators.
Linking performance with budgets
The Programme had accruals of R69,498 million from the 2011/12 financial year which resulted in a budgetary constraints for the financial year 2012/13. As a result, the Programme could not implement all its planned infrastructure projects and conduct the planned training for public transport operators. Nevertheless, the Programme managed to achieve most of its planned outputs with the limited available resources.
Sub-programme expenditureSub- programme name
2012/2013 2011/2012Final appropriationR’000
ActualexpenditureR’000
(Over)/ under expenditureR’000
Final appropriationR’000
ActualexpenditureR’000
(Over)/ under expenditureR’000
Programme Support
1,509 1,497 12 1,560 1,560 0
Annual Report 201213.indb 29 8/19/2013 7:56:37 AM

ANNUAL
30
Sub- programme name
2012/2013 2011/2012Final appropriationR’000
ActualexpenditureR’000
(Over)/ under expenditureR’000
Final appropriationR’000
ActualexpenditureR’000
(Over)/ under expenditureR’000
Public Transport Subsidies
927,340 927,196 144 804,250 801,562 2,688
Transport Safety and Compliance
22,096 21,972 124 26.925 26,924 1
Transport Systems
17,485 17,461 24 12,592 12,592 0
Infrastructure Operation
19,931 19,300 631 24,840 22,532 2,308
TOTAL 988,361 987,426 935 870,167 865,170 4,997
1.5 PROGRAMME 5: COMMUNITY BASED PROGRAMME
Purpose
The purpose of the Programme is to manage the implementation of programmes and strategies that lead to the development and empowerment of communities and contractors. This includes the provincial management and co-ordination of the Expanded Public Works Programme.
Sub-programmes
• Programme support • Community development• Innovation and empowerment• EPWP coordination and monitoring
Strategic objectives
• To coordinate the successful implementation of the EPWP 2• To facilitate and implement the Enterprise Development Programme• To facilitate and implement the National Youth Services
Strategic objectives, performance indicators, planned targets and actual achievementsStrategic objectives
Actual achievement 2011/2012
Planned target2012/2013
Actual achievement2012/2013
Deviation from planned target to actual achievement for 2012/2013
Comment on deviations
To coordinate the successful implementation of the EPWP 2
45 990 Job opportunities
59 630 Job opportunities
85 024 Job opportunities
25 394 Job opportunities
Increased co-ordination and Improved reporting
To facilitate and implement the Enterprise DevelopmentProgramme
40 Emerging Contractors
40 Emerging Contractors
40 Emerging Contractors
None None
To facilitate and implement the National Youth Services
500 Youth enrolled
600 Youth enrolled
600 Youth enrolled
None None
Summary of reasons for deviations
• Over-achievement- High level support yielded significantly higher performance in the fourth quarter.
Annual Report 201213.indb 30 8/19/2013 7:56:38 AM
ANNUAL
31
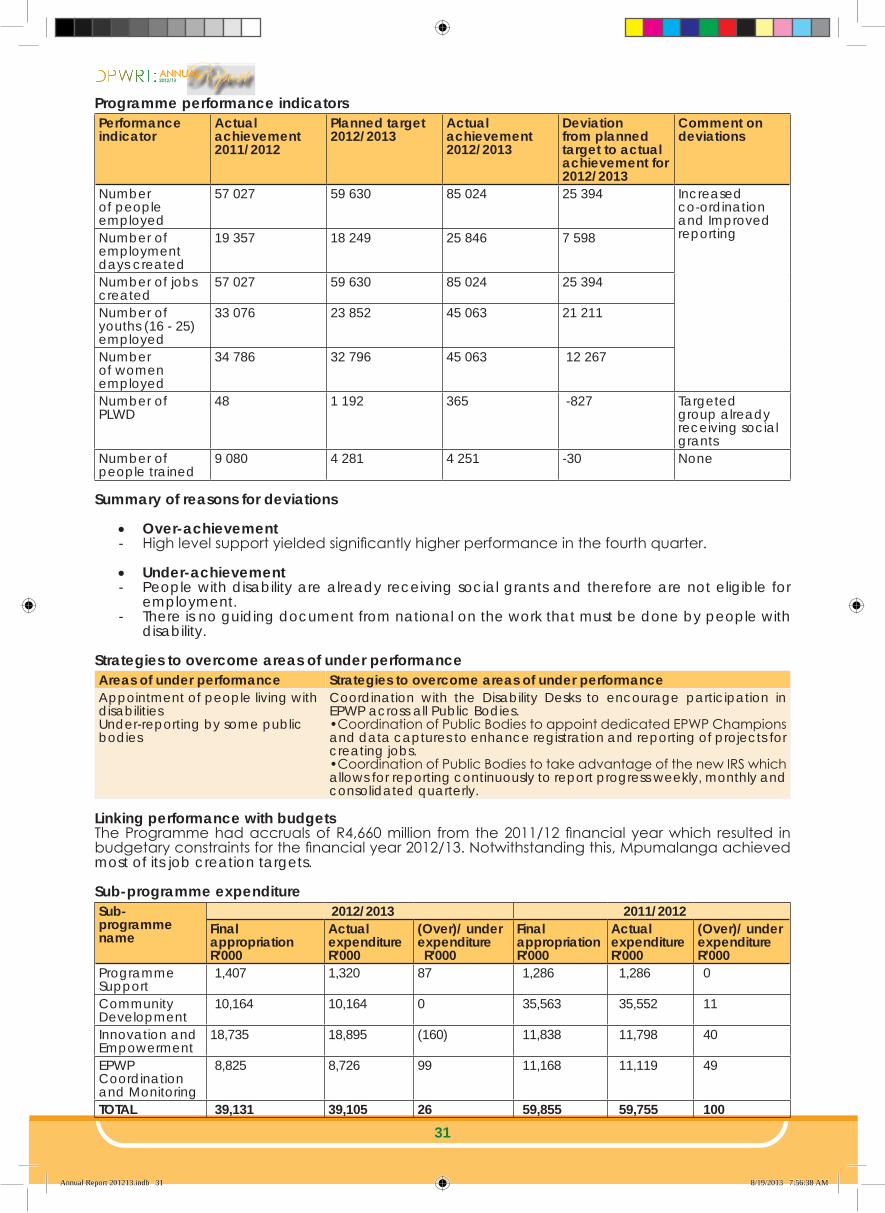
Programme performance indicatorsPerformance indicator
Actual achievement 2011/2012
Planned target2012/2013
Actual achievement2012/2013
Deviation from planned target to actual achievement for 2012/2013
Comment on deviations
Number of people employed
57 027 59 630 85 024 25 394 Increased co-ordination and Improved reporting Number of
employment days created
19 357 18 249 25 846 7 598
Number of jobs created
57 027 59 630 85 024 25 394
Number of youths (16 - 25) employed
33 076 23 852 45 063 21 211
Number of women employed
34 786 32 796 45 063 12 267
Number of PLWD
48 1 192 365 -827 Targeted group already receiving social grants
Number of people trained
9 080 4 281 4 251 -30 None
Summary of reasons for deviations
• Over-achievement- High level support yielded significantly higher performance in the fourth quarter.
• Under-achievement- People with disability are already receiving social grants and therefore are not eligible for
employment.- There is no guiding document from national on the work that must be done by people with
disability.
Strategies to overcome areas of under performance Areas of under performance Strategies to overcome areas of under performanceAppointment of people living with disabilities Under-reporting by some public bodies
Coordination with the Disability Desks to encourage participation in EPWP across all Public Bodies.•Coordination of Public Bodies to appoint dedicated EPWP Champions and data captures to enhance registration and reporting of projects for creating jobs.•Coordination of Public Bodies to take advantage of the new IRS which allows for reporting continuously to report progress weekly, monthly and consolidated quarterly.
Linking performance with budgetsThe Programme had accruals of R4,660 million from the 2011/12 financial year which resulted in budgetary constraints for the financial year 2012/13. Notwithstanding this, Mpumalanga achieved most of its job creation targets.
Sub-programme expenditureSub- programme name
2012/2013 2011/2012Final appropriationR’000
ActualexpenditureR’000
(Over)/ under expenditureR’000
Final appropriationR’000
ActualexpenditureR’000
(Over)/ under expenditureR’000
Programme Support
1,407 1,320 87 1,286 1,286 0
Community Development
10,164 10,164 0 35,563 35,552 11
Innovation and Empowerment
18,735 18,895 (160) 11,838 11,798 40
EPWP Coordination and Monitoring
8,825 8,726 99 11,168 11,119 49
TOTAL 39,131 39,105 26 59,855 59,755 100
Annual Report 201213.indb 31 8/19/2013 7:56:38 AM

ANNUAL
32
6. SUMMARY OF FINANCIAL INFORMATION
6.1. Departmental receipts Departmental receipts
2012/2013 2011/2012EstimateR’000
Actualamount collectedR’000
(Over)/ under collectionR’000
EstimateR’000
Actualamount collectedR’000
(Over)/ under collectionR’000
Sale of goods and services other than capital assets
25,895 18,860 7,035 21,675 14,055 7,620
Interest, dividends and rent on land
16,001 1,948 14,053 15,000 1,978 13,022
Sale of capital assets
6,225 934 5,291 9,000 2,615 6,385
Financial transactions in assets and liabilities
125 4,106 (3,981) 165 3,582 (3,417)
TOTAL 48,246 25, 848 22,398 45,840 22,230 23,610
The Department had projected to collect R48,246 during the 2012/2013 financial year and managed to collect R 25,848 which resulted in an under collection of R 22,398. The projection for revenue collection was based on the Medium Term Expenditure Framework period which was done before the transfer of Traffic Management.
The Department has four districts and head office where revenue generation activities take place. The major sources of revenue consist of the operating licences for taxis, rental of capital assets and impound fees for illegally operating a public transport vehicle.
Reasons for under achievement on revenue collection
• There are no Transport Inspectors at Bohlabela district office to conduct compliance operations for public transport operators. Lack of funds for Inspectors to do operations after hours and on weekends when there is high risk of non compliance by public.
• Reconciliation of transport fines, operating licence fees and taxi operator registration fees were not done on a regular basis due to lack of access to Operating License Administration System (OLAS). Department to use beneficiary code to re-direct all revenue collected for house rental.
• Board of Survey appointed in the third quarter and this resulted in the Department not being able to conduct auctions for the first and second quarters. No proper communication between Revenue and Assets Management with regard to the sale of obsolete, redundant and old furniture.
• Safekeeping of records of scrap that cannot be used again to be sold at the scrap yards.• Occupants without lease agreements make it difficult for the Department to demand
payments and no proper reconciliation done on lease of properties, especially payment by private occupants.
• The collection will increase once the Department completes the revamping and maintenance for guest houses at Pilgrims Rest.
Annual Report 201213.indb 32 8/19/2013 7:56:38 AM

ANNUAL
33
6.2. Programme expenditureProgramme name
2012/2013 2011/2012Final appropriationR’000
ActualexpenditureR’000
(Over)/ under expenditure R’000
Final appropriationR’000
ActualexpenditureR’000
(Over)/ under expenditure R’000
Administration 344,271 343, 954 317 452,659 452,588 74Public Works 525,327 525,146 181 438,587 438,549 38Transport Infrastructure
1,630,391 1,627,451 2,940 1,767,222 1,767,456 54
Transport Operations
988,361 987,426 935 873,266 868,267 4,999
Community Based Programmes
39,131 39,105 26 59,855 59,759 100
TOTAL 3,527,481 3,523,082 4,399 3,593,209 3,587,947 5,262
Reasons for under expenditure and its impact on service delivery There were no significant variances.
Reasons for virementsDetails for the virements can be found under 1.5.1 of part E: Annual Financial Statements.
6.3. Conditional grants and earmarked funds received
The table below describes each of the conditional grants and earmarked funds received by the Department.
Grant Provincial Roads Maintenance GrantDepartment who transferred the grant National TreasuryPurpose of the grant To supplement provincial roads investments and
support preventative, routine and emergency, maintenance on provincial road networks. Ensure provinces implement and maintain road asset management systems. Promote the use of labour-intensive methods in road maintenance. Repair roads and bridges damaged by floods.
Expected outputs of the grant Improvement of the Provincial roads infrastructureActual outputs achieved Improvement of the Provincial roads infrastructureAmount per amended DORA (R’000) R 1,240,694Amount received (R’000) R 1,240,694Reasons if amount as per DORA was not received Not applicableAmount spent by the Department (R’000) R1,240,694Reasons for the funds unspent by the entity Not applicableMonitoring mechanism by the receiving Department Monthly monitoring contract meeting and physical
monitoring
Grant Public Transport Operations GrantDepartment who transferred the grant National TreasuryPurpose of the grant To provide supplementary funding towards public
transport services
Expected outputs of the grant To provide access to transport facilities for the citizens of the Province
Actual outputs achieved Provision of access to transport facilities for the citizens of Mpumalanga Province
Amount per amended DORA (R’000) R439,003Amount received (R’000) R439,003Reasons if amount as per DORA was not received Not applicableAmount spent by the Department (R’000) R439,003Reasons for the funds unspent by the entity Not applicableMonitoring mechanism by the receiving Department Monthly monitoring contract meeting and physical
monitoring
Annual Report 201213.indb 33 8/19/2013 7:56:38 AM

ANNUAL
34
Grant Devolution of Property Rate Funds GrantDepartment who transferred the grant National TreasuryPurpose of the grant To facilitate the transfer of the property rates
expenditureExpected outputs of the grant Payment of Property Rates and TaxesActual outputs achieved Payment of Property Rates and TaxesAmount per amended DORA (R’000) R 76,870Amount received (R’000) R 76,870Reasons if amount as per DORA was not received Not applicableAmount spent by the Department (R’000) R 76,870Reasons for the funds unspent by the entity Not applicableMonitoring mechanism by the receiving Department Invoices received from Municipalities are verified
against the Asset Register and Valuation Roll. Reporting to National Public Works is done on a monthly and quarterly basis
Grant EPWP Incentive GrantDepartment who transferred the grant National TreasuryPurpose of the grant Performance based grant for job creation
Expected outputs of the grant EPWP Incentive GrantActual outputs achieved EPWP Incentive GrantAmount per amended DORA (R’000) R16,617Amount received (R’000) R16,617Reasons if amount as per DORA was not received Not applicableAmount spent by the Department (R’000) R16,617Reasons for the funds unspent by the entity Not applicableMonitoring mechanism by the receiving Department Monthly monitoring contract meeting and physical
monitoring done. Reporting done according to pre-scribed template from DORA
6.4. Capital investment, maintenance and asset management plan
The following projects were completed in the 2012/13 financial year:Project Name Scope of Work Targeted Completion
DateActual Completion Date
Reasons for Variances
Department of Health1. Embhuleni
HospitalAlterations and extension to mortuary
15/03/2012 18/04/2012 Defects were identified in the preparation for the final completion which the contractor had to rectify
2. Rob Ferreira Hospital Phase 4B
Construction of a new trauma building with an administration block and a helipad on top
11/05/2010 03/05/2012 Project was delayed due to legal dispute between the contractor and IDT. EOT’s were granted
3. Rob Ferreira Hospital Phase 4C
Upgrading of electrical reticulation, Internal Roads, storm water, sewer, roofs, gutters, mechanical works, landscaping and demolishing of a dilapidated double storey building
30/09/2011 15/05/2012 Defects were identified in the preparation for the final completion which the contractor had to rectify
4. Tintswalo Hospital
Construction of mortuary
25/03/2012 16/05/2012 Practical completion delayed due to electrical connection by Eskom
Annual Report 201213.indb 34 8/19/2013 7:56:38 AM

ANNUAL
35
Project Name Scope of Work Targeted Completion Date
Actual Completion Date
Reasons for Variances
5. Bongani Hospital Construction of 40 Bed MDR-TB wards
10/06/2011 22/05/2012 The initial contract was terminated hence a delay was caused during the reappointment of a new contractor
6. Delmas Hospital Construction of mortuary
15/03/2012 29/05/2012 Defects were identified in the preparation for the practical completion which the contractor had to rectify
7. Carolina Hospital
Alterations and extensions to the mortuary
10/04/2012 30/05/2012 Defects identified in the preparation for the practical completion which the contractor had to rectify
8. Lydenburg Hospital
Construction of mortuary
15/03/2012 31/05/2012 Defects were identified in the preparation for the practical completion which the contractor had to rectify
9. KwaMhlanga Hospital
Alterations and extensions to the mortuary
15/03/2012 01/06/2012 Project delayed due to slow progress of contractor. The contractor was delayed as the facility was operational when the work had to be done
10. Perdekop Community Health Centre
Major renovation of community health centre
09/06/2012 15/06/2012 Project completed on time
11. Mpumalanga Nursing College
Construction of palisade fencing
23/03/2012 18/06/2012 Project delayed due to slow progress of contractor. An EOT was applied for and approved
12. Moloto Emergency Medical Service Station
Construction of emergency medical service station
16/12/2011 19/06/2012 Delay as a result of site demarcation problems
13. Themba Hospital Construction of clinical engineering workshop and general wards
07/05/2012 26/07/2012 DoH requested additional work due to savings on the original contract
14. May flower Community Health Centre
Construction of accommodation units
27/05/2012 03/08/2012 Project delayed due to late payments
15. Embhuleni Hospital
Construction of palisade fencing
20/02/2012 29/08/2012 Project delayed due to late payments
16. Rob Ferreira Hospital Phase 4
Construction of new medical gas plant and renovations to the existing medical gas plant
31/08/2012 31/08/2012 Defects were identified in the preparation for the practical completion which the contractor had to rectify
17. Mthimba Clinic Construction of 2X2 accommodation units
26/05/2012 07/09/2012 Project delayed due to late payments
18. M’Africa Clinic Construction of 2X2 accommodation units
26/05/2012 11/09/2012 Project delayed due to late payments
Annual Report 201213.indb 35 8/19/2013 7:56:38 AM

ANNUAL
36
Project Name Scope of Work Targeted Completion Date
Actual Completion Date
Reasons for Variances
19. Swallowsnest Clinic
Construction of 2x2 accommodation units
27/05/2012 5/10//2012 Delays due to late payments
20. Themba Hospital Renovation and upgrading of Children’s ward, ICU and trauma unit /casualty
03/10/2011 16/10/2012 Project delayed due to late delivery of specialised equipment
21. Shongwe Hospital
Stabilisation of wards, general renovations and maintenances works
31/07/2012 19/10/2012 EOT was granted to the contractor for weather claims
22. Tekwane Community Health Centre
Construction of community Health centre and 2x2 bedroom accommodation units
17/01/2012 31/10/2012 Project delayed due to poor workmanship which resulted in termination of contract and appointment of a new contractor
23. Belfast Hospital Construction of mortuary
30/05/2012 16/11/2012 EOT was granted to the contractor for weather claims
24. Lebogang CHC Major renovations of community health centre
15/06/2012 30/11/2012 EOT was granted to the contractor for weather claims
25. Hluvukani Community Health Centre
Construction of Community Health Centre and 2x2 bedroom accommodation units
03/02/2012 30/11/2012 Practical completion delayed due to electrical connection by Eskom
26. Ermelo Hospital Upgrading of sewer reticulation
28/09/2012 12/12/2012 EOT was granted to the contractor for weather claims
27. Nhlazatshe Clinic
Renovation of the clinic
16/11/2012 23/01/2013 This is a National project which was delayed to the change in the scope of work
28. Kroomdraai Clinic
Renovation of the clinic
16/11/2012 15/02/2013 This is a National project which was delayed to the change in the scope of work
29. Mooiplaas Clinic Renovation of the clinic
16/11/2012 20/02/2013 This is a National project which was delayed to the change in the scope of work
30. Eerstehoek Clinic
Renovation of the clinic
16/11/2012 06/03/2013 This is a National project which was delayed to the change in the scope of work
Department of Social Development1. Ka-Maqhekeza
OfficesConstruction of 10 branch offices
31/08/2011 03/04/2012 Project delayed due to late payments and Eskom connection
2. Carolina Offices Construction of 16 branch offices
31/08/2011 31/10/2012 Project delayed due to late payments
Annual Report 201213.indb 36 8/19/2013 7:56:39 AM

ANNUAL
37
Project Name Scope of Work Targeted Completion Date
Actual Completion Date
Reasons for Variances
3. Tekwane Offices Construction of 20 branch offices
10/02/2013 26/03/2013 Project delayed due to poor workmanship which resulted in termination of contract and appointment of a new contractor
Department of Culture, Sport and Recreation1. Provincial
Archive BuildingConstruction of an archive building
27/02/2012 29/06/2012 Delays due to stoppages resulting from the unavailability of budget
2. Ermelo Regional Library
Construction of a new library
28/08/2012 10/09/2012 EOT was approved on the basis that the project was delayed due to weather
3. Middle-burg library
Construction of a library and renovations
11/05/2011 10/10/2012 Project delayed due to the change in design to address the high water table
4. Masoyi library Construction of a new library
10/05/2012 24/10/2012 EOT was approved on the basis that the project was delayed due to Eskom connection
5. Shatale Library Construction of a new library
31/08/2012 31/11/2012 Project delayed due to slow progress of the contractor. Penalties were imposed
Department Of Education1. Mzimba
Secondary School
Completion of construction work
28/03/2012 01/04/2012 Project delayed due to late payment
2. Mhlangana Secondary School
Demolition and construction of 14 classrooms
30/03/2011 04/03/2013 Project not completed on time due to poor workmanship
3. Pugishe Primary School
Demolish and construct 3 classrooms
30/09/2011 16/05/2012 Due to poor performance the contract was terminated
4. Lekholane Primary School
Demolishing of 15 Classrooms and Admin block. Construction of 15 Classrooms, Admin block, 20 toilets, Computer Centre and Library
03/05/2012 29/05/2012 Project delayed due to late payment
5. Green-valley Primary School
Construction of Grade R, 4 Toilets and fencing
4/03/2011 07/06/2012 Project delayed due to contractor not co-operating, warning letters were issued
6. Pelonolo Special School
Construct 4 classrooms, 2 storerooms, School Hall, 5 Toilets, 5 workshops, kitchen, dining hall, staffroom, 3 offices, and 2 additional Admin rooms and a sickroom
19/02/2011 12/06/2012 Project delayed due to contract being terminated and penalties imposed
Annual Report 201213.indb 37 8/19/2013 7:56:39 AM

ANNUAL
38
Project Name Scope of Work Targeted Completion Date
Actual Completion Date
Reasons for Variances
7. Mantjedi Special School
Construction of 6 classrooms, 2 stores, S/h, 10 Toilets, 3 workshops, Kitchen, dining hall, staffroom, 3 offices, 3 additional admin rooms and sickroom.
19/05/2011 12/06/2012 Project delayed due to contract being terminated and penalties imposed
8. Ekhiyeni Primary School
Storm damage-Leaking Roof
03/06/2012 22/06/2012 Project delayed due to late payment
9. Lekete High School
Construction of 1 workshop and refurbishment
09/11/2011 19/06/2012 Project delayed due to contractors poor performance
10. Enkundleni Primary School
Demolition and construction of 3 classrooms
03/06/2012 22/06/2012 Project completed on time
11. Mlilo Combined School
Mud unconventional to conventional
24/08/2011 19/07/2012 Project delayed due to late payment
12. KI Thwala Secondary School
Demolition and construction of 8 classrooms
08/06/2012 20/07/2012 Project delayed due to late payment
13. Madile Primary School
Repair storm damage
06/09/2012 12/07/2012 Project completed ahead of schedule
14. Ximoyi Khosa School
Repair storm damage
16/08/2012 12/07/2012 Project completed ahead of schedule
15. Mogawane Primary School
Repair storm damage
16/08/2012 12/07/2012 Project completed ahead of schedule
16. Khanyisile Primary School
Repair storm damage
21/08/2012 20/07/2012 Project completed ahead of schedule
17. SS Ripinga School
Repair storm damage
29/09/2012 17/07/2012 Project completed ahead of schedule
18. Qhubulwazi Combined School
Demolition and construction of 12 classrooms
30/09/2011 06/08/2012 Project delayed due to late payment (IDT)
19. Nyalungu Primary School
Repair storm damage
09/10/2012 17/12/2012 Project was delayed due to late payment
20. LM Kganane Secondary School
Repair storm damage
14/08/2012 19/07/2012 Project completed ahead of schedule
21. Makuke Secondary School
Repair storm damage
14/08/2012 19/07/2012 Project completed ahead of schedule
22. Phaphama Primary School
Reconstruction of 9 classrooms
11/08/2012 24/07/2012 Project completed ahead of schedule
23. Thwasani (Primary School
Maintenance of 25 classrooms
11/08/2012 25/07/2013 Project completed ahead of schedule
24. ML Nkuna Secondary) School
Repair storm damage
11/08/2012 25/07/2012 Project completed ahead of schedule
25. NP Mathabela Secondary School
Repair storm damage
30/08/2012 26/07/2012 Project completed ahead of schedule
26. Lekete High School
Repair storm damage
10/08/2012 26/07/2012 Project completed ahead of schedule
27. Timbavati Primary School
Repair storm damage
11/08/2012 26/07/2012 Project completed ahead of schedule
28. NJ Mahlangu Secondary School
Repair storm damage
09/08/2012 31/07/2012 Project ahead of schedule
29. Mdluli Secondary School
Repair storm damage
12/09/2012 03/08/2012 Project completed ahead of schedule
30. Mbazima Primary School
Repair storm damage
29/09/2012 17/07/2012 Project completed ahead of schedule
Annual Report 201213.indb 38 8/19/2013 7:56:39 AM

ANNUAL
39
Project Name Scope of Work Targeted Completion Date
Actual Completion Date
Reasons for Variances
31. Mitikinya Primary School
Repair storm damage
13/08/2012 06/08/2012 Project completed ahead of schedule
32. Mthimba Combined School
Repair storm damage
13/08/2012 13/08/2012 Project completed on time
33. Rindzani Primary School
Repair storm damage
16/08/2012 07/08/2012 Project completed ahead of schedule
34. Matikwane Primary School
Repair storm damage
10/08/2012 07/08/2012 Project completed ahead of schedule
35. Munyamane Primary School
Repair storm damage
30/08/2012 13/08/2012 Project completed ahead of schedule
36. Gutjwa Primary School
Repair storm damage
13/08/2012 14/10/2012 Project behind schedule due to late payment
37. Sifunindlela Primary School
Repair storm damage
13/08/2012 13/08/2012 Project completed on time
38. Umpopoli Primary School
Repair storm damage
13/08/2012 13/08/2012 Project completed on time
39. Celani Primary School
Repair storm damage
13/08/2012 13/08/2012 Project completed on time
40. Vulamasango Primary School
Demolition and construction of 4 classrooms
11/08/2012 14/08/2012 Project completed on time
41. Phumalanga Primary School
Repair storm damage
10/05/2012 10/08/2012 Project completed on time
42. Khaliphani Primary School
Repair storm damage
14/08/2012 14/08/2012 Project completed on time
43. Jabulani Primary School
Repair storm damage
14/08/2012 14/08/2012 Project completed on time
44. Nxalanti Primary School
Repair storm damage
13/09/2012 15/08/2012 Project completed ahead of time
45. Mahashe Secondary school
Repair storm damage
01/11/2012 15/08/2012 Project completed ahead of time
46. Freddy Sithole Secondary School
Repair storm damage
12/10/2012 16/08/2012 Project completed ahead of time
47. Shalamuka Primary School
Repair storm damage
12/09/2012 24/08/2012 Project completed ahead of schedule
48. Langa Secondary School
Demolish and construction of 16 classrooms
28/12/2012 01/08/2012 Project completed ahead of schedule
49. Magwagwaza Primary School
Repair storm damage
11/10/2012 30/08/2012 Project completed ahead of schedule
50. Kgwaditiba Primary School
Repair storm damage
17/08/2012 31/07/2012 Project completed ahead of schedule
51. Glory Hill Primary School
Repair storm damage
13/09/2012 31/08/2012 Project completed ahead of schedule
52. Mugidi Primary School
Repair storm damage
12/09/2012 03/09/2012 Project completed ahead of schedule
53. Soshangane Secondary School
Construction of 7 Classrooms, Computer Centre , library, laboratory, kitchen, Rails and Ramps, Home Economics centre, Sports Ground, Parking, Admin, hall, 24 toilets, Water supply, Electrical, Renovation of 15 Classrooms, 1Admin block
12/09/2009 04/09/2012 Project was delayed due to E.O.T and V.O for change of designs (Timber to steel trusses for school hall), late payment and poor performance
Annual Report 201213.indb 39 8/19/2013 7:56:39 AM

ANNUAL
40
Project Name Scope of Work Targeted Completion Date
Actual Completion Date
Reasons for Variances
54. Mgcobaneni Primary School
Repair storm damage
10/08/2012 05/09/2012 Project completed behind schedule due to late payment
55. Enkokokweni Primary School
Repair storm damage
14/08/2012 14/08/2012 None
56. Ramoshidi High School
Construction one technical workshop and the refurbishment of three technical workshops.
16/10/2011 24/01/2013 Project delayed due to a termination of contract
57. Mosipa Secondary School
Construction of 7 classrooms and renovation of 1 admin block
31/01/2013 11/09/2012 None
58. Vulindlela School
Repair storm damage
10/10/12 10/10/2012 None
59. Hlalakahle Primary School
Repair storm damage
12/09/2012 12/10/2012 Project was behind schedule due to late payment
60. Sibambayane Primary School
Repair storm damage
12/10/2012 15/10/2012 None
61. Nelspruit Primary School
Repair storm damage
17/10/2012 16/10/2012 None
62. Barberton Combined School
Repair storm damage
30/10/2012 30/10/2012 None
63. Khutsalani Combined School
Repair storm damage
09/10/2012 22/10/2012 Project completion delayed due to late payment
64. Mlilo Primary School
Repair storm damage
22/10/2012 22/10/2012 None
65. Vulamehlo Primary School
Repair storm damage
25/10/24 25/10/2012 None
66. Glenthorpe Primary School
Repair storm damage
30/10/2012 30/10/2012 None
67. Bambanani Combined School
Repair storm damage
13/09/2012 19/10/2012 Project completion delayed due to late payment
68. Salubindza Primary School
Repair storm damage
13/10/2012 05/11/2012 Project completed behind schedule due to late payments
69. Sethlare Primary School
Repair storm damage
12/09/2012 01/11/2012 Project completed behind schedule due to late payments
70. Ndabeni Primary School
Construction of an Admin Block
13/11/2012 13/11/2012 None
71. Inkunzi Primary Schools
Repair storm damage
12/11/2012 23/11/2012 None
72. Paulos Ngobeni School
Repair storm damage
17/12/2012 30/11/2012 None
73. Mthembeni Secondary School
Repair storm damage
12/09/2012 10/12/2012 Project completion delayed due to late payments
74. Khulamlambo Primary School
Repair storm damage
09/08/2012 10/12/2012 Project completion delayed due to late payments
75. Njanji Primary School
Repair storm damage
11/08/2012 07/08/2012 None
76. Tjhidelani Primary School
20 Classrooms 17/01/2013 14/01/2013 None
Annual Report 201213.indb 40 8/19/2013 7:56:39 AM

ANNUAL
41
Project Name Scope of Work Targeted Completion Date
Actual Completion Date
Reasons for Variances
77. Mandlakababa Primary School
2 Classrooms 11/02/2013 07/02/2013 Contract was terminated due to poor performance. Revised contract completed on time
78. Xantia Secondary School
8 Classrooms and an Admin centre
31/01/2013 31/01/2013 None
79. Sidlemu Primary School
6 Classrooms, Computer Centre; library, kitchen, Rails and Ramps, Admin, School Hall,18 Toilets
11/09/2008 05/02/2013 Project was delayed due to EOT and VO for change of designs (Timber to steel trusses for school hall)
80. Ndedema Primary School
Unconventional School
31/01/2013 05/02/2013 None
81. Arnot Colliery Primary School (Phase 1)
Unconventional/ Conventional School
04/12/2012 05/02/2013 Project behind schedule due to late payment
82. Rob Ferreira Hoerskool
Upgrading and renovations
27/2/2013 15/02/2013 None
83. Moduping Primary School
Singita Project 10/12/2012 25/02/2013 None
84. Sizile / Delpark Primary School
Unconventional/Conventional School
28/02/2013 28/02/2013 None
85. Elukhanyisweni Technical School
Construction of 1 Technical workshop and refurbishment of 3 workshops
08/08/2012 18/03/2013 Project completed behind schedule due to poor performance
86. Moniwa Primary School
Construction of Grade R facility
31/03/2013 20/03/ 2013 None
Transport Infrastructure1. D1869 and
D1870 between Marloth Park and Komatipoort (15.5 km)
Upgrade from gravel to surfaced road
20/07/2012 30/11/2012 Extension of time due to additional works
2. D481 between Mooiplaas and Ekulindeni (9.6km)(EPWP)
Upgrade from gravel to surfaced road
31/05/2011 07/03/2013 Extension of time due to rainfall delay and late approval of VO
3. Goromane Bridge over Sabie River Including Access Roads (2km)
Upgrade from gravel to surfaced road
16/05/2012 26/10/2012 Extension of time due to additional works and quantities
Transport Operations1. Ntombe 2 Foot-
bridge Construction of footbridge
31/03/2012 05/03/2013 Revised completion date due to natural causes
The following projects could not be completed in the 2012/13 financial year: Project Name Scope of Work Targeted
Completion DateRevised Completion Date
Reasons for the Delays
Department of Health1. Themba Hospital
Renovations and upgrading of Ophthalmic, orthopaedic, female surgical, male surgical, female and male medical
07/05/2012 31/03/2013 Contractor behind schedule
Annual Report 201213.indb 41 8/19/2013 7:56:39 AM

ANNUAL
42
Project Name Scope of Work Targeted Completion Date
Revised Completion Date
Reasons for the Delays
2. Ermelo Hospital Renovations of administration
30/03/2013 04/04/2013 Late delivery of air-conditioning equipment
3. Rob Ferreira Hospital
Phase 4D: Upgrading of Wards 9/10,11 and paediatric ward, Rehabilitation centre
31/03/2012 31/07/2013 Contractor has abandoned site due non-payment. Works currently suspended
4. Mapula neng Hospital
Renovations and additions to existing TB Ward. Construction of Storage and Helipad
11/09/2011 31/05/2013 Unavailability of the specialist equipment (Helipad lights) which have yet to be ordered
5. Piet Retief Hospital
Construction of new M2 mortuary
21/11/2012 30/06/2013 Contractor behind schedule. An EOT was granted for weather
6. Mashishing CHC
Construction of Community Health Centre and 2x2 bedroom accommodation units
03/02/2012 31/05/2013 Contractor behind schedule due to poor workmanship
7. Belfast Hospital Construction of new OPD, Casualty and Admissions.Upgrading of Existing Theatre
17/01/2012 30/06/2013 Contract was terminated due to poor performance and new contractor appointed and site handed over on the 13th March 2013
8. Mmamet hlake Hospital
Phase 1: Concrete palisade fencing
28/02/2013 29/04/2013 Contractor behind schedule due to poor workmanship
9. Wakker stroom CHC:
Construction of new community Health Centre
21/05/2011 30/06/2013 Contractor behind schedule due to poor performance. Termination of contract recommended
10. Evander Hospital
Upgrading Administration and Rehabilitation Blocks (New Roof)
02/10/2012 31/05/2013 Sectional hand-over done, but delay in the delivery of specialised equipment
11. Green-side CHC
Construction of community health centre
17/09/2012 21/05/2013 This is an IDT project and the delays are due to late payments
12. Twee fontein CHC
Construction of community health centre
17/09/2012 31/07/2013 This is an IDT project and the delays are due to late payments
13. Phola Park CHC
Construction of community health centre
06/10/2012 22/05/2013 This is an IDT project and the delays are due to late payments
14. Sinqobile CHC Construction of community health centre
06/10/2012 31/08/2013 Delays in supplying materials by the CRDP co-operatives
15. Mbhejeka CHC
Construction of community health centre
06/10/2012 31/05/2013 This is an IDT project and the delays are due to late payments
Annual Report 201213.indb 42 8/19/2013 7:56:40 AM

ANNUAL
43
Project Name Scope of Work Targeted Completion Date
Revised Completion Date
Reasons for the Delays
Department of Social Development1. Dagga kraal branch Offices
Construction of offices
10/01/2012 31/08/2013 EOT granted to contractor due to none delivery of materials.
2. Gert Sibande Offices
Construction of 40 Offices
31/03/2012 24/05/2013 Project behind schedule
3. Delmas DSD Construction of offices
02/02/2012 31/07/2013 Project delayed to termination of contract and appointment of new contractor
Department of Culture, Sport and Recreation1. Vaalbank (Libangeni) Library
Construction of new library
23/06/2012 31/05/2013 Contract was terminated and a new contract entered into with a new contractor
2. Driefontein Library
Construction of new library
02/07/2011 31/05/2013 The project was terminated at 75%. The appointed QS on the project were terminated due to poor performance. New QS and contractor to be appointed
3. Perdekop Library
Construction of new library
11/06/2012 31/05/2013 Project delayed due to slow progress of the contractor. A cession was approved and penalties imposed
4. Masoyi library Construction of a new library
10/05/2012 24/10/2012 EOT was approved on the basis that the project was delayed due to Eskom connection
5. Shatale Library Construction of a new library
31/08/2012 31/11/2012 Project delayed due to slow progress of the contractor. Penalties were imposed
Department of Economic Development, Environment and Tourism1. Donker hoek
FarmConstruction of water bottling water
30/10/2012 31/08/2013 Late delivery of the water tank (only manufacturer in the country)
Department of Education1. Alex Benjamin
(Phase 1)Demolish 12 asbestos Classrooms and Construction of 12 Classrooms; 14 toilets; a kitchen, fencing and cupboards.
06/12/2012 19/04/2013 Project was not complete due to non-payment resulting in the contractor halting work
2. Holde sheim Primary School
3 Classrooms 15/03/2013 02/04/2013 Project was delayed by inclement weather
3. Mahu bahuba Primary School
Construction of 14 Toilets
15/03/2013 30/04/2013 Project is behind schedule due to cash flow constraints
Annual Report 201213.indb 43 8/19/2013 7:56:40 AM

ANNUAL
44
Project Name Scope of Work Targeted Completion Date
Revised Completion Date
Reasons for the Delays
4. Mandle sive Secondary School
20 Classrooms, 1Computer Centre; 1 Library,1 Laboratory, 1 Kitchen, 1Rails and ramps, 1 Admin block, 20 toilets, water supply
05/03/2013 25/04/2013 Delayed due to community unrest
5. Manya katane Primary School
Leaking roof N/A N/A Project is on hold due to SGB decision not to accept the project
6. Nwama humana Primary School
Leaking roof N/A N/A DoE has resolved by requesting DPWRT to conduct an assessment and to provide a report thereafter
7. ML Mokoena Secondary School
Leaking roof N/A N/A The school was repaired by SGB and DoE to be advised to reimburse the SGB
8. Fundin jobo Secondary School
Leaking roof N/A N/A DoE has advised DPWRT to deploy a contractor to site
9. Khange la/MM Motoung Primary School
1 Admin block 01/04/2013 22/04/2013 The contract was terminated at 98% due to poor performance
10. Ikhethelo Secondary School
7 classrooms; Computer Centre, Library; Laboratory; Admin ; School Hall; 17 toilets and fencing
05/08/2011 30/07/2013 All works completed except upgrading of electricity
11. Injabulo Combined School
12 classrooms, Computer Centre; GrR, Library, Kitchen, Rails and ramps; 3 sports grounds, Parking area, Admin, School Hall,16 toilets; water, electricity and fencing
15/03/2013 11/04/2013 Project behind schedule
12. Abacus Solutions
Supply of movable classrooms
31/03/2013 N/A Moveable classrooms are supplied as and when needed and required
13. Dumphries Secondary School
Completion of Admin, Kitchen, Toilets and Classrooms
11/08/2013 11/08/2013 The contract was terminated at 40% due to poor performance
14. Mzilikazi Primary School
Completion of Admin, Kitchen, Toilets and Classrooms
23/07/2013 23/07/2013 The contract was terminated at 40% due to poor performance
15. Shatleng Primary School
Completion of Admin, Kitchen, Toilets and Classrooms
13/11/2013 13/11/2013 The contract was terminated at 80% due to poor performance
16. Rhand zekile Primary School
Construction of 18 Toilets
15/03/2013 30/04/2013 Project is behind schedule due to cashflow constraints
17. Maakere Secondary School
Construction of 14 Toilets
15/03/2013 30/04/2013 Project is behind schedule due to cashflow constraints
Annual Report 201213.indb 44 8/19/2013 7:56:40 AM

ANNUAL
45
Project Name Scope of Work Targeted Completion Date
Revised Completion Date
Reasons for the Delays
18. Nembe Nhlava Primary School
Construction of 14 Toilets
15/03/2013 30/04/2013 Project is behind schedule due to cashflow constraints
Transport Infrastructure: Construction1. Bethal Traffic
Control Centre (Weighbridge)
Construction of weighbridge
25/04/2012 30/09/2013 Pending approval of VO as required additional funding exceeds 20% of the contract amount
2. D3969 and D3974 between Kildare and Cunningmoore (Rolle - Oakley Phase 2) (11km)
Upgrade from gravel to surfaced road
06/10/2012 30/10/2014 Pending approval for extension of time
3. D2976 between Daantjie and Mpakeni (9.3km)
Upgrade from gravel to surfaced road
30/06/2012 30/08/2013 The project completion has been hindered by factors such as slow progress and poor workmanship
4. D2975 between Luphisi and Siphelanyane (14.5km)
Upgrade from gravel to surfaced road
11/09/2012 30/04/2013 Additional work and pending approval of VO
5. D2964 between Diepdale and Swaziland border (9.2km) (EPWP)
Upgrade from gravel to surfaced road
07/07/2012 30/04/2013 Pending approval of VO as required additional funding exceeds 20% of the contract amount
6. D4390, D4385 and D4387 between Rolle and Oakley (17.5km)(Phase 1)
Upgrade from gravel to surfaced road
02/07/2012 19/07/2013 Series of problems resulting to termination of main contractor and Engineer
7. P53/2 between Leandra and Standerton (P90/1)(23km)
Rehabilitation of coal haulage road
12/12/2012 15/05/2013 Inclement weather, rainfall and late payments
8. D1398 from D1555 (Arnot PS) to Hendrina
(23km)
Rehabilitation of coal haulage road
01/08/2012 31/05/2013 Strike action and rainfall
9. D914 from P127/1 - R35 (South of Middelburg) (16km)
Rehabilitation of coal haulage road
11/07/2012 30/05/2013 Termination of main contractor
10. D1555 between D1398 junction and Arnot Colliery (1.57km)
Reseal of surfaced road
31/12/2012 - Project reprioritized
11. D797 between Tonga and Naas (2km)
Reseal of surfaced road
31/12/2012 - Project reprioritized
12. D182 from Sasol Plant to Secunda Boundary (9.42km)
Reseal of surfaced road
31/12/2012 - Project reprioritized
13. D823 between Carl Cilliers and Secunda (8.25km)
Reseal of surfaced road
31/12/2012 - Project reprioritised
Transport Operations
Annual Report 201213.indb 45 8/19/2013 7:56:40 AM

ANNUAL
46
Project Name Scope of Work Targeted Completion Date
Revised Completion Date
Reasons for the Delays
1. Steyndorp Culvert Bridge
Construction of culvert bridge
31/03/2013 07/06/2013 Project were delayed to commence in the 4th quarter (budgetary constraints)
2. Construction of Katsibane, Makola, Magononong and Lefiso bus shelters
Construction of bus shelters
31/12/2012 31/01/2014 The project will be re-advertised due to errors on the tender document discovered during evaluation
3. Kwaggagontein Walkways
Construction of walkway
31/12/2012 06/06/2013 Project were delayed to commence in the 4th quarter (budgetary constraints)
The following are multi-year projects that are currently in progress and will be completed in the next financial year(s):
Scope of Work Targeted Completion Date
Department of Health1. Ermelo Hospital Renovation of Pharmacy 30/05/20132. Rob Ferreira Hospital Phase 4E: Part 1: New residence building with 150 units. 31/01/20143. Rob Ferreira Hospital Phase 4E : Part 2: New Learning Resource Centre building 07/08/20134. Witbank Hospital Demolitions of existing building and construction of Neo-
natal, kangaroo unit and renovation of old Hospital roof13/06/2013
5. KwaMhlanga Hospital Phase 3C Construction of new intensive care unit (ICU) and casualty. Renovations and additions to existing theatre block
30/06/2013
Department of Social Development1. Delmas sub-district
OfficesConstruction of offices 31/07/2013
Department of Culture, Sport and Recreation1. Klarinet Library Construction of library 31/05/2013Department of Education
1. Kgantsho Primary School 5 Classrooms 01/05/20132. Siphumule Primary
School1 Classroom 02/05/2013
3. Sihlengiwe Primary School
2 Classrooms 02/05/2013
4. Hlalisanali Primary School
CRDP Substitution of unsafe structures Grade R Centre 12/10/2013
5. Mzimhlophe Secondary School
CRDP Demolish and Construct 14 Classrooms, Admin, Laboratory, Library ,Computer Centre, Kitchen
12/10/2013
6. Mgcobaneni Primary School
Construction of 19 Classrooms, Grade R, Admin Block, Laboratory and Library
08/02/2014
7. Schulzendal Primary School
CRDP Substitution of unsafe structures Grade R Center 4 25/03/204
8. Alex Benjamin (Phase 2) Demolish 12 asbestos Classrooms and Constructing of 12 Classrooms
31/10/2013
9. Arnot Colliery Primary (Phase 2)
Construction of 9 Classrooms; Admin Block, Computer Centre, Hall, Sports Ground Laboratory; Library; ,Computer Centre, School Hall, 4 Toilets
05/10/2013
10. iLanga Primary School Construction of 19 Classrooms; Admin Block, Laboratory; Library; Computer Centre and Kitchen
30/04/2013
11. iLanga Primary School (Phase 2)
13 classrooms; Kitchen, Admin Block; Laboratory; Library; Computer Centre; Hall; 20 Toilets; 3 Sports Grounds and Car ports
28/10/2013
12. Lungelo Combined School
5 Classrooms, Kitchen,3Toilets 31/07/2013
13. Berbice Primary School 5 Classrooms Kitchen, 3Toilets 31/07/201314. Kwashuku Secondary
School2 classrooms,Fencing,4 Toilets and Kitchen 31/07/2013
Annual Report 201213.indb 46 8/19/2013 7:56:40 AM

ANNUAL
47
Scope of Work Targeted Completion Date
15. Amersfoort Primary School
6 classrooms; 10 toilets; water; fencing and electricity 30/07/2013
16. Matikwana Primary School
Construction of 16 Toilets 30/04/2013
17. Jabulani Primary School 12 Classrooms 20/06/201218. Kabete Primary School 1 Classroom, 4 Toilets and fencing 10/04/201319. Kwakwari Primary School 1 Classroom, 4 Toilets and fencing 10/04/201320. Khuthalani Primary
School1 Classroom, 4 Toilets and fencing 29/04/2013
21. Mzinti Primary School 1 Classroom, 4 Toilets and fencing 08/05/201322. Ekuphileni Primary
School1 Classroom, 4 Toilets and fencing 06/05/2013
23. Imizamoyethu Primary School
1 Classroom 06/05/2013
24. Harmony Park C School 1 Classroom, 4 Toilets and fencing 06/05/201325. Qalani Primary School 1 Classroom, 4 Toilets and fencing 29/04/201326. Qhubekani Primary
School1 Classroom, 4 Toilets and fencing 29/04/2013
27. Seabe High School 10 Classrooms,1Computer Centre,1Library,1Laboratory,1Kitchen, Ramps and Rails,1Admin Block, 20 Toilets, Water supply
21/02/2013
28. Frank Mghinyana Secondary School
Construction of 10 Classrooms, Admin Block, Library,1 Laboratory, Computer Centre and Kitchen
12/03/2014
29. Samuel Mhlanga Primary School
Construction of 19 Classrooms, Grade R, Admin, Library, 1Laboratory
12/03/2014
30. Landulwazi Primary School
Leaking roof and ceiling replacement 19/06/2013
31. Esithembisweni Primary School
Leaking roof 19/06/2013
32. Bhekokuhle Primary School
Leaking roof 19/06/2013
33. Ekuphakameni Primary School
Leaking roof 19/06/2013
34. C.J. Nkosi Secondary School
Leaking roof 30/05/2013
35. Ntabahle Primary School Leaking roof 30/05/201336. Chief S.W. Nhlapho
SecondaryLeaking roof 30/05/2013
37. Vulingcondo Primary School
Leaking roof 30/06/2013
38. Mbalenhle Secondary School
Leaking roof 30/06/2013
39. Sijabule Primary School Leaking roof 09/06/201340. Mabhoko Primary
SchoolLeaking roof 09/06/2013
41. Vumazonke Primary School
Leaking roof 09/06/2013
42. Siyifunile Secondary School
Leaking roof 09/06/2013
43. Shobyiana Secondary School
Renovation of 16 classrooms; the construction of 12 classrooms; Admin Block; Library; Laboratory; Computer Centre; Home Economics; School Hall; Rails and ramps; electricity; water and 16 Toilets
12/04/2013
44. Gedlembane Secondary School
Renovation of 20 classrooms; 8 classrooms; Computer Centre; Library; Laboratory; ramps and rails,3 Home Economics; ,School Hall,10 toilets, Water supply, Admin block,18 toilets
29/11/2013
45. Methula Secondary School
Computer Centre; Library; Laboratory; rails and ramps; Admin and 18 classrooms
01/10/2013
46. New Coronation Secondary School (Klarinet) IDT
Construction of 28 Classrooms; Admin Block; Laboratory; Library; 40 toilets fencing and School Hall
27/9/2013
Annual Report 201213.indb 47 8/19/2013 7:56:40 AM
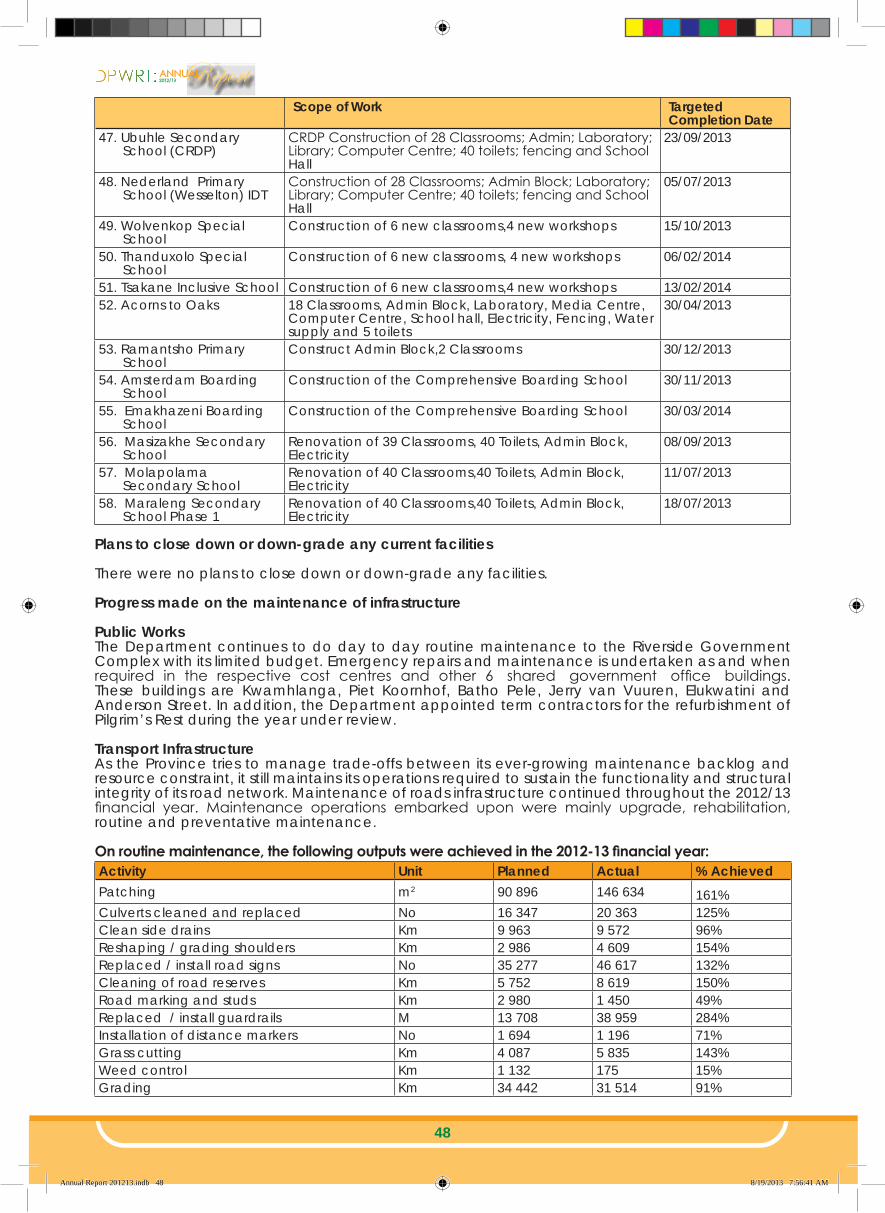
ANNUAL
48
Scope of Work Targeted Completion Date
47. Ubuhle Secondary School (CRDP)
CRDP Construction of 28 Classrooms; Admin; Laboratory; Library; Computer Centre; 40 toilets; fencing and School Hall
23/09/2013
48. Nederland Primary School (Wesselton) IDT
Construction of 28 Classrooms; Admin Block; Laboratory; Library; Computer Centre; 40 toilets; fencing and School Hall
05/07/2013
49. Wolvenkop Special School
Construction of 6 new classrooms,4 new workshops 15/10/2013
50. Thanduxolo Special School
Construction of 6 new classrooms, 4 new workshops 06/02/2014
51. Tsakane Inclusive School Construction of 6 new classrooms,4 new workshops 13/02/201452. Acorns to Oaks 18 Classrooms, Admin Block, Laboratory, Media Centre,
Computer Centre, School hall, Electricity, Fencing, Water supply and 5 toilets
30/04/2013
53. Ramantsho Primary School
Construct Admin Block,2 Classrooms 30/12/2013
54. Amsterdam Boarding School
Construction of the Comprehensive Boarding School 30/11/2013
55. Emakhazeni Boarding School
Construction of the Comprehensive Boarding School 30/03/2014
56. Masizakhe Secondary School
Renovation of 39 Classrooms, 40 Toilets, Admin Block, Electricity
08/09/2013
57. Molapolama Secondary School
Renovation of 40 Classrooms,40 Toilets, Admin Block, Electricity
11/07/2013
58. Maraleng Secondary School Phase 1
Renovation of 40 Classrooms,40 Toilets, Admin Block, Electricity
18/07/2013
Plans to close down or down-grade any current facilities
There were no plans to close down or down-grade any facilities.
Progress made on the maintenance of infrastructure
Public WorksThe Department continues to do day to day routine maintenance to the Riverside Government Complex with its limited budget. Emergency repairs and maintenance is undertaken as and when required in the respective cost centres and other 6 shared government office buildings. These buildings are Kwamhlanga, Piet Koornhof, Batho Pele, Jerry van Vuuren, Elukwatini and Anderson Street. In addition, the Department appointed term contractors for the refurbishment of Pilgrim’s Rest during the year under review.
Transport InfrastructureAs the Province tries to manage trade-offs between its ever-growing maintenance backlog and resource constraint, it still maintains its operations required to sustain the functionality and structural integrity of its road network. Maintenance of roads infrastructure continued throughout the 2012/13 financial year. Maintenance operations embarked upon were mainly upgrade, rehabilitation, routine and preventative maintenance.
On routine maintenance, the following outputs were achieved in the 2012-13 financial year:Activity Unit Planned Actual % AchievedPatching m2 90 896 146 634 161%Culverts cleaned and replaced No 16 347 20 363 125%Clean side drains Km 9 963 9 572 96%Reshaping / grading shoulders Km 2 986 4 609 154%Replaced / install road signs No 35 277 46 617 132%Cleaning of road reserves Km 5 752 8 619 150%Road marking and studs Km 2 980 1 450 49%Replaced / install guardrails M 13 708 38 959 284%Installation of distance markers No 1 694 1 196 71%Grass cutting Km 4 087 5 835 143%Weed control Km 1 132 175 15%Grading Km 34 442 31 514 91%
Annual Report 201213.indb 48 8/19/2013 7:56:41 AM

ANNUAL
49
Activity Unit Planned Actual % AchievedFencing Km 64 1 2%Installed gabions m3 12 734 70 161 551%Fire break Km 0 22 0
Developments relating to the above that are expected to impact on the Department’s current expenditure
Public WorksThe Executive Council approved the Department’s request for client departments to pay a user charge on the government buildings that they occupy. Interactions with Provincial Treasury and the respective departments are underway in order to explore mechanisms for implementation.
Transport Infrastructure There has been more pressure on the Department’s limited available capital budget as there are growing needs towards rural access development. Although the Department is in receipt of the Provincial Roads Maintenance Grant, the increasing backlog partly attributed to flood damages and maintenance of the coal haulage road network has posed a major challenge for the Department.
Changes in the Asset Holdings
The physical asset movement for the Department was as follows (R’000): Opening Balance R 288, 706Adjustments R 382 Disposals (R 11, 241)Additions R 12, 893TOTAL R 290, 740
Of the R290, 740 million the Department spent R12, 893 million to acquire the following movable additional assets (R’000):
Transport Assets R 4, 648Computer Equipment R 2, 984Furniture and Office Equipment R 1, 196Other machinery and Equipment R 4, 065TOTAL R12, 893
Disposal of assets
Two (2) auctions were held during the financial year:Region Month Amount Ehlanzeni South 13 December 2012 R 173, 580Gert Sibande 19 December 2012 R 782, 210TOTAL R 955, 790
Material losses
Material losses to the value of R 0,315 million were recorded for the 2012/2013 financial year.
Measures taken to ensure that the Department’s asset register remained up-to-date during the period under review
All the Department’s assets were recorded in the Asset Register. Measures taken to update the register include bar coding, physical verification and reconciliation of all assets according to the Asset Management Policy. Performance asset inspections on buildings are undertaken on a monthly basis.
The current state of the Department’s capital assets, for example what percentage is in good, fair or bad conditionName Good Fair PoorComputers 60% 20% 20%Furniture 60% 25% 15%Vehicles 65% 25% 10%Other Machinery and Equipments 70% 20% 10%
Annual Report 201213.indb 49 8/19/2013 7:56:41 AM
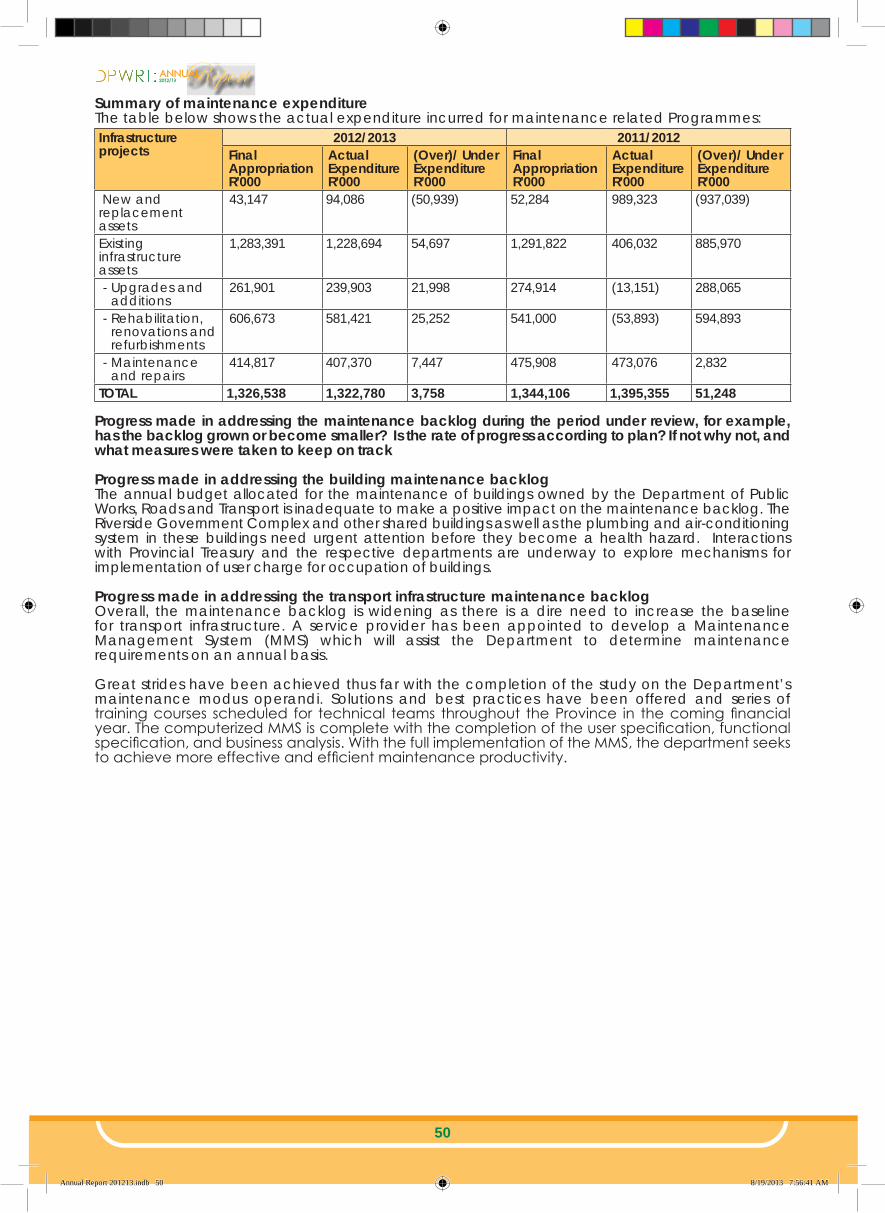
ANNUAL
50
Summary of maintenance expenditureThe table below shows the actual expenditure incurred for maintenance related Programmes:Infrastructure projects
2012/2013 2011/2012Final AppropriationR’000
Actual ExpenditureR’000
(Over)/ Under ExpenditureR’000
Final AppropriationR’000
Actual ExpenditureR’000
(Over)/ Under ExpenditureR’000
New and replacement assets
43,147 94,086 (50,939) 52,284 989,323 (937,039)
Existing infrastructure assets
1,283,391 1,228,694 54,697 1,291,822 406,032 885,970
- Upgrades and additions
261,901 239,903 21,998 274,914 (13,151) 288,065
- Rehabilitation, renovations and refurbishments
606,673 581,421 25,252 541,000 (53,893) 594,893
- Maintenance and repairs
414,817 407,370 7,447 475,908 473,076 2,832
TOTAL 1,326,538 1,322,780 3,758 1,344,106 1,395,355 51,248
Progress made in addressing the maintenance backlog during the period under review, for example, has the backlog grown or become smaller? Is the rate of progress according to plan? If not why not, and what measures were taken to keep on track
Progress made in addressing the building maintenance backlog The annual budget allocated for the maintenance of buildings owned by the Department of Public Works, Roads and Transport is inadequate to make a positive impact on the maintenance backlog. The Riverside Government Complex and other shared buildings as well as the plumbing and air-conditioning system in these buildings need urgent attention before they become a health hazard. Interactions with Provincial Treasury and the respective departments are underway to explore mechanisms for implementation of user charge for occupation of buildings. Progress made in addressing the transport infrastructure maintenance backlog Overall, the maintenance backlog is widening as there is a dire need to increase the baseline for transport infrastructure. A service provider has been appointed to develop a Maintenance Management System (MMS) which will assist the Department to determine maintenance requirements on an annual basis.
Great strides have been achieved thus far with the completion of the study on the Department’s maintenance modus operandi. Solutions and best practices have been offered and series of training courses scheduled for technical teams throughout the Province in the coming financial year. The computerized MMS is complete with the completion of the user specification, functional specification, and business analysis. With the full implementation of the MMS, the department seeks to achieve more effective and efficient maintenance productivity.
Annual Report 201213.indb 50 8/19/2013 7:56:41 AM

ANNUAL
51
PART C: GOVERNANCE
Annual Report 201213.indb 51 8/19/2013 7:56:44 AM
ANNUAL
52
1. INTRODUCTION
Commitment by the Department to maintain the highest standards of governance is fundamental to the management of public finances and resources. Users want assurance that the Department has good governance structures in place to effectively, efficiently and economically utilize the state resources, which is funded by the tax payer.
2. RISK MANAGEMENT
Nature of risk management
This is the identification, assessment, and prioritization of risks followed by coordinated application of resources to minimize, monitor, and control the probability and/or impact of unfortunate events or to maximize the realization of opportunities. Risks can come from uncertainty in financial markets, project, legal liabilities, credit risk, accidents, natural causes and disasters.
Risk management strategies to identify risks and manage the risks
The strategies to manage risks include transferring the risk to another party, avoiding the risk, reducing the negative effect or probability of the risk, or even accepting some or all of the potential or actual consequences of a particular risk.
Progress made in addressing risks identified
The Department has put measures in place as to how best can we deal with the risks identified. On a monthly basis, all sections affected are required to provide progress report indicating how they are trying to eliminate the risk, mitigate it or just tolerate it, in terms of the evaluation of the risk identified.
3. FRAUD AND CORRUPTION
The Department’s Fraud Prevention Plan (FPP) and the progress made in implementing the fraud prevention plan
The FPP of the Department was developed based on the risks identified during the Risk Identification and Rating Project. The plan is aimed at creating a culture which is intolerant to fraud; detecting, preventing and investigating fraud; and taking appropriate action against fraudsters.
Mechanisms in place to report fraud and corruption and how these operate.eg: Whistle blowing - The need for officials to make confidential disclosure about suspect fraud and corruption
The Department will commence with the implementation of the FPP in June 2013. During the fraud awareness workshops participants are always encouraged to report fraudulent activities and they are provided with information as to how/when/where to start when blowing the whistle.
How these cases are reported and what action is taken
Most cases are reported through the National Anti-Corruption Hotline. The hotline administrators screen the information and send it to the relevant Provincial Premier’s Offices for investigations.
4. MINIMISING CONFLICT OF INTEREST
To minimise conflict of interest within Supply Chain all practitioners sign the code of conduct for Supply Chain Management. There are four committees within the Supply Chain section, Specification Committee, Evaluation Committee, Adjudication Committee and Finance Committee, in each committee sitting all members present declare their interest on record and also sign the declaration of interest indicating whether they have interest or not.
5. CODE OF CONDUCT
The Code of Conduct contains issues of personal conduct, accountability, transparency and private interests. All employees in the Department have an obligation to understand the application of the procedures contained in the Code of Conduct. This means that the employees who breach the Code of conduct are subject to disciplinary action. The requirements for disciplinary action in the context of the Code of Conduct are found in Resolution 1 of 2003 of the PSCBC (i.e. against employees at level 1 to 12) and Chapter 7 of the SMS Handbook.
Annual Report 201213.indb 52 8/19/2013 7:56:44 AM
ANNUAL
53
6. HEALTH SAFETY AND ENVIRONMENTAL ISSUES
The main co-function of the Department is building- and roads maintenance. The exposure of employees to hazards depends on the nature of work they are performing. Building maintenance employees are working at hospitals where there are different kinds of diseases, high level of noise, heat and dust of coal at the boilers. This could affect the life of the employees at a long run. Roads maintenance employees are always working on the roads where they are exposed to traffic, high levels of noise because of the machinery they are using, diseases, snakes and bees when opening drains or cutting grass and trees. All this are hazardous to the life of the employees if not prevented.
Annual Report 201213.indb 53 8/19/2013 7:56:44 AM
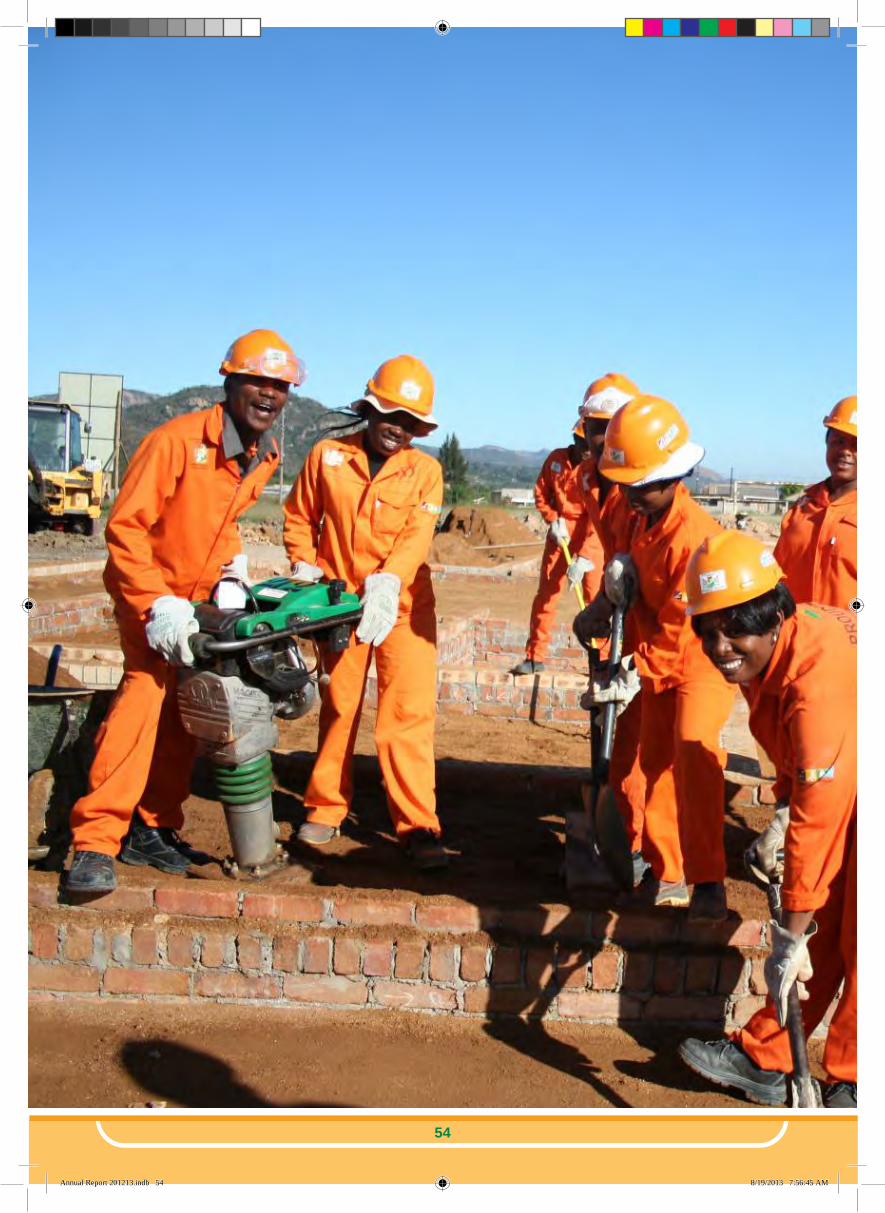
ANNUAL
54
Annual Report 201213.indb 54 8/19/2013 7:56:45 AM

ANNUAL
55
PART D: HUMAN RESOURCE MANAGEMENT
Annual Report 201213.indb 55 8/19/2013 7:56:45 AM

ANNUAL
56
1. LEGISLATURE THAT GOVERN HR MANAGEMENT
The information provided in this part is prescribed by the Public Service Regulations (Chapter 1, Part III J.3 and J.4).
2. INTRODUCTION
OverviewHuman resource serves an engine of the Department. It is one of the key functions for ensuring that the organization meets its objectives. Without sound and proper Human Resource Management (HRM), the Department would not be able to promote service delivery. Therefore it was imperative to ensure that the management of human resources did not take a backseat to other functions but became an integral part of the operations. Overall HRM had to ensure that the Department had necessary capacities to deliver on its mandate.
Set HR priorities for the year under review and the impact of these prioritiesThe Department had an approved MTEF plan, a three year plan for the period between 2010 and 2013. The plan sought to ensure that proper organizational structure together with human resource requirements were in place and aligned to the Departmental strategic plan. All intentions to implement this plan were there, however an assessment conducted in 2011 by the Provincial Treasury identified that Mpumalanga had an increasing public service wage bill.
Subsequently, the Executive Council directed all departments to review their organizational structures for the sole purpose of freeing resources for service delivery. In line with this directive, an exercise was embarked upon to review Public Works, Roads and Transport organizational structure. The proposed structure focusing mainly on critical posts was submitted to the Department of Public Service and Administration (DPSA) for consideration. No feedback had been received by 31 March 2013. Workforce planning framework and key strategies to attract and recruit a skilled and capable workforceThe Department recognizes that its personnel remain the most valuable asset of the organization. Unfortunately, this is not a fixed asset hence personnel from time to time move to greener pastures. Extensive work has been done to identify occupational categories most affected by labour shortages and introducing initiatives to attract and retain staff in these areas.
Employee Wellness Programme (EWP)One of the key aspects of human resource management in any organization revolves around employee health and wellness. The Department has established fully-fledged unit aimed at promoting employee wellness programme and consistently seek to reach its entire workforce through specific targeted programmes. One of these programmes involves keeping in shape by participating in different sporting activities. Another significant programme includes initiatives to manage HIV/AIDS and Occupational, Health and Safety programmes.
Employee performance management frameworkThe Department has a Human Resource Utilization and Capacity Development (HRU & CD) unit which deal with the proper deployment of employees as well as their development, through training, learnerships, bursaries, mentorships and the Performance Management Development System (PMDS). All mandates related to this unit are contained in its Human Resource Development Plan.
Highlight achievements• Performed much better in terms of compliance with the Employment Equity Act requirements
as compared to other provincial departments. Refer to page 19 for detailed analysis.• Signing of performance agreements improved from 98.6% to 99.7%• Reduced the number of injury on duty cases from 41 to 17• Abolished all unfunded posts from the organogram.
Challenges faced by the department• Delay in the approval of organizational structure• High staff turnover at the professional levels. • Turanaround time for filling of posts
Annual Report 201213.indb 56 8/19/2013 7:56:45 AM

ANNUAL
57
3. HUMAN RESOURCE OVERSIGHT STATISTICS
3.1. Personnel related expenditure
The following tables summarises the final audited personnel related expenditure by programme and by salary bands. In particular, it provides an indication of the following:
- amount spent on personnel - amount spent on salaries, overtime, homeowner’s allowances and medical aid.
Table 3.1.1 Personnel expenditure by programme Programme Total
Expenditure (R’000)
Personnel Expenditure (R’000)
Training Expenditure(R’000)
Professional and Special Services Expenditure (R’000)
Personnel Expenditure as a % of Total expenditure
Average personnel cost per employee (R’000)
Administration 343,954 223,979 1,213 7,488 65% 527Public Works 525,146 220,830 479 519 42% 209Transport Infrastructure 1,627,451 266,205 47 19,716 16% 103
Transport Operations 987,426 41,385 0 13,517 4% 311
Community Based Programmes
39,105 18,453 23 14,397 47% 439
TOTAL 3,523,082 770,852 1,762 55,637 21% 200
Table 3.1.2 Personnel costs by salary bandSalary band Personnel
Expenditure (R’000)
% of Total personnel cost
No. of employees
Average personnel cost per employee (R’000)
Lower skilled (Levels 1-2) 150,592 17.2 1233 122,135Skilled (level 3-5) 214,947 24.6 1542 138,052Highly skilled production (levels 6-8) 169,937 19.5 636 267,197Highly skilled supervision (levels 9-12) 177,119 19.5 355 480,927Senior and Top management (levels 13-16)
50,904 5.8 61 834,492
Contract (Levels 1-2) 1,192 0.1 15 79,467Contract (Levels 3-5) 2,080 0.2 15 138,667Contract (Levels 6-8) 674 0.1 1 674,000Contract (Levels 9-12) 306 0 0 0Contract (Levels 13-16) 3,101 0.4 3 1,033,667TOTAL 770,852 93.9 3 861 88215
Table 3.1.3 Salaries, overtime, home owners allowance and medical aid by programmeProgramme Salaries Overtime Home Owners
AllowanceMedical Aid
Amount (R’000
Salaries as a % of personnel costs
Amount (R’000)
Overtime as a % of personnel costs
Amount (R’000)
HOA as a % of personnel costs
Amount (R’000)
Medical aid as a % of personnel costs
Administration 148,304 19.4 2,123 0.3 9,225 1.2 12,538 1.6Public Works 146,117 19.2 5,001 0.6 12,841 1.6 11,427 1.5Transport Infrastructure
167,708 21.8 501 0.1 20,876 2.7 22,805 3.0
Transport Operations
26,348 3.6 2,022 0.3 1,486 0.2 2,509 0.3
Community Based Programmes
12,426 1.8 0 0.0 533 0.1 641 0.1
TOTAL 500,903 65.8 9,647 1.3 44,961 5.8 49,920 6.5
Annual Report 201213.indb 57 8/19/2013 7:56:46 AM
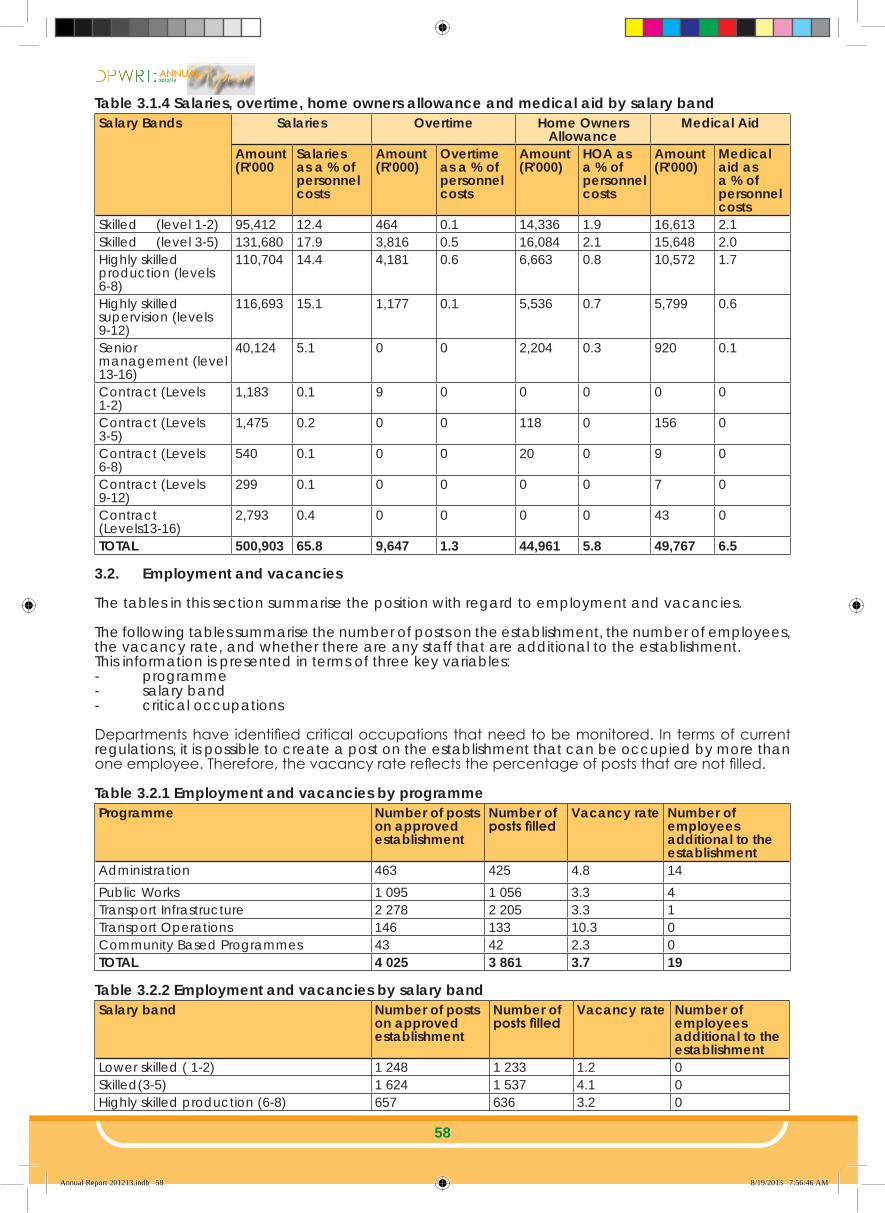
ANNUAL
58
Table 3.1.4 Salaries, overtime, home owners allowance and medical aid by salary bandSalary Bands Salaries Overtime Home Owners
AllowanceMedical Aid
Amount (R’000
Salaries as a % of personnel costs
Amount (R’000)
Overtime as a % of personnel costs
Amount (R’000)
HOA as a % of personnel costs
Amount (R’000)
Medical aid as a % of personnel costs
Skilled (level 1-2) 95,412 12.4 464 0.1 14,336 1.9 16,613 2.1Skilled (level 3-5) 131,680 17.9 3,816 0.5 16,084 2.1 15,648 2.0Highly skilled production (levels 6-8)
110,704 14.4 4,181 0.6 6,663 0.8 10,572 1.7
Highly skilled supervision (levels 9-12)
116,693 15.1 1,177 0.1 5,536 0.7 5,799 0.6
Senior management (level 13-16)
40,124 5.1 0 0 2,204 0.3 920 0.1
Contract (Levels 1-2)
1,183 0.1 9 0 0 0 0 0
Contract (Levels 3-5)
1,475 0.2 0 0 118 0 156 0
Contract (Levels 6-8)
540 0.1 0 0 20 0 9 0
Contract (Levels 9-12)
299 0.1 0 0 0 0 7 0
Contract (Levels13-16)
2,793 0.4 0 0 0 0 43 0
TOTAL 500,903 65.8 9,647 1.3 44,961 5.8 49,767 6.5
3.2. Employment and vacancies
The tables in this section summarise the position with regard to employment and vacancies.
The following tables summarise the number of posts on the establishment, the number of employees, the vacancy rate, and whether there are any staff that are additional to the establishment. This information is presented in terms of three key variables:- programme- salary band- critical occupations
Departments have identified critical occupations that need to be monitored. In terms of current regulations, it is possible to create a post on the establishment that can be occupied by more than one employee. Therefore, the vacancy rate reflects the percentage of posts that are not filled.
Table 3.2.1 Employment and vacancies by programmeProgramme Number of posts
on approved establishment
Number of posts filled
Vacancy rate Number of employees additional to the establishment
Administration 463 425 4.8 14Public Works 1 095 1 056 3.3 4Transport Infrastructure 2 278 2 205 3.3 1Transport Operations 146 133 10.3 0Community Based Programmes 43 42 2.3 0TOTAL 4 025 3 861 3.7 19
Table 3.2.2 Employment and vacancies by salary bandSalary band Number of posts
on approved establishment
Number of posts filled
Vacancy rate Number of employees additional to the establishment
Lower skilled ( 1-2) 1 248 1 233 1.2 0Skilled(3-5) 1 624 1 537 4.1 0Highly skilled production (6-8) 657 636 3.2 0
Annual Report 201213.indb 58 8/19/2013 7:56:46 AM

ANNUAL
59
Salary band Number of posts on approved establishment
Number of posts filled
Vacancy rate Number of employees additional to the establishment
Highly skilled supervision (9-12) 389 355 8.7 0Senior management (13-16) 73 61 16.4 4Contract (Levels 1-2), Permanent 15 15 0 14Contract (Levels 3-5), Permanent 15 15 0 0Contract (Levels 6-8), Permanent 1 1 0 0Contract (Levels 13-16), Permanent 3 3 0 1
TOTAL 4 025 3 861 3.7 19
Table 3.2.3 Employment and vacancies by critical occupationsCritical occupation Number of posts
on approved establishment
Number of posts filled
Vacancy rate
Number of employees additional to the establishment
Admin related, Permanent 216 198 8.3 0All artisans in the building metal machinery etc., Permanent
222 212 4.5 0
Architects town and traffic planners, Permanent
3 3 0 1
Artisan project and related superintendents, Permanent
28 28 0 0
Auxiliary and related workers, Permanent 31 31 0 0Boiler and related operators, Permanent 39 36 7.7 0Building and other property caretakers, Permanent
13 13 0 0
Bus and heavy vehicle drivers, Permanent 17 17 0 0Cartographers and surveyors, Permanent 1 1 0 0Cartographic surveying and related technicians, Permanent
9 9 0 0
Civil engineering technicians, Permanent 8 7 12.5 0Cleaners in offices workshops hospitals etc., Permanent
170 166 2.4 0
Client inform clerks(switchb recept inform clerks), Permanent
4 4 0 0
Communication and information related, Permanent
4 3 25 0
Electrical and electronics engineering technicians, Permanent
1 1 0 0
Engineering sciences related, Permanent 59 56 5.1 1Engineers and related professionals, Permanent
19 19 0 3
Farm hands and labourers, Permanent 51 50 2 0Finance and economics related, Permanent 17 15 11.8 1Financial and related professionals, Permanent 42 38 9.5 0Financial clerks and credit controllers, Permanent
174 172 1.1 0
General legal admin and rel. professionals, Permanent
1 1 0 0
Head of department/ chief executive officer, Permanent
2 2 0 0
Human resources and organisat development and relate prof, Permanent
15 14 6.7 0
Human resources clerks, Permanent 79 77 2.5 0Human resources related, Permanent 48 41 14.6 13Information technology related, Permanent 7 7 0 0Inspectors of apprentices works and vehicles, Permanent
20 20 0 0
Annual Report 201213.indb 59 8/19/2013 7:56:46 AM

ANNUAL
60
Critical occupation Number of posts on approved establishment
Number of posts filled
Vacancy rate
Number of employees additional to the establishment
Language practitioners interpreters and other commun, Permanent
1 1 0 0
Legal related, Permanent 3 3 0 0Library mail and related clerks, Permanent 22 22 0 0Light vehicle drivers, Permanent 29 28 3.4 0Logistical support personnel, Permanent 6 6 0 0Material-recording and transport clerks, Permanent
8 8 0 0
Mechanical engineering the technicians, Permanent
9 9 0 0
Messengers porters and deliverers, Permanent 6 6 0 0Motor vehicle drivers, Perm 17 17 0 0Motorised farm and forestry plant operators, Permanent
2 2 0 0
Natural sciences related, Permanent 5 5 0 0Other admin and related clerks and organisers, Permanent
135 133 1.5 0
Other admin policy and related officers, Permanent
10 10 0 0
Other machine operators, Permanent 1 1 0 0Other occupations, Permanent 15 15 0 0Quantity surveyors and rela prof not class elsewhere, Permanent
10 9 10 0
Regulatory inspectors, Permanent 80 74 7.5 0Risk management and security services, Permanent
3 3 0 0
Road superintendents, Permanent 84 72 14.3 0Road trade workers., Permanent 9 9 0 0Road workers, Permanent 1 707 1647 2.6 0Secretaries and other keyboard operating clerks, Permanent
155 153 1.3 0
Security guards, Permanent 5 5 0 0Senior managers, Permanent 44 33 25 0Social work and related professionals, Permanent
1 1 0 0
Trade labourers, Permanent 288 281 2.4 0Trade quality controllers, Permanent 17 17 0 0Trade related, Permanent 3 3 0 0Water plant and related operators, Permanent 50 47 6 0TOTAL 4 025 3 861 3.7 19
3.3. Job evaluation
Within a nationally determined framework, executing authorities may evaluate or re-evaluate any job in his or her organisation. In terms of the Regulations all vacancies on salary levels 9 and higher must be evaluated before they are filled. The following table summarises the number of jobs that were evaluated during the year under review. The table also provides statistics on the number of posts that were upgraded or downgraded.
Table 3.3.1 Job evaluation by salary bandSalary band Number of
posts on approved establishment
Number of jobs evaluated
% of posts evaluated by salary bands
Posts upgraded Posts downgradedNumber % of posts
evaluatedNumber % of posts
evaluated
Highly skilled production (Levels 6-8)
686 141 20.6 3 2.1% 0 0
Annual Report 201213.indb 60 8/19/2013 7:56:46 AM

ANNUAL
61
Salary band Number of posts on approved establishment
Number of jobs evaluated
% of posts evaluated by salary bands
Posts upgraded Posts downgradedNumber % of posts
evaluatedNumber % of posts
evaluated
Highly skilled supervision(Levels 9-12)
361 4 1.1 0 0 0 0
Senior management service band A
46 1 2.2 1 100 % 0 0
TOTAL 1 093 146 4 0 0
The following table provides a summary of the number of employees whose positions were upgraded due to their post being upgraded. The number of employees might differ from the number of posts upgraded since not all employees are automatically absorbed into the new posts and some of the posts upgraded could also be vacant.
Table 3.3.2 Profile of employees whose positions were upgraded due to their posts being upgradedBeneficiary African Asian Coloured White TOTALFemale 0 0 0 0 0Male 1 0 0 0 0TOTAL 1 0 0 0 0Employees with a disability
3.4. Employment changes
This section provides information on changes in employment over the financial year. Turnover rates provide an indication of trends in the employment profile of the department. The following tables provide a summary of turnover rates by salary band and critical occupations.
Table 3.4.1 Annual turnover rates by salary band Salary Band Number of
employees at beginning of period-April 2012
Appointments and transfers into the department
Terminations and transfers out of the department
Turnover rate
Lower skilled (Levels 1-2), Permanent 1 424 0 50 3.5
Skilled (Levels 3-5), Permanent 1 513 4 100 6.6Highly skilled production (Levels 6-8), Permanent
676 0 19 2.8
Highly skilled supervision (Levels 9-12), Permanent
350 0 7 2
Senior Management Service Band A, Permanent
38 0 1 2.6
Senior Management Service Band B, Permanent
9 0 0 0
Senior Management Service Band C, Permanent
3 0 0 0
Senior Management Service Band D, Permanent
2 0 0 0
Contract (Levels 1-2), Permanent 42 22 48 114.3Contract (Levels 3-5), Permanent 16 1 3 18.8Contract (Levels 6-8), Permanent 2 0 2 100Contract (Levels 9-12), Permanent 1 0 0 0Contract (Band A), Permanent 3 0 2 66.7TOTAL 4 079 27 232 5.7
Annual Report 201213.indb 61 8/19/2013 7:56:46 AM

ANNUAL
62
Table 3.4.2 Annual turnover rates by critical occupation Critical occupation Number of
employees at beginning of period-April 2012
Appointments and transfers into the department
Terminations and transfers out of the Department
Turnover rate
Admin related, Permanent 204 0 7 3.4All artisans in the building metal machinery etc., Permanent
224 0 12 5.4
Architects town and traffic planners, Permanent
3 0 0 0
Artisan project and related superintendents, Permanent
29 0 0 0
Auxiliary and related workers, Permanent
53 0 0 0
Boiler and related operators, Permanent
38 0 2 5.3
Building and other property caretakers, Permanent
14 0 1 7.1
Bus and heavy vehicle drivers, Permanent
18 0 1 5.6
Cartographers and surveyors, Permanent
1 0 0 0
Cartographic surveying and related technicians, Permanent
10 0 0 0
Civil engineering technicians, Permanent
6 0 0 0
Cleaners in offices workshops hospitals etc., Permanent
174 1 8 4.6
Client inform clerks(switchboard receptionist, inform clerks), Permanent
4 0 0 0
Communication and information related, Permanent
4 0 1 25
Electrical and electronics engineering technicians, Permanent
1 0 0 0
Engineering sciences related, Permanent
55 0 1 1.8
Engineers and related professionals, Permanent
22 0 3 13.6
Farm hands and labourers, Permanent
51 0 1 2
Finance and economics related, Permanent
25 1 1 4
Financial and related professionals, Permanent
37 0 0 0
Financial clerks and credit controllers, Permanent
154 0 3 1.9
Food services aids and waiters, Permanent
1 0 0 0
General legal admin and rel. Professionals, Permanent
1 0 0 0
Head of department/chief executive officer, Permanent
2 0 0 0
Human resources and organisational development and relate prof, Permanent
17 0 0 0
Human resources clerks, Permanent 81 0 3 3.7Human resources related, Permanent
59 21 43 72.9
Information technology related, Permanent
7 0 0 0
Inspectors of apprentices works and vehicles, Permanent
20 0 0 0
Language practitioners interpreters and other commun, Permanent
2 0 1 50
Legal related, Permanent 3 0 0 0
Annual Report 201213.indb 62 8/19/2013 7:56:47 AM

ANNUAL
63
Critical occupation Number of employees at beginning of period-April 2012
Appointments and transfers into the department
Terminations and transfers out of the Department
Turnover rate
Library mail and related clerks, Permanent
23 0 0 0
Light vehicle drivers, Permanent 37 0 2 5.4Logistical support personnel, Permanent
8 0 0 0
Material-recording and transport clerks, Permanent
9 0 0 0
Mechanical engineering technicians, Permanent
10 0 1 10
Messengers porters and deliverers, Permanent
9 0 3 33.3
Motor vehicle drivers, Permanent 21 0 1 4.8Motorised farm and forestry plant operators, Permanent
2 0 0 0
Natural sciences related, Permanent 5 0 0 0Other admin and related clerks and organisers, Permanent
140 2 3 2.1
Other admin policy and related officers, Permanent
10 0 0 0
Other information technology personnel., Permanent
1 0 0 0
Other machine operators, Permanent
1 0 0 0
Other occupations, Permanent 15 0 0 0Quantity surveyors and related prof not class elsewhere, Permanent
10 0 0 0
Regulatory inspectors, Permanent 78 0 3 3.8Risk management and security services, Permanent
3 0 0 0
Road superintendents, Permanent 78 0 5 6.4Road trade workers., Permanent 10 0 1 10Road workers, Permanent 1726 1 95 5.5Secretaries and other keyboard operating clerks, Permanent
163 1 9 5.5
Security guards, Permanent 5 0 0 0Senior managers, Permanent 29 0 3 10.3Social work and related professionals, Permanent
1 0 0 0
Trade labourers, Permanent 292 0 14 4.8Trade quality controllers, Permanent 17 0 0 0Trade related, Permanent 5 0 0 0Water plant and related operators, Permanent
51 0 4 7.8
TOTAL 4 079 27 232 5.7
The table below identifies the major reasons why staff left the department.
Table 3.4.3 Reasons why staff left the department Termination Type Number % of total
resignationsDeath 57 24.6Resignation 43 18.5Expiry of contract 46 19.8Dismissal – operational changes 0 0Dismissal – misconduct 1 0.4Discharged due to ill-health 5 2.2Retirement 80 34.5Transfer to other Public Service Departments 0 0TOTAL 232 -
Annual Report 201213.indb 63 8/19/2013 7:56:47 AM
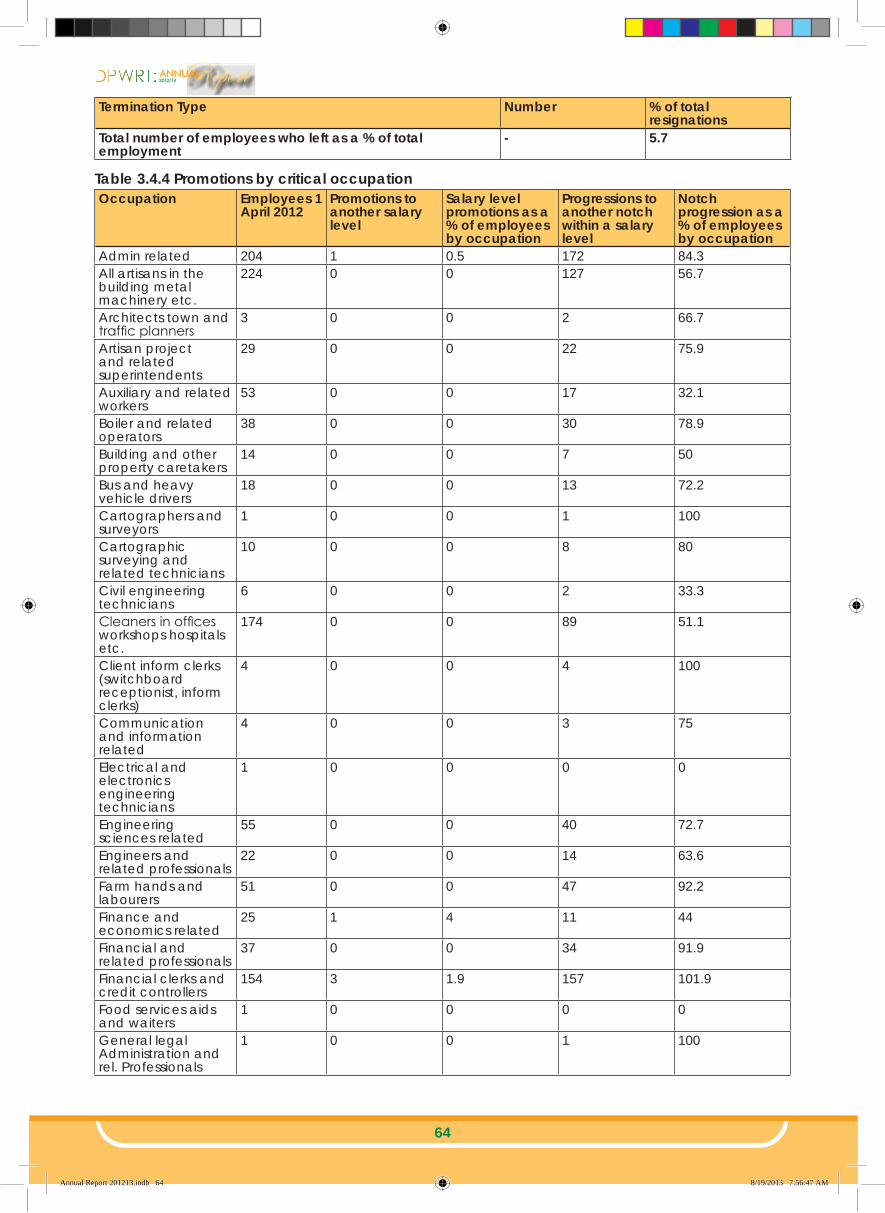
ANNUAL
64
Termination Type Number % of total resignations
Total number of employees who left as a % of total employment
- 5.7
Table 3.4.4 Promotions by critical occupationOccupation Employees 1
April 2012Promotions to another salary level
Salary level promotions as a % of employees by occupation
Progressions to another notch within a salary level
Notch progression as a % of employees by occupation
Admin related 204 1 0.5 172 84.3All artisans in the building metal machinery etc.
224 0 0 127 56.7
Architects town and traffic planners
3 0 0 2 66.7
Artisan project and related superintendents
29 0 0 22 75.9
Auxiliary and related workers
53 0 0 17 32.1
Boiler and related operators
38 0 0 30 78.9
Building and other property caretakers
14 0 0 7 50
Bus and heavy vehicle drivers
18 0 0 13 72.2
Cartographers and surveyors
1 0 0 1 100
Cartographic surveying and related technicians
10 0 0 8 80
Civil engineering technicians
6 0 0 2 33.3
Cleaners in offices workshops hospitals etc.
174 0 0 89 51.1
Client inform clerks (switchboard receptionist, inform clerks)
4 0 0 4 100
Communication and information related
4 0 0 3 75
Electrical and electronics engineering technicians
1 0 0 0 0
Engineering sciences related
55 0 0 40 72.7
Engineers and related professionals
22 0 0 14 63.6
Farm hands and labourers
51 0 0 47 92.2
Finance and economics related
25 1 4 11 44
Financial and related professionals
37 0 0 34 91.9
Financial clerks and credit controllers
154 3 1.9 157 101.9
Food services aids and waiters
1 0 0 0 0
General legal Administration and rel. Professionals
1 0 0 1 100
Annual Report 201213.indb 64 8/19/2013 7:56:47 AM

ANNUAL
65
Occupation Employees 1 April 2012
Promotions to another salary level
Salary level promotions as a % of employees by occupation
Progressions to another notch within a salary level
Notch progression as a % of employees by occupation
Head of department/chief executive officer
2 0 0 2 100
Human resources and organisation development and relate prof
17 0 0 13 76.5
Human resources clerks
81 0 0 69 85.2
Human resources related
59 0 0 27 45.8
Information technology related
7 0 0 5 71.4
Inspectors of apprentices works and vehicles
20 0 0 18 90
Language practitioners interpreters and other commun
2 0 0 1 50
Legal related 3 0 0 2 66.7Library mail and related clerks
23 0 0 20 87
Light vehicle drivers 37 0 0 11 29.7Logistical support personnel
8 0 0 5 62.5
Material-recording and transport clerks
9 0 0 5 55.6
Mechanical engineering technicians
10 0 0 8 80
Messengers porters and deliverers
9 0 0 4 44.4
Motor vehicle drivers 21 0 0 12 57.1Motorised farm and forestry plant operators
2 0 0 2 100
Natural sciences related
5 0 0 5 100
Other admin and related clerks and organisers
140 0 0 94 67.1
Other admin policy and related officers
10 0 0 8 80
Other information technology personnel.
1 0 0 0 0
Other machine operators
1 0 0 0 0
Other occupations 15 3 20 7 46.7Quantity surveyors and rela prof not class elsewhere
10 0 0 7 70
Regulatory inspectors
78 0 0 70 89.7
Risk management and security services
3 0 0 2 66.7
Road superintendents
78 0 0 60 76.9
Road trade workers. 10 0 0 6 60Road workers 1726 0 0 1303 75.5
Annual Report 201213.indb 65 8/19/2013 7:56:47 AM
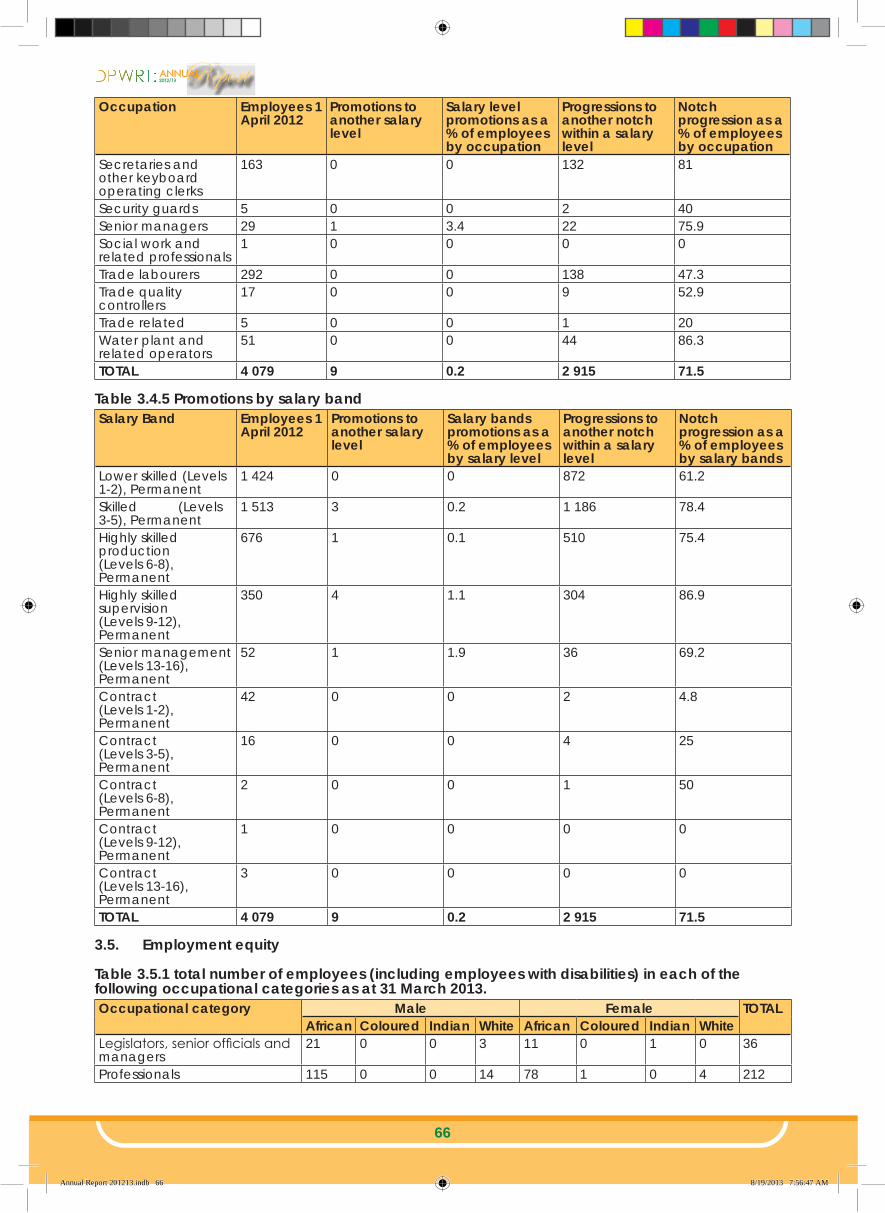
ANNUAL
66
Occupation Employees 1 April 2012
Promotions to another salary level
Salary level promotions as a % of employees by occupation
Progressions to another notch within a salary level
Notch progression as a % of employees by occupation
Secretaries and other keyboard operating clerks
163 0 0 132 81
Security guards 5 0 0 2 40Senior managers 29 1 3.4 22 75.9Social work and related professionals
1 0 0 0 0
Trade labourers 292 0 0 138 47.3Trade quality controllers
17 0 0 9 52.9
Trade related 5 0 0 1 20Water plant and related operators
51 0 0 44 86.3
TOTAL 4 079 9 0.2 2 915 71.5
Table 3.4.5 Promotions by salary bandSalary Band Employees 1
April 2012Promotions to another salary level
Salary bands promotions as a % of employees by salary level
Progressions to another notch within a salary level
Notch progression as a % of employees by salary bands
Lower skilled (Levels 1-2), Permanent
1 424 0 0 872 61.2
Skilled (Levels 3-5), Permanent
1 513 3 0.2 1 186 78.4
Highly skilled production (Levels 6-8), Permanent
676 1 0.1 510 75.4
Highly skilled supervision (Levels 9-12), Permanent
350 4 1.1 304 86.9
Senior management (Levels 13-16), Permanent
52 1 1.9 36 69.2
Contract (Levels 1-2), Permanent
42 0 0 2 4.8
Contract (Levels 3-5), Permanent
16 0 0 4 25
Contract (Levels 6-8), Permanent
2 0 0 1 50
Contract (Levels 9-12), Permanent
1 0 0 0 0
Contract (Levels 13-16), Permanent
3 0 0 0 0
TOTAL 4 079 9 0.2 2 915 71.5
3.5. Employment equity
Table 3.5.1 total number of employees (including employees with disabilities) in each of the following occupational categories as at 31 March 2013. Occupational category Male Female TOTAL
African Coloured Indian White African Coloured Indian WhiteLegislators, senior officials and managers
21 0 0 3 11 0 1 0 36
Professionals 115 0 0 14 78 1 0 4 212
Annual Report 201213.indb 66 8/19/2013 7:56:47 AM

ANNUAL
67
Occupational category Male Female TOTALAfrican Coloured Indian White African Coloured Indian White
Technicians and associate professionals
134 1 1 6 128 0 0 6 276
Clerks 242 2 0 3 302 2 0 18 569Service and sales workers 50 0 0 0 32 0 0 0 82Craft and related trades workers
266 0 0 48 47 0 0 0 361
Plant and machine operators and assemblers
121 0 0 6 21 0 0 0 148
Elementary occupations 1268 1 0 24 884 0 0 0 2177TOTAL 2 217 4 1 104 1 503 3 1 28 3 861Employees with disabilities 42 1 0 4 37 0 0 2 86
Table 3.5.2 total number of employees (including employees with disabilities) in each of the following occupational bands on 31 March 2013Occupational Band Male Female TOTAL
African Coloured Indian White African Coloured Indian WhiteTop Management, Permanent
2 0 0 1 1 0 0 1 5
Senior Management, Permanent
32 0 0 5 18 0 1 0 56
Professionally qualified and experienced specialists and mid-management, Permanent
214 1 1 25 106 1 0 7 355
Skilled technical and academically qualified workers, junior management, supervisors, foremen, Permanent
316 1 0 39 260 1 0 19 636
Semi-skilled and discretionary decision making, Permanent
1075 1 0 32 432 1 0 1 1542
Unskilled and defined decision making, Permanent
568 1 0 0 664 0 0 0 1233
Contract (Top Management), Permanent
1 0 0 0 0 0 0 0 1
Contract (Senior Management), Permanent
0 0 0 2 0 0 0 0 2
Contract (Skilled technical), Permanent
1 0 0 0 0 0 0 0 1
Contract (Semi-skilled), Permanent
2 0 0 0 13 0 0 0 15
Contract (Unskilled), Permanent
6 0 0 0 9 0 0 0 15
TOTAL 2217 4 1 104 1503 3 1 28 3 861
Table 3.5.3 Recruitment Occupational Band Male Female TOTAL
African Coloured Indian White African Coloured Indian WhiteSemi-skilled and discretionary decision making
2 0 0 0 2 0 0 0 4
Contract (Semi-skilled), Permanent
0 0 0 0 1 0 0 0 1
Contract (Unskilled), Permanent
11 0 0 0 11 0 0 0 22
TOTAL 13 0 0 0 14 0 0 0 27Employees with disabilities 0 0 0 0 0 0 0 0 0
Table 3.5.4 PromotionsOccupational Band Male Female TOTAL
African Coloured Indian White African Coloured Indian WhiteTop Management, Permanent
3 0 0 0 0 0 0 0 3
Annual Report 201213.indb 67 8/19/2013 7:56:48 AM

ANNUAL
68
Occupational Band Male Female TOTALAfrican Coloured Indian White African Coloured Indian White
Senior Management, Permanent
17 0 0 4 11 0 1 1 34
Professionally qualified and experienced specialists and mid-management, Permanent
188 1 1 20 91 1 0 6 308
Skilled technical and academically qualified workers, junior management, supervisors, foremen, Permanent
255 1 0 18 224 1 0 12 511
Semi-skilled and discretionary decision making, Permanent
852 1 0 24 310 1 0 1 1189
Unskilled and defined decision making, Permanent
433 1 0 0 438 0 0 0 872
Contract (Skilled technical), Permanent
1 0 0 0 0 0 0 0 1
Contract (Semi-skilled), Permanent
2 0 0 0 2 0 0 0 4
Contract (Unskilled), Permanent
0 0 0 0 2 0 0 0 2
TOTAL 1 751 4 1 66 1 078 3 1 20 2 924Employees with disabilities 28 1 0 3 22 0 0 2 56
Table 3.5.5 TerminationsOccupational Band Male Female TOTAL
African Coloured Indian White African Coloured Indian WhiteSenior Management, Permanent
0 0 0 0 1 0 0 0 1
Professionally qualified and experienced specialists and mid-management, Permanent
6 0 0 1 0 0 0 0 7
Skilled technical and academically qualified workers, junior management, supervisors, foremen, Permanent
10 0 0 4 4 0 0 1 19
Semi-skilled and discretionary decision making, Permanent
83 0 0 2 15 0 0 0 100
Unskilled and defined decision making, Permanent
28 0 0 0 22 0 0 0 50
Contract (Senior Management), Permanent
2 0 0 0 0 0 0 0 2
Contract (Skilled technical), Permanent
2 0 0 0 0 0 0 0 2
Contract (Semi-skilled), Permanent
1 0 0 0 2 0 0 0 3
Contract (Unskilled), Permanent
24 0 0 0 24 0 0 0 48
TOTAL 156 0 0 7 68 0 0 1 232Employees with Disabilities
7 0 0 7 1 0 0 0 8
Table 3.5.6 Skills development Occupational category Male Female TOTAL
African Coloured Indian White African Coloured Indian WhiteLegislators, senior officials and managers
6 0 0 3 8 0 0 0 17
Annual Report 201213.indb 68 8/19/2013 7:56:48 AM
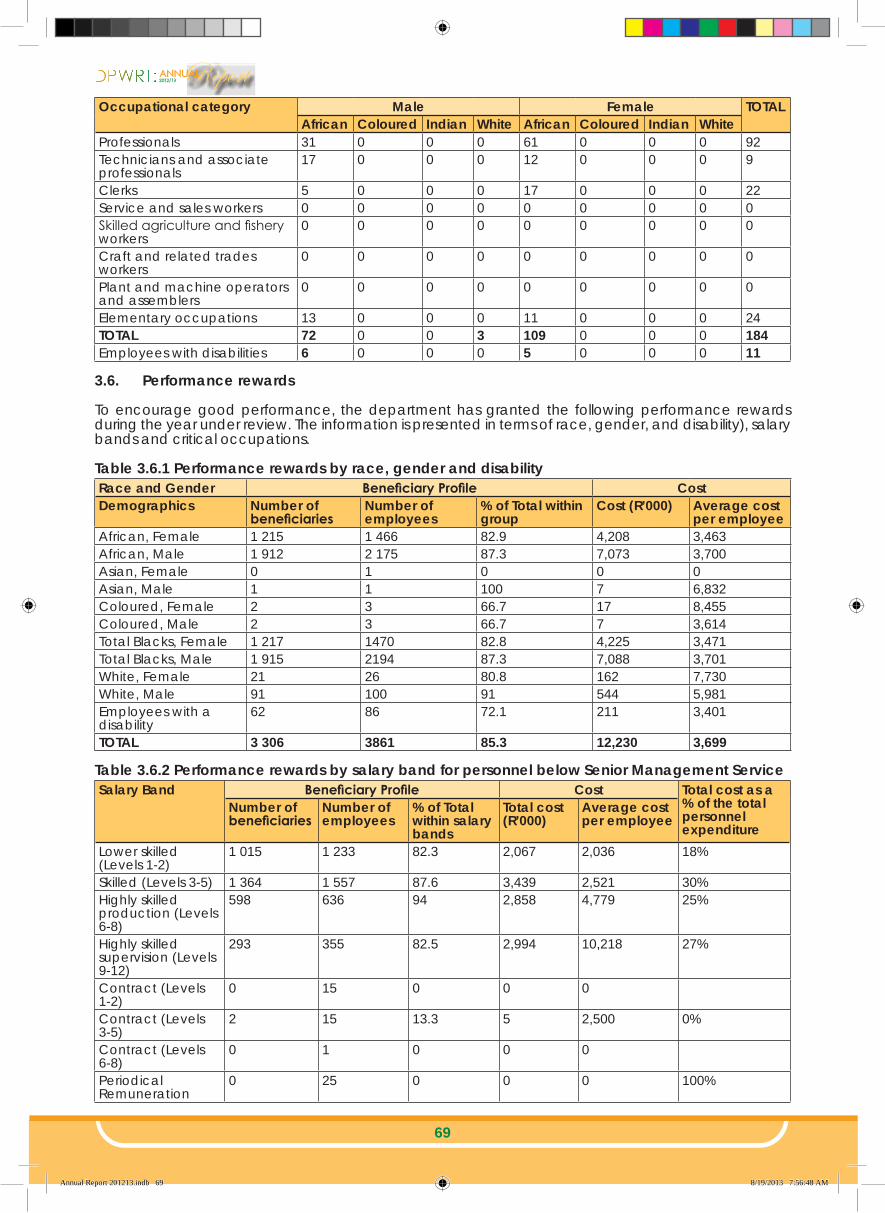
ANNUAL
69
Occupational category Male Female TOTALAfrican Coloured Indian White African Coloured Indian White
Professionals 31 0 0 0 61 0 0 0 92Technicians and associate professionals
17 0 0 0 12 0 0 0 9
Clerks 5 0 0 0 17 0 0 0 22Service and sales workers 0 0 0 0 0 0 0 0 0Skilled agriculture and fishery workers
0 0 0 0 0 0 0 0 0
Craft and related trades workers
0 0 0 0 0 0 0 0 0
Plant and machine operators and assemblers
0 0 0 0 0 0 0 0 0
Elementary occupations 13 0 0 0 11 0 0 0 24TOTAL 72 0 0 3 109 0 0 0 184Employees with disabilities 6 0 0 0 5 0 0 0 11
3.6. Performance rewards
To encourage good performance, the department has granted the following performance rewards during the year under review. The information is presented in terms of race, gender, and disability), salary bands and critical occupations.
Table 3.6.1 Performance rewards by race, gender and disabilityRace and Gender Beneficiary Profile CostDemographics Number of
beneficiariesNumber of employees
% of Total within group
Cost (R’000) Average cost per employee
African, Female 1 215 1 466 82.9 4,208 3,463African, Male 1 912 2 175 87.3 7,073 3,700Asian, Female 0 1 0 0 0Asian, Male 1 1 100 7 6,832Coloured, Female 2 3 66.7 17 8,455Coloured, Male 2 3 66.7 7 3,614Total Blacks, Female 1 217 1470 82.8 4,225 3,471Total Blacks, Male 1 915 2194 87.3 7,088 3,701White, Female 21 26 80.8 162 7,730White, Male 91 100 91 544 5,981Employees with a disability
62 86 72.1 211 3,401
TOTAL 3 306 3861 85.3 12,230 3,699
Table 3.6.2 Performance rewards by salary band for personnel below Senior Management ServiceSalary Band Beneficiary Profile Cost Total cost as a
% of the total personnel expenditure
Number of beneficiaries
Number of employees
% of Total within salary bands
Total cost (R’000)
Average cost per employee
Lower skilled (Levels 1-2)
1 015 1 233 82.3 2,067 2,036 18%
Skilled (Levels 3-5) 1 364 1 557 87.6 3,439 2,521 30%Highly skilled production (Levels 6-8)
598 636 94 2,858 4,779 25%
Highly skilled supervision (Levels 9-12)
293 355 82.5 2,994 10,218 27%
Contract (Levels 1-2)
0 15 0 0 0
Contract (Levels 3-5)
2 15 13.3 5 2,500 0%
Contract (Levels 6-8)
0 1 0 0 0
Periodical Remuneration
0 25 0 0 0 100%
Annual Report 201213.indb 69 8/19/2013 7:56:48 AM

ANNUAL
70
Salary Band Beneficiary Profile Cost Total cost as a % of the total personnel expenditure
Number of beneficiaries
Number of employees
% of Total within salary bands
Total cost (R’000)
Average cost per employee
Abnormal Appointment
0 5 399 0 0 0 18%
TOTAL 3 272 9 236 35.4 11,363 3,473 30% Table 3.6.3 Performance rewards by critical occupationCritical occupation Beneficiary profile Cost
Number of beneficiaries
Number of employees
% of total within occupation
Total cost (R’000)
Average cost per employee
Admin related 157 198 79.3 1,375 8,758All artisans in the building metal machinery etc.
200 212 94.3 842 4,210
Architects town and traffic planners 2 3 66.7 45 22,500Artisan project and related superintendents
25 28 89.3 192 7,680
Auxiliary and related workers 30 31 96.8 72 2,400Boiler and related operators 25 36 69.4 66 2,640Building and other property caretakers
12 13 92.3 25 2,083
Bus and heavy vehicle drivers 17 17 100 41 2,412Cartographers and surveyors 0 1 0 0 0Cartographic surveying and related technicians
9 9 100 63 7,000
Civil engineering technicians 5 7 71.4 31 6,200Cleaners in offices workshops hospitals etc.
149 166 89.8 318 2,134
Client inform clerks(switchboard, recept inform clerks)
4 4 100 14 3,500
Communication and information related
4 3 133.3 19 4,750
Electrical and electronics engineering technicians
0 1 0 0 0
Engineering sciences related 41 56 73.2 431 10,512Engineers and related professionals 14 19 73.7 267 19,071Farm hands and labourers 48 50 96 97 2,021Finance and economics related 13 15 86.7 108 8,308Financial and related professionals 33 38 86.8 297 9,000Financial clerks and credit controllers 158 172 91.9 744 4,709General legal Administration and rel. Professionals
1 1 100 17 17,000
Head of department/chief executive officer
2 2 100 35 17,500
Human resources and organisat development and relate prof
9 14 64.3 81 9,000
Human resources clerks 66 77 85.7 255 3,864Human resources related 25 41 61 203 8,120Information technology related 4 7 57.1 24 6,000Inspectors of apprentices works and vehicles
18 20 90 153 8,500
Language practitioners interpreters and other commun
1 1 100 5 5,000
Legal related 3 3 100 73 24,333Library mail and related clerks 19 22 86.4 69 3,632Light vehicle drivers 23 28 82.1 59 2,565Logistical support personnel 6 6 100 30 5,000Material-recording and transport clerks
7 8 87.5 28 4,000
Mechanical engineering technicians 4 9 44.4 46 11,500
Annual Report 201213.indb 70 8/19/2013 7:56:49 AM

ANNUAL
71
Critical occupation Beneficiary profile CostNumber of beneficiaries
Number of employees
% of total within occupation
Total cost (R’000)
Average cost per employee
Messengers porters and deliverers 8 6 133.3 20 2,500Motor vehicle drivers 17 17 100 43 2,529Motorised farm and forestry plant operators
2 2 100 4 2,000
Natural sciences related 5 5 100 16 3,200Other admin and related clerks and organisers
102 133 76.7 430 4,216
Other admin policy and related officers
8 10 80 65 8,125
Other machine operators 1 1 100 2 2,000Other occupations 11 15 73.3 79 7,182Quantity surveyors and rela prof not class elsewhere
4 9 44.4 63 15,750
Regulatory inspectors 65 74 87.8 333 5,123Risk management and security services
1 3 33.3 5 5,000
Road superintendents 68 72 94.4 297 4,368Road trade workers. 10 9 111.1 50 5,000Road workers 1 405 1 647 84.5 3,137 2,204Secretaries and other keyboard operating clerks
126 153 82.4 368 2,921
Security guards 4 5 80 8 2,000Senior managers 15 33 45.5 420 28,000Social work and related professionals 1 1 100 4 4,000Trade labourers 251 281 89.3 559 2,227Trade quality controllers 16 17 94.1 94 5,875Trade related 3 3 100 16 5,333Water plant and related operators 49 47 104.3 130 2,653TOTAL 3 306 3 861 85.3 12, 268 3,699
Table 3.6.4 Performance related rewards (cash bonus), by salary band for Senior Management ServiceSalary Band Beneficiary Profile Cost Total cost as a
% of the total personnel expenditure
Number of beneficiaries
Number of employees
% of Total within salary bands
Total cost (R’000)
Average cost per employee
Band A 21 46 45.7 483 23,000 1.1Band B 1 12 8.3 28 28,000 0.2Band C 0 4 0 0 0 0Band D 1 2 50 94 94,000 2.7TOTAL 23 64 35.9 605 26,304.3 1
3.7. Foreign workers
The tables below summarise the employment of foreign nationals in the department in terms of salary band and major occupation.
Table 3.7.1 Foreign workers by salary band Salary band 01 April 2012 31 March 2013 Change
Number % of total Number % of total Number % ChangeLower skilled 1 4.8 1 4.8 0 0
Skilled (levels 3-5)
2 9.5 2 9.5 0 0
Abnormal appointment
18 85.7 18 85.7 11 100
TOTAL 21 100 21 100 11 100
Annual Report 201213.indb 71 8/19/2013 7:56:49 AM
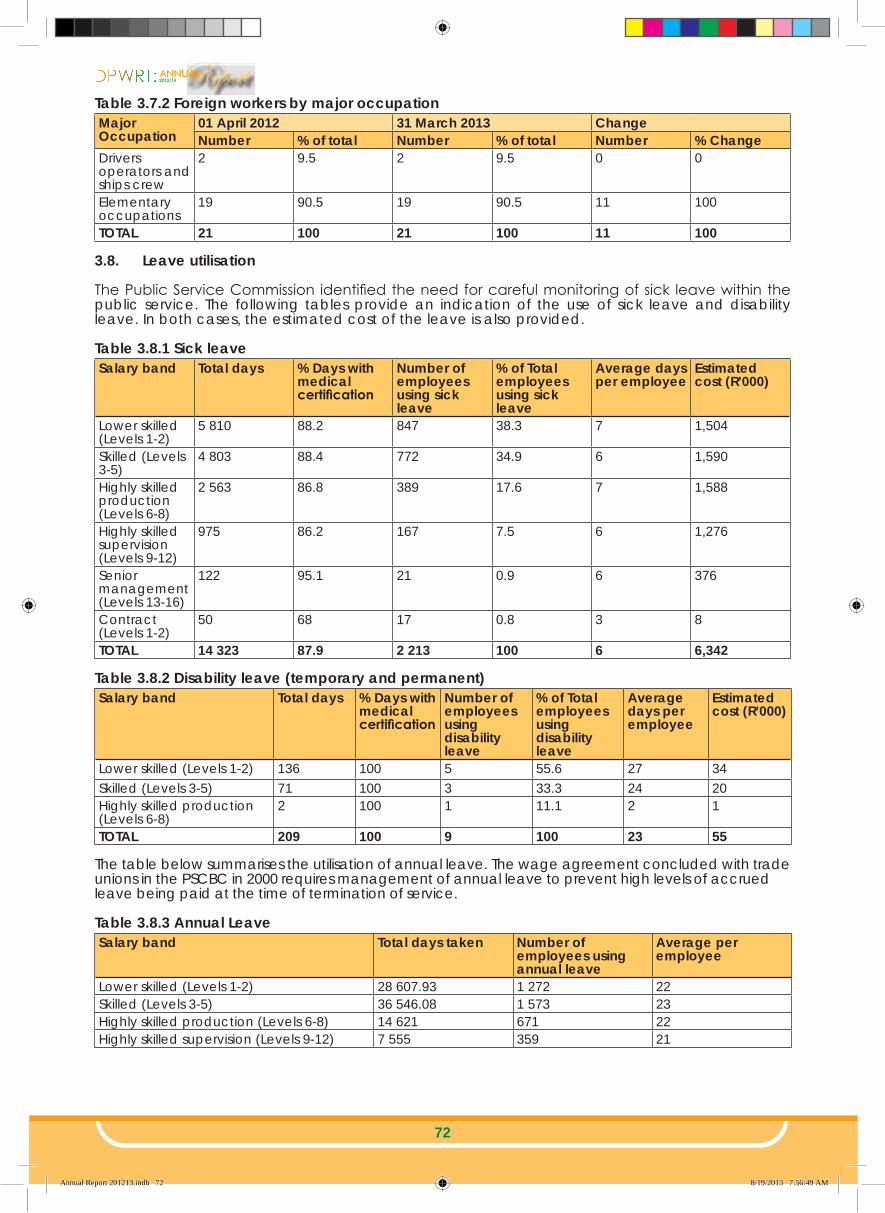
ANNUAL
72
Table 3.7.2 Foreign workers by major occupation Major Occupation
01 April 2012 31 March 2013 ChangeNumber % of total Number % of total Number % Change
Drivers operators and ships crew
2 9.5 2 9.5 0 0
Elementary occupations
19 90.5 19 90.5 11 100
TOTAL 21 100 21 100 11 100
3.8. Leave utilisation
The Public Service Commission identified the need for careful monitoring of sick leave within the public service. The following tables provide an indication of the use of sick leave and disability leave. In both cases, the estimated cost of the leave is also provided.
Table 3.8.1 Sick leaveSalary band Total days % Days with
medical certification
Number of employees using sick leave
% of Total employees using sick leave
Average days per employee
Estimated cost (R’000)
Lower skilled (Levels 1-2)
5 810 88.2 847 38.3 7 1,504
Skilled (Levels 3-5)
4 803 88.4 772 34.9 6 1,590
Highly skilled production (Levels 6-8)
2 563 86.8 389 17.6 7 1,588
Highly skilled supervision (Levels 9-12)
975 86.2 167 7.5 6 1,276
Senior management (Levels 13-16)
122 95.1 21 0.9 6 376
Contract (Levels 1-2)
50 68 17 0.8 3 8
TOTAL 14 323 87.9 2 213 100 6 6,342
Table 3.8.2 Disability leave (temporary and permanent) Salary band Total days % Days with
medical certification
Number of employees using disability leave
% of Total employees using disability leave
Average days per employee
Estimated cost (R’000)
Lower skilled (Levels 1-2) 136 100 5 55.6 27 34Skilled (Levels 3-5) 71 100 3 33.3 24 20Highly skilled production (Levels 6-8)
2 100 1 11.1 2 1
TOTAL 209 100 9 100 23 55
The table below summarises the utilisation of annual leave. The wage agreement concluded with trade unions in the PSCBC in 2000 requires management of annual leave to prevent high levels of accrued leave being paid at the time of termination of service.
Table 3.8.3 Annual Leave Salary band Total days taken Number of
employees using annual leave
Average per employee
Lower skilled (Levels 1-2) 28 607.93 1 272 22Skilled (Levels 3-5) 36 546.08 1 573 23Highly skilled production (Levels 6-8) 14 621 671 22Highly skilled supervision (Levels 9-12) 7 555 359 21
Annual Report 201213.indb 72 8/19/2013 7:56:49 AM
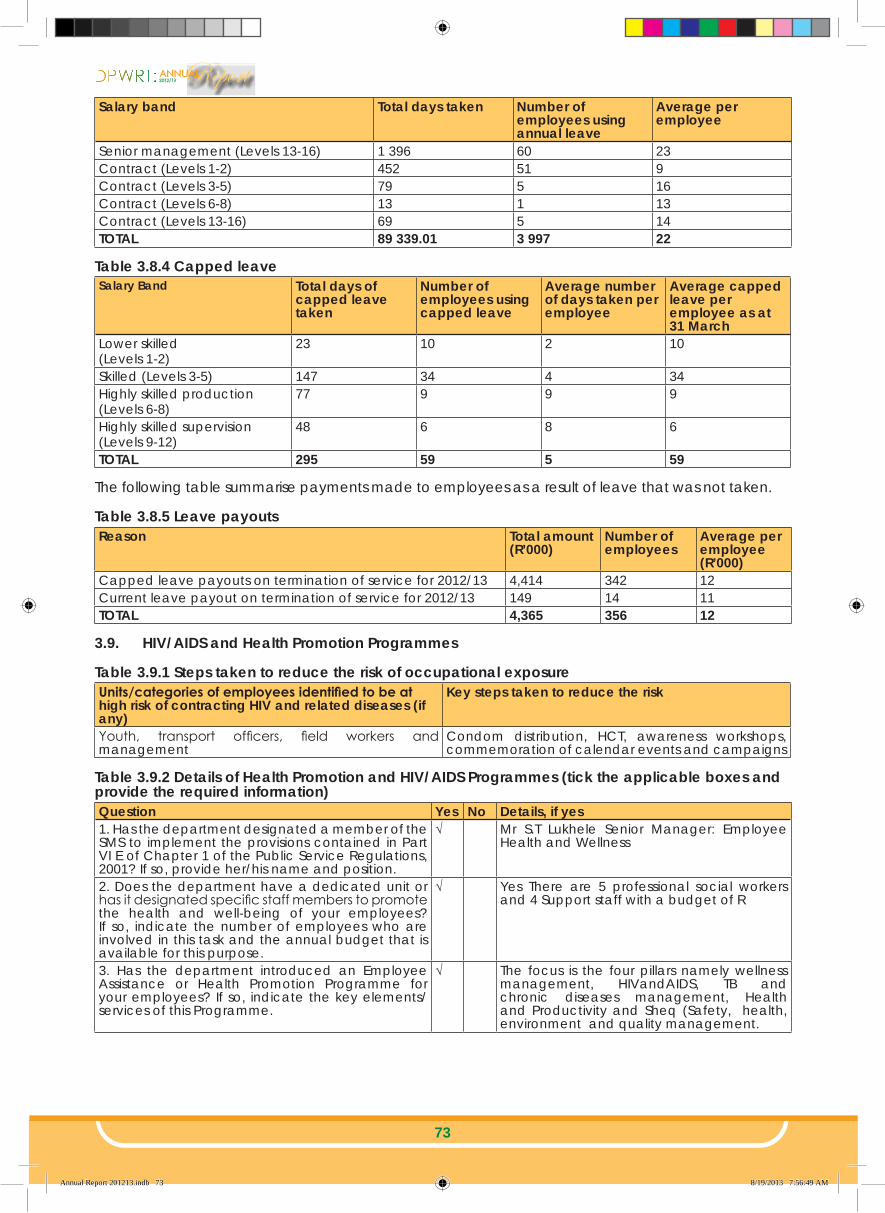
ANNUAL
73
Salary band Total days taken Number of employees using annual leave
Average per employee
Senior management (Levels 13-16) 1 396 60 23Contract (Levels 1-2) 452 51 9Contract (Levels 3-5) 79 5 16Contract (Levels 6-8) 13 1 13Contract (Levels 13-16) 69 5 14TOTAL 89 339.01 3 997 22
Table 3.8.4 Capped leave Salary Band Total days of
capped leave taken
Number of employees using capped leave
Average number of days taken per employee
Average capped leave per employee as at 31 March
Lower skilled (Levels 1-2)
23 10 2 10
Skilled (Levels 3-5) 147 34 4 34Highly skilled production (Levels 6-8)
77 9 9 9
Highly skilled supervision (Levels 9-12)
48 6 8 6
TOTAL 295 59 5 59
The following table summarise payments made to employees as a result of leave that was not taken.
Table 3.8.5 Leave payoutsReason Total amount
(R’000)Number of employees
Average per employee (R’000)
Capped leave payouts on termination of service for 2012/13 4,414 342 12Current leave payout on termination of service for 2012/13 149 14 11TOTAL 4,365 356 12
3.9. HIV/AIDS and Health Promotion Programmes
Table 3.9.1 Steps taken to reduce the risk of occupational exposureUnits/categories of employees identified to be at high risk of contracting HIV and related diseases (if any)
Key steps taken to reduce the risk
Youth, transport officers, field workers and management
Condom distribution, HCT, awareness workshops, commemoration of calendar events and campaigns
Table 3.9.2 Details of Health Promotion and HIV/AIDS Programmes (tick the applicable boxes and provide the required information)Question Yes No Details, if yes1. Has the department designated a member of the SMS to implement the provisions contained in Part VI E of Chapter 1 of the Public Service Regulations, 2001? If so, provide her/his name and position.
√ Mr S.T Lukhele Senior Manager: Employee Health and Wellness
2. Does the department have a dedicated unit or has it designated specific staff members to promote the health and well-being of your employees? If so, indicate the number of employees who are involved in this task and the annual budget that is available for this purpose.
√ Yes There are 5 professional social workers and 4 Support staff with a budget of R
3. Has the department introduced an Employee Assistance or Health Promotion Programme for your employees? If so, indicate the key elements/services of this Programme.
√ The focus is the four pillars namely wellness management, HIVandAIDS, TB and chronic diseases management, Health and Productivity and Sheq (Safety, health, environment and quality management.
Annual Report 201213.indb 73 8/19/2013 7:56:49 AM

ANNUAL
74
Question Yes No Details, if yes4. Has the department established (a) committee(s) as contemplated in Part VI E.5 (e) of Chapter 1 of the Public Service Regulations, 2001? If so, please provide the names of the members of the committee and the stakeholder(s) that they represent.
√ In all the Districts there are representatives of the different cost centres.Ms Monica Mahlangu: NkangalaMs Smangele Nkosi: EhlanzeniMr Oupa Nhleko: Gert SibandeMr Sam Silinda: Bohlabela
5. Has the department reviewed its employment policies and practices to ensure that these do not unfairly discriminate against employees on the basis of their HIV status? If so, list the employment policies/practices so reviewed.
√ The HIVandAIDS policyThe Wellness management policyThe Sports policy
6. Has the department introduced measures to protect HIV-positive employees or those perceived to be HIV-positive from discrimination? If so, list the key elements of these measures.
√ Through the HIV and AIDS policy
7. Does the department encourage its employees to undergo Voluntary Counselling and Testing? If so, list the results that you have you achieved.
√ During the wellness days and all the workshops conducted by the section. The results have been negative in the sense that very few people go for testing.
8. Has the department developed measures/indicators to monitor and evaluate the impact of its health promotion programme? If so, list these measures/indicators.
√ Evaluation of Programmes implemented is done on annual basis
3.10. Labour relations
The following table summarises the outcome of disciplinary hearings conducted within the department for the year under review.
Table 3.10.1 Misconduct and disciplinary hearings finalisedOutcomes of disciplinary hearings Number % of TotalVerbal warning 05 10%Written warning 09 17%Final written warning 08 15%Suspended without pay 06 12%Dismissal 04 8%Not guilty 06 12%Case withdrawn 14 27%TOTAL 52 100%
Table 3.10.2 Types of misconduct addressed at disciplinary hearings Type of misconduct (based on annexure A) Number % of TotalTheft , Fraud and Bribe 07 46.7%Absenteeism 06 40.0%Gross Negligence 01 6.7%Un-authorised use of state vehicle 01 6.7%TOTAL 15 100%
Table 3.10.3 Grievances logged Grievances Number % of TotalNumber of grievances resolved 17 63%Number of grievances not resolved 10 37%TOTAL number of grievances lodged 27 100%
Table 3.10.4 Disputes loggedNumber % of Total
Number of disputes upheld 02 10%Number of disputes dismissed 07 35%Disputes awaiting date for an arbitration hearing 11 55%TOTAL number of disputes lodged 20 100%
Annual Report 201213.indb 74 8/19/2013 7:56:49 AM

ANNUAL
75
Table 3.10.6 Strike actions Total number of persons working days lost 0Total costs working days lost 0Amount (R’000) recovered as a result of no work no pay
0
Table 3.10.7 Precautionary suspensionsNumber of people suspended 2Number of people who’s suspension exceeded 30 days
2
Average number of days suspended 637Cost (R’000) of suspension 153
3.11. Skills development
This section highlights the efforts of the department with regard to skills development.
Table 3.11.1 Training needs identifiedOccupational category
Gender Number of employees as at 1 April 2012
Training needs identified at start of the reporting periodLearnerships Skills
programmes and other short courses
Other forms of training
TOTAL
Legislators, senior officials and managers
Female 12 0 0 0 0Male 24 0 0 0 0
Professionals Female 83 0 283 0 283Male 129 0 150 0 150
Technicians and associate professionals
Female 134 0 30 0 30Male 142 0 104 0 104
Clerks Female 322 0 05 0 5Male 247 0 04 0 4
Plant and machine operators and assemblers
Female 100 0 0 0 0Male 491 0 02 0 2
Elementary occupations
Female 884 09 02 0 11Male 1 308 06 0 0 6
Sub Total Female 1 535 09 320 0 329Male 2 341 06 260 0 264
TOTAL 3 786 15 580 0 595
Table 3.11.2 Training provided for the periodOccupational category Gender Number of
employees as at 1 April 2012
Training provided within the reporting periodLearnerships Skills
programmes and other short courses
Other forms of training
TOTAL
Legislators, senior officials and managers
Female 12 0 08 21 29Male 24 0 11 11 22
Professionals Female 83 0 35 25 60Male 129 0 13 37 50
Technicians and associate professionals
Female 134 0 01 09 10Male 142 0 00 12 12
Clerks Female 322 0 17 186 203Male 247 0 05 96 101
Plant and machine operators and assemblers
Female 100 0 10 0 10Male 491 0 15 0 15
Elementary occupations Female 884 09 45 166 220Male 1 308 06 35 93 134
Sub total Female 1 535 09 116 407 532Male 2 341 06 79 249 334
TOTAL 3 786 15 195 656 866
Annual Report 201213.indb 75 8/19/2013 7:56:49 AM

ANNUAL
76
3.12. Injury on duty
The following tables provide basic information on injury on duty.
Table 3.12.1 Injury on dutyNature of injury on duty Number % of TotalRequired basic medical attention only 17 100%Temporary total disablement 0 -Permanent disablement 0 -Fatal 0 -TOTAL 17 100%
Annual Report 201213.indb 76 8/19/2013 7:56:50 AM

ANNUAL
77
PART E: FINANCIAL STATEMENTS
Annual Report 201213.indb 77 8/19/2013 7:56:54 AM

ANNUAL
78
Annual Report 201213.indb 78 8/19/2013 7:56:55 AM

ANNUAL
79
DEPARTMENT OF PUBLIC WORKS, ROADS AND TRANSPORT
ANNUAL FINANCIAL STATEMENTS
For the year ended 31 March 2013
Annual Report 201213.indb 79 8/19/2013 7:56:55 AM

ANNUAL
80
TABLE OF CONTENTSReport of the Audit Committee 81
Report of the Accounting Officer 83
Report of the Auditor-General 89
Appropriation Statement 94
Notes to the Appropriation Statement 106
Statement of Financial Performance 111
Statement of Financial Position 112
Statement of Changes in Net Assets 113
Cash Flow Statement 114
Notes to the Annual Financial Statements (including Accounting policies) 115
Disclosures Notes to the Annual Financial Statements 129
Annexures 145
Mpumalanga ProvinceDepartment of Public Works, Roads and Transport
Vote 8
Annual Financial Statementsfor the year ended 31 March 2013
Annual Report 201213.indb 80 8/19/2013 7:56:55 AM
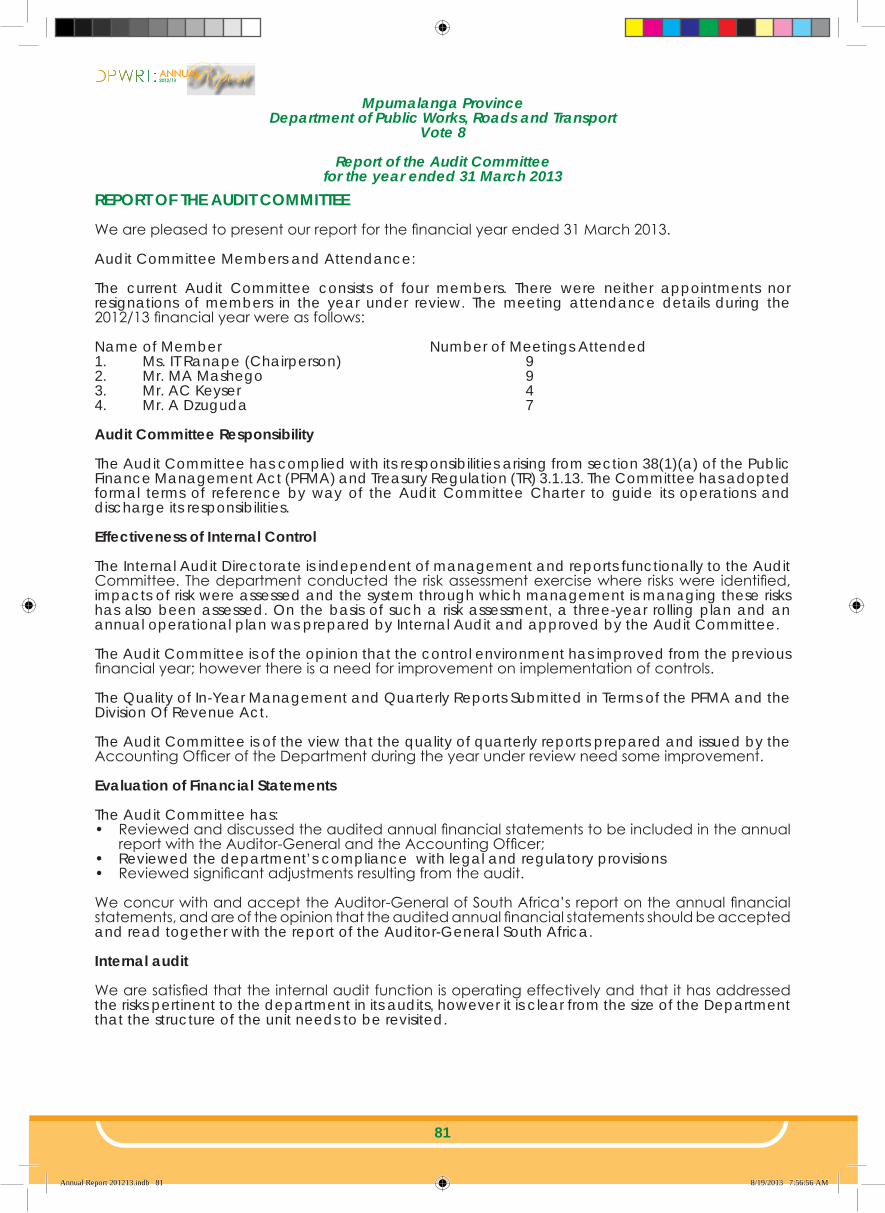
ANNUAL
81
REPORT OF THE AUDIT COMMITTEE
We are pleased to present our report for the financial year ended 31 March 2013.
Audit Committee Members and Attendance:
The current Audit Committee consists of four members. There were neither appointments nor resignations of members in the year under review. The meeting attendance details during the 2012/13 financial year were as follows:
Name of Member Number of Meetings Attended1. Ms. IT Ranape (Chairperson) 92. Mr. MA Mashego 93. Mr. AC Keyser 44. Mr. A Dzuguda 7
Audit Committee Responsibility
The Audit Committee has complied with its responsibilities arising from section 38(1)(a) of the Public Finance Management Act (PFMA) and Treasury Regulation (TR) 3.1.13. The Committee has adopted formal terms of reference by way of the Audit Committee Charter to guide its operations and discharge its responsibilities.
Effectiveness of Internal Control
The Internal Audit Directorate is independent of management and reports functionally to the Audit Committee. The department conducted the risk assessment exercise where risks were identified, impacts of risk were assessed and the system through which management is managing these risks has also been assessed. On the basis of such a risk assessment, a three-year rolling plan and an annual operational plan was prepared by Internal Audit and approved by the Audit Committee.
The Audit Committee is of the opinion that the control environment has improved from the previous financial year; however there is a need for improvement on implementation of controls.
The Quality of In-Year Management and Quarterly Reports Submitted in Terms of the PFMA and the Division Of Revenue Act.
The Audit Committee is of the view that the quality of quarterly reports prepared and issued by the Accounting Officer of the Department during the year under review need some improvement.
Evaluation of Financial Statements
The Audit Committee has:• Reviewed and discussed the audited annual financial statements to be included in the annual
report with the Auditor-General and the Accounting Officer;• Reviewed the department’s compliance with legal and regulatory provisions• Reviewed significant adjustments resulting from the audit.
We concur with and accept the Auditor-General of South Africa’s report on the annual financial statements, and are of the opinion that the audited annual financial statements should be accepted and read together with the report of the Auditor-General South Africa.
Internal audit
We are satisfied that the internal audit function is operating effectively and that it has addressed the risks pertinent to the department in its audits, however it is clear from the size of the Department that the structure of the unit needs to be revisited.
Mpumalanga ProvinceDepartment of Public Works, Roads and Transport
Vote 8
Report of the Audit Committeefor the year ended 31 March 2013
Annual Report 201213.indb 81 8/19/2013 7:56:56 AM

ANNUAL
82
Auditor-General South Africa
We have also met with the Auditor- General South Africa to ensure that there are no unresolved issues.
I would like to take this opportunity to thank my fellow Audit Committee members for their support and service given during the year under review. My special thanks also goes to the Head of Department and his Management team for their input and support during this period.
…………………………………………......Chairperson of the Audit Committee
Mpumalanga ProvinceDepartment of Public Works, Roads and Transport
Vote 8
Report of the Audit Committeefor the year ended 31 March 2013
Annual Report 201213.indb 82 8/19/2013 7:56:56 AM

ANNUAL
83
Mpumalanga ProvinceDepartment of Public Works, Roads and Transport
Vote 8
Report of the Accounting Officerfor the year ended 31 March 2013
REPORT BY THE ACCOUNTING OFFICER TO THE EXECUTIVE AUTHORITY AND PARLIAMENT/PROVINCIAL LEGISLATURE OF THE REPUBLIC OF SOUTH AFRICA.
1. General review of the state of financial affairsThe Department was allocated a budget of R 3,510,977 billion during the 2012/13 financial year as compared to R 3,593,209 billion for 2011/12 financial year. The departmental budget increased by R 16,504 million during budget adjustment resulting in a total budget of R 3,527,481 billion.
The above increase is as a result of an additional amount of R 16,617 million for Expanded Public Works Program (EPWP) Incentive Grant, a roll over amount of R 2,311 million, and an amount of R 2,424 million for the bursary fund. The bursary fund was transferred to the Department of Education during budget adjustment to augment a shortfall for bursary funds.
1.1 Important policy decisions and strategic issues facing the department
EXCO granted approval for the filling of 43 critical posts which included 7 Senior Management Services posts. The recruitment processes related to these posts commenced in December 2012 and most of the prospective new employees were expected to assume duties on 01 April 2013.
Various reforms were introduced within the payment value chain. The submission of all invoices was centralized to the Finance Section for easy management and tracking. This approach bore immediate impact on the payment levels which improved from 99% to 100%.
The spill-over effect of the accruals from 2011/12 had a significant bearing on the operations of the 2012/13 financial year. Cost curtailment measures were introduced and realized savings used to off-set these accruals. As a result, alignments were made on the approved plans and budget allocations which resulted in minimal impact on service delivery.
A lot of access roads to public amenities have deteriorated as a result of the effects of flooding in the Province especially over the period 2010/11 to 2012/13. The National Department of Transport promised to appropriate the required funding in line with the South African institutional framework for natural disasters. However, the anticipated funding did not materialize which necessitated adjustments of the approved plans and alignment of the allocated budget during the year.
The Department made an application to Treasury for reclassification of some roads infrastructure projects which would allow the upgrading of gravel roads to surface roads to be funded from the Provincial Roads Maintenance Grant (PRMG). An affirmative response in this regard was received late in September 2012.
1.2 Significant events that have taken place during the year
The following events were conducted by the department during the 2012/2013 financial year:Name of event Municipality DatePolicy and Budget Speech Mbombela 31 May 2011Mandela Day celebration( patching of potholes) Mkhondo 18 July 2011Mandela Day Project ( Renovation of a centre for abused Women & children and Donation of sanitary towels)
Bushbuckridge 21 July 2011
Provincial Wellness Games Steve Tshwete 12 August 2011Long Service awards Msukalikwa 02 September 2011Launch of Provincial October Transport month programme Mbombela 04 October 2011National Youth Service graduation ceremony Mbombela 07 October 2011Scholar transport monitoring operation Mbombela 13 October 2011Patching of potholes Mkhondo 18 October 2011Opening of Ntombe foot bridge Mkhondo 18 October 2011Opening of Acornhoek to Orpen road Bushbuckridge 21 October 2011KAMOSO awards ceremony Emalahleni 04 November 2011Opening of Witbank-Ogies road Emalahleni 08 November 2011
Annual Report 201213.indb 83 8/19/2013 7:56:56 AM

ANNUAL
84
1.3 The Department completed the following major projects during the year:Name of Project DistrictUpgrading from gravel to surfaced of road D481 Mooiplaas to Ekulindeni (9.6km) Gert SibandeConstruction of Goromane bridge EhlanzeniUpgrading from gravel to surfaced of road D1869 and D1870 between Marloth Park and Komatiport (18,5km)
Ehlanzeni
Construction of culvert bridge at Nyongane EhlanzeniConstruction of foot bridge at Ntombe 1 Gert SibandeConstruction of culvert bridge at Msogwaba (Gedlembane) EhlanzeniConstruction of culvert bridge at Daantjie EhlanzeniConstruction of culvert bridge at Newscom EhlanzeniConstruction of culvert bridge at Mambazane EhlanzeniConstruction of sidewalk at Boschofontein (4.5km) EhlanzeniConstruction of bus shelters at Senotlelo, Mabhoko B,Londing and Leufontein (4) NkangalaConstruction of a workshop at Nkangala Clinical Workshop NkangalaRenovations & upgrading of psychiatric, allied, postnatal & chronic wards at Themba Hospital EhlanzeniConstruction of 30 x doctors units accommodation at Themba Hospital EhlanzeniConstruction of Repair & Renovations of existing roof and 2 wards at Middleburg Hospital NkangalaConstruction of Repair & Renovations of existing roof and 2 wards at Barberton Hospital EhlanzeniConstruction of the clinic at Warburton Clinic Gert SibandeConstruction of the clinic & 2x2 bedroom accommodation at Lochiel Clinic Gert SibandeConstruction of new Medico-Legal Laboratory at Evander Hospital Gert SibandeConstruction of 2x two bedroom house and Community Health Centre at Masibekela Community Health Centre
Ehlanzeni
Upgrading of water reticulation at Ermelo Hospital Gert SibandeConstruction of new offices at Bethal branch office Gert SibandeConstruction of 10 offices at Marapyane branch offices NkangalaConstruction of library at Hluvukani Library EhlanzeniConstruction of library at Butleng Library NkangalaEradication of 128 unsafe structures (Mud Schools) Various districtsConstruction of 17 Grade 12 facilities Various districtsConstruction of 15 storm damage schools Various districtsConstruction of 9 Singita school projects Various districtsConstruction of 1 special school NkangalaConstruction of 3 technical schools Various districtsConstruction of 1 boarding school Gert Sibande
1.4 Spending trends
The Department spent 99.9% of its adjusted budget for the 2012/13 financial year. The table below is the summary of expenditure per programme for 2012/12 financial year as well as percentage spent per programme for 2011/12 financial year; the details are disclosed in the Appropriation Statement.
Programme Adjusted budget 2012/2013R’000
Expenditure2012/2013R’000
% Spent2012/13
Expenditure2011/2012R’000
% Spent2011/12
Administration 344,271 343,954 100% 452,588 100%Public Works 525,327 525,146 100% 438,549 100%Transport Infrastructure 1,630,391 1,627,451 100% 1,767,168 100%Transport Operations 988,361 987,426 100% 868,267 99.4%Community Based Programme
39,131 39,105 100% 59,755 99.8%
TOTAL 3,527,481 3,523,082 99.9% 3,587,947 99.9%
The Department spent R 3,523,082 billion of its adjusted budget of R3,527,481 billion for the 2012/13 financial year. In terms of the above table the Departmental spending was constant compared to previous financial year.
Mpumalanga ProvinceDepartment of Public Works, Roads and Transport
Vote 8
Report of the Accounting Officerfor the year ended 31 March 2013
Annual Report 201213.indb 84 8/19/2013 7:56:56 AM

ANNUAL
85
The under expenditure of .R 4,399 000 was as a result of savings on Public Transport Operations Grant due to un-operated bus routes and the Integrated Rural Mobility Access (IRMA) project which was in progress at financial year end. The Department surrendered unspent Public Transport Operators Grant and submitted a roll over request for the IRMA project which was in progress at year end to the Provincial Treasury.
1.4.1. Reasons for under/over spending.
Payment of accruals for the previous financial year contributed to the possible over expenditure. Unfunded contractual obligations for fleet services, scholar transport, audit fees, PMU, RAMS due to budget constraints. The out of court settlement to the value of R22,199 million, extra-learners and new routes introduced in the current financial year also contributed to the over expenditure.
1.4.2. Discuss the impact on programmes and service delivery
There was generally an overall commitment to improve service delivery during the 2012/13 financial year. In pursuance of this, the Department spent almost its entire budget allocation for the year under review. The under-expenditure from Programme 4 had no impact on service delivery since it resulted from reconfiguration of certain routes as mentioned above. The introduction of bi-articulated buses during the year necessitated the reconfigured of certain routes. As a result, fewer buses were used to transport a large number of passengers.
Several weaknesses were identified within the infrastructure delivery capacity of the Department. These resulted in under spending and denied some communities access to basic infrastructure. Nevertheless, many projects with various complexities were completed during 2012/13 financial year which means that more people now have access to roads, schools and health facilities.
1.4.3. Actions taken or planned to avoid recurrence.
The following are some of the actions that the department will implement to improve spending of the appropriated budget:
• Vacant budgeted posts for each financial year will be filled in the second quarter of each financial year once the improvement of conditions of service (ICS) shall have been implemented to avoid over expenditure on compensation of employees.
• Programme and Project Management Unit (PMU) to submit project implementation and performance report on monthly basis.
• Planning for all roads infrastructure and public transport projects will be finalized a year prior to implementation to avoid under or over expenditure on capital projects as per Infrastructure Development Improvement Plan (IDIP) circulated by the National Treasury.
• The department will continue to conduct quarterly expenditure and performance reviews to monitor spending patterns.
1.5 Virement:
The following virements were made after the 2012/13 budget adjustment appropriation
TRANSFER FROM TRANSFER TO AMOUNT R’000Transport Infrastructure Administration 25,000
Public Works 42,050Transport Operations 68,823
Total 135,873Public Works Transport Operations 36,979Transport Operations Community Based Programmes 400
Mpumalanga ProvinceDepartment of Public Works, Roads and Transport
Vote 8
Report of the Accounting Officerfor the year ended 31 March 2013
Annual Report 201213.indb 85 8/19/2013 7:56:56 AM

ANNUAL
86
1.5.1. Reason for the virement
The Department had to apply for virements, to defray anticipated over expenditure in the following programmes, Administration, Public Works, Transport Operations, and the reasons for the virement are as follows:-
Payment of accruals for previous financial year which might have resulted in a possible over expenditure. Running cost for government vehicles which were transferred to the Department of Safety, Security and Liaison also contributed to the possible over expenditure. Payment of out of court settlement resulted in the high spending percentage.
Under funded scholar transport contractual obligations and extra learners caused the high percentage of spending.
1.5.2. Who gave the approval for the virement to be done
The Accounting Officer gave the approval of the virements and the Provincial Treasury was informed accordingly in line with Section 43.2 of the Public Finance Management Act, ACT 1 of 1999.
2. Service rendered by the department
2.1 The services rendered by the Department
The services rendered by the department are discussed in Part 2 of the 2012/13 Annual Report; however these services can be summarized as follows:Programme ServicesAdministration Provide the Department with administrative, strategic, financial and corporate support
services in order to ensure that it delivers on its mandate in an integrated, efficient, effective and sustainable manner.
Public Works Provide a balanced and equitable Provincial Government building infrastructure by promoting accessibility that is sustainable, integrated and environmentally sensitive which supports economic development and social empowerment.
Transport Infrastructure Promote accessibility and the safe, affordable movement of people, goods and services through the delivery and maintenance of transport infrastructure that is sustainable, integrated and environmentally sensitive, and which supports and facilitates social empowerment and economic growth.
Transport Operations Plan, regulate and facilitate the provision of integrated land transport services through co-ordination and co-operation with national planning authorities, CBOs, NGOs and the private sector in order to enhance the mobility of all communities particularly those currently without or with limited access.
Community Based Programme
Manage the implementation of Programmes and strategies that lead to the development and empowerment of communities and contractors. This includes the Provincial management and co-ordination of the Expanded Public Works Programme.
2.2 Tariff policy
The tariffs charged by the Department for fees that are not governed by any Act are determined annually with the approval of the Provincial Treasury. However, fees charged in terms of the National Land Transport Act were gazetted for public comments before implementation by the Department.
2.3 Free services
There were no free services rendered by the Department during the financial year under review.
3. Capacity constraints
The inadequate number of technical professionals is not only limited to the department, it is a national challenge. As an attempt to retain technical staff, their remuneration was reviewed and implemented after approval by the Department of Public Service and Administration (DPSA).
Mpumalanga ProvinceDepartment of Public Works, Roads and Transport
Vote 8
Report of the Accounting Officerfor the year ended 31 March 2013
Annual Report 201213.indb 86 8/19/2013 7:56:56 AM
ANNUAL
87
4. Utilisation of donor funds
The department received donations, during the financial year under review, both in cash and in kind for Mandela Day celebrations and Public Infrastructure Summit.
5. Organisations to whom transfer payments have been made
List all entities to which transfer payments have been made in accordance with the approved transfers in the relevant Appropriation Act. (Refer to Annexure 1A-1C of the Annual Financial Statements)
6. Corporate governance arrangements
The Department of Public Works, Roads and Transport conducted a Risk Assessment workshop during the reporting period which was used to develop the 2012/13 Internal Audit Operational Plans that were approved by the Audit Committee. The Audit Committee also reviewed the internal audit reports as well as the Annual Financial Statements for 2012/13 financial year before the submission thereof to the Provincial Treasury and the Auditor General.
The Senior Managers submitted their financial disclosure forms to the Public Service Commission through the Executive Authority.
7. Asset management
The department has ensured that all movable, immovable, major and minor assets are included in the asset register. The asset register complies with the minimum requirements for the asset registers as per the Asset Management Framework issued by the National Treasury.
8. Events after the reporting date
The Department processed invoices to the value of R 67,859 million during April and May 2013 which relate to the 2012/2013 financial year. These payments however do not form part of the 2012/13 financial year’ expenditure and are disclosed as note number 20 of the Annual Financial Statements. The department will implement cost curtailment measures and submit a budget pressure during 2013/14 financial year in order to address the above accruals.
9. Information on predetermined objectives
The Department has introduced several reforms to enhance the tracking of its overall performance on regular intervals. At the core of these reforms is the ability to provide feedback on impact of implemented programmes and projects as well as forewarn the Department of potential problems. This information formed basis of developing corrective action plans and conceptualization of strategic interventions.
Part of these reforms includes the introduction of Portfolios of Evidence (POE). Programmes were required to provide supporting documentation for all reported performance information. However, there were still challenges regarding implementation of the organizational file plan. The Department will identify suitable space and provide adequate budget to facilitate sound records management.
There were no data definitions from the Public Works sector thus resulting in different interpretation of related performance measures. During the year, the Strategic Planning Unit of the Department successfully developed data definitions for all performance measures contained in the Annual Performance Plan.
The Department’s efforts to improve performance management were complemented by the diligent work of the oversight authorities (e.g. Treasury, Portfolio Committee, EXCO, etc.). A number of quarterly and adhoc reports were submitted to these authorities as part of improving good governance within the public service. In other instances, the Department was invited to appear before these authorities and account on its performance. These engagements were beneficial to all and instrumental in the improved performance of the Department.
Mpumalanga ProvinceDepartment of Public Works, Roads and Transport
Vote 8
Report of the Accounting Officerfor the year ended 31 March 2013
Annual Report 201213.indb 87 8/19/2013 7:56:56 AM

ANNUAL
88
10. SCOPA resolutions
There were no SCOPA resolutions taken on the 2011/12 Annual Report.
11. Prior modifications to audit reports
Subject Matters reported by the AG 2011/12 financial year
Progress to deal with issues raised
Material losses of R2, 595,000 were incurred as a result of irrecoverable debts written off.
2011/12 Emphases of matters The irrecoverable debts were written off, and approval thereof was obtained from the Accounting Officer.
Material impairment of R10, 043,000 was incurred, as the recovery of this amounts were doubtful.
2011/12 Emphases of matters The matter has since been referred to Senior Council to issue letters of demand to the debtors.(Pilgrim’s Rest)
Irregular Expenditure of R61, 053,000 was incurred in contravention of applicable laws and regulations.
2011/12 Emphases of matters The Department is liaising with the Office of the Accountant General on how this matter will be resolved.
12. Exemptions and deviations received from the National Treasury
There were no exemptions and deviations received from the National Treasury on the compilation of the 2012/13 financial year’ Annual Financial Statements
13. Interim Financial Statements
The accounting officer has submitted Interim Financial Statements for the 2012/13 financial year to the Provincial Treasury as required by practice note 5 of 2010 issued by the Accountant-General.
14. Approval
The Annual Financial Statements set out on pages 15 to 92 have been approved by the Accounting Officer.
……………………K.M MOHLASEDIHEAD OF DEPARTMENTDEPARTMENT OF PUBLIC WORKS, ROADS AND TRANSPORT
Mpumalanga ProvinceDepartment of Public Works, Roads and Transport
Vote 8
Report of the Accounting Officerfor the year ended 31 March 2013
Annual Report 201213.indb 88 8/19/2013 7:56:56 AM

ANNUAL
89
Mpumalanga ProvinceDepartment of Public Works, Roads and Transport
Vote 8
Report of the Auditor-Generalfor the year ended 31 March 2013
REPORT OF THE AUDITOR-GENERAL TO THE MPUMALANGA PROVINCIAL LEGISLATURE ON VOTE NO. 8: DEPARTMENT OF PUBLIC WORKS, ROADS AND TRANSPORTREPORT ON THE FINANCIAL STATEMENTS
Introduction
1. I have audited the financial statements of the Department of Public Works, Roads and Transport set out on pages 94 to 160, which comprise the appropriation statement, the statement of financial position as at 31 March 2013, the statement of financial performance, statement of changes in net assets and cash flow statement for the year then ended, and the notes, comprising a summary of significant accounting policies and other explanatory information.
Accounting officer’s responsibility for the financial statements
2. The accounting officer is responsible for the preparation of these financial statements in accordance with the Departmental financial reporting framework prescribed by the National Treasury and the requirements of the Public Finance Management Act of South Africa, 1999 (Act No. 1 of 1999) (PFMA) and the Division of Revenue Act of South Africa, 2012 (Act No. 5 of 2012) (DoRA), and for such internal control as the accounting officer determines is necessary to enable the preparation of financial statements that are free from material misstatement, whether due to fraud or error.
Auditor-general’s responsibility
3. My responsibility is to express an opinion on these financial statements based on my audit. I conducted my audit in accordance with the Public Audit Act of South Africa, 2004 (Act No. 25 of 2004) (PAA), the general notice issued in terms thereof and International Standards on Auditing. Those standards require that I comply with ethical requirements and plan and perform the audit to obtain reasonable assurance about whether the financial statements are free from material misstatement.
4. An audit involves performing procedures to obtain audit evidence about the amounts and disclosures in the financial statements. The procedures selected depend on the auditor’s judgement, including the assessment of the risks of material misstatement of the financial statements, whether due to fraud or error. In making those risk assessments, the auditor considers internal control relevant to the entity’s preparation of the financial statements in order to design audit procedures that are appropriate in the circumstances, but not for the purpose of expressing an opinion on the effectiveness of the entity’s internal control. An audit also includes evaluating the appropriateness of accounting policies used and the reasonableness of accounting estimates made by management, as well as evaluating the overall presentation of the financial statements.
5. I believe that the audit evidence I have obtained is sufficient and appropriate to provide a basis for my audit opinion.
Opinion
6. In my opinion, the financial statements present fairly, in all material respects, the financial position of the Department of Public Works, Roads and Transport as at 31 March 2013 and its financial performance and cash flows for the year then ended, in accordance with the Departmental financial reporting framework prescribed by the National Treasury and the requirements of the PFMA and DoRA.
Additional matter
7. I draw attention to the matter below. My opinion is not modified in respect of this matter.
Financial reporting framework
8. The financial reporting framework prescribed by the National Treasury and applied by the department is a compliance framework. The wording of my opinion on a compliance framework should reflect that the financial statements have been prepared in accordance
Annual Report 201213.indb 89 8/19/2013 7:56:57 AM

ANNUAL
90
Mpumalanga ProvinceDepartment of Public Works, Roads and Transport
Vote 8
Report of the Auditor-Generalfor the year ended 31 March 2013
with this framework. Section 20(2)(a) of the PAA, however, requires me to express an opinion on the fair presentation of the financial statements. The wording of my opinion therefore reflects this requirement.
REPORT ON OTHER LEGAL AND REGULATORY REQUIREMENTS
9. In accordance with the PAA and the general notice issued in terms thereof, I report the following findings relevant to performance against predetermined objectives, compliance with laws and regulations and internal control, but not for the purpose of expressing an opinion.
Predetermined objectives
10. I performed procedures to obtain evidence about the usefulness and reliability of the information in the annual performance report as set out on pages xxx to xxx of the annual report.
11. The reported performance against predetermined objectives was evaluated against the overall criteria of usefulness and reliability. The usefulness of information in the annual performance report relates to whether it is presented in accordance with the National Treasury’s annual reporting principles and whether the reported performance is consistent with the planned objectives. The usefulness of information further relates to whether indicators and targets are measurable (i.e. well defined, verifiable, specific, measurable and time bound) and relevant, as required by the National Treasury’s Framework for managing programme performance information (FMPPI).
12. The reliability of the information in respect of the selected programmes is assessed to determine whether it adequately reflects the facts (i.e. whether it is valid, accurate and complete).
13. The material findings are as follows:
Usefulness of information
Consistency
14. Treasury Regulation 5.2.4 requires that the strategic plan should form the basis for the annual report, therefore requiring the consistency of objectives, indicators and targets between planning and reporting documents. A total of 85% of the reported objectives were not consistent with the objectives as per the approved strategic and annual performance plan. This was due to a lack of oversight responsibility by the leadership over performance management.
Reliability of information
15. The NTFMPPI requires that institutions should have appropriate systems to collect, collate, verify and store performance information to ensure valid, accurate and complete reporting of actual achievements against planned objectives, indicators and targets.
16. Significantly important targets with respect to the public works programme were materially misstated when compared to the source information and evidence provided. This was due to a lack of standard operating procedures for the accurate recording of actual achievements.
17. The information presented with respect to the transport infrastructure programme was not reliable when compared to the source information provided. This was due to a lack of monitoring of the completeness of source documentation in support of actual achievements.
18. Significantly important targets with respect to the transport operations programme were materially misstated when compared to the source information and evidence provided. This was due to a lack of standard operating procedures for the accurate recording of actual achievements.
Annual Report 201213.indb 90 8/19/2013 7:56:57 AM

ANNUAL
91
Mpumalanga ProvinceDepartment of Public Works, Roads and Transport
Vote 8
Report of the Auditor-Generalfor the year ended 31 March 2013
19. I was unable to obtain the information and explanations I considered necessary to satisfy myself as to the reliability of information presented with respect to the community-based programme. This was due the fact that the institution could not provide sufficient appropriate evidence in support of the information presented with respect to the community-based programme.
Additional matter
20. I draw attention to the matter below. This matter does not have an impact on the audit findings on predetermined objectives reported above.
Achievement of planned targets
21. Of the total number of 89 targets planned for the year, 44 were not achieved during the year under review. This means that 49% of the total planned targets were not achieved during the year under review. This was as a result of the department not considering relevant systems and evidential requirements during the annual strategic planning process.
Compliance with laws and regulations
22. I performed procedures to obtain evidence that the entity has complied with applicable laws and regulations regarding financial matters, financial management and other related matters. My findings on material non-compliance with specific matters in key applicable laws and regulations as set out in the general notice issued in terms of the PAA are as follows:
Annual financial statements, performance report and annual report
23. The financial statements submitted for auditing were not prepared in accordance with generally recognised accounting practice as prescribed by the National Treasury and were not supported by full and proper records, as required by section 40(1)(b) of the PFMA. Material misstatements of non-current assets and disclosure items identified by the auditors in the submitted financial statements were subsequently corrected, resulting in the financial statements receiving an unqualified audit opinion.
Expenditure management
24. Payments due to creditors (including intergovernmental claims) were not settled within 30 days from receipt of an invoice or, in the case of civil claims, from the date of settlement or court judgement.
25. The accounting officer did not take effective steps to prevent unauthorised, irregular as well as fruitless and wasteful expenditure.
Human resource management
26. Appointments were made without the recommendation of a selection committee, in contravention of Public Service Regulation I/VII/D1.4.
27. Employees were appointed without properly verifying the claims in their applications, in contravention of Public Service Regulation 1/VII/D.8.
28. The accounting officer did not ensure that all leave taken by employees were recorded accurately and in full, as required by Public Service Regulation 1/V/F(b).
29. The accounting officer did not implement effective measures to ensure that employees did not abuse sick leave, as required by Public Service Regulation 1/V/F(c).
30. Employees were compensated for overtime work that had not been approved in advance, as required by Public Service Regulation 1/V/D.2(c).
31. Funded vacant posts were not filled within 12 months, as required by Public Service Regulation 1/VII/C.1A.2.
Annual Report 201213.indb 91 8/19/2013 7:56:57 AM

ANNUAL
92
Mpumalanga ProvinceDepartment of Public Works, Roads and Transport
Vote 8
Report of the Auditor-Generalfor the year ended 31 March 2013
32. Employees acted in higher vacant posts for more than 12 months, in contravention of Public Service Regulation 1/VII/B.5.3.
33. A performance management system was not in place for employees other than senior managers, as required by Public Service Regulation I/III/B1.
34. Employees acted in higher vacant posts for more than 12 months, in contravention of Public Service Regulation 1/VII/B.5.3.
Procurement and contract management
35. Contracts were awarded to bidders who did not submit a declaration of past supply chain practices, such as fraud, abuse of the supply chain management system and non-performance, contrary to Treasury Regulation 16A9.2.
36. Contracts and quotations were awarded to suppliers whose tax matters had not been declared by the South African Revenue Service to be in order, as required by Treasury Regulation 16A9.1(d) and the Preferential Procurement Regulations.
37. Persons in the service of the department who had a private or business interest in contracts awarded by the department failed to disclose such interest, as required by Treasury Regulation 16A8.4 and Public Service Regulation 3C.
Strategic planning and performance management
38. In terms of section 38(1)(a)(i) of the PFMA, the accounting officer must ensure that the department has and maintains effective, efficient, and transparent systems of financial and risk management and internal control. However, the department did not have and maintain an effective and efficient system of internal control regarding performance management, which described and represented how the department’s processes of performance monitoring, measurement, review and reporting should be conducted, organised and managed.
Service delivery – public works
39. The appointed project managers were not registered with the South African Council for the Project and Construction Management Professions, as required by sections 18(2) and 19 of the Project and Construction Management Professions Act of South Africa, 2000 (Act No. 48 of 2000).
40. The department expanded or varied orders against the original contract by R3 940 435, which was more than the prescribed threshold for the expansion or variation without prior written approval by the relevant treasury, in contravention of paragraph 3.9.4 of the National Treasury’s instruction note on enhancing compliance monitoring and improving transparency and accountability in supply chain management as well as section 38(1)(b) of the PFMA, resulting in irregular expenditure of R3 940 435.
Internal control
41. I considered internal control relevant to my audit of the financial statements, performance report and compliance with laws and regulations. The matters reported below under the fundamentals of internal control are limited to the significant deficiencies that resulted in the findings on the annual performance report and the findings on compliance with laws and regulations included in this report.
Leadership
42. The department did not have sufficient monitoring controls to ensure the proper implementation of the overall reporting process.
43. The leadership did not exercise oversight responsibility regarding financial and performance reporting and compliance as well as related internal controls.
Annual Report 201213.indb 92 8/19/2013 7:56:57 AM

ANNUAL
93
Mpumalanga ProvinceDepartment of Public Works, Roads and Transport
Vote 8
Report of the Auditor-Generalfor the year ended 31 March 2013
Financial and performance management
44. The department did not prepare regular, accurate and complete financial and performance reports that were supported and evidenced by reliable information.
45. Management did not review and monitor compliance with applicable laws and regulations.
46. The department did not implement proper record keeping in a timely manner to ensure that complete, relevant and accurate information was accessible and available to support financial and performance reporting.
47. The department did not implement controls over daily and monthly processing and reconciling of transactions.
48. The department did not design and implement formal controls over IT systems to ensure the reliability of the systems and the availability, accuracy and protection of information.
Governance
49. The internal audit unit did not identify internal control deficiencies and recommend corrective action effectively.
OTHER REPORTS INVESTIGATIONS
Investigations completed during the financial year
50. An investigation was conducted on request of the department. The investigation was initiated based on an allegation of the possible irregular issuing and processing of taxi operating permits or licences without following proper procedures by employees. The investigation resulted in criminal proceedings being instituted against two employees.
PERFORMANCE AUDIT Performance audit on the readiness of government to report on its performance
51. A performance audit was conducted on the readiness of government to report on its performance. The focus of the audit was on how government institutions are guided and assisted to report on their performance, as well as the systems and processes that they have put in place. The management report on the audit was issued during the year.
Nelspruit31 July 2013
Annual Report 201213.indb 93 8/19/2013 7:56:57 AM

ANNUAL
94
Mpu
mal
anga
Pro
vinc
eDe
partm
ent o
f Pub
lic W
orks
, Roa
ds a
nd Tr
ansp
ort
Vote
8:
App
ropr
iatio
n St
atem
ent
for t
he y
ear e
nded
31
Mar
ch 2
013
App
ropr
iatio
n pe
r Pro
gram
me
2012
/13
2011
/12
APP
ROPR
IATIO
N
STA
TEM
ENT
Adj
uste
d
App
ropr
iatio
nSh
iftin
g of
Fu
nds
Vire
men
tFin
al
App
ropr
iatio
nA
ctua
l Ex
pend
iture
Varia
nce
Expe
nditu
re
as %
of
final
ap
prop
riatio
n
Final
A
ppro
pria
tion
Act
ual
Expe
nditu
re
R’00
0R’
000
R’00
0R’
000
R’00
0R’
000
%R’
000
R’00
0
1.
ADM
INIS
TRA
TION
Cur
rent
pay
men
t31
1,23
7-
24,9
1033
6,14
733
6,05
493
100.
0%43
6,93
543
6,84
9Tra
nsfe
rs an
d su
bsid
ies
1,58
0-
(15)
1,56
51,
453
112
92.8
%3,
970
3,96
9Pa
ymen
t for
cap
ital
asse
ts4,
740
-16
74,
907
4,79
511
297
.7%
11,7
5411
,770
2.
PUBL
IC W
ORK
S
Cur
rent
pay
men
t43
9,20
6-
728
439,
934
439,
755
179
100.
0%35
8,41
935
8,65
5Tra
nsfe
rs an
d su
bsid
ies
77,5
70-
1,14
578
,715
78,7
132
100.
0%74
,274
75,2
03Pa
ymen
t for
cap
ital
asse
ts3,
880
-2,
798
6,67
86,
678
-10
0.0%
5,89
44,
691
3.
TRA
NSP
ORT
IN
FRA
STRU
CTU
RE
Cur
rent
pay
men
t88
9,45
3-
(174
,909
)71
4,54
471
4,14
839
699
.9%
798,
796
797,
330
Trans
fers
and
subs
idie
s8,
237
-(3
,258
)4,
979
4,89
386
98.3
%8,
083
8,19
3Pa
ymen
t for
cap
ital
asse
ts86
8,57
4-
39,7
9290
8,36
690
5,90
82,
458
99.7
%96
0,84
296
2,14
7
Paym
ent f
or fi
nanc
ial
asse
ts-
-2,
502
2,50
22,
502
-10
0.0%
2,60
02,
595
Annual Report 201213.indb 94 8/19/2013 7:56:57 AM

ANNUAL
95
Mpu
mal
anga
Pro
vinc
eDe
partm
ent o
f Pub
lic W
orks
, Roa
ds a
nd Tr
ansp
ort
Vote
8:
App
ropr
iatio
n St
atem
ent
for t
he y
ear e
nded
31
Mar
ch 2
013
App
ropr
iatio
n pe
r Pro
gram
me
2012
/13
2011
/12
APP
ROPR
IATIO
N
STA
TEM
ENT
Adj
uste
d
App
ropr
iatio
nSh
iftin
g of
Fu
nds
Vire
men
tFin
al
App
ropr
iatio
nA
ctua
l Ex
pend
iture
Varia
nce
Expe
nditu
re
as %
of
final
ap
prop
riatio
n
Final
A
ppro
pria
tion
Act
ual
Expe
nditu
re
R’00
0R’
000
R’00
0R’
000
R’00
0R’
000
%R’
000
R’00
04.
TRA
NSP
ORT
O
PERA
TION
SC
urre
nt p
aym
ent
410,
640
-99
,105
509,
745
509,
590
155
100.
0%41
1,22
041
2,13
0Tra
nsfe
rs an
d su
bsid
ies
457,
603
-6,
840
464,
443
464,
270
173
100.
0%95
.7%
437,
238
433,
607
Paym
ent f
or c
apita
l as
sets
14,3
16-
(143
)14
,173
13,5
6660
721
,709
19,4
33
5.
CO
MM
UNITY
BA
SED
PRO
GRA
MM
ES
Cur
rent
pay
men
t
38,4
31
300 -
- - -
31
9 81 -
38
,750
38
1 -
38
,811
29
4 -
(6
1)
87 -
10
0.2%
77.
2%
59,3
85
370
100
59
,392
36
3 -
Paym
ent f
or c
apita
l as
sets
Paym
ent f
or fi
nanc
ial
asse
ts
Subt
otal
3,52
5,76
7 -
623,
525,
829
3,52
1,43
0 4,
399
99.9
%
3,59
1,58
93,
586,
327
Stat
utor
y A
ppro
pria
tion
Cur
rent
pay
men
t
1,71
4(6
2)
1,65
21,
652
-10
0.0%
1,62
01,
620
TOTA
L3,
527,
481
--
3,52
7,48
13,
523,
082
4,39
999
.9%
3,59
3,20
93,
587,
947
Annual Report 201213.indb 95 8/19/2013 7:56:57 AM

ANNUAL
96
2012
/13
2012
/13
Final
App
ropr
iatio
nA
ctua
lEx
pend
iture
Final
App
ropr
iatio
nA
ctua
lEx
pend
iture
TOTA
L (Br
ough
t For
war
d)3,
527,
481
3,61
5,43
9Re
conc
illia
tion
with
sta
tem
ent o
f fina
ncia
l per
form
ance
ADD
Dep
artm
enta
l rec
iept
s25
,848
Act
ual a
mou
nts p
er S
tate
men
t of F
inan
cial
Per
form
ance
(Tot
al R
even
ue)
3,55
3,32
93,
615,
439
Act
ual a
mou
nts p
er S
tate
men
t of F
inan
cial
Per
form
amnc
e (T
otal
Exp
endi
ture
)3,
523,
082
3,58
7,94
7
Mpu
mal
anga
Pro
vinc
eDe
partm
ent o
f Pub
lic W
orks
, Roa
ds a
nd Tr
ansp
ort
Vote
8:
App
ropr
iatio
n St
atem
ent
for t
he y
ear e
nded
31
Mar
ch 2
013
Annual Report 201213.indb 96 8/19/2013 7:56:58 AM

ANNUAL
97
App
ropr
iatio
n pe
r eco
nom
ic c
lass
ificat
ion
2012
/13
2011
/12
Econ
omic
C
lass
ificat
ion
Adj
uste
d
App
ropr
iatio
nSh
iftin
g of
Fun
dsVi
rem
ent
Final
A
ppro
pria
tion
Act
ual
Expe
nditu
reVa
rianc
eEx
pend
iture
as
% o
f fina
l ap
prop
riatio
n
Final
A
ppro
pria
tion
Act
ual
expe
nditu
re
R’00
0R’
000
R’00
0R’
000
R’00
0R’
000
%R’
000
R’00
0C
urre
nt
paym
ents
Com
pens
atio
n of
em
ploy
ees
Goo
ds a
nd
serv
ices
Trans
fers
and
subs
idie
s
Prov
ince
s and
m
unic
ipal
ities
Publ
ic
corp
orat
ions
an
d pr
ivat
e en
terp
rises
Hous
ehol
ds
Paym
ent o
f ca
pita
l ass
ets
Build
ings
and
ot
her fi
xed
str
uctu
res
Mac
hine
ry a
nd
equi
pmen
t
Paym
ents
for
finan
cial
ass
ets
792,
400
1,29
8,28
1
76,8
70
457,
503
10,6
17
881,
564
10,2
46
-
- - - - - - - -
(21,
008)
(28,
901) -
7,30
6
(2,5
94)
44,0
19
(1,3
24)
2,50
2
771,
392
1,26
9,38
0
76,8
70
464,
809
8,02
3
925,
583
8,92
2
2,50
2
770,
852
1,26
9,15
9
76,8
70
464,
724
7,73
4
922,
528
8,71
3
2,50
2
540
221 -
85 289
3,05
5
209 -
99.9
%
100.
0%
100.
0%
100.
0%
96.4
%
99.7
%
97.7
%
100.
0%
752,
933
1,31
4,74
9
73,9
64
437,
138
12,4
63
972,
118
27,2
44
2,60
0
751,
720
1,31
4,18
1
73,9
63
433,
607
13,4
77
971,
380
27,0
24
2,59
5
TOTA
L3,
527,
481
--
3,52
7,48
13,
523,
082
4,39
999
.9%
3,59
3,20
93,
587,
947
Mpu
mal
anga
Pro
vinc
eDe
partm
ent o
f Pub
lic W
orks
, Roa
ds a
nd Tr
ansp
ort
Vote
8:
App
ropr
iatio
n St
atem
ent
As
at 3
1 M
arch
201
3
Annual Report 201213.indb 97 8/19/2013 7:56:58 AM

ANNUAL
98
Stat
utor
y A
ppro
pria
tion
2012
/13
2011
/12
Dire
ct c
hang
es a
gain
st th
e N
atio
nal/P
rovi
ncia
l Rev
enue
Fu
nd
Adj
uste
d
App
ropr
iatio
nSh
iftin
g of
Fun
dsVi
rem
ent
Final
A
ppro
pria
tion
Act
ual
Expe
nditu
reVa
rianc
eEx
pend
iture
as
% o
f fina
l ap
prop
riatio
n
Final
A
ppro
pria
tion
Act
ual
expe
nditu
re
R’00
0R’
000
R’00
0R’
000
R’00
0R’
000
%R’
000
R’00
0
Mem
ber o
f exe
cutiv
e co
mm
ittee
/par
liam
enta
ry
offic
ers
1,71
4-
(62)
1,65
21,
652
-10
0.0%
1,62
01,
620
TOTA
L1,
714
-(6
2)1,
652
1,65
2-
100.
0%1,
620
1,62
0
Stat
utor
y A
ppro
pria
tion
per e
cono
mic
cla
ssific
atio
n20
12/1
320
11/1
2Pr
ogra
m 1
per
eco
nom
ic
clas
sifica
tion
Adj
uste
d
App
ropr
iatio
nSh
iftin
g of
Fun
dsVi
rem
ent
Final
A
ppro
pria
tion
Act
ual
Expe
nditu
reVa
rianc
eEx
pend
iture
as
% o
f fina
l ap
prop
riatio
n
Final
A
ppro
pria
tion
Act
ual
expe
nditu
re
R’00
0R’
000
R’00
0R’
000
R’00
0R’
000
%R’
000
R’00
0
Cur
rent
pay
men
ts
Com
pens
atio
n of
em
ploy
ees
1,71
4-
(62)
1,65
21,
652
-10
0.0%
1,62
01,
620
TOTA
L1,
714
-(6
2)1,
652
1,65
2-
100.
0%1,
620
1,62
0
Mpu
mal
anga
Pro
vinc
eDe
partm
ent o
f Pub
lic W
orks
, Roa
ds a
nd Tr
ansp
ort
Vote
8:
App
ropr
iatio
n St
atem
ent
As
at 3
1 M
arch
201
3
Annual Report 201213.indb 98 8/19/2013 7:56:58 AM

ANNUAL
99
2012
/13
2011
/12
Det
ail
per
sub-
prog
ram
me
A
djus
ted
A
ppro
pria
tion
Shift
ing
of F
unds
Vire
men
tFin
al
App
ropr
iatio
nA
ctua
l Ex
pend
iture
Varia
nce
Expe
nditu
re
as %
of fi
nal
appr
opria
tion
Final
A
ppro
pria
tion
Act
ual
expe
nditu
re
R’00
0R’
000
R’00
0R’
000
R’00
0R’
000
%R’
000
R’00
0
1.1
O
FFIC
E O
F TH
E M
ECC
urre
nt
paym
ent
7,56
1(1
,554
)6,
007
5,95
255
99.1
%4,
284
4,28
4
Trans
fers
and
su
bsid
ies
--
--
--
--
Paym
ent f
or
capi
tal a
sset
s-
1616
16-
100.
0%15
15
1.2
M
AN
AG
EMEN
T O
F THE
DE
PART
MEN
TC
urre
nt
paym
ent
4,56
5(1
,214
)3,
351
3,31
833
99.0
%3,
031
3,08
1
Trans
fers
and
su
bsid
ies
-33
3333
-10
0.0%
--
Paym
ent f
or
capi
tal a
sset
s15
0-
150
8961
59.3
%25
016
1
1.3
CO
RPO
RATE
SU
PPO
RT
Cur
rent
pa
ymen
t29
9,11
127
,678
326,
789
326,
784
510
0.0%
429,
620
429,
484
Trans
fers
and
su
bsid
ies
1,58
0(4
8)1,
532
1,42
011
292
.7%
3,97
03,
969
Paym
ent f
or
capi
tal a
sset
s4,
590
151
4,74
14,
690
5198
.9%
11,4
8911
,594
TO
TAL
317,
557
-25
,062
342,
619
342,
302
317
99.9
%45
2,65
945
2,58
8
Mpu
mal
anga
Pro
vinc
eDe
partm
ent o
f Pub
lic W
orks
, Roa
ds a
nd Tr
ansp
ort
Vote
8:
App
ropr
iatio
n St
atem
ent
As
at 3
1 M
arch
201
3
Annual Report 201213.indb 99 8/19/2013 7:56:58 AM

ANNUAL
100
2012
/13
2011
/12
Prog
ram
me
1 pe
r Eco
nom
ic
clas
sifica
tion
Adj
uste
d
App
ropr
iatio
nSh
iftin
g of
Fun
dsVi
rem
ent
Final
A
ppro
pria
tion
Act
ual
Expe
nditu
reVa
rianc
eEx
pend
iture
as
% o
f fina
l ap
prop
riatio
n
Final
A
ppro
pria
tion
Act
ual
expe
nditu
re
R’00
0R’
000
R’00
0R’
000
R’00
0R’
000
%R’
000
R’00
0C
urre
nt
paym
ents
Com
pens
atio
n of
em
ploy
ees
227,
322
-(3
,300
)22
4,02
222
3,97
943
100.
0%20
2,78
920
2,55
7
Goo
ds a
nd
serv
ices
85,6
29-
28,1
4811
3,77
711
3,72
750
100.
0%23
5,76
623
5,91
2
Trans
fers
and
subs
idie
sPu
blic
C
orpo
ratio
ns
& P
rivat
e En
terp
rises
--
99
9-
100%
--
Hous
ehol
ds
1,58
0-
(24)
1,55
61,
444
112
92.8
%3,
970
3,96
9
Paym
ent
for
capi
tal a
sset
sBu
ildin
gs &
ot
her fi
xed
st
ruct
ures
--
151
151
151
-10
0.0%
-31
Mac
hine
ry &
eq
uipm
ent
4,74
0-
164,
756
4,64
411
297
.6%
11,7
5411
,739
TOTA
L31
9,27
1-
25,0
0034
4,27
134
3,95
431
799
.9%
454,
279
454,
208
Mpu
mal
anga
Pro
vinc
eDe
partm
ent o
f Pub
lic W
orks
, Roa
ds a
nd Tr
ansp
ort
Vote
8:
App
ropr
iatio
n St
atem
ent
As
at 3
1 M
arch
201
3
Annual Report 201213.indb 100 8/19/2013 7:56:58 AM

ANNUAL
101
2012
/13
2011
/12
Det
ail
per
sub-
prog
ram
me
Adj
uste
d
App
ropr
iatio
nSh
iftin
g of
Fun
dsVi
rem
ent
Final
A
ppro
pria
tion
Act
ual
Expe
nditu
reVa
rianc
eEx
pend
iture
as
% o
f fina
l ap
prop
riatio
n
Final
A
ppro
pria
tion
Act
ual
expe
nditu
re
R’00
0R’
000
R’00
0R’
000
R’00
0R’
000
%R’
000
R’00
02.
1. P
ROG
RAM
ME
SUPP
ORT
Cur
rent
pay
men
t2,
895
752,
970
2,97
0-
100.
0%3,
240
3,22
72.
2. D
ESIG
NC
urre
nt p
aym
ent
14,7
21-
395
15,1
1615
,116
-10
0.0%
12,4
7212
,398
Paym
ent f
or c
apita
l as
sets
150
-(7
8)72
72-
100.
0%20
025
5
2.3.
CO
NST
RUC
TION
Cur
rent
pay
men
t17
,751
-7,
600
25,3
5125
,291
6099
.8%
18,1
6819
,386
Tran
sfer
s and
su
bsid
ies
--
4040
373
92.5
%-
-
Paym
ent f
or c
apita
l as
sets
120
-(6
2)58
58-
100.
0%1,
330
119
2.4.
MA
INTE
NA
NC
EC
urre
nt p
aym
ent
18,9
00-
(924
)17
,976
17,8
9383
99.5
%18
,297
18,2
61Pa
ymen
t for
cap
ital
asse
ts55
-(5
5)-
--
--
-
2.5.
PRO
PERT
Y M
AN
AG
EMEN
TC
urre
nt p
aym
ent
384,
939
-(6
,418
)37
8,52
137
8,48
536
100.
0%30
6,24
230
5,38
3Tr
ansf
ers a
nd
subs
idie
s77
,570
-1,
105
78,6
7578
,676
(1)
100.
0%74
,274
75,2
03
Paym
ent f
or c
apita
l as
sets
3,55
5-
2,99
36,
548
6,54
8-
100.
0%4,
364
4,31
7
TOTA
L52
0,65
6-
4,67
152
5,32
752
5,14
618
110
0.0%
438,
587
438,
549
Mpu
mal
anga
Pro
vinc
eDe
partm
ent o
f Pub
lic W
orks
, Roa
ds a
nd Tr
ansp
ort
Vote
8:
App
ropr
iatio
n St
atem
ent
As
at 3
1 M
arch
201
3
Annual Report 201213.indb 101 8/19/2013 7:56:58 AM
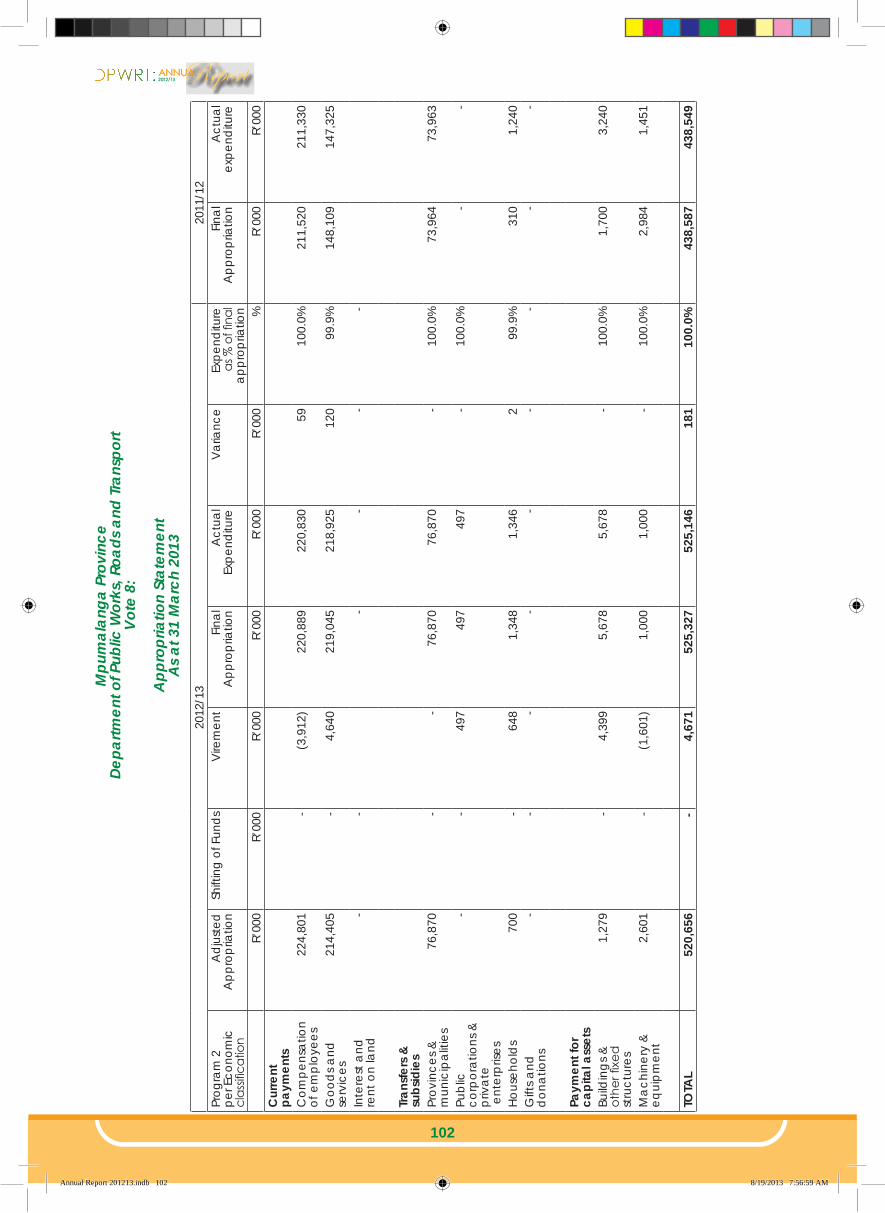
ANNUAL
102
2012
/13
2011
/12
Prog
ram
2
per E
cono
mic
cl
assifi
catio
n
Adj
uste
d
App
ropr
iatio
nSh
iftin
g of
Fun
dsVi
rem
ent
Final
A
ppro
pria
tion
Act
ual
Expe
nditu
reVa
rianc
eEx
pend
iture
as
% o
f fina
l ap
prop
riatio
n
Final
A
ppro
pria
tion
Act
ual
expe
nditu
re
R’00
0R’
000
R’00
0R’
000
R’00
0R’
000
%R’
000
R’00
0C
urre
nt
paym
ents
Com
pens
atio
n of
em
ploy
ees
224,
801
-(3
,912
)22
0,88
922
0,83
059
100.
0%21
1,52
021
1,33
0
Goo
ds a
nd
serv
ices
214,
405
-4,
640
219,
045
218,
925
120
99.9
%14
8,10
914
7,32
5
Inte
rest
and
re
nt o
n la
nd-
--
--
-
Tran
sfer
s &
subs
idie
sPr
ovin
ces &
m
unic
ipal
ities
76,8
70-
-76
,870
76,8
70-
100.
0%73
,964
73,9
63
Publ
ic
corp
orat
ions
&
priv
ate
e
nter
prise
s
--
497
497
497
-10
0.0%
--
Hous
ehol
ds
700
-64
81,
348
1,34
62
99.9
%31
01,
240
Gift
s and
d
onat
ions
--
--
--
--
-
Paym
ent f
or
capi
tal a
sset
sBu
ildin
gs &
ot
her fi
xed
st
ruct
ures
1,27
9-
4,39
95,
678
5,67
8-
100.
0%1,
700
3,24
0
Mac
hine
ry &
eq
uipm
ent
2,60
1-
(1,6
01)
1,00
01,
000
-10
0.0%
2,98
41,
451
TOTA
L52
0,65
6-
4,67
152
5,32
752
5,14
618
110
0.0%
438,
587
438,
549
Mpu
mal
anga
Pro
vinc
eDe
partm
ent o
f Pub
lic W
orks
, Roa
ds a
nd Tr
ansp
ort
Vote
8:
App
ropr
iatio
n St
atem
ent
As
at 3
1 M
arch
201
3
Annual Report 201213.indb 102 8/19/2013 7:56:59 AM

ANNUAL
103
2012
/13
2011
/12
Det
ail p
er su
b-pr
ogra
mm
e A
djus
ted
A
ppro
pria
tion
Shift
ing
of F
unds
Vire
men
tFin
al
App
ropr
iatio
nA
ctua
l Ex
pend
iture
Varia
nce
Expe
nditu
re
as %
of fi
nal
appr
opria
tion
Final
A
ppro
pria
tion
Act
ual
expe
nditu
re
R’00
0R’
000
R’00
0R’
000
R’00
0R’
000
%R’
000
R’00
0
3.1.
PRO
GRA
MM
E SU
PPO
RT
Cur
rent
pay
men
t1,
756
-(2
04)
1,55
21,
359
193
87.6
%1,
455
1,45
4Pa
ymen
t for
cap
ital a
sset
s-
-16
1616
-10
0.0%
9290
3.2.
RO
AD
PLA
NN
ING
Cur
rent
pay
men
t42
,261
-5,
872
48,1
3348
,090
4399
.9%
45,9
0045
,869
Paym
ent f
or c
apita
l ass
ets
--
10,2
2810
,228
10,2
0919
99.8
%11
40
3.3.
DES
IGN
Cur
rent
pay
men
t37
,559
-(3
1,10
0)6,
459
6,43
128
99.6
%37
,307
37,2
11Tr
ansf
ers a
nd su
bsid
ies
--
4242
42-
100.
0%-
37Pa
ymen
t for
cap
ital a
sset
s-
-25
,717
25,7
1725
,729
(12)
100.
0%40
61
3.4.
CO
NST
RUC
TION
Cur
rent
pay
men
t20
,277
-4,
500
24,7
7724
,688
8999
.6%
16,6
7916
,403
Tran
sfer
s and
subs
idie
s-
-60
060
058
416
97.3
%-
127
Paym
ent f
or c
apita
l ass
ets
866,
974
-(4
4,00
1)82
2,97
382
0,52
72,
446
99.7
%77
8,64
677
8,79
5
3.5.
MA
INTE
NA
NC
E
Cur
rent
pay
men
t78
7,60
0-
(153
,977
)63
3,62
363
3,58
043
100.
0%69
7,45
569
6,39
3Tr
ansf
ers a
nd su
bsid
ies
8,23
7-
(3,9
00)
4,33
74,
267
7098
.4%
8,08
38,
029
Paym
ent f
or c
apita
l ass
ets
1,60
0-
47,8
3249
,432
49,4
275
100.
0%18
2,05
318
3,16
1Pa
ymen
t for
fina
ncia
l ass
ets
--
2,50
22,
502
2,50
2-
100.
0%2,
600
2,59
5TO
TAL
1,76
6,26
4-
(135
,873
)1,
630,
391
1,62
7,45
12,
940
99.8
%1,
770,
321
1,77
0,26
5
Mpu
mal
anga
Pro
vinc
eDe
partm
ent o
f Pub
lic W
orks
, Roa
ds a
nd Tr
ansp
ort
Vote
8:
App
ropr
iatio
n St
atem
ent
As
at 3
1 M
arch
201
3
Annual Report 201213.indb 103 8/19/2013 7:56:59 AM

ANNUAL
104
2012
/13
2011
/12
Prog
ram
me
3 pe
r Ec
onom
ic c
lass
ificat
ion
Adj
uste
d
App
ropr
iatio
nSh
iftin
g of
Fun
dsVi
rem
ent
Final
A
ppro
pria
tion
Act
ual
Expe
nditu
reVa
rianc
eEx
pend
iture
as
% o
f fina
l ap
prop
riatio
n
Final
A
ppro
pria
tion
Act
ual
expe
nditu
re
R’00
0R’
000
R’00
0R’
000
R’00
0R’
000
%R’
000
R’00
0C
urre
nt p
aym
ents
Com
pens
atio
n of
em
ploy
ees
278,
526
(11,
966)
266,
560
266,
205
355
99.9
%28
2,27
228
1,54
0
Goo
ds a
nd se
rvic
es61
0,92
7(1
62,9
43)
447,
984
447,
944
4010
0.0%
516,
524
515,
790
Tran
sfer
s &
subs
idie
sHo
useh
old
s8,
237
-(3
,258
)4,
979
4,89
287
98.3
%8,
083
8,19
3
Paym
ent f
or c
apita
l as
sets
Build
ings
& o
ther
fixe
d
stru
ctur
es86
6,97
4-
39,4
6990
6,44
390
3,98
92,
454
99.7
%95
1,65
795
1,65
9
Mac
hine
ry &
eq
uipm
ent
1,60
0-
323
1,92
31,
919
499
.8%
9,18
510
,488
Paym
ent f
or fi
nanc
ial
asse
ts-
-2,
502
2,50
22,
502
-10
0.0%
2,60
02,
595
TOTA
L1,
766,
264
-(1
35,8
73)
1,63
0,39
11,
627,
451
2,94
099
.8%
1,77
0,32
11,
770,
265
Mpu
mal
anga
Pro
vinc
eDe
partm
ent o
f Pub
lic W
orks
, Roa
ds a
nd Tr
ansp
ort
Vote
8:
App
ropr
iatio
n St
atem
ent
As
at 3
1 M
arch
201
3
Annual Report 201213.indb 104 8/19/2013 7:56:59 AM

ANNUAL
105
2012
/13
2011
/12
Det
ail p
er su
b-pr
ogra
mm
e
A
djus
ted
A
ppro
pria
tion
Shift
ing
of F
unds
Vire
men
tFin
al
App
ropr
iatio
nA
ctua
l Ex
pend
iture
Varia
nce
Expe
nditu
re
as %
of fi
nal
appr
opria
tion
Final
A
ppro
pria
tion
Act
ual
expe
nditu
re
R’00
0R’
000
R’00
0R’
000
R’00
0R’
000
%R’
000
R’00
04.
1. P
ROG
RAM
ME
SUPP
ORT
O
FFIC
EC
urre
nt p
aym
ent
3,52
8-
(2,0
30)
1,49
81,
486
1299
.2%
1,56
01,
560
Paym
ent f
or c
apita
l ass
ets
--
1111
11-
100.
0%-
-
4.2.
PUB
LIC
TRA
NSP
ORT
SU
BSID
IES
Cur
rent
pay
men
t36
0,27
7-
102,
720
462,
997
462,
938
5910
0.0%
365,
445
366,
413
Tran
sfer
s and
subs
idie
s45
7,50
3-
6,84
046
4,34
346
4,25
885
100.
0%43
7,18
043
3,53
1Pa
ymen
t for
cap
ital a
sset
s50
-(5
0)-
--
-1,
625
1,61
8
4.3.
TRA
NSP
ORT
SA
FETY
AN
D C
OM
PLIA
NC
EC
urre
nt p
aym
ent
23,8
86-
(2,6
40)
21,2
4621
,216
3099
.9%
24,9
9124
,992
Tran
sfer
s and
subs
idie
s10
0-
-10
012
8812
.0%
1010
Paym
ent f
or c
apita
l ass
ets
700
-50
750
744
699
.2%
1,92
41,
922
4.4.
TRA
NSP
ORT
SYS
TEM
SC
urre
nt p
aym
ent
15,3
49-
2,03
517
,384
17,3
6024
99.9
%12
,410
12,3
75Tr
ansf
ers a
nd su
bsid
ies
--
--
--
-48
48Pa
ymen
t for
cap
ital a
sset
s20
0-
(99)
101
101
-10
0.0%
134
169
4.5.
INFR
AST
RUC
TURE
O
PERA
TION
SC
urre
nt p
aym
ent
7,60
0-
(980
)6,
620
6,59
030
99.5
%6,
814
6,79
0Tr
ansf
ers a
nd su
bsid
ies
--
--
--
--
18Pa
ymen
t for
cap
ital a
sset
s13
,366
(55)
13,3
1112
,710
601
95.5
%18
,026
15,7
24
TOTA
L88
2,55
9-
105,
802
988,
361
987,
426
935
99.9
%87
0,16
786
5,17
0
Mpu
mal
anga
Pro
vinc
eDe
partm
ent o
f Pub
lic W
orks
, Roa
ds a
nd Tr
ansp
ort
Vote
8:
App
ropr
iatio
n St
atem
ent
As
at 3
1 M
arch
201
3
Annual Report 201213.indb 105 8/19/2013 7:56:59 AM
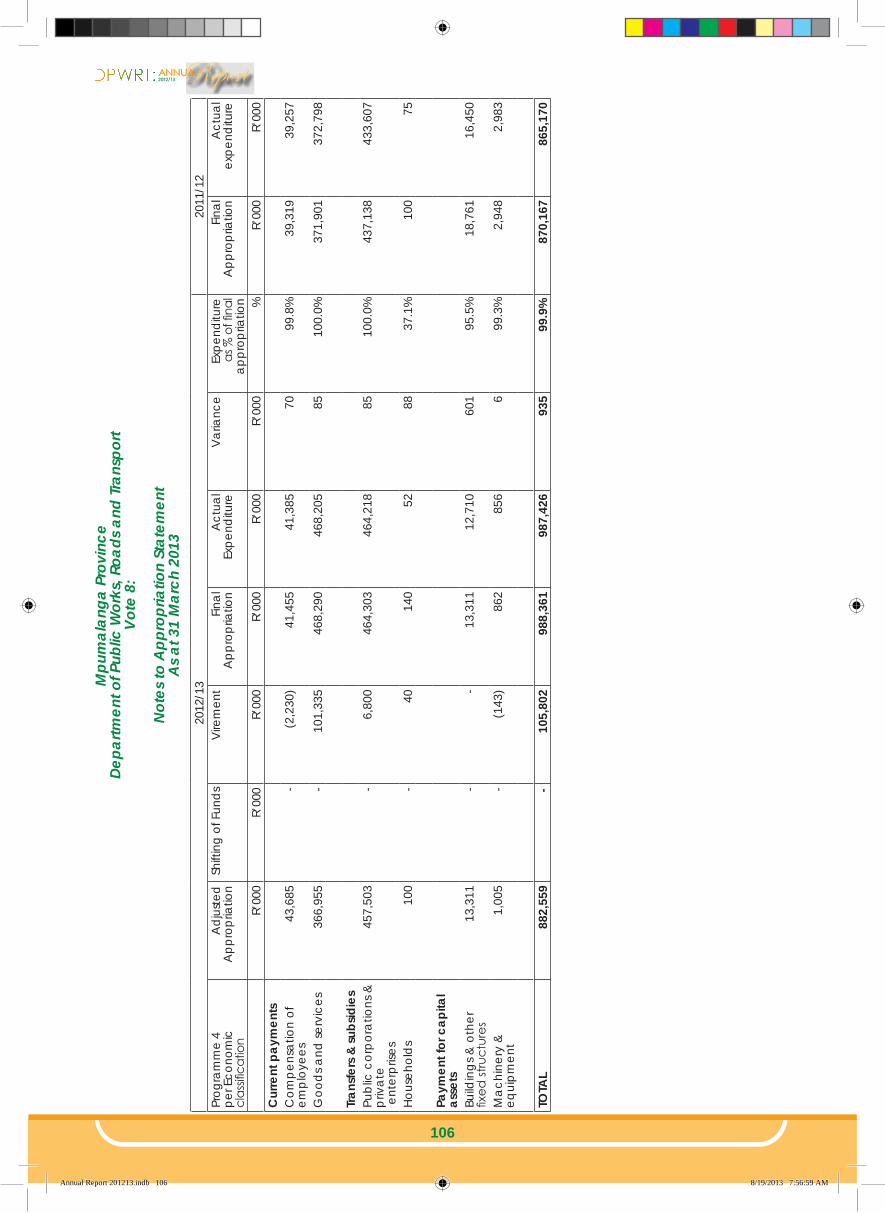
ANNUAL
106
2012
/13
2011
/12
Prog
ram
me
4 pe
r Eco
nom
ic
clas
sifica
tion
Adj
uste
d
App
ropr
iatio
nSh
iftin
g of
Fun
dsVi
rem
ent
Final
A
ppro
pria
tion
Act
ual
Expe
nditu
reVa
rianc
eEx
pend
iture
as
% o
f fina
l ap
prop
riatio
n
Final
A
ppro
pria
tion
Act
ual
expe
nditu
re
R’00
0R’
000
R’00
0R’
000
R’00
0R’
000
%R’
000
R’00
0C
urre
nt p
aym
ents
Com
pens
atio
n of
em
ploy
ees
43,6
85-
(2,2
30)
41,4
5541
,385
7099
.8%
39,3
1939
,257
Goo
ds a
nd se
rvic
es36
6,95
5-
101,
335
468,
290
468,
205
8510
0.0%
371,
901
372,
798
Tran
sfer
s &
subs
idie
sPu
blic
cor
pora
tions
&
priv
ate
e
nter
prise
s
457,
503
-6,
800
464,
303
464,
218
8510
0.0%
437,
138
433,
607
Hous
ehol
ds
100
-40
140
5288
37.1
%10
075
Paym
ent f
or c
apita
l as
sets
Build
ings
& o
ther
fix
ed st
ruct
ures
13,3
11-
-13
,311
12,7
1060
195
.5%
18,7
6116
,450
Mac
hine
ry &
eq
uipm
ent
1,00
5-
(143
)86
285
66
99.3
%2,
948
2,98
3
TOTA
L88
2,55
9-
105,
802
988,
361
987,
426
935
99.9
%87
0,16
786
5,17
0
Mpu
mal
anga
Pro
vinc
eDe
partm
ent o
f Pub
lic W
orks
, Roa
ds a
nd Tr
ansp
ort
Vote
8:
Not
es to
App
ropr
iatio
n St
atem
ent
As
at 3
1 M
arch
201
3
Annual Report 201213.indb 106 8/19/2013 7:56:59 AM
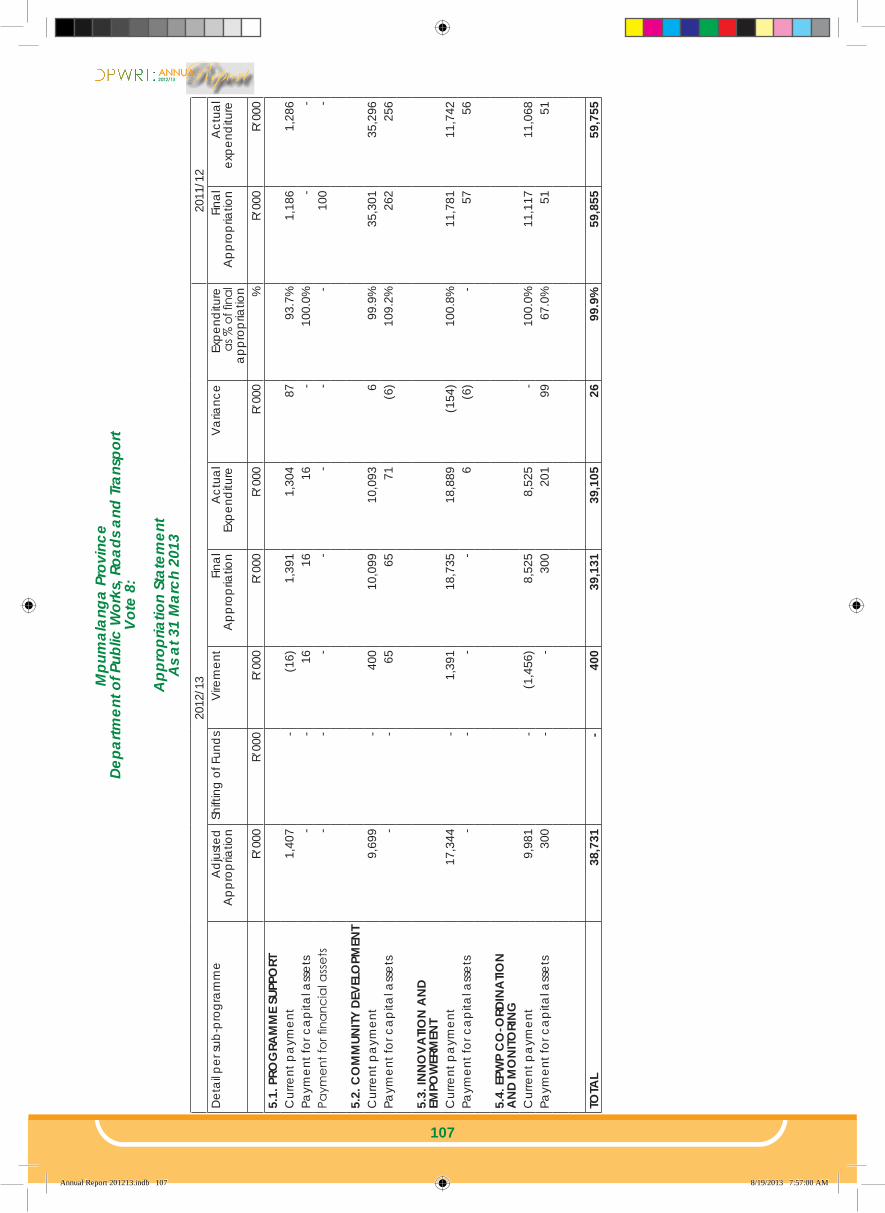
ANNUAL
107
2012
/13
2011
/12
Det
ail p
er su
b-pr
ogra
mm
e
A
djus
ted
A
ppro
pria
tion
Shift
ing
of F
unds
Vire
men
tFin
al
App
ropr
iatio
nA
ctua
l Ex
pend
iture
Varia
nce
Expe
nditu
re
as %
of fi
nal
appr
opria
tion
Final
A
ppro
pria
tion
Act
ual
expe
nditu
re
R’00
0R’
000
R’00
0R’
000
R’00
0R’
000
%R’
000
R’00
05.
1. P
ROG
RAM
ME
SUPP
ORT
Cur
rent
pay
men
t1,
407
-(1
6)1,
391
1,30
487
93.7
%1,
186
1,28
6Pa
ymen
t for
cap
ital a
sset
s-
-16
1616
-10
0.0%
--
Paym
ent f
or fi
nanc
ial a
sset
s-
--
--
--
100
-
5.2.
CO
MM
UNITY
DEV
ELO
PMEN
TC
urre
nt p
aym
ent
9,69
9-
400
10,0
9910
,093
699
.9%
35,3
0135
,296
Paym
ent f
or c
apita
l ass
ets
--
6565
71(6
)10
9.2%
262
256
5.3.
INN
OVA
TION
AN
D EM
POW
ERM
ENT
Cur
rent
pay
men
t17
,344
-1,
391
18,7
3518
,889
(154
)10
0.8%
11,7
8111
,742
Paym
ent f
or c
apita
l ass
ets
--
--
6(6
)-
5756
5.4.
EPW
P C
O-O
RDIN
ATIO
N
AN
D M
ON
ITORI
NG
Cur
rent
pay
men
t9,
981
-(1
,456
)8,
525
8,52
5-
100.
0%11
,117
11,0
68Pa
ymen
t for
cap
ital a
sset
s30
0-
-30
020
199
67.0
%51
51
TOTA
L38
,731
-40
039
,131
39,1
0526
99.9
%59
,855
59,7
55
Mpu
mal
anga
Pro
vinc
eDe
partm
ent o
f Pub
lic W
orks
, Roa
ds a
nd Tr
ansp
ort
Vote
8:
App
ropr
iatio
n St
atem
ent
As
at 3
1 M
arch
201
3
Annual Report 201213.indb 107 8/19/2013 7:57:00 AM

ANNUAL
108
2012
/13
2011
/12
Prog
ram
me
5 pe
r Eco
nom
ic
clas
sifica
tion
Adj
uste
d
App
ropr
iatio
nSh
iftin
g of
Fun
dsVi
rem
ent
Final
A
ppro
pria
tion
Act
ual
Expe
nditu
reVa
rianc
eEx
pend
iture
as
% o
f fina
l ap
prop
riatio
n
Final
A
ppro
pria
tion
Act
ual
expe
nditu
re
R’00
0R’
000
R’00
0R’
000
R’00
0R’
000
%R’
000
R’00
0C
urre
nt p
aym
ents
Com
pens
atio
n of
em
ploy
ees
18,0
66-
400
18,4
6618
,453
1399
.9%
17,0
3317
,036
Goo
ds a
nd se
rvic
es20
,365
-(8
1)20
,284
20,3
58(7
4)10
0.4%
42,4
4942
,356
Paym
ent f
or c
apita
l ass
ets
Mac
hine
ry &
equ
ipm
ent
300
-81
381
294
8777
.2%
373
363
TOTA
L38
,731
-40
039
,131
39,1
0526
99.9
%59
,855
59,7
55
Mpu
mal
anga
Pro
vinc
eDe
partm
ent o
f Pub
lic W
orks
, Roa
ds a
nd Tr
ansp
ort
Vote
8:
App
ropr
iatio
n St
atem
ent
As
at 3
1 M
arch
201
3
Annual Report 201213.indb 108 8/19/2013 7:57:00 AM
ANNUAL
109
Mpumalanga ProvinceDepartment of Public Works, Roads and Transport
Vote 8:
Notes to Appropriation Statementfor the year ended 31 March 2013
1. Detail of transfers and subsidies as per Appropriation Act (after Virement):
Detail of these transactions can be viewed in the note on Transfers and subsidies, disclosure notes and Annexure 1 (A,B and D) to the Annual Financial Statements.
2. Detail of specifically and exclusively appropriated amounts voted (after Virement):
Detail of these transactions can be viewed in note 1 (Annual Appropriation) to the Annual Financial Statements.
3. Detail on payments for financial assets
Detail of these transactions per programme can be viewed in the note on Payments for financial assets to the Annual Financial Statements.
4. Explanations of material variances from Amounts Voted (after Virement):
4.1 Per programme Final Appropriation
Actual Expenditure
Variance R’000 Variance as a % of Final Appropriation
Administration 342,619 342,302 317 0% Public Works 525,327 525,146 181 0% Transport Infrastructure 1,630,391 1,627,451 2,940 0% Transport Operations 988,361 987,426 935 0% Community Based Programmes 39,131 39,105 26 0%
Explanations
The figures above show that there were no material variances from the amounts voted (after virements). However, there were savings on Transport Infrastructure and Transport Operations that needed some comments:
Savings on Transport Infrastructure is as a result of delaying invoices by contractors. The department surrendered unspent funds and submitted a roll-over request for an amount of R 2,502 million for D3696 Xhimongwe Thimeli and Oakley project which was in progress at the end of the financial year.
Savings on Transport Operations is as a result of delaying invoices by contractors. The department surrendered unspent funds and submitted a roll-over request for an amount of R0,582 million for the IRMA projects which were in progress at the end of the financial year.
4.2 Per economic classification Final Appropriation
Actual Expenditure
Variance Variance as a % of Final
AppropriationR’000 R’000 R’000 R’000
Current payments Compensation of employees 771,392 770,852 540 0% Goods and services 1,269,380 1,269,159 221 0%
Transfers and subsidies Provinces and municipalities 76,870 76,870 - 0% Public corporations and private enterprises
464,809 464,724 85 0%
Households 8,023 7,734 289 4%
Payments for capital assets Buildings and other fixed structures 925,583 922,528 3,055 0% Machinery and equipment 8,922 8,713 209 2%
Payments for financial assets 2,502 2,502 - 0%
Annual Report 201213.indb 109 8/19/2013 7:57:00 AM

ANNUAL
110
4.3 Per conditional grant Final Appropriation
Actual Expenditure
Variance Variance as a % of Final
AppropriationR’000 R’000 R’000 R’000
Public Works Dev Prop Rate Fun Grn Pr 76,870 76,870 - 0% Epwp Incent Grnt 16,617 16,617 - 0%
Transport Prov Roads Maint Grant 1,240,694 1,240,694 - 0% Public Transprt Operations Grant 439,003 439,003 - 0%
Mpumalanga ProvinceDepartment of Public Works, Roads and Transport
Vote 8:
Notes to Appropriation Statementfor the year ended 31 March 2013
Annual Report 201213.indb 110 8/19/2013 7:57:00 AM

ANNUAL
111
PERFORMANCE Note 2012/13 2011/12R’000 R’000
REVENUEAnnual appropriation 1 3,525,829 3,591,589Statutory appropriation 2 1,652 1,620Departmental revenue 3 25,848 22,230
TOTAL REVENUE 3,553,329 3,615,439
EXPENDITURECurrent expenditureCompensation of employees 4 770,852 751,720Goods and services 5 1,269,159 1,314,181Total current expenditure 2,040,011 2,065,901
Transfers and subsidiesTransfers and subsidies 7 549,328 521,047Total transfers and subsidies 549,328 521,047
Expenditure for capital assetsTangible capital assets 8 931,241 998,404Total expenditure for capital assets 931,241 998,404
Payments for financial assets 6 2,502 2,595
TOTAL EXPENDITURE 3,523,082 3,587,947
SURPLUS/(DEFICIT) FOR THE YEAR 30,247 27,492
Reconciliation of Net Surplus/(Deficit) for the yearVoted funds 4,399 5,262
Annual appropriation 4,399 2,123Conditional grants - 3,139
Departmental revenue and NRF Receipts 3 25,848 22,230
SURPLUS/(DEFICIT) FOR THE YEAR 30,247 27,492
Mpumalanga ProvinceDepartment of Public Works, Roads and Transport
Vote 8:
Statement of Financial Performancefor the year ended 31 March 2013
Annual Report 201213.indb 111 8/19/2013 7:57:00 AM

ANNUAL
112
POSITION Note 2012/13 2011/12R’000 R’000
ASSETS
Current assets 30,001 69,837Unauthorised expenditure 9 2,214 4,875Fruitless and wasteful expenditure 10 4,052 4,052Receivables 11 23,735 60,910
TOTAL ASSETS 30,001 69,837
LIABILITIES
Current liabilities 23,090 60,401Voted funds to be surrendered to the Revenue Fund 12 4,399 -Departmental revenue and NRF Receipts to be surrendered to the Revenue Fund
13 3,305 7,532
Bank overdraft 14 14,988 20Payables 15 398 52,849
TOTAL LIABILITIES 23,090 60,401
NET ASSETS 6,911 9,436
Represented by:Recoverable revenue 6,911 9,436
TOTAL 6,911 9,436
Mpumalanga ProvinceDepartment of Public Works, Roads and Transport
Vote 8:
Statement of Financial Positionfor the year ended 31 March 2013
Annual Report 201213.indb 112 8/19/2013 7:57:00 AM

ANNUAL
113
NET ASSETS Note 2012/13 2011/12R’000 R’000
Recoverable revenueOpening balance 9,436 13,597Transfers: (2,525) (4,161)
Irrecoverable amounts written off (2,145) (2,595)Debts revised (52) -Debts recovered (included in departmental receipts) (586) (1,566)Debts raised 258 -
Closing balance 6,911 9,436
TOTAL 6,911 9,436
Mpumalanga ProvinceDepartment of Public Works, Roads and Transport
Vote 8:
Statement of Changes in Net Assetsfor the year ended 31 March 2013
Annual Report 201213.indb 113 8/19/2013 7:57:01 AM

ANNUAL
114
CASH FLOW Note 2012/13 2011/12R’000 R’000
CASH FLOWS FROM OPERATING ACTIVITIESReceipts 3,552,395 3,612,980
Annual appropriated funds received 1 3,525,829 3,591,589Statutory appropriated funds received 2 1,652 1,620Departmental revenue received 3 24,914 19,771
Net (increase)/decrease in working capital (49,092) 70,786Surrendered to Revenue Fund 6,402 121,194Current payments (2,040,011) (2,065,901)Payments for financial assets (2,502) (2,595)Transfers and subsidies paid (549,328) (521,047)Net cash flow available from operating activities 16 917,864 1,215,421
CASH FLOWS FROM INVESTING ACTIVITIESPayments for capital assets 8 (931,241) (998,404)Proceeds from sale of capital assets 3.4 934 2,459Net cash flows from investing activities (930,307) (995,945)
CASH FLOWS FROM FINANCING ACTIVITIESIncrease/(decrease) in net assets (2,525) (4,161)Net cash flows from financing activities (2,525) (4,161)
Net increase/(decrease) in cash and cash equivalents (14,968) 215,315
Cash and cash equivalents at beginning of period (20) (215,335)
Cash and cash equivalents at end of period 28 (14,988) (20)
Mpumalanga ProvinceDepartment of Public Works, Roads and Transport
Vote 8:
Cash Flow StatementAs at 31 March 2013
Annual Report 201213.indb 114 8/19/2013 7:57:01 AM
ANNUAL
115
The Financial Statements have been prepared in accordance with the following policies, which have been applied consistently in all material aspects, unless otherwise indicated. However, where appropriate and meaningful, additional information has been disclosed to enhance the usefulness of the Financial Statements and to comply with the statutory requirements of the Public Finance Management Act, Act 1 of 1999 (as amended by Act 29 of 1999), and the Treasury Regulations issued in terms of the Act and the Division of Revenue Act, Act 1 of 2010.
1. Presentation of the Financial Statements
1.1 Basis of preparation
The financial statements have been prepared on a modified cash basis of accounting.
Under this basis, the effects of transactions and other events are recognised in the financial records when the resulting cash is received or paid. The “modification” results from the recognition of certain near-cash balances in the financial statements as well as the revaluation of foreign investments and loans and the recognition of resulting revaluation gains and losses.
In addition supplementary information is provided in the disclosure notes to the financial statements where it is deemed to be useful to the users of the financial statements.
1.1 Presentation currency
All amounts have been presented in the currency of the South African Rand (R) which is also the functional currency of the department.
1.2 Rounding
Unless otherwise stated all financial figures have been rounded to the nearest one thousand Rand (R’000).
1.3 Comparative figures
Prior period comparative information has been presented in the current year’s financial statements. Where necessary figures included in the prior period financial statements have been reclassified to ensure that the format in which the information is presented is consistent with the format of the current year’s financial statements.
1.4 Comparative figures - Appropriation Statement
A comparison between actual amounts and final appropriation per major classification of expenditure is included in the Appropriation Statement.
2. Revenue
2.1 Appropriated funds
Appropriated funds comprises of departmental allocations as well as direct charges against revenue fund (i.e. statutory appropriation).
Appropriated funds are recognised in the financial records on the date the appropriation becomes effective. Adjustments made in terms of the adjustments budget process are recognised in the financial records on the date the adjustments become effective.
Unexpended appropriated funds are surrendered to the National/Provincial Revenue Fund. Any amounts owing to the National/Provincial Revenue Fund at the end of the financial year are recognised as payable in the statement of financial position.
Any amount due from the National/Provincial Revenue Fund at the end of the financial year is recognised as a receivable in the statement of financial position.
Mpumalanga ProvinceDepartment of Public Works, Roads and Transport
Vote 8:
Notes to the Annual Financial Statementsfor the year ended 31 March 2013
Annual Report 201213.indb 115 8/19/2013 7:57:01 AM

ANNUAL
116
2.2 Departmental revenue
All departmental revenue is recognised in the statement of financial performance when received and is subsequently paid into the National/Provincial Revenue Fund, unless stated otherwise.
Any amount owing to the National/Provincial Revenue Fund at the end if the financial year is recognised as a payable in the statement of financial position.
No accrual is made for amounts receivable from the last receipt date to the end of the reporting period. These amounts are however disclosed in the disclosure notes to the annual financial statements.
2.3 Direct Exchequer receipts
All direct exchequer receipts are recognised in the statement of financial performance when the cash is received and is subsequently paid into the National/Provincial Revenue Fund, unless stated otherwise.
Any amount owing to the National/Provincial Revenue Funds at the end of the financial year is recognised as a payable in the statement of financial position.
2.4 Direct Exchequer payments
All direct exchequer payments are recognised in the statement of financial performance when final authorisation for payment is effected on the system (by no later than 31 March of each year).
3. Expenditure
3.1 Compensation of employees
3.1.1 Salaries and wages
Salaries and wages are expensed in the statement of financial performance when the final authorisation for payment is effected on the system (by no later than 31 March of each year).
Other employee benefits that give rise to a present legal or constructive obligation are disclosed in the disclosure notes to the financial statements at its face value and are not recognised in the statement of financial performance or position.
Employee costs are capitalised to the cost of a capital project when an employee spends more than 50% of his/her time on the project. These payments form part of expenditure for capital assets in the statement of financial performance.
3.1.2 Social contributions
Employer contributions to post employment benefit plans in respect of current employees are expensed in the statement of financial performance when the final authorisation for payment is effected on the system (by no later than 31 March of each year).
No provision is made for retirement benefits in the financial statements of the department. Any potential liabilities are disclosed in the financial statements of the National Revenue Fund and not in the financial statements of the employer department.
Employer contributions made by the department for certain of its ex-employees (such as medical benefits) are classified as transfers to households in the statement of financial performance.
Mpumalanga ProvinceDepartment of Public Works, Roads and Transport
Vote 8:
Notes to the Annual Financial Statementsfor the year ended 31 March 2013
Annual Report 201213.indb 116 8/19/2013 7:57:01 AM

ANNUAL
117
3.2 Goods and services
Payments made during the year for goods and/or services are recognised as an expense in the statement of financial performance when the final authorisation for payment is effected on the system (by no later than 31 March of each year).
The expense is classified as capital if the goods and/or services were acquired for a capital project or if the total purchase price exceeds the capitalisation threshold (currently R5, 000). All other expenditures are classified as current.
Rental paid for the use of buildings or other fixed structures is classified as goods and services and not as rent on land.
3.3 Interest and rent on land
Interest and rental payments are recognised as an expense in the statement of financial performance when the final authorisation for payment is effected on the system (by no later than 31 March of each year). This item excludes rental for the use of buildings or other fixed structures. If it is not possible to distinguish between payment for the use of land and the fixed structures on it, the whole amount should be recorded under goods and services.
3.4 Payments for financial assets
Debts are written off when identified as irrecoverable. Debts written-off are limited to the amount of savings and/or underspending of appropriated funds. The write off occurs at year-end or when funds are available. No provision is made for irrecoverable amounts but an estimate is included in the disclosure notes to the financial statements.
All other losses are recognised when authorisation has been granted for the recognition thereof.
3.5 Transfers and subsidies
Transfers and subsidies are recognised as an expense when the final authorisation for payment is effected on the system (by no later than 31 March of each year).
3.6 Unauthorised expenditure
When confirmed unauthorised expenditure is recognised as an asset in the statement of financial position until such time as the expenditure is either approved by the relevant authority, recovered from the responsible person or written off as irrecoverable in the statement of financial performance.
Unauthorised expenditure approved with funding is derecognised from the statement of financial position when the unauthorised expenditure is approved and the related funds are received.
Where the amount is approved without funding it is recognised as expenditure in the statement of financial performance on the date stipulated in the Act.
3.7 Fruitless and wasteful expenditure
Fruitless and wasteful expenditure is recognised as expenditure in the statement of financial performance according to the nature of the payment and not as a separate line item on the face of the statement. If the expenditure is recoverable it is treated as an asset until it is recovered from the responsible person or written off as irrecoverable in the statement of financial performance.
Mpumalanga ProvinceDepartment of Public Works, Roads and Transport
Vote 8:
Notes to the Annual Financial Statementsfor the year ended 31 March 2013
Annual Report 201213.indb 117 8/19/2013 7:57:01 AM

ANNUAL
118
3.8 Irregular expenditure
Irregular expenditure is recognised as expenditure in the statement of financial performance. If the expenditure is not condoned by the relevant authority it is treated as an asset until it is recovered or written off as irrecoverable.
4. Assets
4.1 Cash and cash equivalents
Cash and cash equivalents are carried in the statement of financial position at cost.
Bank overdrafts are shown separately on the face of the statement of financial position.
For the purposes of the cash flow statement, cash and cash equivalents comprise cash on hand, deposits held, other short-term highly liquid investments and bank overdrafts.
4.2 Other financial assets
Other financial assets are carried in the statement of financial position at cost.
4.3 Prepayments and advances
Amounts prepaid or advanced are recognised in the statement of financial position when the payments are made and are derecognised as and when the goods/services are received or the funds are utilised.
Prepayments and advances outstanding at the end of the year are carried in the statement of financial position at cost.
4.4. Receivables
Receivables included in the statement of financial position arise from cash payments made that are recoverable from another party (including departmental employees) and are derecognised upon recovery or write-off.
Receivables outstanding at year-end are carried in the statement of financial position at cost plus any accrued interest. Amounts that are potentially irrecoverable are included in the disclosure notes.
4.4 Inventory
Inventories that qualify for recognition must be initially reflected at cost. Where inventories are acquired at no cost, or for nominal consideration, their cost shall be their fair value at the date of acquisition.
All inventory items at year-end are reflected using the weighted average cost or FIFO cost formula.
4.5 Capital assets
4.6.1 Movable assets
Initial recognitionA capital asset is recorded in the asset register on receipt of the item at cost. Cost of an asset is defined as the total cost of acquisition. Where the cost cannot be determined accurately, the movable capital asset is stated at fair value. Where fair value cannot be determined, the capital asset is included in the asset register at R1.
All assets acquired prior to 1 April 2002 are included in the register R1.
Mpumalanga ProvinceDepartment of Public Works, Roads and Transport
Vote 8:
Notes to the Annual Financial Statementsfor the year ended 31 March 2013
Annual Report 201213.indb 118 8/19/2013 7:57:01 AM

ANNUAL
119
Subsequent recognitionSubsequent expenditure of a capital nature is recorded in the statement of financial performance as “expenditure for capital assets” and is capitalised in the asset register of the department on completion of the project.
Repairs and maintenance is expensed as current “goods and services” in the statement of financial performance.
4.6.2 Immovable assets
Initial recognitionA capital asset is recorded on receipt of the item at cost. Cost of an asset is defined as the total cost of acquisition. Where the cost cannot be determined accurately, the immovable capital asset is stated at R1 unless the fair value for the asset has been reliably estimated.
Subsequent recognitionWork-in-progress of a capital nature is recorded in the statement of financial performance as “expenditure for capital assets”. On completion, the total cost of the project is included in the asset register of the department that is accountable for the asset.Repairs and maintenance is expensed as current “goods and services” in the statement of financial performance.
4.6.3 Intangible assets
Initial recognitionAn intangible asset is recorded in the asset register on receipt of the item at cost. Cost of an intangible asset is defined as the total cost of acquisition. Where the cost cannot be determined accurately, the intangible asset is stated at fair value. Where fair value cannot be determined, the intangible asset is included in the asset register at R1.
All intangible assets acquired prior to 1 April 2002 can be included in the asset register at R1.*
Subsequent expenditureSubsequent expenditure of a capital nature is recorded in the statement of financial performance as “expenditure for capital asset” and is capitalised in the asset register of the department.
Maintenance is expensed as current “goods and services” in the statement of financial performance.
5. Liabilities
5.1 Payables
Recognised payables mainly comprise of amounts owing to other governmental entities. These payables are carried at cost in the statement of financial position.
5.2 Contingent liabilities
Contingent liabilities are included in the disclosure notes to the financial statements when it is possible that economic benefits will flow from the department, or when an outflow of economic benefits or service potential is probable but cannot be measured reliably.
5.3 Commitments
Commitments are not recognised in the statement of financial position as a liability or as expenditure in the statement of financial performance but are included in the disclosure notes.
5.4 Accruals
Accruals are not recognised in the statement of financial position as a liability or as expenditure in the statement of financial performance but are included in the disclosure notes.
Mpumalanga ProvinceDepartment of Public Works, Roads and Transport
Vote 8:
Notes to the Annual Financial Statementsfor the year ended 31 March 2013
Annual Report 201213.indb 119 8/19/2013 7:57:01 AM
ANNUAL
120
5.5 Employee benefits
Short-term employee benefits that give rise to a present legal or constructive obligation are disclosed in the disclosure notes to the financial statements. These amounts are not recognised in the statement of financial performance or the statement of financial position.
5.6 Lease commitments
Operating leaseOperating lease payments are recognised as an expense in the statement of financial performance. The operating lease commitments are disclosed in the discloser notes to the financial statement.
6. Receivables for departmental revenue
Receivables for departmental revenue are disclosed in the disclosure notes to the annual financial statements. These receivables are written off when identified as irrecoverable and are disclosed separately.
7. Net Assets
7.1 Recoverable revenue
Amounts are recognised as recoverable revenue when a payment made in a previous financial year becomes recoverable from a debtor in the current financial year. Amounts are either transferred to the National/Provincial Revenue Fund when recovered or are transferred to the statement of financial performance when written-off.
8. Related party transactions
Specific information with regards to related party transactions is included in the disclosure notes.
9. Key management personnel
Compensation paid to key management personnel including their family members where relevant, is included in the disclosure notes.
Mpumalanga ProvinceDepartment of Public Works, Roads and Transport
Vote 8:
Notes to the Annual Financial Statementsfor the year ended 31 March 2013
Annual Report 201213.indb 120 8/19/2013 7:57:01 AM

ANNUAL
121
1. Annual Appropriation
1.1 Annual Appropriation
Included are funds appropriated in terms of the Appropriation Act (and the Adjustments Appropriation Act) for National Departments (Voted funds) and Provincial Departments:
2012/13 2011/12
Final Appropriation
Actual Funds
Received
Funds not requested/
not received
Appropriationreceived
R’000 R’000 R’000 R’000
Administration 342,619 342,619 - 452,659 Public Works 525,327 525,327 - 438,587 Transport Infrastructure
1,630,391 1,630,391 - 1,767,222
Transport Operations 988,361 988,361 - 873,266 Community Based Programme
39,131 39,131 - 59,855
Total 3,525,829 3,525,829 - 3,591,589
1.2 Conditional grants Note
2012/13 2011/12R’000 R’000
Total grants received 32 1,773,184 1,692,378
2. Statutory Appropriation 2012/13 2011/12
R’000 R’000
Member of executive committee 1,652 1,620
3. Departmental revenue Note 2012/13 2011/12
R’000 R’000
Sales of goods and services other than capital assets 3.1 18,860 14,212 Interest, dividends and rent on land 3.2 1,948 1,978 Sales of capital assets 3.3 934 2,459 Transactions in financial assets and liabilities 3.5 4,106 3,581 Total revenue collected 25,848 22,230
Departmental revenue collected 25,848 22,230
3.1 Sales of goods and services other than capital assetsNote 2012/13 2011/12
3 R’000 R’000 Sales of goods and services produced by the department 18,805 14,169
Sales by market establishment - 6,944 Administrative fees 11,683 7,225 Other sales 7,122 -
Sales of scrap, waste and other used current goods 55 43 Total 18,860 14,212
Mpumalanga ProvinceDepartment of Public Works, Roads and Transport
Vote 8:
Notes to the Annual Financial Statementsfor the year ended 31 March 2013
Annual Report 201213.indb 121 8/19/2013 7:57:02 AM
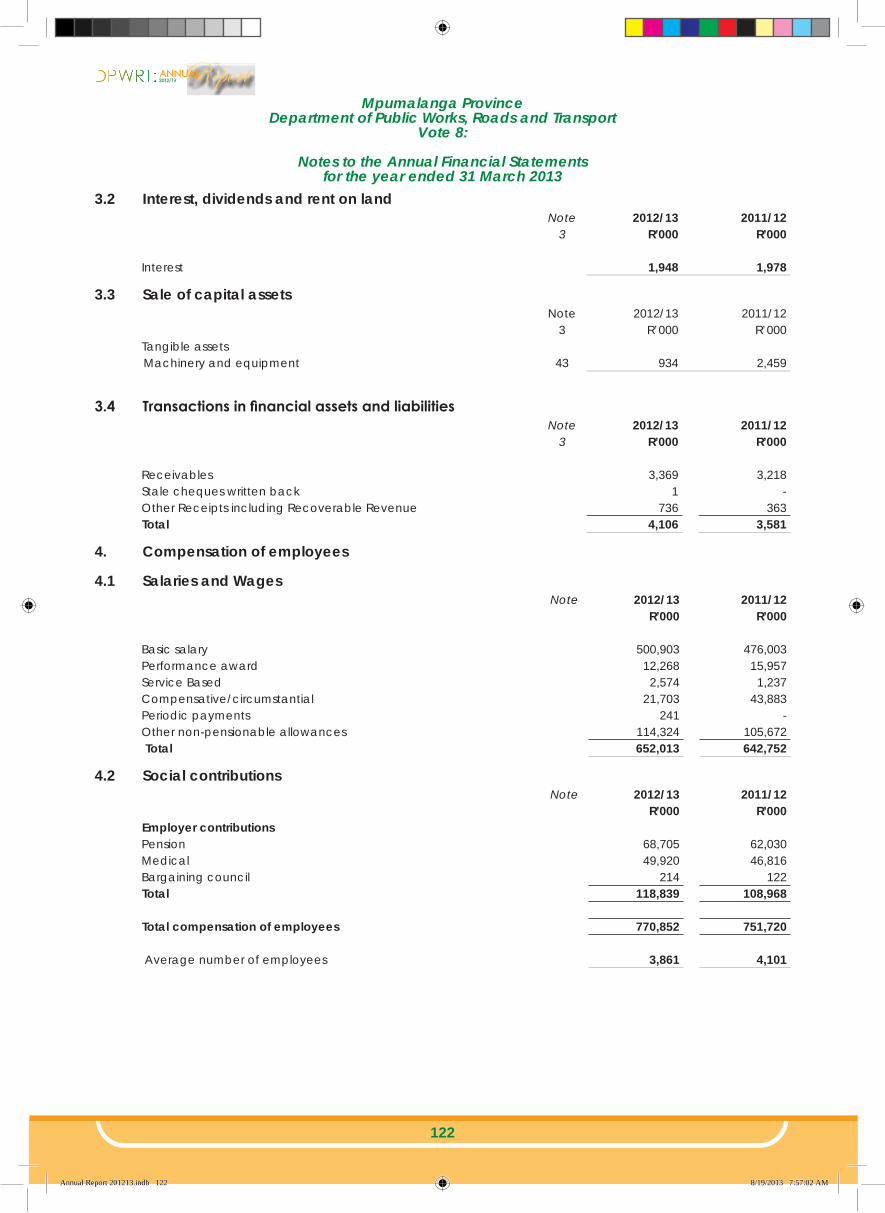
ANNUAL
122
3.2 Interest, dividends and rent on land Note 2012/13 2011/12
3 R’000 R’000
Interest 1,948 1,978
3.3 Sale of capital assetsNote 2012/13 2011/12
3 R’000 R’000 Tangible assets
Machinery and equipment 43 934 2,459
3.4 Transactions in financial assets and liabilitiesNote 2012/13 2011/12
3 R’000 R’000
Receivables 3,369 3,218 Stale cheques written back 1 - Other Receipts including Recoverable Revenue 736 363 Total 4,106 3,581
4. Compensation of employees
4.1 Salaries and WagesNote 2012/13 2011/12
R’000 R’000
Basic salary 500,903 476,003 Performance award 12,268 15,957 Service Based 2,574 1,237 Compensative/circumstantial 21,703 43,883 Periodic payments 241 - Other non-pensionable allowances 114,324 105,672 Total 652,013 642,752
4.2 Social contributionsNote 2012/13 2011/12
R’000 R’000 Employer contributions Pension 68,705 62,030 Medical 49,920 46,816 Bargaining council 214 122 Total 118,839 108,968
Total compensation of employees 770,852 751,720
Average number of employees 3,861 4,101
Mpumalanga ProvinceDepartment of Public Works, Roads and Transport
Vote 8:
Notes to the Annual Financial Statementsfor the year ended 31 March 2013
Annual Report 201213.indb 122 8/19/2013 7:57:02 AM

ANNUAL
123
5. Goods and services Note 2012/13 2011/12
R’000 R’000
Administrative fees 139 216 Advertising 1,764 6,299 Assets less then R5,000 5.1 855 6,763 Bursaries (employees) 785 1,061 Catering 2,222 2,130 Communication 18,727 18,943 Computer services 5.2 1,608 1,467 Consultants, contractors and agency/outsourced services 5.3 165,660 135,458 Audit cost – external 5.4 8,276 8,739 Fleet services 24,959 30,100 Inventory 5.5 112,220 104,105 Operating leases 27,198 120,563 Property payments 5.6 381,612 434,367 Rental and hiring 59 - Transport provided as part of the departmental activities 445,198 343,673 Travel and subsistence 5.7 58,485 54,173 Venues and facilities 1,212 1,930 Training and staff development 1,762 31,976 Other operating expenditure 5.8 16,418 12,218 Total 1,269,159 1,314,181
5.1 Assets less than R5,000Note 2012/13 2011/12
R’000 R’000 Tangible assets
Machinery and equipment 855 6,763 Total 855 6,763
5.2 Computer servicesNote 2012/13 2011/12
R’000 R’000
SITA computer services 1,052 1,047 External computer service providers 556 420 Total 1,608 1,467
5.3 Consultants, contractors and agency/outsourced servicesNote 2012/13 2011/12
R’000 R’000
Business and advisory services 56,700 16,705 Infrastructure and planning 49,933 105,821 Legal costs 6,015 4,293 Contractors 147 2,476 Agency and support/outsourced services 52,865 6,163 Total 165,660 135,458
Mpumalanga ProvinceDepartment of Public Works, Roads and Transport
Vote 8:
Notes to the Annual Financial Statementsfor the year ended 31 March 2013
Annual Report 201213.indb 123 8/19/2013 7:57:02 AM

ANNUAL
124
5.4 Audit cost – External Note 2012/13 2011/12
R’000 R’000
Regularity audits 8,276 8,739
5.5 InventoryNote 2012/13 2011/12
R’000 R’000
Food and food supplies 106 207 Fuel, oil and gas 8,235 10,652 Other consumables 84,773 72,614 Materials and supplies 8,749 10,205 Stationery and printing 10,349 10,415 Medical supplies 8 12 Total 112,220 104,105
5.6 Property paymentsNote 2012/13 2011/12
R’000 R’000
Municipal services 21,581 21,623 Property maintenance and repairs 271,360 283,944 Other 88,671 128,800 Total 381,612 434,367
5.7 Travel and subsistenceNote 2012/13 2011/12
R’000 R’000
Local 58,351 54,173 Foreign 134 - Total 58,485 54,173
5.8 Other operating expenditureNote 2012/13 2011/12
8 R’000 R’000
Learnerships 1,529 1,491 Professional bodies, membership and subscription fees 158 83 Resettlement costs - 200 Other 14,731 10,444 Total 16,418 12,218
6. Payments for financial assetNote 2012/13 2011/12
R’000 R’000
Debts written off 6.1 2,502 2,502 Total 2,502 2,502
Mpumalanga ProvinceDepartment of Public Works, Roads and Transport
Vote 8:
Notes to the Annual Financial Statementsfor the year ended 31 March 2013
Annual Report 201213.indb 124 8/19/2013 7:57:02 AM

ANNUAL
125
6.1 Debts written offNote 2012/13 2011/12
10 R’000 R’000
Irrecoverable debt written off 2,502 2,502
7. Transfers and subsidies2012/13 2011/12
R’000 R’000Note
Provinces and municipalities Annex 1A 76,870 73,963 Public corporations and private enterprises Annex 1B 464,724 433,607 Households Annex 1C 7,734 13,477 Total 549,328 521,047
Unspent funds transferred to the above beneficiaries
8. Expenditure for capital assets Note 2012/13 2011/12
R’000 R’000
Tangible assets 931,241 998,404 Buildings and other fixed structures 29 922,528 971,380 Machinery and equipment 28 8,713 27,024
8.1 Analysis of funds utilised to acquire capital assets – 2012/13Voted funds Total
R’000 R’000
Tangible assets 931,241 931,241 Buildings and other fixed structures 922,528 922,528 Machinery and equipment 8,713 8,713
Total 931,241 931,241
8.2 Analysis of funds utilised to acquire capital assets – 2011/12Voted funds Total
R’000 R’000
Tangible assets 998,404 998,404 Buildings and other fixed structures 971,380 971,380 Machinery and equipment 27,024 27,024
Total 998,404 998,404
Mpumalanga ProvinceDepartment of Public Works, Roads and Transport
Vote 8:
Notes to the Annual Financial Statementsfor the year ended 31 March 2013
Annual Report 201213.indb 125 8/19/2013 7:57:02 AM
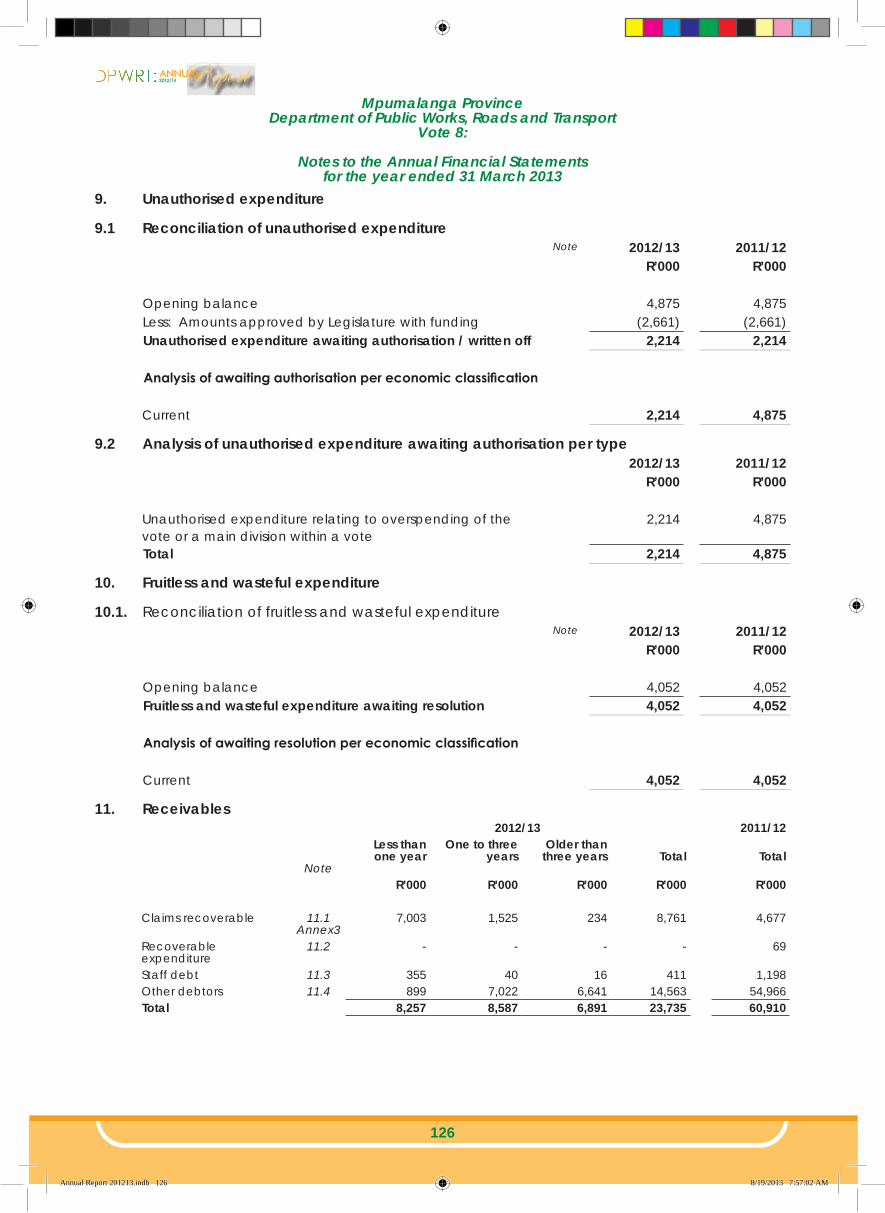
ANNUAL
126
9. Unauthorised expenditure
9.1 Reconciliation of unauthorised expenditureNote 2012/13 2011/12
R’000 R’000
Opening balance 4,875 4,875 Less: Amounts approved by Legislature with funding (2,661) (2,661) Unauthorised expenditure awaiting authorisation / written off 2,214 2,214
Analysis of awaiting authorisation per economic classification
Current 2,214 4,875
9.2 Analysis of unauthorised expenditure awaiting authorisation per type2012/13 2011/12
R’000 R’000
Unauthorised expenditure relating to overspending of the vote or a main division within a vote
2,214 4,875
Total 2,214 4,875
10. Fruitless and wasteful expenditure
10.1. Reconciliation of fruitless and wasteful expenditureNote 2012/13 2011/12
R’000 R’000
Opening balance 4,052 4,052 Fruitless and wasteful expenditure awaiting resolution 4,052 4,052
Analysis of awaiting resolution per economic classification
Current 4,052 4,052
11. Receivables2012/13 2011/12
Note
Less than one year
One to three years
Older than three years Total Total
R’000 R’000 R’000 R’000 R’000
Claims recoverable 11.1Annex3
7,003 1,525 234 8,761 4,677
Recoverable expenditure
11.2 - - - - 69
Staff debt 11.3 355 40 16 411 1,198 Other debtors 11.4 899 7,022 6,641 14,563 54,966 Total 8,257 8,587 6,891 23,735 60,910
Mpumalanga ProvinceDepartment of Public Works, Roads and Transport
Vote 8:
Notes to the Annual Financial Statementsfor the year ended 31 March 2013
Annual Report 201213.indb 126 8/19/2013 7:57:02 AM

ANNUAL
127
11.1 Claims recoverableNote 2012/13 2011/12
R’000 R’000
National departments 49 251 Provincial departments 7,945 4,425 Public entities - 1 Local governments 767 -
Total 8,761 4,677
11.2 Recoverable expenditure (disallowance accounts)Note 2012/13 2011/12
R’000 R’000
Interdepartmental Claims - 53 Sal: Pension Fund - 16 Total - 69
11.3 Staff debtNote 2012/13 2011/12
R’000 R’000
Employees 411 1,198 Total 411 1,198
11.4 Other debtorsNote 2012/13 2011/12
R’000 R’000
Suppliers 6,304 6,287 Rental (Business and Housing) 6,828 8,914 National Roads Agency - 1,943 Ex-Employees 1,429 1,345 Provincial Treasury - 36,477 Tax Debts 2 - Total 14,563 54,966
12. Voted funds to be surrendered to the Revenue FunNote 2012/13 2011/12
R’000 R’000
Opening balance (36,477) (215,477) Transfer from statement of financial performance 4,399 5,262 Paid during the year 36,477 173,708 Closing balance 4,399 (36,477)
13. Departmental revenue and NRF Receipts to be surrendered to the Revenue FundNote 2012/13 2011/12
R’000 R’000
Opening balance 7,532 37,816 Transfer from Statement of Financial Performance 25,848 22,230 Paid during the year (30,075) (52,514) Closing balance 3,305 7,532
Mpumalanga ProvinceDepartment of Public Works, Roads and Transport
Vote 8:
Notes to the Annual Financial Statementsfor the year ended 31 March 2013
Annual Report 201213.indb 127 8/19/2013 7:57:03 AM

ANNUAL
128
14. Bank OverdraftNote 2012/13 2011/12
R’000 R’000
Consolidated Paymaster General Account (14,988) (20) Total (14,988) (20)
15. Payables – currentNote 2012/13 2011/12
R’000 R’000
Amounts owing to other entities Annex4 - 52,248 Clearing accounts 15.1 200 77 Other payables 15.2 198 524 Total 398 52,849
15.1 Clearing accountsNote 2012/13 2011/12
R’000 R’000
Sal: Income Tax: CL 200 - Sal: Medical - 77 Total 200 77
15.2 Other payablesNote 2012/13 2011/12
R’000 R’000
Operating Licence Turn Around Strategy - 482 Public Infrastructure Summit 193 - Office of the Premier 5 - Siyatentela - 42 Total 198 524
16. Net cash flow available from operating activitiesNote 2012/13 2011/12
R’000 R’000
Net surplus/(deficit) as per Statement of Financial Performance 30,247 27,492 Add back non cash/cash movements not deemed operating activities
887,617 1,187,929
(Increase)/decrease in receivables – current 37,163 23,069 (Increase)/decrease in other current assets 2,661 - Increase/(decrease) in payables – current (52,439) 47,721 Proceeds from sale of capital assets (934) (2,459) Expenditure on capital assets 931, 241 998,404 Surrenders to Revenue Fund 6,402 121,194 Other non-cash items (36,477) - Net cash flow generated by operating activities 917,864 1,215,421
17. Reconciliation of cash and cash equivalents for cash flow purposesNote 2012/13 2011/12
R’000 R’000
Consolidated Paymaster General account (14,988) (20) Total (14,988) (20)
Mpumalanga ProvinceDepartment of Public Works, Roads and Transport
Vote 8:
Notes to the Annual Financial Statementsfor the year ended 31 March 2013
Annual Report 201213.indb 128 8/19/2013 7:57:03 AM

ANNUAL
129
Thes
e am
ount
s ar
e no
t re
cogn
ised
in t
he A
nnua
l Fin
anci
al S
tate
men
ts a
nd a
re d
isclo
sed
to
enha
nce
the
usef
ulne
ss o
f th
e A
nnua
l Fin
anci
al
Stat
emen
ts.
18.
Con
tinge
nt li
abili
ties
and
cont
inge
nt a
sset
s
18.1
C
ontin
gent
liab
ilitie
sN
ote
2012
/13
2011
/12
R’00
0R’
000
Liabl
e to
N
atur
eHo
usin
g lo
an g
uara
ntee
s Em
ploy
ees
Ann
ex 2
A3,
898
4,01
6C
laim
s aga
inst
the
dep
artm
ent
Ann
ex 2
B29
6,04
950
5,96
6O
ther
dep
artm
ents
(int
erd
epar
tmen
tal u
ncon
firm
ed b
alan
ces)
A
nnex
419
,977
-To
tal
319,
924
509,
982
Mpu
mal
anga
Pro
vinc
eDe
partm
ent o
f Pub
lic W
orks
, Roa
ds a
nd Tr
ansp
ort
Vote
8:
Disc
losu
re N
otes
to th
e A
nnua
l Fin
anci
al S
tate
men
tsfo
r the
yea
r end
ed 3
1 M
arch
201
3
Annual Report 201213.indb 129 8/19/2013 7:57:03 AM

ANNUAL
130
19.
Com
mitm
ents
Not
e20
12/1
320
11/1
2R’
000
R’00
0
C
urre
nt e
xpen
ditu
re
A
ppro
ved
and
con
tract
ed1,
390,
070
1,89
1,33
2
Cap
ital e
xpen
ditu
re
A
ppro
ved
and
con
tract
ed1,
098,
658
682,
290
Tot
al C
omm
itmen
ts2,
488,
728
2,57
3,62
2
Cur
rent
app
rove
d an
d co
ntra
cted
com
mitm
ents
incl
ude
the
follo
win
g co
mm
itmen
ts w
hich
are
long
er th
an a
yea
r;
1. S
chol
ar T
rans
port-
(Not
late
r tha
n a
year
- R4
18,6
93 m
illion
; Lat
er th
an a
yea
r but
not
late
r tha
n 5
year
s - R
942
,059
milli
on)
2. R
iver
side
Gov
ernm
ent C
ompl
ex M
aint
enan
ce -
(Not
late
r tha
n a
year
- R2
0,10
0 m
illion
; Lat
er
than
a b
ut n
ot la
ter t
han
5 ye
ars –
R7,
486
milli
on)
Mpu
mal
anga
Pro
vinc
eDe
partm
ent o
f Pub
lic W
orks
, Roa
ds a
nd Tr
ansp
ort
Vote
8:
Disc
losu
re N
otes
to th
e A
nnua
l Fin
anci
al S
tate
men
tsfo
r the
yea
r end
ed 3
1 M
arch
201
3
Annual Report 201213.indb 130 8/19/2013 7:57:03 AM

ANNUAL
131
20
Acc
rual
s20
12/1
320
11/1
2
List
ed b
y ec
onom
ic c
lass
ifica
tion
30
Days
30+
Days
Tota
lTo
tal
R’00
0R’
000
R’00
0R’
000
Goo
ds a
nd se
rvic
es49
,815
2,74
352
,558
117,
338
Cap
ital a
sset
s14
,092
488
14,5
8010
3,62
6
O
ther
721
-72
12,
313
Tot
al64
,628
3,23
167
,859
223,
277
Not
e20
12/1
320
11/1
2
L
isted
by
prog
ram
me
leve
lR’
000
R’00
0
Ad
min
istra
tion
5,69
418
,943
Pub
lic W
orks
4,17
514
,767
Tra
nspo
rt In
frast
ruct
ure
24,9
5911
5,40
9
T
rans
port
Ope
ratio
ns32
,980
69,4
98
C
omm
unity
Bas
ed P
rogr
amm
es51
4,66
0
T
otal
67,8
5922
3,27
7
Mpu
mal
anga
Pro
vinc
eDe
partm
ent o
f Pub
lic W
orks
, Roa
ds a
nd Tr
ansp
ort
Vote
8:
Disc
losu
re N
otes
to th
e A
nnua
l Fin
anci
al S
tate
men
tsfo
r the
yea
r end
ed 3
1 M
arch
201
3
Annual Report 201213.indb 131 8/19/2013 7:57:03 AM

ANNUAL
132
21.
Empl
oyee
ben
efits
Not
e20
12/1
320
11/1
2
R’00
0R’
000
Lea
ve e
ntitl
emen
t45
,923
40,8
44
S
ervi
ce b
onus
(Thi
rteen
th c
hequ
e)22
,307
21,4
33
P
erfo
rman
ce a
war
ds
12,2
6811
,294
Cap
ped
leav
e co
mm
itmen
ts87
,381
85,5
74
T
otal
167,
879
159,
145
22.
Leas
e co
mm
itmen
ts
22.1
O
pera
ting
leas
es e
xpen
ditu
re
201
2/13
Build
ings
and
oth
er
fixed
stru
ctur
esM
achi
nery
and
eq
uipm
ent
Tota
l
R’00
0R’
000
R’00
0
Not
late
r tha
n 1
year
83,7
051,
358
85,0
63
L
ater
than
1 y
ear a
nd n
ot la
ter t
han
5 ye
ars
267,
707
506
268,
213
Lat
er th
an fi
ve y
ears
17,2
30-
17,2
30
T
otal
leas
e co
mm
itmen
ts36
8,64
21,
864
370,
506
Ope
ratin
g le
ases
exp
endi
ture
201
1/12
Build
ings
and
oth
er
fixed
stru
ctur
esM
achi
nery
and
eq
uipm
ent
Tota
l
R’00
0R’
000
R’00
0
Not
late
r tha
n 1
year
75,9
441,
205
77,1
49
L
ater
than
1 y
ear a
nd n
ot la
ter t
han
5 ye
ars
236,
349
815
237,
164
Lat
er th
an fi
ve y
ears
96,7
04-
96,7
04
T
otal
leas
e co
mm
itmen
ts40
8,99
72,
020
411,
017
Mpu
mal
anga
Pro
vinc
eDe
partm
ent o
f Pub
lic W
orks
, Roa
ds a
nd Tr
ansp
ort
Vote
8:
Disc
losu
re N
otes
to th
e A
nnua
l Fin
anci
al S
tate
men
tsfo
r the
yea
r end
ed 3
1 M
arch
201
3
Annual Report 201213.indb 132 8/19/2013 7:57:03 AM

ANNUAL
133
23.
Irr
egul
ar e
xpen
ditu
re
23.1
Re
conc
iliat
ion
of ir
regu
lar e
xpen
ditu
re
Not
e20
12/1
320
11/1
2R’
000
R’00
0
Ope
ning
bal
ance
419,
331
358,
278
Ad
d: I
rregu
lar e
xpen
ditu
re –
rela
ting
to c
urre
nt y
ear
23,0
0661
,053
Irre
gula
r exp
endi
ture
aw
aitin
g co
ndon
atio
n44
2,33
741
9,33
1
Ana
lysis
of a
wai
ting
cond
onat
ion
per a
ge c
lass
ifica
tion
Cur
rent
yea
r23
,006
61,0
53
P
rior y
ears
419,
331
358,
278
Tot
al44
2,33
741
9,33
1
23.2
De
tails
of i
rregu
lar e
xpen
ditu
re –
cur
rent
yea
r
Inc
iden
tDi
scip
linar
y st
eps
take
n/cr
imin
al
proc
eedi
ngs
2012
/13
R’00
0
Con
trave
ntio
n of
Sup
ply
Cha
in M
anag
emen
t pra
ctic
e no
te 7
of 2
009/
10 –
Non
e d
ecla
ratio
n of
i
nter
est b
y em
ploy
ees f
rom
oth
er d
epar
tmen
ts
Non
e14
,698
Con
trave
ntio
n of
Sup
ply
Cha
in M
anag
emen
t pra
ctic
e no
te 7
of 2
009/
10 –
Non
e d
ecla
ratio
n of
i
nter
est b
y em
ploy
ees f
rom
oth
er d
epar
tmen
tsN
one
34
Ove
rtim
e al
low
ance
not
in lin
e w
ith p
resc
ripts
Non
e14
8
A
ctin
g A
llow
ance
s not
in lin
e w
ith P
ublic
Ser
vice
Reg
ulat
ion
Non
e95
4
O
verp
aym
ents
of b
us c
ontra
cts
Non
e7,
172
Tot
al23
,006
The
depa
rtmen
t is
inve
stig
atin
g po
ssib
le in
stan
ces
of ir
regu
lar e
xpen
ditu
re w
hich
has
not
bee
n in
clud
ed in
the
amou
nt d
isclo
sed
abov
e.
The
full
exte
nt o
f irre
gula
rity
wou
ld o
nly
be k
now
n at
the
conc
lusio
n of
thes
e in
vest
igat
ions
. The
am
ount
disc
lose
d ab
ove
may
cha
nge
base
d on
the
outc
ome
of th
ese
inve
stig
atio
ns.
Mpu
mal
anga
Pro
vinc
eDe
partm
ent o
f Pub
lic W
orks
, Roa
ds a
nd Tr
ansp
ort
Vote
8:
Disc
losu
re N
otes
to th
e A
nnua
l Fin
anci
al S
tate
men
tsfo
r the
yea
r end
ed 3
1 M
arch
201
3
Annual Report 201213.indb 133 8/19/2013 7:57:04 AM
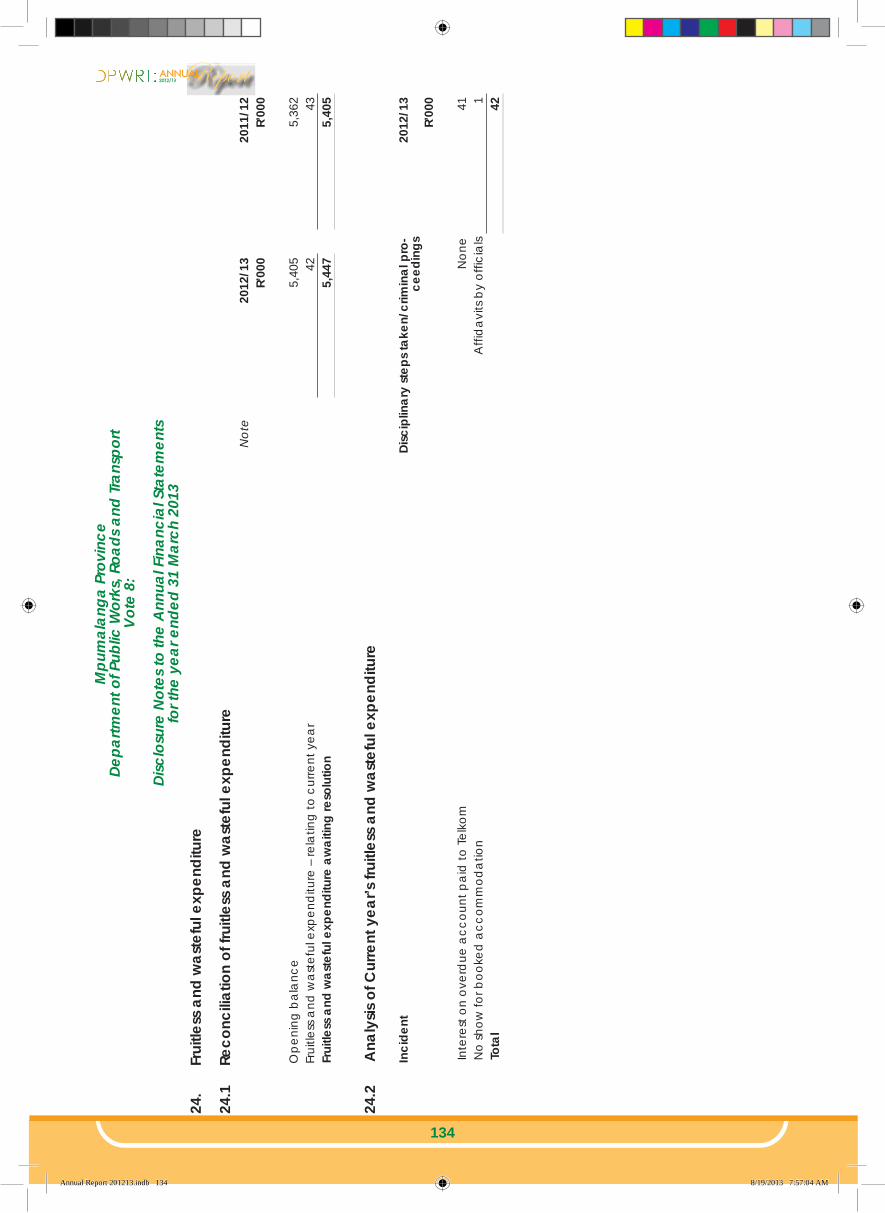
ANNUAL
134
24.
Frui
tless
and
was
tefu
l exp
endi
ture
24.1
Re
conc
iliat
ion
of fr
uitle
ss a
nd w
aste
ful e
xpen
ditu
re
Not
e20
12/1
320
11/1
2R’
000
R’00
0
Ope
ning
bal
ance
5,40
55,
362
Fru
itles
s and
was
tefu
l exp
end
iture
– re
latin
g to
cur
rent
yea
r42
43
F
ruitl
ess
and
was
tefu
l exp
endi
ture
aw
aitin
g re
solu
tion
5,44
75,
405
24.2
A
naly
sis o
f Cur
rent
yea
r’s fr
uitle
ss a
nd w
aste
ful e
xpen
ditu
re
Inc
iden
tDi
scip
linar
y st
eps
take
n/cr
imin
al p
ro-
ceed
ings
2012
/13
R’00
0
In
tere
st o
n ov
erd
ue a
ccou
nt p
aid
to T
elko
mN
one
41
No
show
for b
ooke
d a
ccom
mod
atio
nA
ffid
avits
by
offic
ials
1
Tota
l42
Mpu
mal
anga
Pro
vinc
eDe
partm
ent o
f Pub
lic W
orks
, Roa
ds a
nd Tr
ansp
ort
Vote
8:
Disc
losu
re N
otes
to th
e A
nnua
l Fin
anci
al S
tate
men
tsfo
r the
yea
r end
ed 3
1 M
arch
201
3
Annual Report 201213.indb 134 8/19/2013 7:57:04 AM

ANNUAL
135
25.
Rel
ated
par
ty tr
ansa
ctio
ns
Durin
g th
e fin
anci
al y
ear u
nder
revi
ew th
e De
partm
ent p
rovi
ded
free
acco
mm
odat
ion
to th
e fo
llow
ing
Depa
rtmen
ts.
1. V
ote
1 :
Offi
ce o
f the
Pre
mie
r
2. V
ote
2 :
Pro
vinc
ial L
egisl
atur
e
3. V
ote
3 :
Fin
ance
4. V
ote
4 :
Co-
oper
ativ
e G
over
nanc
e an
d T
rad
ition
al A
ffairs
5. V
ote
5 :
Agr
icul
ture
, Rur
al D
evel
opm
ent a
nd L
and
Ad
min
istra
tion
6. V
ote
6 :
Eco
nom
ic D
evel
opm
ent,
Envi
ronm
ent a
nd T
ouris
m
7. V
ote
7 :
Ed
ucat
ion
8. V
ote
9 :
Saf
ety,
Sec
urity
and
Lia
ison
9. V
ote
10 :
Heal
th
10. V
ote
11: C
ultu
re, S
ports
and
Rec
reat
ion
11. V
ote
12: S
ocia
l Dev
elop
men
t
12. V
ote
13: H
uman
Set
tlem
ent
The
depa
rtmen
t has
bee
n us
ing
netw
ork
infra
stru
ctur
e pr
ovid
ed b
y th
e De
partm
ent o
f Fin
ance
free
of c
harg
e du
ring
the
finan
cial
yea
r und
er re
view
26.
Key
man
agem
ent p
erso
nnel
No.
of I
ndiv
idua
ls20
12/1
320
11/1
2R’
000
R’00
0
Po
litic
al o
ffice
bea
rers
(MEC
)1
1,65
21,
541
O
ffici
als:
L
evel
15
to 1
64
4,13
23,
418
L
evel
14
(incl
. CFO
if a
t a lo
wer
leve
l)9
7,62
87,
106
To
tal
13,4
1212
,065
Mpu
mal
anga
Pro
vinc
eDe
partm
ent o
f Pub
lic W
orks
, Roa
ds a
nd Tr
ansp
ort
Vote
8:
Disc
losu
re N
otes
to th
e A
nnua
l Fin
anci
al S
tate
men
tsfo
r the
yea
r end
ed 3
1 M
arch
201
3
Annual Report 201213.indb 135 8/19/2013 7:57:04 AM

ANNUAL
136
27.
Impa
irmen
tN
ote
2012
/13
2011
/12
R’00
0R’
000
Im
pairm
ent
D
ebto
rs-
10,0
43
Tota
l-
10,0
43
28.
Mov
able
Tang
ible
Cap
ital A
sset
s
M
OVE
MEN
T IN
MO
VABL
E TA
NG
IBLE
CA
PITA
L A
SSET
S PE
R A
SSET
REG
ISTE
R FO
R TH
E YE
AR
ENDE
D 31
MA
RCH
2013
Ope
ning
ba
lanc
eC
urr Y
ear
Adj
ust-
men
ts
to p
rior y
ear
bala
nces
Add
ition
sDi
spos
als
Clo
sing
Bala
nce
R’00
0R’
000
R’00
0R’
000
R’00
0
MA
CHI
NER
Y A
ND
EQUI
PMEN
T28
3,83
638
212
,893
(11,
241)
285,
870
Tra
nspo
rt as
sets
126,
049
216
4,64
8(1
,500
)12
9,41
3
C
ompu
ter e
quip
men
t22
,825
(389
)2,
984
(2,8
00)
22,6
20
F
urni
ture
and
offi
ce e
quip
men
t20
,241
1,06
61,
196
(5,0
26)
17,4
77
O
ther
mac
hine
ry a
nd e
quip
men
t11
4,72
1(5
11)
4,06
5(1
,915
)11
6,36
0
SPE
CIA
LISE
D M
ILITA
RY A
SSET
S4,
540
--
-4,
540
Spe
cial
ised
milit
ary
asse
ts4,
540
--
-4,
540
BIO
LOG
ICA
L A
SSET
S33
0-
--
330
Bio
logi
cal a
sset
s33
0-
--
330
TO
TAL
MO
VABL
E TA
NG
IBLE
CA
PITA
L A
SSET
S28
8,70
638
212
,893
(11,
241)
290,
740
Mpu
mal
anga
Pro
vinc
eDe
partm
ent o
f Pub
lic W
orks
, Roa
ds a
nd Tr
ansp
ort
Vote
8:
Disc
losu
re N
otes
to th
e A
nnua
l Fin
anci
al S
tate
men
tsfo
r the
yea
r end
ed 3
1 M
arch
201
3
Annual Report 201213.indb 136 8/19/2013 7:57:04 AM

ANNUAL
137
28.1
A
dditi
ons
ADD
ITIO
NS
TO M
OVA
BLE
TAN
GIB
LE C
API
TAL
ASS
ETS
PER
ASS
ET R
EGIS
TER
FOR
THE
YEA
R EN
DED
31 M
ARC
H 20
13C
ash
Non
-cas
h(C
apita
l W
ork
in
Prog
ress
cu
rrent
cos
ts
and
finan
ce
leas
e pa
ymen
ts)
Rece
ived
cu
rrent
, not
pa
id(P
aid
curre
nt
year
, re
ceiv
ed
prio
r yea
r)
Tota
l
R’00
0R’
000
R’00
0R’
000
R’00
0
MA
CHI
NER
Y A
ND
EQUI
PMEN
T8,
712
4,18
1-
-12
,893
Tra
nspo
rt as
sets
4,64
8-
--
4,64
8
C
ompu
ter e
quip
men
t2,
469
515
--
2,98
4
F
urni
ture
and
offi
ce e
quip
men
t60
659
0-
-1,
196
Oth
er m
achi
nery
and
equ
ipm
ent
989
3,07
6-
-4,
065
TO
TAL
ADD
ITIO
NS
TO M
OVA
BLE
TAN
GIB
LE C
API
TAL
ASS
ETS
8,7
12
4,
181
-
-
12,
893
Mpu
mal
anga
Pro
vinc
eDe
partm
ent o
f Pub
lic W
orks
, Roa
ds a
nd Tr
ansp
ort
Vote
8:
Disc
losu
re N
otes
to th
e A
nnua
l Fin
anci
al S
tate
men
tsfo
r the
yea
r end
ed 3
1 M
arch
201
3
Annual Report 201213.indb 137 8/19/2013 7:57:04 AM
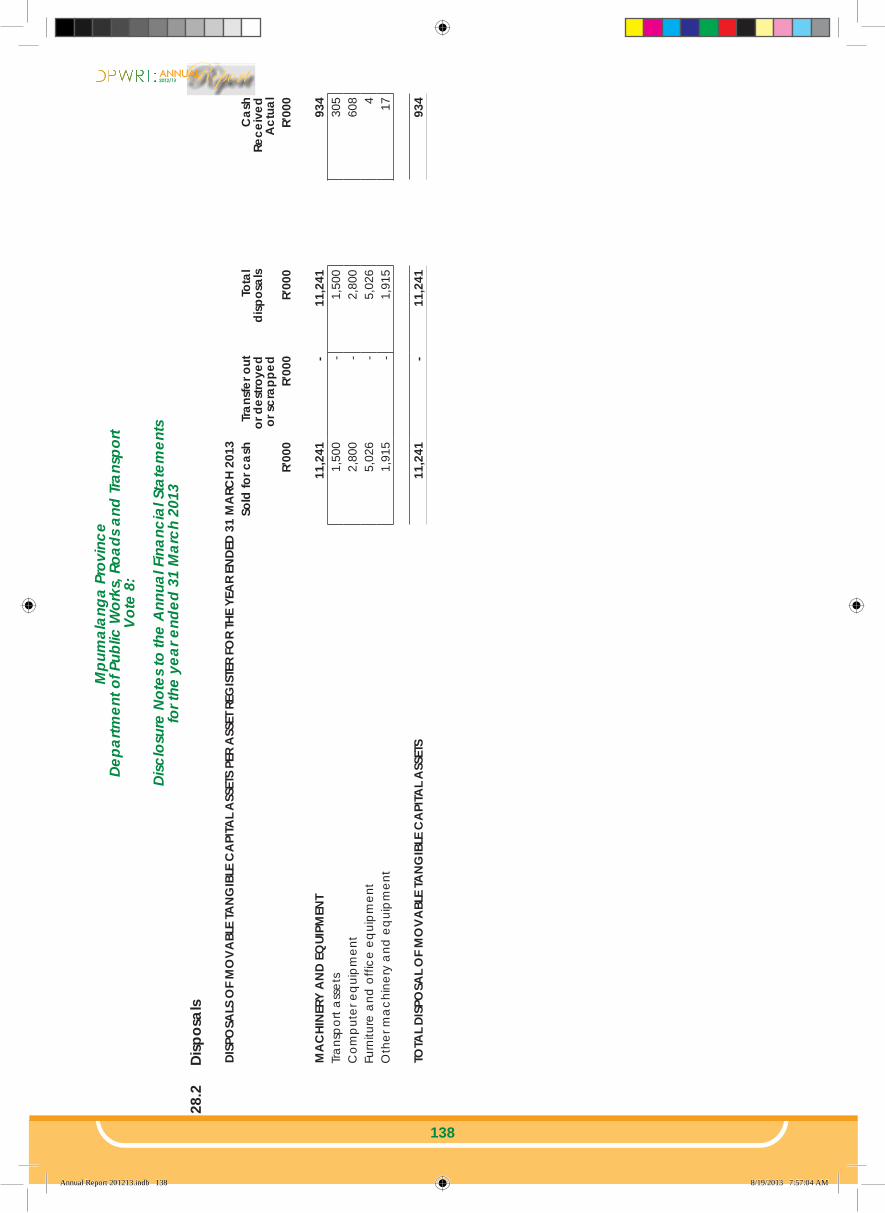
ANNUAL
138
28.2
Di
spos
als
DIS
POSA
LS O
F M
OVA
BLE
TAN
GIB
LE C
API
TAL
ASS
ETS
PER
ASS
ET R
EGIS
TER
FOR
THE
YEA
R EN
DED
31 M
ARC
H 20
13So
ld fo
r cas
hTr
ansf
er o
ut
or d
estro
yed
or s
crap
ped
Tota
l di
spos
als
Cas
h Re
ceiv
ed
Act
ual
R’00
0R’
000
R’00
0R’
000
MA
CHI
NER
Y A
ND
EQUI
PMEN
T11
,241
-11
,241
934
Tra
nspo
rt as
sets
1,50
0-
1,50
030
5
C
ompu
ter e
quip
men
t2,
800
-2,
800
608
Fur
nitu
re a
nd o
ffice
equ
ipm
ent
5,02
6-
5,02
64
Oth
er m
achi
nery
and
equ
ipm
ent
1,91
5-
1,91
517
TO
TAL
DISP
OSA
L O
F M
OVA
BLE
TAN
GIB
LE C
API
TAL
ASS
ETS
11,2
41-
11,2
4193
4
Mpu
mal
anga
Pro
vinc
eDe
partm
ent o
f Pub
lic W
orks
, Roa
ds a
nd Tr
ansp
ort
Vote
8:
Disc
losu
re N
otes
to th
e A
nnua
l Fin
anci
al S
tate
men
tsfo
r the
yea
r end
ed 3
1 M
arch
201
3
Annual Report 201213.indb 138 8/19/2013 7:57:04 AM

ANNUAL
139
28.3
M
ovem
ent f
or 2
011/
12
MO
VEM
ENT I
N M
OVA
BLE
TAN
GIB
LE C
API
TAL
ASS
ETS
PER
ASS
ET R
EGIS
TER
FOR
THE
YEA
R EN
DED
31 M
ARC
H 20
12O
peni
ng
bala
nce
Add
ition
sDi
spos
als
Clo
sing
bala
nce
R’00
0R’
000
R’00
0R’
000
MA
CHI
NER
Y A
ND
EQUI
PMEN
T42
2,61
227
,024
(165
,800
)28
3,83
6
T
rans
port
asse
ts19
8,39
615
,294
(87,
641)
126,
049
Com
pute
r equ
ipm
ent
67,3
613,
669
(48,
205)
22,8
25
F
urni
ture
and
offi
ce e
quip
men
t34
,090
1,23
9(1
5,08
8)20
,241
Oth
er m
achi
nery
and
equ
ipm
ent
122,
765
6,82
2(1
4,86
6)11
4,72
1
SPE
CIA
LISE
D M
ILITA
RY A
SSET
S4,
540
--
4,54
0
S
peci
alise
d m
ilitar
y as
sets
4,54
0-
-4,
540
BIO
LOG
ICA
L A
SSET
S33
0-
-33
0
B
iolo
gica
l ass
ets
330
--
330
TO
TAL
MO
VABL
E TA
NG
IBLE
ASS
ETS
427,
482
27,0
24(1
65,8
00)
288,
706
Mpu
mal
anga
Pro
vinc
eDe
partm
ent o
f Pub
lic W
orks
, Roa
ds a
nd Tr
ansp
ort
Vote
8:
Disc
losu
re N
otes
to th
e A
nnua
l Fin
anci
al S
tate
men
tsfo
r the
yea
r end
ed 3
1 M
arch
201
3
Annual Report 201213.indb 139 8/19/2013 7:57:04 AM
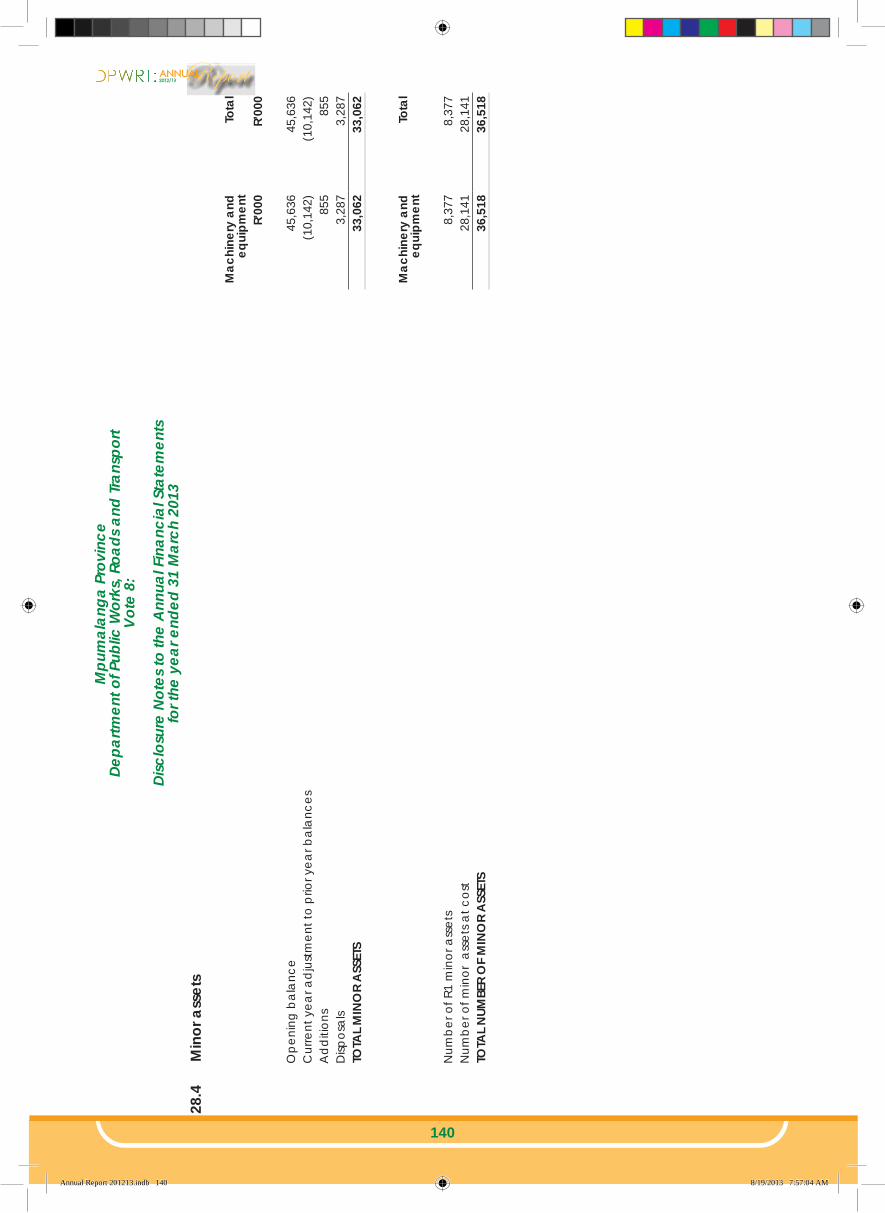
ANNUAL
140
28.4
M
inor
ass
ets
Mac
hine
ry a
nd
equi
pmen
tTo
tal
R’00
0R’
000
Ope
ning
bal
ance
45,6
3645
,636
Cur
rent
yea
r ad
just
men
t to
prio
r yea
r bal
ance
s(1
0,14
2)(1
0,14
2)
A
dd
ition
s85
585
5
D
ispos
als
3,28
73,
287
TO
TAL
MIN
OR
ASS
ETS
33,0
6233
,062
Mac
hine
ry a
nd
equi
pmen
tTo
tal
Num
ber o
f R1
min
or a
sset
s8,
377
8,37
7
N
umbe
r of m
inor
ass
ets a
t cos
t28
,141
28,1
41
T
OTA
L N
UMBE
R O
F M
INO
R A
SSET
S36
,518
36,5
18
Mpu
mal
anga
Pro
vinc
eDe
partm
ent o
f Pub
lic W
orks
, Roa
ds a
nd Tr
ansp
ort
Vote
8:
Disc
losu
re N
otes
to th
e A
nnua
l Fin
anci
al S
tate
men
tsfo
r the
yea
r end
ed 3
1 M
arch
201
3
Annual Report 201213.indb 140 8/19/2013 7:57:04 AM

ANNUAL
141
MO
VEM
ENT I
N M
INO
R A
SSET
S PE
R TH
E A
SSET
REG
ISTE
R FO
R TH
E YE
AR
ENDE
D A
S A
T 31
MA
RCH
2012
Mac
hine
ry a
nd
equi
pmen
tR’
000
Tota
l
R’00
0
O
peni
ng b
alan
ce49
,466
49,4
66
A
dd
ition
s6,
763
6,76
3
D
ispos
als
10,5
9310
,593
TO
TAL
MIN
OR
ASS
ETS
45,6
3645
,636
Mac
hine
ry a
nd
equi
pmen
tTo
tal
Num
ber o
f R1
min
or a
sset
s9,
032
9,03
2
N
umbe
r of m
inor
ass
ets a
t cos
t37
,675
37,6
75
T
OTA
L N
UMBE
R O
F M
INO
R A
SSET
S46
,707
46,7
07
Mpu
mal
anga
Pro
vinc
eDe
partm
ent o
f Pub
lic W
orks
, Roa
ds a
nd Tr
ansp
ort
Vote
8:
Disc
losu
re N
otes
to th
e A
nnua
l Fin
anci
al S
tate
men
tsfo
r the
yea
r end
ed 3
1 M
arch
201
3
Annual Report 201213.indb 141 8/19/2013 7:57:05 AM

ANNUAL
142
29.
Imm
ovab
le Ta
ngib
le C
apita
l Ass
ets
MO
VEM
ENT I
N IM
MO
VABL
E TA
NG
IBLE
CA
PITA
L A
SSET
S PE
R A
SSET
REG
ISTE
R FO
R TH
E YE
AR
ENDE
D 31
MA
RCH
2013
Ope
ning
ba
lanc
eC
urr Y
ear
Adj
ust-
men
ts
to p
rior y
ear
bala
nces
Add
ition
sDi
spos
als
Clo
sing
Bala
nce
R’00
0R’
000
R’00
0R’
000
R’00
0
BUI
LDIN
GS
AN
D O
THER
FIX
ED S
TRUC
TURE
S43
,946
,555
663,
515
44,6
10,0
70
D
wel
lings
10,1
30-
--
10,1
30
N
on-re
siden
tial b
uild
ings
842,
770
-40
,415
-88
3,18
5
O
ther
fixe
d st
ruct
ures
43,0
93,6
55-
623,
100
-43
,716
,755
LA
ND
AN
D SU
BSO
IL A
SSET
S-
-1
-1
Lan
d-
-1
-1
TOTA
L IM
MO
VABL
E TA
NG
IBLE
CA
PITA
L A
SSET
S43
,946
,555
-66
3,51
6-
44,6
10,0
71
Mpu
mal
anga
Pro
vinc
eDe
partm
ent o
f Pub
lic W
orks
, Roa
ds a
nd Tr
ansp
ort
Vote
8:
Disc
losu
re N
otes
to th
e A
nnua
l Fin
anci
al S
tate
men
tsfo
r the
yea
r end
ed 3
1 M
arch
201
3
Annual Report 201213.indb 142 8/19/2013 7:57:05 AM

ANNUAL
143
29.1
A
dditi
ons
ADD
ITIO
NS
TO IM
MO
VABL
E TA
NG
IBLE
CA
PITA
L A
SSET
S PE
R A
SSET
REG
ISTE
R FO
R TH
E YE
AR
ENDE
D 31
MA
RCH
2013
Cas
hN
on-c
ash
(Cap
ital W
ork
in
Prog
ress
cur
rent
co
sts
and
finan
ce le
ase
paym
ents
)
Rece
ived
cu
rrent
, not
pa
id(P
aid
curre
nt
year
, rec
eive
d pr
ior y
ear)
Tota
l
R’00
0R’
000
R’00
0R’
000
R’00
0
BUI
LDIN
G A
ND
OTH
ER F
IXED
STR
UCTU
RES
922,
528
658,
922
917,
935
-66
3,51
5
N
on-re
siden
tial b
uild
ings
4,59
335
,822
--
40,4
15
O
ther
fixe
d st
ruct
ures
917,
935
623,
100
(917
,935
)-
623,
100
LA
ND
AN
D SU
BSO
IL A
SSET
S-
1-
-1
Lan
d-
1-
-1
TOTA
L A
DDITI
ON
S TO
IMM
OVA
BLE
TAN
GIB
LE C
API
TAL
ASS
ETS
922,
528
658,
923
(917
,935
)-
663,
516
Mpu
mal
anga
Pro
vinc
eDe
partm
ent o
f Pub
lic W
orks
, Roa
ds a
nd Tr
ansp
ort
Vote
8:
Disc
losu
re N
otes
to th
e A
nnua
l Fin
anci
al S
tate
men
tsfo
r the
yea
r end
ed 3
1 M
arch
201
3
Annual Report 201213.indb 143 8/19/2013 7:57:05 AM

ANNUAL
144
29.2
M
ovem
ent f
or 2
011/
12
MO
VEM
ENT I
N IM
MO
VABL
E TA
NG
IBLE
CA
PITA
L A
SSET
S PE
R A
SSET
REG
ISTE
R FO
R TH
E YE
AR
ENDE
D 31
MA
RCH
2012
Ope
ning
bal
ance
Add
ition
sDi
spos
als
Clo
sing
bala
nce
R’00
0R’
000
R’00
0R’
000
BUI
LDIN
GS
AN
D O
THER
FIX
ED S
TRUC
TURE
S43
,476
,816
469,
739
-43
,946
,555
Dw
ellin
gs10
,130
--
10,1
30
N
on-re
siden
tial b
uild
ings
373,
031
469,
739
-84
2,77
0
O
ther
fixe
d st
ruct
ures
43,0
93,6
55-
-43
,093
,655
TO
TAL
IMM
OVA
BLE
TAN
GIB
LE A
SSET
S43
,476
,816
469,
739
-43
,946
,555
29.3
Im
mov
able
ass
ets
valu
ed a
t R1
IM
MO
VABL
E A
SSET
S VA
LUED
AT R
1 IN
THE
ASS
ET R
EGIS
TER
AS
AT 3
1 M
ARC
H 20
13Bu
ildin
gs a
nd
othe
r fix
ed
stru
ctur
es
Herit
age
asse
tsLa
nd a
nd
subs
oil a
sset
sTo
tal
R1
Imm
ovab
le a
sset
s12
,411
-49
212
,903
TO
TAL
12,4
11-
492
12,9
03
IM
MO
VABL
E A
SSET
S VA
LUED
AT R
1 IN
THE
ASS
ET R
EGIS
TER
AS
AT 3
1 M
ARC
H 20
12Bu
ildin
gs a
nd
othe
r fix
ed
stru
ctur
es
Herit
age
asse
tsLa
nd a
nd
subs
oil a
sset
sTo
tal
R1
Imm
ovab
le a
sset
s12
,506
-41
912
,925
TO
TAL
12,5
06-
419
12,9
25
Mpu
mal
anga
Pro
vinc
eDe
partm
ent o
f Pub
lic W
orks
, Roa
ds a
nd Tr
ansp
ort
Vote
8:
Disc
losu
re N
otes
to th
e A
nnua
l Fin
anci
al S
tate
men
tsfo
r the
yea
r end
ed 3
1 M
arch
201
3
Annual Report 201213.indb 144 8/19/2013 7:57:05 AM

ANNUAL
145
STA
TEM
ENT O
F C
ON
DITIO
NA
L G
RAN
TS R
ECEI
VED
N
AM
E O
F G
RAN
T
GRA
NT A
LLO
CA
TION
Spen
t20
11/1
2
Am
ount
Ro
ll O
vers
DORA
ad
just
men
ts A
djus
tmen
ts
Tota
l A
vaila
ble
Am
ount
re
ceiv
ed
by
depa
rtmen
t
Am
ount
s
pent
by
depa
rtmen
t
% o
f av
aila
ble
fund
s sp
ent b
y de
partm
ent
Tota
l av
aila
ble
Am
ount
s
pent
by
depa
rtmen
t
R’00
0R’
000
R’00
0R’
000
R’00
0R’
000
R’00
0%
R’00
0R’
000
Dev
olut
ion
of
Prop
erty
Ra
tes a
nd T
axes
76,8
70-
--
76,8
7076
,870
76,8
7010
0%73
,964
73,9
63
Prov
inci
al
Road
s M
aint
enan
ce G
rant
1,24
0,69
4-
--
1,24
0,69
41,
240,
694
1,24
0,69
410
0%1,
190,
437
1,19
0,43
7
Prov
inci
al
Tran
spor
t Su
bsid
ies
439,
003
--
-43
9,00
343
9,00
343
9,00
310
0%42
0,09
941
6,97
8
EPW
P In
cent
ive
Gra
nt-
--
16,6
1716
,617
16,6
1716
,617
100%
7,87
87,
861
TOTA
L1,
756,
567
--
16,6
171,
773,
184
1,77
3,18
41,
773,
184
100%
1,69
2,37
81,
689,
239
Mpu
mal
anga
Pro
vinc
eDe
partm
ent o
f Pub
lic W
orks
, Roa
ds a
nd Tr
ansp
ort
Vote
8:
Ann
exur
es (U
naud
ited
Supp
lem
enta
ry S
ched
ules
) to
the
Ann
ual F
inan
cial
Sta
tem
ents
for t
he y
ear e
nded
31
Mar
ch 2
013
Annual Report 201213.indb 145 8/19/2013 7:57:05 AM

ANNUAL
146
AN
NEX
URE
1A
STA
TEM
ENT O
F C
ON
DITIO
NA
L G
RAN
TS P
AID
TO M
UNIC
IPA
LITIE
S
NA
ME
OF
MUN
ICIP
ALI
TY
GRA
NT A
LLO
CA
TION
TRA
NSF
ERSP
ENT
2011
/12
Divi
sion of
Re
venu
e A
ct
Ro
ll O
vers
A
djus
tmen
ts
To
tal
Ava
ilabl
eA
ctua
l Tr
ansf
erFu
nds
With
held
Re-
allo
catio
ns
by N
atio
nal
Trea
sury
or
Nat
iona
l De
partm
ent
Am
ount
re
ceiv
ed
by
depa
rtmen
t
Am
ount
sp
ent b
y de
partm
ent
% o
f av
aila
ble
fund
s sp
ent b
y de
partm
ent
Divi
sion of
Re
venu
e A
ct
R’00
0R’
000
R’00
0R’
000
R’00
0R’
000
%R’
000
R’00
0%
R’00
0A
lber
t Lut
huli
3,30
72,
791
6,09
56,
095
--
6,09
56,
095
100%
2,85
7Bu
shbu
ckrid
ge11
,000
(406
)10
,594
10,5
94-
-10
,594
10,5
9410
0%19
,000
Dip
alise
ng1,
826
(1,8
26)
--
--
--
100%
1,37
7D
r JS
Mor
oka
1,06
1(4
08)
653
653
--
653
653
100%
394
Emak
haze
ni2,
800
2,61
25,
412
5,41
2-
-5,
412
5,41
210
0%1,
148
Emal
ahle
ni1,
505
3,42
54,
930
4,93
0-
-4,
930
4,93
010
0%1,
063
Gov
an M
beki
4,56
71,
702
6,26
96,
269
--
6,26
96,
269
100%
4,11
7Le
kwa
2,93
3(1
41)
2,79
22,
792
--
2,79
22,
792
100%
2,48
3M
bom
bela
18,0
11(8
63)
17,1
4817
,148
--
17,1
4817
,148
100%
18,7
91M
khon
do
2,60
5(2
,605
)-
--
--
-10
0%2,
155
Msu
kalig
wa
4,01
776
64,
783
4,78
3-
-4,
783
4,78
310
0%3,
468
Nko
maz
i3,
524
(6)
3,51
83,
518
--
3,51
83,
518
100%
2,39
5Pi
xley
ka S
eme
1,44
831
91,
767
1,76
7-
-1,
767
1,76
710
0%1,
248
Stev
e Ts
hwet
e7,
556
(2,6
31)
4,92
54,
925
--
4,92
54,
925
100%
7,05
6Th
aba
Chw
eu5,
000
(370
)4,
630
4,63
0-
-4,
630
4,63
010
0%3,
995
Them
bisil
e1,
100
(1,1
00)
--
--
--
100%
289
Umjin
di
1,71
0(2
)1,
708
1,70
8-
-1,
708
1,70
810
0%15
4V
icto
r Kha
nye
2,90
0(1
,254
)1,
646
1,64
6-
-1,
646
1,64
610
0%1,
973
TOTA
L76
,870
--
76,8
7076
,870
--
76,8
7076
,870
73,9
63
Mpu
mal
anga
Pro
vinc
eDe
partm
ent o
f Pub
lic W
orks
, Roa
ds a
nd Tr
ansp
ort
Vote
8:
Ann
exur
es (U
naud
ited
Supp
lem
enta
ry S
ched
ules
) to
the
Ann
ual F
inan
cial
Sta
tem
ents
for t
he y
ear e
nded
31
Mar
ch 2
013
Annual Report 201213.indb 146 8/19/2013 7:57:05 AM

ANNUAL
147
AN
NEX
URE
1BST
ATE
MEN
T OF
TRA
NSF
ERS/
SUBS
IDIE
S TO
PUB
LIC
CO
RPO
RATIO
NS
AN
D PR
IVA
TE E
NTE
RPRI
SES
NA
ME
OF
PUBL
IC
CO
RPO
RATIO
N/P
RIVA
TE
ENTE
RPRI
SE
TRA
NSF
ER A
LLO
CA
TION
EXPE
NDI
TURE
2011
/12
Adj
uste
dA
ppro
pria
tion
Act
Roll
Ove
rs
A
djus
tmen
ts
To
tal
Ava
ilabl
e
Act
ual
Tran
sfer
% o
f A
vaila
ble
fund
s Tr
ansf
erre
d
C
apita
l
C
urre
ntA
ppro
-pr
iatio
n A
ctR’
000
R’00
0R’
000
R’00
0R’
000
%R’
000
R’00
0R’
000
Publ
ic C
orpo
ratio
ns
Subs
idie
s-
-50
650
650
610
0%-
--
Sub
Tota
l-
-50
650
650
610
0%-
--
Priv
ate
Ente
rpris
es
Subs
idie
s (Bu
ses)
457,
503
-6,
800
464,
303
464,
218
100%
--
437,
138
Sub
Tota
l45
7,50
3-
6,80
046
4,30
346
4,21
810
0%-
-43
7,13
8
TOTA
L45
7,50
3-
7,30
646
4,80
946
4,72
410
0%-
-43
7,13
8
Mpu
mal
anga
Pro
vinc
eDe
partm
ent o
f Pub
lic W
orks
, Roa
ds a
nd Tr
ansp
ort
Vote
8:
Ann
exur
es (U
naud
ited
Supp
lem
enta
ry S
ched
ules
) to
the
Ann
ual F
inan
cial
Sta
tem
ents
for t
he y
ear e
nded
31
Mar
ch 2
013
Annual Report 201213.indb 147 8/19/2013 7:57:05 AM

ANNUAL
148
AN
NEX
URE
1CST
ATE
MEN
T OF
TRA
NSF
ERS
TO H
OUS
EHO
LDS
HOUS
EHO
LDS
TRA
NSF
ER A
LLO
CA
TION
EXPE
NDI
TURE
2011
/12
Adj
uste
dA
ppro
pria
tion
Act
Ro
ll O
vers
A
djus
t-m
ents
To
tal
Ava
ilabl
e
Act
ual
Tran
sfer
% o
f A
vaila
ble
fund
s Tr
ansf
erre
dA
ppro
-pria
tion
Act
R’00
0R’
000
R’00
0R’
000
R’00
0%
R’00
0Tr
ansf
ers
Soci
al B
enef
it2,
380
-1,
317
3,69
74,
952
134%
2,18
0C
laim
s ag
ains
t th
e st
ate
8,23
7-
(3,9
00)
4,33
72,
277
53%
8,01
3
Refu
nd: A
ct o
f Gra
ce-
--
--
-20
Burs
arie
s-
--
-50
5-
5,74
7
TOTA
L10
,617
-(2
,583
)8,
034
7,73
415
,960
Mpu
mal
anga
Pro
vinc
eDe
partm
ent o
f Pub
lic W
orks
, Roa
ds a
nd Tr
ansp
ort
Vote
8:
Ann
exur
es (U
naud
ited
Supp
lem
enta
ry S
ched
ules
) to
the
Ann
ual F
inan
cial
Sta
tem
ents
for t
he y
ear e
nded
31
Mar
ch 2
013
Annual Report 201213.indb 148 8/19/2013 7:57:06 AM

ANNUAL
149
AN
NEX
URE
1DST
ATE
MEN
T OF
GIF
TS, D
ON
ATIO
NS
AN
D SP
ON
SORS
HIPS
REC
EIVE
D
NA
ME
OF
ORG
AN
ISA
TION
NA
TURE
OF
GIF
T, DO
NA
TION
OR
SPO
NSO
RSHI
P
2012
/13
2011
/12
R’00
0R’
000
Mon
de
Con
sulti
ng E
ngin
eers
Don
atio
n fo
r Dep
artm
enta
l Yea
r End
Fun
ctio
n20
Moh
alab
e M
tong
a C
onsu
lting
Don
atio
n fo
r Dep
artm
enta
l Yea
r End
Fun
ctio
n5
Qua
l Con
sulti
ng Q
SD
onat
ion
for D
epar
tmen
tal Y
ear E
nd F
unct
ion
2Ba
loyi
Qua
ntity
Sur
veys
Don
atio
n fo
r Dep
artm
enta
l Yea
r End
Fun
ctio
n5
MD
P Pl
anne
rsD
onat
ion
for D
epar
tmen
tal Y
ear E
nd F
unct
ion
2N
tsha
ngal
ala
Busin
ess E
nter
prise
Don
atio
n fo
r Dep
artm
enta
l Yea
r End
Fun
ctio
n5
DN
Nya
thi
Don
atio
n fo
r Dep
artm
enta
l Yea
r End
Fun
ctio
n10
Cha
uke
Qua
ntity
Sur
veys
Don
atio
n fo
r Dep
artm
enta
l Yea
r End
Fun
ctio
n5
Lidw
ala
Con
sulti
ng E
ngin
eers
Don
atio
n fo
r Dep
artm
enta
l Yea
r End
Fun
ctio
n10
BCE
Don
atio
n fo
r Dep
artm
enta
l Yea
r End
Fun
ctio
n20
Low
veld
Tra
vel A
genc
yD
onat
ion
for D
epar
tmen
tal Y
ear E
nd F
unct
ion
40FT
Con
sulti
ngD
onat
ion
for D
epar
tmen
tal Y
ear E
nd F
unct
ion
40M
eond
o Tr
adin
g 33
3D
onat
ion
for D
epar
tmen
tal Y
ear E
nd F
unct
ion
40Yo
ur T
rad
e 62
ccD
onat
ion
for D
epar
tmen
tal Y
ear E
nd F
unct
ion
52A
lkar
aD
epar
tmen
t hos
ting
Gia
ma
Tech
nica
l Com
mitt
ee2
KwaM
hlab
a C
onne
ctD
epar
tmen
t hos
ting
Gia
ma
Tech
nica
l Com
mitt
ee2
Mic
rozo
ne M
ashi
nini
Prop
erty
Man
agem
ent s
taff
mee
ting
with
Dist
rict o
ffice
s3
Ven
usPr
oper
ty M
anag
emen
t sta
ff m
eetin
g w
ith D
istric
t offi
ces
2Bo
etie
Tills
Publ
ic In
frast
ruct
ure
Sum
mit
5Bu
scor
Publ
ic In
frast
ruct
ure
Sum
mit
40C
lear
Cho
ice
Build
erPu
blic
Infra
stru
ctur
e Su
mm
it5
Nxu
mal
o D
e Jo
gger
ARC
Publ
ic In
frast
ruct
ure
Sum
mit
50
Mpu
mal
anga
Pro
vinc
eDe
partm
ent o
f Pub
lic W
orks
, Roa
ds a
nd Tr
ansp
ort
Vote
8:
Ann
exur
es (U
naud
ited
Supp
lem
enta
ry S
ched
ules
) to
the
Ann
ual F
inan
cial
Sta
tem
ents
for t
he y
ear e
nded
31
Mar
ch 2
013
Annual Report 201213.indb 149 8/19/2013 7:57:06 AM

ANNUAL
150
AN
NEX
URE
1D (C
ontin
ues)
NA
ME
OF
ORG
AN
ISA
TION
NA
TURE
OF
GIF
T, DO
NA
TION
OR
SPO
NSO
RSHI
P
2012
/13
2011
/12
R’00
0R’
000
Gub
evu
MPu
blic
Infra
stru
ctur
e Su
mm
it5
Thus
ang
Proj
ects
DPu
blic
Infra
stru
ctur
e Su
mm
it1
Moz
ma
Publ
ic In
frast
ruct
ure
Sum
mit
5Kl
us C
ivil
Publ
ic In
frast
ruct
ure
Sum
mit
2Ha
rdst
one
Mth
ethw
aPu
blic
Infra
stru
ctur
e Su
mm
it10
Bob
Chi
day
aPu
blic
Infra
stru
ctur
e Su
mm
it15
KwaM
ahla
ba C
onne
ctPu
blic
Infra
stru
ctur
e Su
mm
it50
Qua
l Con
sulti
ng Q
SPu
blic
Infra
stru
ctur
e Su
mm
it5
Mot
eko
Con
sulta
nts
Publ
ic In
frast
ruct
ure
Sum
mit
12M
nolu
zi C
alib
reD
onat
ion
for D
epar
tmen
tal Y
ear E
nd F
unct
ion
10D
avid
Sek
gobe
la A
ssoc
iate
sD
onat
ion
for D
epar
tmen
tal Y
ear E
nd F
unct
ion
20G
reat
Nor
th T
rans
port
Don
atio
n fo
r Dep
artm
enta
l Yea
r End
Fun
ctio
n50
Mot
eko
Con
sulta
nts
Don
atio
n fo
r Dep
artm
enta
l Yea
r End
Fun
ctio
n88
Mut
eo C
onsu
ltant
sD
onat
ion
for D
epar
tmen
tal Y
ear E
nd F
unct
ion
40In
hlak
anip
ho C
onsu
ltant
sD
onat
ion
for D
epar
tmen
tal Y
ear E
nd F
unct
ion
10Xi
luva
Xa
Min
a Pr
ojec
tsD
onat
ion
for D
epar
tmen
tal Y
ear E
nd F
unct
ion
70Su
b To
tal
493
265
Rece
ived
in K
ind
Alk
ara
Dep
artm
ent h
ostin
g G
iam
a Te
chni
cal C
omm
ittee
2Kw
aMhl
aba
Con
nect
Dep
artm
ent h
ostin
g G
iam
a Te
chni
cal C
omm
ittee
2M
icro
zone
Mas
hini
niPr
oper
ty M
anag
emen
t sta
ff m
eetin
g w
ith D
istric
t offi
ces
3V
enus
Prop
erty
Man
agem
ent s
taff
mee
ting
with
Dist
rict o
ffice
s2
Mpu
mal
anga
Pro
vinc
eDe
partm
ent o
f Pub
lic W
orks
, Roa
ds a
nd Tr
ansp
ort
Vote
8:
Ann
exur
es (U
naud
ited
Supp
lem
enta
ry S
ched
ules
) to
the
Ann
ual F
inan
cial
Sta
tem
ents
for t
he y
ear e
nded
31
Mar
ch 2
013
Annual Report 201213.indb 150 8/19/2013 7:57:06 AM

ANNUAL
151
AN
NEX
URE
1D (C
ontin
ues)
NA
ME
OF
ORG
AN
ISA
TION
NA
TURE
OF
GIF
T, DO
NA
TION
OR
SPO
NSO
RSHI
P
2012
/13
2011
/12
R’00
0R’
000
Your
Tra
de
Ms B
Zw
edal
fare
wel
l fun
ctio
n5
Holid
ay H
ouse
kee
ping
Ms B
Zw
edal
fare
wel
l fun
ctio
n1
Pica
zM
and
ela
Day
20Sp
ectru
m L
avet
Bre
eze
Man
del
a D
ay8
Belro
ch C
onst
ruct
ion
Man
del
a D
ay7
Mor
dec
aiM
and
ela
Day
5Le
tsho
lo &
Son
s Con
stru
ctio
n cc
Man
del
a D
ay5
Nom
aziy
ane’
s Con
stru
ctio
nM
and
ela
Day
5Ta
man
e In
vest
men
ts c
cM
and
ela
Day
3Pu
nctu
al T
rad
ing
Man
del
a D
ay2
JS S
ilind
aM
and
ela
Day
2N
omgc
ibel
o Tr
ansp
ort
Man
del
a D
ay1
Ezik
a Pa
ul C
onst
ruct
ion
Man
del
a D
ay1
Aze
mbe
leni
Tra
din
g &
Pro
ject
cc
Man
del
a D
ay1
Yaqu
ba C
onst
ruct
ion
& P
roje
ctM
and
ela
Day
1LG
M tr
ansp
ort
Man
del
a D
ay1
Thad
ia C
onst
ruct
ion
Man
del
a D
ay1
Lizzy
’s T
rans
port
and
Civ
il Con
tract
Man
del
a D
ay1
Mom
otho
’s P
roje
ctM
and
ela
Day
1M
MLe
s Bus
ines
sM
and
ela
Day
1P.
S C
onst
ruct
ion
Man
del
a D
ay1
Rum
amin
aM
and
ela
Day
1Sh
irind
i and
son
Man
del
a D
ay1
Abo
mnd
eni c
onst
ruct
ion
Man
del
a D
ay1
Mpe
mec
ivia
lsM
and
ela
Day
1
Mpu
mal
anga
Pro
vinc
eDe
partm
ent o
f Pub
lic W
orks
, Roa
ds a
nd Tr
ansp
ort
Vote
8:
Ann
exur
es (U
naud
ited
Supp
lem
enta
ry S
ched
ules
) to
the
Ann
ual F
inan
cial
Sta
tem
ents
for t
he y
ear e
nded
31
Mar
ch 2
013
Annual Report 201213.indb 151 8/19/2013 7:57:06 AM

ANNUAL
152
AN
NEX
URE
1D (C
ontin
ues)
NA
ME
OF
ORG
AN
ISA
TION
NA
TURE
OF
GIF
T, DO
NA
TION
OR
SPO
NSO
RSHI
P
2012
/13
2011
/12
R’00
0R’
000
Mpf
umel
elo
busin
ess E
nter
prise
Man
del
a D
ay15
Mke
v’s T
rad
ing
Man
del
a D
ay6
Mad
odo’
sM
and
ela
Day
5V
ulam
and
laM
and
ela
Day
5Si
hlan
gu C
onst
ruct
ion
and
Dev
elop
men
tM
and
ela
Day
2N
tsha
ngal
ala
Busin
ess E
nter
prise
sM
and
ela
Day
11Lu
thi T
rad
ing
Man
del
a D
ay9
Mur
avha
bui
ldin
g an
d C
ivils
Man
del
a D
ay9
Mbo
phak
asith
ayi
Man
del
a D
ay6
Mlo
loM
and
ela
Day
20Eh
lanz
eni M
anag
emen
tM
and
ela
Day
10Eh
lanz
eni M
anag
emen
t and
staf
fM
and
ela
Day
26Sh
irdo
Trad
ing
Man
del
a D
ay10
Then
jwak
oM
and
ela
Day
15Pa
ul J
erry
Man
del
a D
ay5
Siya
zam
aM
and
ela
Day
5Su
zan
Mab
ilaM
and
ela
Day
12Q
ond
ile In
vest
men
tsM
and
ela
Day
15Ba
sad
iM
and
ela
Day
12A
mw
are
Man
del
a D
ay10
SASS
A a
nd P
WR&
TM
and
ela
Day
15Sh
amila
Tra
din
gM
and
ela
Day
8N
tsan
gala
la B
usin
ess E
nter
prise
Man
del
a D
ay20
Xaka
Bus
ines
s Ent
erpr
iseM
and
ela
Day
5
Mpu
mal
anga
Pro
vinc
eDe
partm
ent o
f Pub
lic W
orks
, Roa
ds a
nd Tr
ansp
ort
Vote
8:
Ann
exur
es (U
naud
ited
Supp
lem
enta
ry S
ched
ules
) to
the
Ann
ual F
inan
cial
Sta
tem
ents
for t
he y
ear e
nded
31
Mar
ch 2
013
Annual Report 201213.indb 152 8/19/2013 7:57:06 AM

ANNUAL
153
AN
NEX
URE
1D (C
ontin
ues)
NA
ME
OF
ORG
AN
ISA
TION
NA
TURE
OF
GIF
T, DO
NA
TION
OR
SPO
NSO
RSHI
P
2012
/13
2011
/12
R’00
0R’
000
Mpa
ndos
e Tr
adin
gM
and
ela
Day
24M
ungo
ni T
rad
ing
Man
del
a D
ay12
Spea
rhea
dM
and
ela
Day
12Lw
akiti
Tra
din
gM
and
ela
Day
3Su
ssia
n Bu
sines
s Ent
erpr
iseM
and
ela
Day
17A
OS
cons
ultin
gM
and
ela
Day
6Ri
simat
i Ele
ctric
al a
nd m
echa
nica
lM
and
ela
Day
3M
orei
QS
Man
del
a D
ay5
ASL
Arc
hite
cts
Man
del
a D
ay15
Build
ing
Con
stru
ctio
nM
and
ela
Day
7Sh
umm
ang
Civ
il Con
stru
ctio
nM
and
ela
Day
3M
anag
er’s
of B
ohla
bela
Dist
rict
Man
del
a D
ay6
Sub
Tota
l44
69
GRA
ND
TOTA
L93
927
4
Mpu
mal
anga
Pro
vinc
eDe
partm
ent o
f Pub
lic W
orks
, Roa
ds a
nd Tr
ansp
ort
Vote
8:
Ann
exur
es (U
naud
ited
Supp
lem
enta
ry S
ched
ules
) to
the
Ann
ual F
inan
cial
Sta
tem
ents
for t
he y
ear e
nded
31
Mar
ch 2
013
Annual Report 201213.indb 153 8/19/2013 7:57:06 AM

ANNUAL
154
AN
NEX
URE
2AST
ATE
MEN
T OF
FIN
AN
CIA
L G
UARA
NTE
ES IS
SUED
AS
AT 3
1 M
ARC
H 20
13
GUA
RAN
TOR
INST
ITUTIO
NG
UARA
NTE
E IN
RE
SPEC
T OF
Orig
inal
gu
aran
teed
ca
pita
l am
ount
Ope
ning
ba
lanc
e 1
Apr
il 20
12
Gua
rant
ees
draw
dow
nsdu
ring
the
year
Gua
rant
ees
rele
ased
dur
ing
the
year
Reva
luat
ions
Clo
sing
bala
nce
31 M
arch
201
3
Gua
rant
eed
inte
rest
for
year
end
ed 3
1 M
arch
201
3
Real
ised
loss
es n
ot
reco
vera
ble
i.e.
clai
ms
paid
out
R’00
0R’
000
R’00
0R’
000
R’00
0R’
000
R’00
0R’
000
Stan
dar
d B
ank
Hous
ing
-90
6-
73-
833
--
Ned
bank
Lim
ited
Hous
ing
-19
0-
10-
180
--
Firs
trand
Ban
kHo
usin
g-
671
--
-67
1-
-N
edba
nkHo
usin
g-
75-
--
75-
-A
BSA
Hous
ing
-49
3-
21-
472
--
Com
pany
Un
ique
Fin
ance
(P
ty)L
td
Hous
ing
-63
--
-63
--
Old
Mut
ual
Limite
dHo
usin
g-
84-
--
84-
-
Peop
les B
ank
Hous
ing
-27
4-
--
274
--
Peop
les B
ank
Ltd
Hous
ing
-68
-14
-54
--
Firs
t-Ran
d B
ank
Ltd
Hous
ing
-22
2-
--
222
--
Old
Mut
ual
Bank
Div
of
Ned
bank
Hous
ing
-45
0-
--
450
--
VBS
Mut
ual
Bank
Hous
ing
-46
--
-46
--
Mpu
mal
anga
Ho
usin
g Fi
nanc
e
Hous
ing
-31
9-
--
319
--
Nor
then
Pr
ovin
ce
Dev
elop
men
t C
o.
Hous
ing
-15
5-
--
155
--
TOTA
L-
4,01
6-
(118
)-
3,89
8-
-
Mpu
mal
anga
Pro
vinc
eDe
partm
ent o
f Pub
lic W
orks
, Roa
ds a
nd Tr
ansp
ort
Vote
8:
Ann
exur
es (U
naud
ited
Supp
lem
enta
ry S
ched
ules
) to
the
Ann
ual F
inan
cial
Sta
tem
ents
for t
he y
ear e
nded
31
Mar
ch 2
013
Annual Report 201213.indb 154 8/19/2013 7:57:07 AM
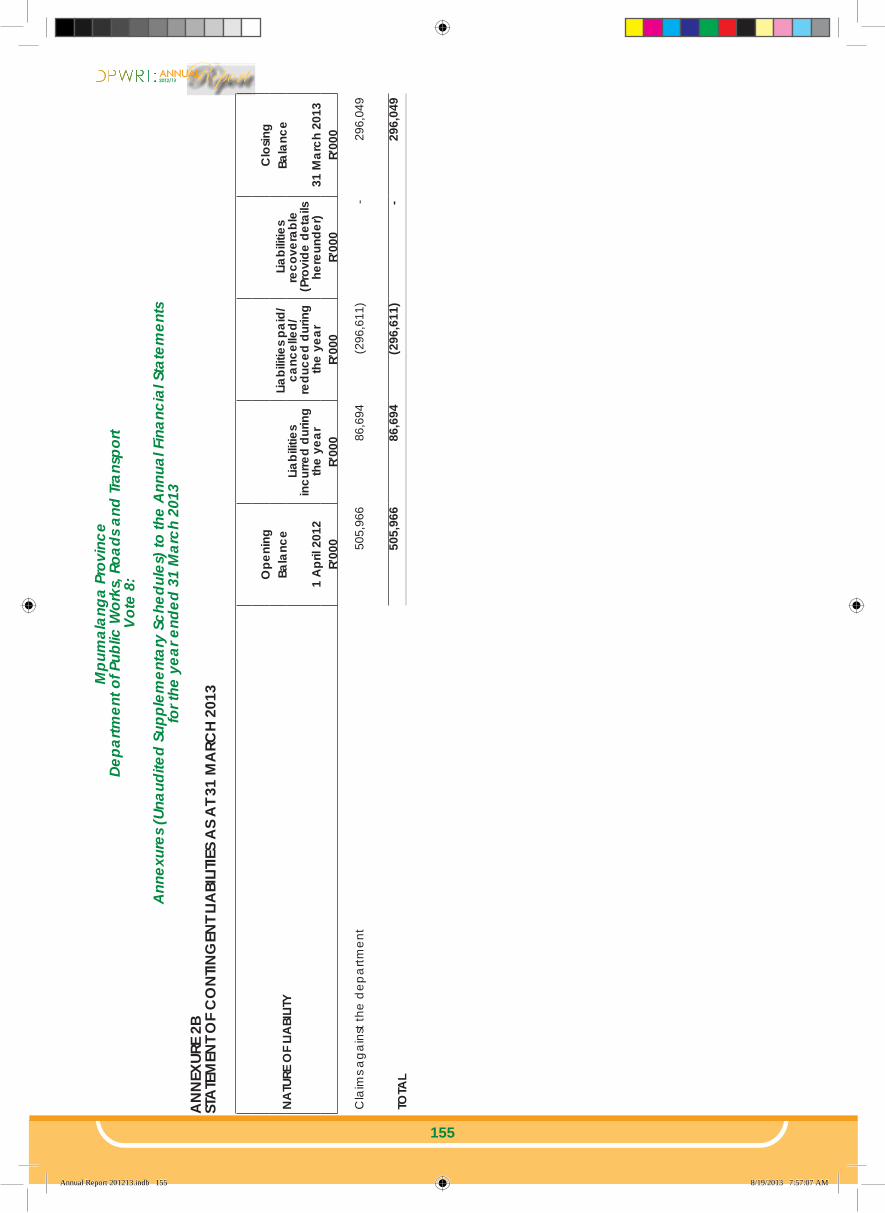
ANNUAL
155
AN
NEX
URE
2BST
ATE
MEN
T OF
CO
NTIN
GEN
T LIA
BILI
TIES
AS
AT 3
1 M
ARC
H 20
13
NA
TURE
OF
LIA
BILI
TY
Liabi
litie
s in
curre
d du
ring
the
year
Liabi
litie
s pa
id/
canc
elle
d/re
duce
d du
ring
the
year
Liabi
litie
s re
cove
rabl
e (P
rovi
de d
etai
ls he
reun
der)
O
peni
ngC
losin
gBa
lanc
eBa
lanc
e
1 A
pril
2012
31 M
arch
201
3R’
000
R’00
0R’
000
R’00
0R’
000
Cla
ims a
gain
st th
e d
epar
tmen
t 5
05,9
6686
,694
(296
,611
)-
296,
049
TOTA
L 5
05,9
6686
,694
(296
,611
)-
296,
049
Mpu
mal
anga
Pro
vinc
eDe
partm
ent o
f Pub
lic W
orks
, Roa
ds a
nd Tr
ansp
ort
Vote
8:
Ann
exur
es (U
naud
ited
Supp
lem
enta
ry S
ched
ules
) to
the
Ann
ual F
inan
cial
Sta
tem
ents
for t
he y
ear e
nded
31
Mar
ch 2
013
Annual Report 201213.indb 155 8/19/2013 7:57:07 AM

ANNUAL
156
AN
NEX
URE
3C
LAIM
S RE
CO
VERA
BLE
GO
VERN
MEN
T EN
TITY
Con
firm
ed b
alan
ce o
utst
andi
ngUn
conf
irmed
bal
ance
out
stan
ding
Tota
l31
/03/
2013
31/0
3/20
1231
/03/
2013
31/0
3/20
1231
/03/
2013
31/0
3/20
12R’
000
R’00
0R’
000
R’00
0R’
000
R’00
0De
partm
ent
Agr
icul
ture
and
Lan
d A
dm
inist
ratio
n-
-1,
014
160
1,01
416
0D
epar
tmen
t of H
ealth
and
Soc
ial S
ervi
ces
--
-14
-14
Dep
artm
ent o
f Jus
tice
--
-6
-6
Safe
ty a
nd S
ecur
ity( M
pum
alan
ga)
--
2,06
030
2,07
230
Econ
omic
Dev
elop
men
t1,
790
--
2,06
41,
790
2,06
4Ed
ucat
ion
987
--
1,47
798
71,
477
Fina
nce
--
-43
2-
432
Hom
e A
ffairs
--
-12
-12
Hum
an S
ettle
men
t77
--
1377
13La
bour
--
15-
15La
nd A
ffairs
/ Ru
ral D
evel
opm
ent a
nd L
and
Re
form
--
-6
-6
Coo
pera
tive
Gov
ernm
ent a
nd T
rad
ition
al A
ffairs
--
452
4745
247
Mpu
mal
anga
Pro
v Le
gisla
ture
-18
--
18G
aute
ng D
epar
tmen
t of P
ublic
Wor
ks-
--
40-
40He
alth
(Mpu
mal
anga
)-
-61
2-
612
-Pu
blic
Wor
ks (L
impo
po P
rovi
nce)
--
-59
-59
Nat
iona
l Dep
t of p
ublic
wor
ks-
-11
2611
26So
cial
Dev
elop
men
t-
-21
514
621
514
6So
uth
Afri
can
Polic
e Se
rvic
e-
-50
2650
26C
ultu
re, S
port
and
Rec
reat
ion
--
647
111
647
111
Sub
Tota
l2,
854
185,
061
4,68
47,
915
4,70
2
Mpu
mal
anga
Pro
vinc
eDe
partm
ent o
f Pub
lic W
orks
, Roa
ds a
nd Tr
ansp
ort
Vote
8:
Ann
exur
es (U
naud
ited
Supp
lem
enta
ry S
ched
ules
) to
the
Ann
ual F
inan
cial
Sta
tem
ents
for t
he y
ear e
nded
31
Mar
ch 2
013
Annual Report 201213.indb 156 8/19/2013 7:57:07 AM

ANNUAL
157
AN
NEX
URE
3 (C
ontin
ues)
GO
VERN
MEN
T EN
TITY
Con
firm
ed b
alan
ce o
utst
andi
ngUn
conf
irmed
bal
ance
out
stan
ding
Tota
l31
/03/
2013
31/0
3/20
1231
/03/
2013
31/0
3/20
1231
/03/
2013
31/0
3/20
12R’
000
R’00
0R’
000
R’00
0R’
000
R’00
0O
ther
Gov
ernm
ent E
ntiti
es
Mpu
mal
anga
Tou
rism
and
Par
ks A
genc
y-
--
1-
1So
uth
Afri
can
Reve
nue
Serv
ices
--
-12
0-
120
DR
JS M
orok
a-
--
1-
1Bu
shbu
ckrid
ge m
unic
ipal
ity-
-76
7-
767
-Su
b To
tal
--
767
122
767
122
TOTA
L2,
854
185,
828
4,80
68,
682
4,82
4
Mpu
mal
anga
Pro
vinc
eDe
partm
ent o
f Pub
lic W
orks
, Roa
ds a
nd Tr
ansp
ort
Vote
8:
Ann
exur
es (U
naud
ited
Supp
lem
enta
ry S
ched
ules
) to
the
Ann
ual F
inan
cial
Sta
tem
ents
for t
he y
ear e
nded
31
Mar
ch 2
013
Annual Report 201213.indb 157 8/19/2013 7:57:07 AM

ANNUAL
158
AN
NEX
URE
4IN
TER-
GO
VERN
MEN
T PA
YABL
ES
GO
VERN
MEN
T EN
TITY
Con
firm
ed b
alan
ce o
utst
andi
ngUn
conf
irmed
bal
ance
out
stan
ding
TOTA
L31
/03/
2013
31/0
3/20
1231
/03/
2013
31/0
3/20
1231
/03/
2013
31/0
3/20
12R’
000
R’00
0R’
000
R’00
0R’
000
R’00
0DE
PART
MEN
TSC
urre
ntRT
MC
-46
0-
--
460
Co-
oper
ativ
e G
over
nanc
e &
Tra
diti
onal
Af-
fairs
--
-14
2-
142
Heal
th (M
pum
alan
ga)
--
-5
-5
Safe
ty S
ecur
ity a
nd L
iaiso
n-
51,7
7219
,977
-19
,977
51,7
72C
ultu
re, S
port
and
Rec
reat
ion
-16
--
-16
TOTA
L-
52,2
4819
,977
147
19,9
7752
,395
Mpu
mal
anga
Pro
vinc
eDe
partm
ent o
f Pub
lic W
orks
, Roa
ds a
nd Tr
ansp
ort
Vote
8:
Ann
exur
es (U
naud
ited
Supp
lem
enta
ry S
ched
ules
) to
the
Ann
ual F
inan
cial
Sta
tem
ents
for t
he y
ear e
nded
31
Mar
ch 2
013
Annual Report 201213.indb 158 8/19/2013 7:57:07 AM

ANNUAL
159
AN
NEX
URE
5IN
VEN
TORY
INVE
NTO
RYN
ote
Qua
ntity
2012
/13
Qua
ntity
2011
/12
R’00
0R’
000
Ope
ning
bal
ance
181,
290
14,2
4928
9,94
020
,280
Ad
d/(
Less
): A
dju
stm
ents
to p
rior y
ear b
alan
ce(1
,023
)(2
1)(7
01)
(1,5
28)
Ad
d:
Ad
diti
ons/
Purc
hase
s – C
ash
1,16
5,64
311
2,22
01,
323,
440
104,
105
Ad
d:
Ad
diti
ons -
Non
-cas
h23
,178
449
10,8
1725
2(L
ess)
: Disp
osal
s(2
6,31
2)(3
,979
)(6
0,49
3)(1
,331
)(L
ess)
: Iss
ues
(1,2
38,6
38)
(108
,505
)(1
,376
,145
)(2
01,9
68)
Ad
d/(
Less
): A
dju
stm
ents
(1,4
73)
(4,9
55)
(5,5
68)
94,4
39
CLO
SIN
G B
ALA
NC
E10
2,66
59,
458
181,
290
14,2
49
Mpu
mal
anga
Pro
vinc
eDe
partm
ent o
f Pub
lic W
orks
, Roa
ds a
nd Tr
ansp
ort
Vote
8:
Ann
exur
es (U
naud
ited
Supp
lem
enta
ry S
ched
ules
) to
the
Ann
ual F
inan
cial
Sta
tem
ents
for t
he y
ear e
nded
31
Mar
ch 2
013
Annual Report 201213.indb 159 8/19/2013 7:57:07 AM

ANNUAL
160
AN
NEX
URE
6M
OVE
MEN
T IN
CA
PITA
L W
ORK
IN P
ROG
RESS
MO
VEM
ENT I
N C
API
TAL
WO
RK IN
PRO
GRE
SS F
OR
THE
YEA
R EN
DED
31 M
ARC
H 20
13O
peni
ng b
alan
ceC
urre
nt Y
ear C
apita
l W
IPC
ompl
eted
Ass
ets
Clo
sing
bala
nce
R’00
0R’
000
R’00
0R’
000
BUIL
DIN
GS
AN
D O
THER
FIX
ED S
TRUC
TURE
S 9
71,3
80 9
17,9
35(6
23,1
00)
1,2
66,2
15O
ther
fixe
d st
ruct
ures
971
,380
917
,935
(623
,100
) 1
,266
,215
TOTA
L 9
71,3
80 9
17,9
35(6
23,1
00)
1,26
6,21
5
Mpu
mal
anga
Pro
vinc
eDe
partm
ent o
f Pub
lic W
orks
, Roa
ds a
nd Tr
ansp
ort
Vote
8:
Ann
exur
es (U
naud
ited
Supp
lem
enta
ry S
ched
ules
) to
the
Ann
ual F
inan
cial
Sta
tem
ents
for t
he y
ear e
nded
31
Mar
ch 2
013
Annual Report 201213.indb 160 8/19/2013 7:57:07 AM

ANNUAL
161
Notes:_________________________________________________________________________________
_______________________________________________________________________________________________
_______________________________________________________________________________________________
_______________________________________________________________________________________________
_______________________________________________________________________________________________
_______________________________________________________________________________________________
_______________________________________________________________________________________________
_______________________________________________________________________________________________
_______________________________________________________________________________________________
_______________________________________________________________________________________________
_______________________________________________________________________________________________
_______________________________________________________________________________________________
_______________________________________________________________________________________________
_______________________________________________________________________________________________
_______________________________________________________________________________________________
_______________________________________________________________________________________________
_______________________________________________________________________________________________
_______________________________________________________________________________________________
_______________________________________________________________________________________________
_______________________________________________________________________________________________
_______________________________________________________________________________________________
_______________________________________________________________________________________________
_______________________________________________________________________________________________
_______________________________________________________________________________________________
_______________________________________________________________________________________________
_______________________________________________________________________________________________
_______________________________________________________________________________________________
_______________________________________________________________________________________________
_______________________________________________________________________________________________
_______________________________________________________________________________________________
_______________________________________________________________________________________________
Annual Report 201213.indb 161 8/19/2013 7:57:07 AM

ANNUAL
162
Notes:_________________________________________________________________________________
_______________________________________________________________________________________________
_______________________________________________________________________________________________
_______________________________________________________________________________________________
_______________________________________________________________________________________________
_______________________________________________________________________________________________
_______________________________________________________________________________________________
_______________________________________________________________________________________________
_______________________________________________________________________________________________
_______________________________________________________________________________________________
_______________________________________________________________________________________________
_______________________________________________________________________________________________
_______________________________________________________________________________________________
_______________________________________________________________________________________________
_______________________________________________________________________________________________
_______________________________________________________________________________________________
_______________________________________________________________________________________________
_______________________________________________________________________________________________
_______________________________________________________________________________________________
_______________________________________________________________________________________________
_______________________________________________________________________________________________
_______________________________________________________________________________________________
_______________________________________________________________________________________________
_______________________________________________________________________________________________
_______________________________________________________________________________________________
_______________________________________________________________________________________________
_______________________________________________________________________________________________
_______________________________________________________________________________________________
_______________________________________________________________________________________________
_______________________________________________________________________________________________
_______________________________________________________________________________________________
Annual Report 201213.indb 162 8/19/2013 7:57:08 AM