providing vanet security through active position detectionmweigle/courses/cs795-s08/papers/y… ·...
TRANSCRIPT
Providing VANET Security
Through Active Position Detection
Gongjun Yan, Stephan Olariu, Michele C. Weigle
Department of Computer Science, Old Dominion University, Norfolk, VA23529-0162, USA
Abstract
Vehicle position is one of the most valuable pieces of information in a Vehicular Ad-hoc NETwork (VANET). The main contribution of this work is a novel approachto enhancing position security in VANETs. We achieve local security by enlistingthe help of on-board radar to detect neighboring vehicles and to confirm their an-nounced coordinates. Local security is extended to achieve global security by usingpreset position-based groups to create a communication network and by using a dy-namic challenging mechanism to confirm remote position information. Our solutionis predicated on the widely accepted assumption that the vast majority of vehiclesare honest and behave responsively. Extensive simulations confirm the quality ofthe proposed solution by measuring how fast compromised vehicles can be detectedunder various conditions.
Key words: security, position, Sybil attack, radar, GPS, VANET
1 Introduction
The past decade has witnessed the emergence of Vehicular Ad-hoc Networks(VANETs), specializing the well-known Mobile Ad Hoc Networks (MANETs)to Vehicle-to-Vehicle and Vehicle-to-Roadside wireless communications. Theimportance and potential societal impact of VANETs has been confirmed bythe rapid proliferation of consortia involving car manufacturers, governmentagencies and academia. Examples include the Car-2-Car Communication Con-sortium [1], the Vehicle Safety Communications Consortium [2], and Honda’s
Email address: (ygongjun, olariu, mweigle)@cs.odu.edu (Gongjun Yan,Stephan Olariu, Michele C. Weigle).
URL: www.cs.odu.edu/∼(ygongjun, olariu, mweigle) (Gongjun Yan,Stephan Olariu, Michele C. Weigle).
Preprint submitted to Elsevier 29 December 2007
Advanced Safety Vehicle Program [3], among others. While the original moti-vation for VANETs was to promote traffic safety, more recently privacy andsecurity concerns have received much attention in the literature [4,5]. In ad-dition, it is increasingly obvious that VANETs open new vistas for Internetaccess, distributed gaming, and the fast-growing mobile entertainment indus-try.
The introduction of new vehicular devices can greatly enhance security inVANETs. Indeed, the provision of on-board Global Positioning System (GPS)devices has revolutionized driving. Similarly, the recent introduction of short-range radar on some top-of-the-line models promises to reduce the number offender-benders and other accidents. Interestingly, on-board radar is also usedin advanced cruise control systems [6]. It is natural, therefore, to enlist the helpof these devices for the purpose of enhancing the security of the informationflow in VANETs. A classic example of “anti-social” behavior in VANETs is formalicious cars to fake their true positions. Our main contribution is to showthat by using GPS and radar-provided information, one can ensure the validityof position information in a VANET and can detect and isolate malicious cars.
Although all VANET applications require some form of security, we dividethem into two categories: (1) Non-position related applications, such as onlinepayment services, online shopping, and the like; these applications focus onnetwork access, for example from an ad hoc wireless network to the Internet.(2) Position-related applications: including traffic condition reports, collisionavoidance, emergency alert, cooperative driving, or resource availability. Thekey ingredient in this category is accurate position information. If positioninformation is not protected, these applications may not work at all.
Since position information is very important, adversaries, such as prankstersand malicious attackers, could harm the VANET by perpetrating the followingattacks [7,8,9,10,5,11,12]:
• Dropping packets : In the presence of an accident, an attacker may drop allof the alerts to prevent appropriate deceleration alerts from reaching othervehicles.
• Modifying existing packets or inserting bogus packets : A prankster may cre-ate the illusion of a traffic jam before selecting an alternate route to hisadvantage.
• Replaying packets : A malicious user may pretend to be at a fake positionto create the illusion of an actual vehicle.
Another well-known attack is the Sybil attack [7] which is launched by forg-ing multiple identities. These false identities will give the illusion that thereare additional vehicles on the roadway, which may have a serious effect on aVANET. For example, a collision warning application given fake vehicle po-
2

sitions may be tricked into thinking that an accident is imminent, promptingthe driver to brake quickly, possibly causing a real accident.
In this paper, we propose a novel solution to prevent most of these attacks.This work was motivated by the need to provide secure topology informationin VANETs and to build a secure network for applications, such as a con-gestion alert system. Underlying our solution is the famous adage: “Seeing isbelieving”. We use on-board radar as the virtual “eye” of a vehicle. Althoughthe “eyesight” is limited due to a modest radar transmission range, a vehiclecan “see” surrounding vehicles and “hear” reports of their GPS coordinates.By comparing what is seen to what has been heard, a vehicle can corroboratethe real position of neighbors and isolate malicious vehicles to achieve localsecurity. We expect the on-board radar device to provide useful corroborationof reported location information, except for during short transient periods. Forexample, the line-of-sight that radar needs may be temporarily obstructed bya large truck. Due to the dynamic nature of traffic, even if there are transientobstructions, the line of sight will be restored eventually.
We use preset position-based cells as a basis for our approach. Each vehiclein the cell can directly communicate with every other vehicle in the cell. Toachieve local security, a vehicle may use its radar to verify its neighbors’ po-sitions or issue queries to verify the position of a specified vehicle in the cell.In this way, each vehicle in the cell knows the position of the other vehicles inthe cell with high certainty.
Because the on-board radar is not strong enough to verify vehicles in remotecells, we propose a method to challenge and confirm the position of a vehiclein a remote cell by using the on-board radar in oncoming traffic. Once remotedata has been verified, each vehicle has three types of data in hand: localradar-detected data, remote radar-detected data from oncoming traffic, andagreed-upon data from cell neighbors. To achieve global security, we applycosine similarity [13] to these three types of data. If the similarity value isbeyond a threshold, we accept the data, otherwise it is ignored. With theseaccepted data, we can construct a history of vehicle movement. The movementhistory can help determine whether newly received data is valid or not. Weisolate the vehicles that send invalid data. This isolation can help to preventa large number of position-related attacks (forging positions), Sybil attacks(forging identities), and most combinations of position and Sybil attacks.
The remainder of this paper is organized as follows. In Section 2, we provide areview of related work on position security in VANETs. We present our systemmodel in Section 3, describe how local security can be achieved in Section 4,and discuss global security in Section 5. Section 6 describes how attacks canbe prevented. Section 7 presents our method to isolate malicious vehicles. InSection 8, we give an example of how our method can thwart an example
3

attack. Finally, in Section 9, we present the results of our evaluation study,focusing on how quickly malicious nodes can be detected.
2 Related Work
Previous work on position security and Sybil attacks can be divided into threecategories: cryptography-based, radio signal-based, and resource-based.
Cryptography-based methods ensure the reliability of the position and identi-ties claimed by vehicles through encryption. Most of the published work on po-sition security focuses on using Public Key Infrastructure (PKI) [14,15,11,16,17,18]and digital signatures [19,20,5,21,11]. While these solutions provide security,they add significant overhead to the system. The algorithms involved in en-crypting and decrypting the messages along with the issue of distributingpublic keys and their certificates makes the system complex. In this paper,we take a different approach. We allow vehicles to send the information inplain-text and depend upon receivers to verify the information.
Hubaux et al. [14] addressed a novel vehicle model, called the “smart vehicle”.Inspired by this smart vehicle model, we use a similar model. The smart vehicleis composed of an Event Data Recorder (EDR), a GPS receiver, a front-endradar for detecting obstacles at distances as far as 200 meters, an electroniclicense plate, a display and a computing platform. The authors focused onimproving security and privacy and sketched two solutions to these problemsby using PKI. As opposed to their approach, we focus on location security notgeneral message/data security.
Leinmuller et al. [10] proposed a method to secure position information byusing hard thresholds to detect false locations. Vehicles monitor data to verifythe reported position. If the reported position lies beyond a threshold, thelocation is determined to be false. If the number of nodes is larger than athreshold maximum number of nodes, the honest nodes know that there aresome fake nodes. Although the authors do not use any other devices or hard-ware, the accuracy and efficiency are difficult to guarantee. In addition, thismethod is not flexible because of uncertainties involved in VANETs.
Dai and Wu [22] proposed a hybrid mechanism to maintain the routing pathboth by proactive and reactive mechanisms. Though this proposal involves lowoverhead, there is no emphasis on securing the topology. Also, the topology-based routing algorithm is not as efficient as position-based routing for estab-lishing connectivity between vehicles [12].
Leinmuller et al. [9,12] describe the effect of false position information in
4
VANETs. The authors show that the effect of malicious nodes is more severein highway scenarios than in city scenarios. In their simulations, the deliveryratio decreases by 90% to 100% if malicious nodes simply drop messages.
Golle et al. [8] proposed a method to detect and correct malicious data. Thismethod is based on building a model for the VANETs against which the datacan be verified for consistency. Our approach, on the other hand, preventsmalicious data from entering the system. It thwarts any attempt to injectwrong information at the origin and such spurious messages do not propagatefurther.
Radio signal-based methods [23,24,25] determine false claimed positions basedon the received signal power. The basic idea of this method is that the distancebetween nodes can be computed from the received signal power. If there isa vehicle at a position which does not match the distance computed fromthe received radio power, this nodes is determined to be a fake. However, amalicious node can use the same method to compute the transmission signalpower to fool other nodes. Besides, radio may bounce off of vehicles and otherobstacles. Detection based on these bounced radio signals may not be accurate.
Resource-based methods test vehicles’ resources, such as radio resources [26,8],computational resources (vehicles failing to solve a puzzle are identified asfakes) [7], and identification resources (vehicles whose MAC and IP addressesare not recorded in a profile are identified as fakes) [27]. Newsome et al. [26]claimed that the method for detecting Sybil attacks proposed by Douceur [7]is not applicable to ad hoc networks and proposed other prevention methodsincluding: radio resource testing, registration, and position verification. Radioresource testing is based on the assumption that no device can send and re-ceive on more than one channel at a time. But, attackers may have multiplechannels. Registration does not apply to Sybil attacks, because the attackerscan simply create multiple identities. Besides, registration creates a privacyconcern. Position verification relies on roadside infrastructure, like base sta-tions. Piro et al. [27] records vehicles’ MAC and IP addresses, as a passiveID, to create a profile about neighbors. However, attackers may have multipledevices to defeat this method. Moreover, privacy is an issue if MAC and IPaddresses are recorded and tracked.
We incorporate the location-based group formation proposed by Raya et al.[15] to reduce the overhead of dynamically forming the groups. Each vehi-cle knows its location via GPS and can map the coordinates to determineits appropriate group. Simulation results in that paper proved that havinglocation-based groups are more efficient than using dynamic groups.
5
3 System Model
3.1 Vehicle Model
An important new concept in the automotive industry is neighborhood aware-ness. This allows a vehicle to know about the presence, location and even speedof neighboring vehicles. Today, new vehicles may have computer network de-vices, computing devices, storage devices, and an EDR. Specifically, vehiclesrepresented in this paper are assumed to be endowed with the following fea-tures:
• A GPS navigation system, including a GPS receiver and GPS maps.• A front and a rear radar [28,29], such as microwave front radar and a short-
distance infrared or ultrasonic radar. We assume that the omni-directionalfront radar can detect neighboring cars within line of sight in a radius of 200meters. Some cruise control systems already use this kind of radar. Althoughin some cases, the driver can visually confirm the objects detected by radar,our system does not require human interaction at all.
• A computer center, which will provide data processing, computing and stor-age.
• A wireless transceiver, using Dedicated Short Range Communications (DSRC)for fast communications; we assume that data can be changed here by at-tackers for position attacks.
• A unique ID, such as an electronic license plate [14], which is issued by aregistration authority annually. We assume that the ID can be changed bythe attacker to launch a Sybil attack, for example using a electronic licenseplate test unit to generate fake IDs.
• A virus checker. We will not discuss virus injection-based attacks.
We base our vehicle model on the smart vehicle proposed by Hubaux et al.[14]. Vehicles with some of these devices (GPS, radar) are already in produc-tion. For example, Toyota has developed a Pre-Crash Safety system [29] whichuses millimeter-wave radar to sense vehicles and obstacles on the road. Sen-sor Technologies and Systems developed forward looking vehicle radar [28],which can detect obstacles with a 170 meter range. In August 2006, legisla-tion [30] was passed under the recommendation from the National HighwayTraffic Safety Administration that by the year 2011, all automobile manufac-turers must openly disclose to the consumer the existence and use of EDRtechnology in their vehicles. As of October 2006, it has been estimated that64% of all vehicles sold in the United States have EDRs [31]. Furthermore,GPS and a computing center are popular vehicle accessories today. Since thesecomponents are already being installed in vehicles, there is no additional costrequired to deploy our position security techniques.
6
In accord with other works, we assume that the majority of cars (about 85%)are honest [32].
We use radar to detect the physical parameters of neighboring vehicles as afirst priority data resource, use the oncoming traffic radar to detect physicalparameters of non-neighboring vehicles as a second priority data resource anduse neighbors’ reports as the third priority data resource. We apply cosinesimilarity to these data to build a history of movements. Based on the historyof movements, we can screen forged data from the real data to solve mostof these attacks. Vehicles fall into one of three levels of trust: trusted, ques-tioned and untrusted. We use tables to classify each vehicle’s level of trust anduse these tables to isolate malicious vehicles. We simulate a position-relatedsolution which shows efficient results. Simulations for the Sybil attack andcombinations of Sybil attacks and position attacks are planned as our futurework.
3.2 Network Model
Network communication can be modeled as in a city scenario or a highwayscenario. We use a highway scenario since Leinmuller et al. [9,12] showed thatthe effects of malicious nodes in a highway scenario are worse than in a cityscenario.
3.2.1 Network Cells
There are two types of cells that have been proposed in the literature [15,16]:dynamic cells and position-based cells. Although dynamic cells are flexible,they are not efficient. Position-based cells, on the other hand, are createdbeforehand, and vehicles use their GPS coordinates to map to their respectivecells. These preset cells avoid the need to undergo the complex process offorming a cell and electing a cell leader. In this paper, we use position-basedcells to build a communication network. Cells are shown in Figure 1. Thecenter of a cell is at the median between the two directions of traffic.
Our network maintenance is hybrid comprising both proactive [22] and areactive [33,34] components. For intra-cell maintenance, vehicles proactivelybroadcast their GPS coordinates. The frequency of the broadcast, f , dependsupon the vehicle’s velocity (meters per second)
f = α ∗∣∣∣∣ν − νmax
2
∣∣∣∣ (1)
where f is the frequency (the number of broadcast packets per second), α is
7

Fig. 1. System model. Shadowed areas are the preset cells on digital maps. Vehiclescompare their GPS coordinates with these preset cells to identify their host cells.
a coefficient which is determined by the road characteristics(the number oflanes, the speed limit, etc.), ν is the current velocity of the vehicle, and νmax
is the maximum speed. If the vehicle velocity is high, the frequency is highbecause the position changes quickly and if the vehicle velocity is low, thefrequency is low because vehicles do not change position very much.
We only propagate packets in the direction towards the destination. There-fore we need to maintain a rough topology of remote vehicles. Triggered bythe events to be discussed in Section 4.1, the observer broadcasts a topologyrequest. Cells receiving this request, usually cell leaders as discussed in Section3.2.3, will send back topology packets which can be used by the observer tobuild a rough topology of the network cells.
3.2.2 Formation of Network Cells
We configure the road with virtual digital cells. For example, every 200 metersthere is a cell on the road, i.e., the cells’ radius is 100 meters. All vehiclesinside a cell can receive packets from each other directly. The diameter of cellsmatches the transmission range of radar, so that all the neighbors inside canbe directly detected by radar. The desired amount of overlap between twoadjacent cells must be determined before the cells are formed. The size ofoverlap depends on the size of cells and the road characteristics. If the sizeof the cells is very large, the overlap may be a small portion of the cells. Ifthe road is a highway, the overlap may be larger to contain more vehicles aspotential routers. In this paper, we use a highway model and assume that thecells have a 100 meter radius; therefore we select a cell overlap of about 20-30meters. When vehicles are close to the overlap area between two cells, they
8
may be chosen as routing vehicles as will be discussed in Section 3.2.4.
Service vendors first partition the digital map into cells, making sure theyoverlap and marking the coordinates of the cell center. Then each vehicledetermine its cell based on its GPS coordinates and on-board preset digitalmaps.
For example, the service vendor partitions a highway into cells. The seriesof cell center coordinates are (Xci, Y ci), 0 < i < n. The diameter is 200meters, and the overlap is 30 meters. A vehicle is at coordinate (xv, yv) on thehighway. The computer center in the vehicle will find the closest cell centercoordinates (Xck, Y ck) to the vehicle’s coordinates. If the coordinates satisfy(xv −Xck)
2 + (yv − Y ck)2 ≤ 1002, the vehicle is in cell k.
When a vehicle enters a new cell, it provides its unique ID to the cell leader tobecome a new member of the group. If there is no cell leader, the newcomertakes over as cell leader. Details of this process are discussed in the nextsection. As with entering, any cell member exiting the cell notifies the cellleader about its departure as soon as it enters the overlap region.
3.2.3 Cell Leader
The main duty of the cell leader is to verify the GPS position of all the ve-hicles in its cell, aggregate these positions [35,15] and broadcast this data toother vehicles in the cell. In this way, a remote vehicle can know the posi-tion of other vehicles in its cell. Based on the knowledge of the whole road,position-related applications, such as collision avoidance, cooperative driving,traffic optimization, and resource service, can be facilitated. The cell leadercollects the positions of other vehicles in its cell and exchanges this positioninformation with other cells.
For security reasons, the cell leader is monitored by its neighbors. When theleader sends and receives aggregated position packets, all the members in thecell will compare the positions in the packets based on their knowledge. By re-maining silent, they confirm that the packets have not been altered. Otherwise,they broadcast protest packets against the leader. The other neighbors will putthe leader and the protestor vehicle into the question table after receiving theprotest packet. Then, the opinion of the other neighbors is counted. If themajority of vehicles regard the leader as malicious, the record of the leader ismoved to the distrust table as will be discussed in Section 7. Otherwise, therecords sent by the leader are placed in trust table.
If a leader is determined to be malicious, or a leader moves away from thecenter of a cell, the leader can be challenged by another member of the cell. Avehicle challenging to become the new leader must meet one of the following
9

conditions: 1) be closest to cell center; 2) be approaching the cell leader. Con-dition 1 has precedence over condition 2. We can use the following formula tocompute the score s for each leader candidate,
s = Cdc ∗Dc + Cdi ∗Di (2)
where Dc is the distance to the cell center and Di is the traveling direction.If the vehicle is moving towards the center of the cell Di = 1, and if it ismoving away from the center Di = −1. We define Cdc = R
Dc+1and Cdi = R.
The candidate with highest score wins. In cases where the traffic is dense andthere is more than one vehicle with the same score, a simple binary countdownalgorithm can select the vehicle with highest ID. Referring back to Figure 1,vehicle A is a cell leader because it is closest to the center of the cell. Assumevehicle F with ID 15 and vehicle G with ID 13 are close the center of the celland both of them compete to be a cell leader. Based on binary countdown,vehicle F wins. Therefore vehicle F is determined to be the cell leader ofthat cell. This is similar to group leader determination described by Raya etal. [15], but Raya’s method determines a group leader based on the positiononly without discussing the situation where multiple vehicles challenge the cellleader at the same time. A newcomer or vehicle without honest map history(to be discussed in Section 6.5) will not be determined as a cell leader just as aperson without credit history can not obtain a loan. This will prevent attackersfrom changing their ID to become a cell leader using the Sybil attack. Thereis a possible case that an attacker may win a binary countdown, but usingrandom checks may be a solution, and we will study this in future work.Besides, the cell leader and cell router, described in the next section, may betargets for selective attack, which we will study in the future.
3.2.4 Cell Router
Once a cell leader is determined, it will use cell routers to transmit the ag-gregated packets. Cell routers achieve inter-cell communication in a securemanner. When a cell router is sending or receiving packets, its neighbors willmonitor the packets. If it modifies, inserts bogus information, or drops thepackets, its neighbors will detect this by comparing the packet from the routerand the original packet since the neighbors receive same packet as the routerdoes. If the neighbors detect that the router is compromised, they will isolatethe router in the same manner as cell leaders are isolated.
Determination of cell routers is similar to the determination of a cell leader.The difference is that two cell routers (upstream and downstream) will bedetermined instead of only one. Routers should be far from the center of thecell and close to the overlapping region. If more than one vehicle satisfiesthe criteria, a simple binary countdown algorithm can determine the vehicle
10
with highest ID. A newcomer or vehicle without good map history can not bedetermined as a cell router.
4 Local Security
Individual cells are the atomic entities that can be secured from most of theposition attacks described in this paper. A vehicle in a cell can verify the GPScoordinates received from any other member using radar when radar has lineof sight. If the broadcasted coordinates match radar findings, the message isaccepted, otherwise the coordinates are removed from the trust table. Thisway of verifying the position is local security.
Similar to the idea behind greedy algorithms, local security is the basis ofglobal security. In a greedy algorithm, we determine local optimal solutionsand combine them to get the optimal solution in the global region. In thispaper, we use radar to get local security and combine the local security invarious regions to get global security.
4.1 Active Position Detection
We can obtain the relative velocity, angle and position to the target objectfrom radar. There are two events that trigger radar detection. One is a timeoutthreshold. When an observer vehicle does not receive any packets from a ob-served vehicle after a certain amount of time, a timeout counter will increaseby one. If the timeout counter increases beyond a threshold, the observervehicle will transmit a radar signal to test the observed vehicle’s position. Al-ternatively, radar detection will be triggered at a random moment during theon-going communication with a vehicle. The rational for this latter strategy isto ensure that a trusted vehicle remains trustworthy. To summarize, we com-bine a proactive and a reactive corroboration using radar, resulting in activeposition detection.
4.2 Determining Position
4.2.1 Determining GPS Position
In GPS, when satellite radio signals are transmitted, they are distorted bythe troposphere and the ionosphere, therefore GPS coordinates have sometolerance. GPS data normally changes in the range of ∆x = ±10 meter;∆y = ±10 meter [36]. In Figure 2, we assume that ∆x and ∆y are always
11

equal, marked as ∆x = ∆y = ∆α. The shadowed region is the set of possiblereal vehicle positions. We can use (3) to describe this region. We use (x, y) torepresent the real position of vehicle in the GPS system.
(x− xgps)2 + (y − ygps)
2 ≤ (∆α)2 (3)
Fig. 2. GPS coordinates position. The GPS tolerance causes a set of real GPSposition, shown as a shadow.
4.2.2 Determining Radar-Detected Position
Radar also has tolerance, and we assume that the radar’s tolerance includestwo parts: angle tolerance 4θ and radius tolerance 4γ, marked as (4θ,4γ).In Figure 3, the shaded region bounded by HGQFEP is the set of possiblepositions of the detected vehicle. We use (x, y) to represent the real positionof vehicle and mark the radar readings as (θ, γ). We can use (6) and (7) todescribe the two circles: circle D and circle C in Figure 3.
α = θ −∆θ (4)
12
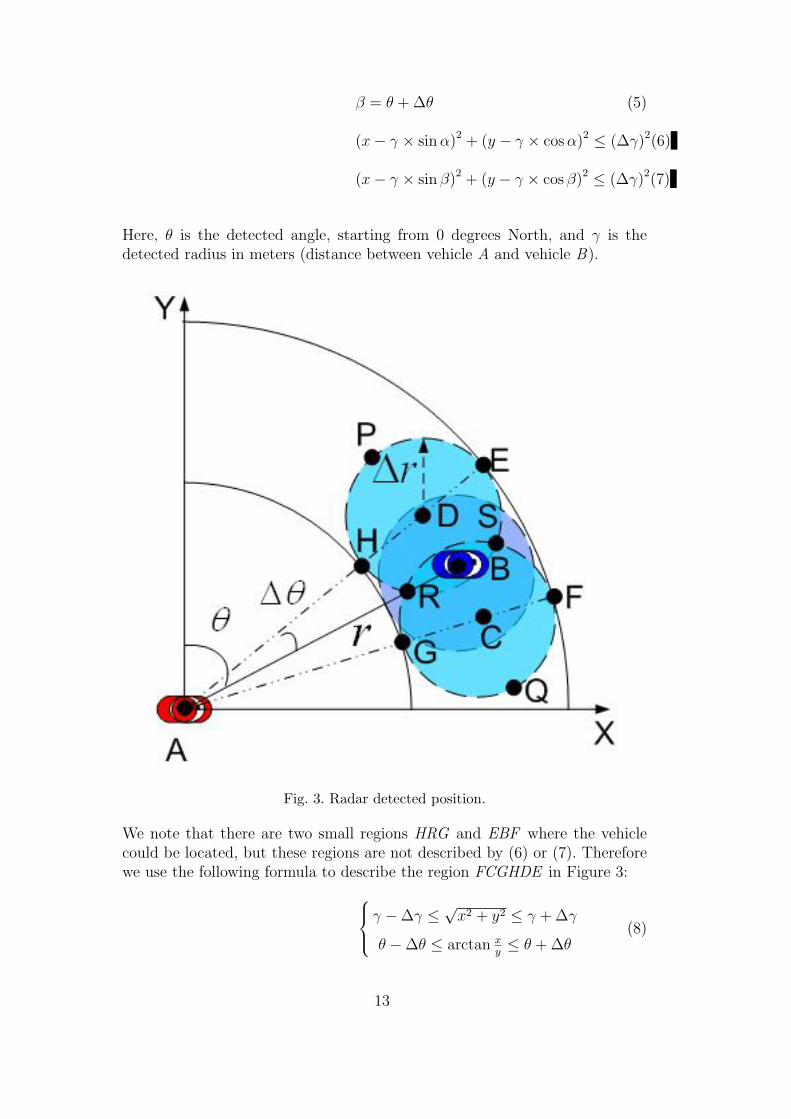
β = θ + ∆θ (5)
(x− γ × sin α)2 + (y − γ × cos α)2 ≤ (∆γ)2(6)
(x− γ × sin β)2 + (y − γ × cos β)2 ≤ (∆γ)2(7)
Here, θ is the detected angle, starting from 0 degrees North, and γ is thedetected radius in meters (distance between vehicle A and vehicle B).
Fig. 3. Radar detected position.
We note that there are two small regions HRG and EBF where the vehiclecould be located, but these regions are not described by (6) or (7). Thereforewe use the following formula to describe the region FCGHDE in Figure 3: γ −∆γ ≤
√x2 + y2 ≤ γ + ∆γ
θ −∆θ ≤ arctan xy≤ θ + ∆θ
(8)
13
Although (8) includes some regions which are described by (6) and (7), forexample the region RGCFB, this has no negative effect because we will findan intersection between the GPS position formula and radar position formulaby using the technique to be described in the next section.
4.2.3 Combining GPS and Radar Coordinates
To draw a conclusion, such as “my neighbor is lying to me about its position”,we have to find an overlap (solution) between the GPS position formula andthe radar position formula.
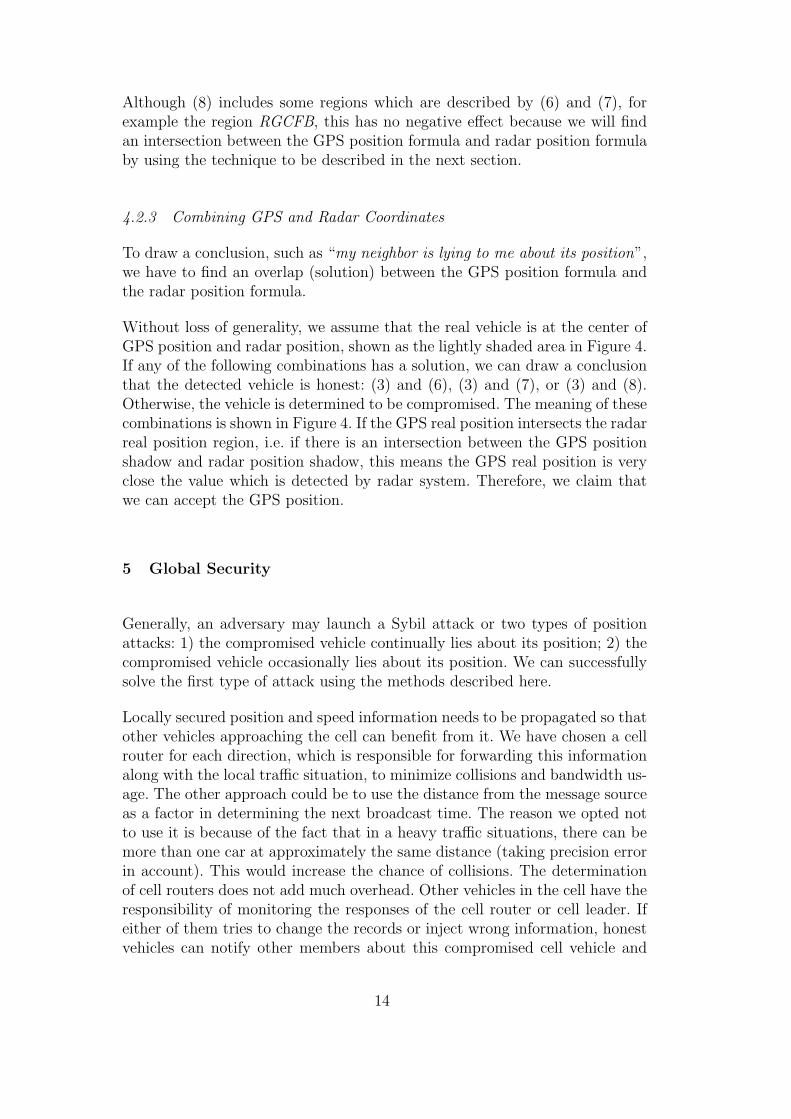
Without loss of generality, we assume that the real vehicle is at the center ofGPS position and radar position, shown as the lightly shaded area in Figure 4.If any of the following combinations has a solution, we can draw a conclusionthat the detected vehicle is honest: (3) and (6), (3) and (7), or (3) and (8).Otherwise, the vehicle is determined to be compromised. The meaning of thesecombinations is shown in Figure 4. If the GPS real position intersects the radarreal position region, i.e. if there is an intersection between the GPS positionshadow and radar position shadow, this means the GPS real position is veryclose the value which is detected by radar system. Therefore, we claim thatwe can accept the GPS position.
5 Global Security
Generally, an adversary may launch a Sybil attack or two types of positionattacks: 1) the compromised vehicle continually lies about its position; 2) thecompromised vehicle occasionally lies about its position. We can successfullysolve the first type of attack using the methods described here.
Locally secured position and speed information needs to be propagated so thatother vehicles approaching the cell can benefit from it. We have chosen a cellrouter for each direction, which is responsible for forwarding this informationalong with the local traffic situation, to minimize collisions and bandwidth us-age. The other approach could be to use the distance from the message sourceas a factor in determining the next broadcast time. The reason we opted notto use it is because of the fact that in a heavy traffic situations, there can bemore than one car at approximately the same distance (taking precision errorin account). This would increase the chance of collisions. The determinationof cell routers does not add much overhead. Other vehicles in the cell have theresponsibility of monitoring the responses of the cell router or cell leader. Ifeither of them tries to change the records or inject wrong information, honestvehicles can notify other members about this compromised cell vehicle and
14
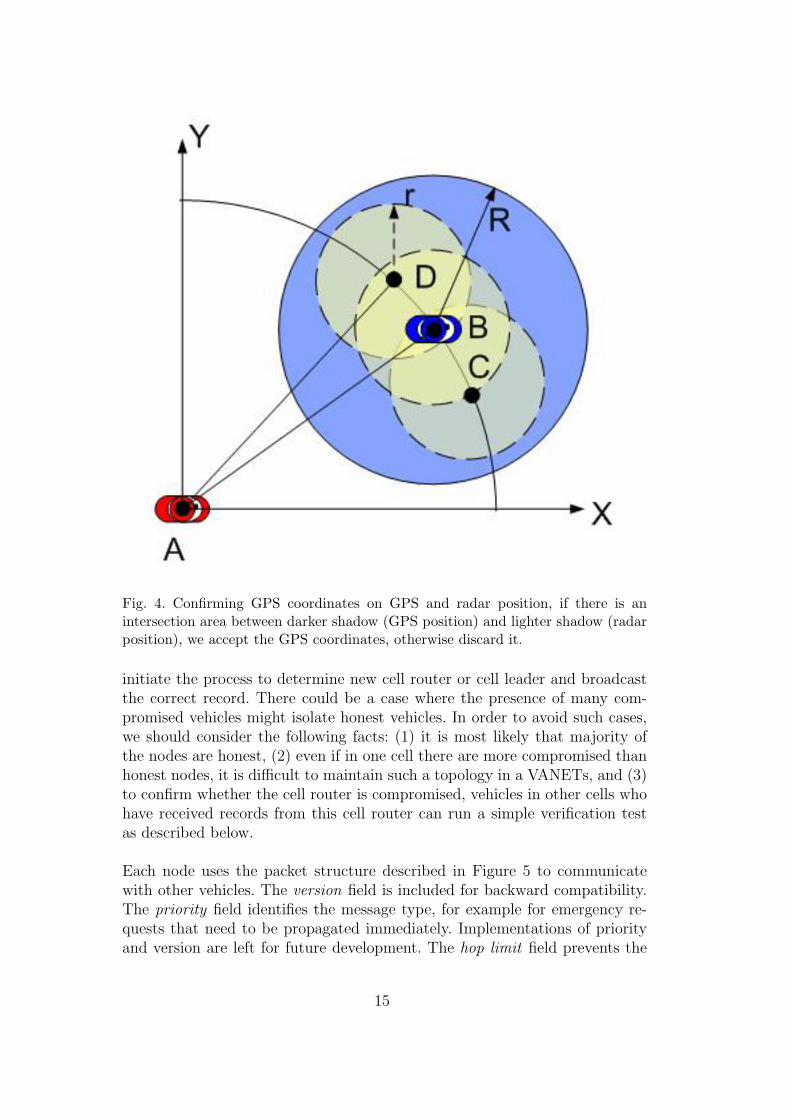
Fig. 4. Confirming GPS coordinates on GPS and radar position, if there is anintersection area between darker shadow (GPS position) and lighter shadow (radarposition), we accept the GPS coordinates, otherwise discard it.
initiate the process to determine new cell router or cell leader and broadcastthe correct record. There could be a case where the presence of many com-promised vehicles might isolate honest vehicles. In order to avoid such cases,we should consider the following facts: (1) it is most likely that majority ofthe nodes are honest, (2) even if in one cell there are more compromised thanhonest nodes, it is difficult to maintain such a topology in a VANETs, and (3)to confirm whether the cell router is compromised, vehicles in other cells whohave received records from this cell router can run a simple verification testas described below.
Each node uses the packet structure described in Figure 5 to communicatewith other vehicles. The version field is included for backward compatibility.The priority field identifies the message type, for example for emergency re-quests that need to be propagated immediately. Implementations of priorityand version are left for future development. The hop limit field prevents the
15
propagation of the packet past a certain distance. The source address includesthe vehicles unique ID and cell ID. The destination address can be a broad-cast address or an ID. The packet body consists of the vehicle’s ID, location,direction, speed and time when reported. The timestamp helps to determinethe relevance of the message.
Fig. 5. Packet Structure
The message challenging method is used to verify records which are disputed.Whenever vehicles in a cell do not agree with the broadcasted message, theyexpress their concern by broadcasting their records. A vehicle getting differentinformation for the same vehicle can verify the disputed record through thismethod. Since we assumed that traffic moves in both directions, a node cansend the verification request to the cell router in the opposite direction. Weshow an example in Figure 6. Traffic is moving in two directions: the bottomroad is eastbound whereas the top road is westbound. Suppose car A transmitsa message which is propagated backwards and eventually received by car I.If car I would like to verify the position received from car A, it can send theverification request using cars moving in the opposite direction. Cell routersforward the message to neighboring cells until it reaches the destination cell.The destination can be more than one cell depending on the position of thenode when the record was sent, its speed and the cell where it was present.Once the car with the same ID is identified, its position can be verified and aresponse can be generated. If there is no such node existing in the potentialdestination cells, or the position information was modified, then the record is
16

considered to be spurious and is dropped. The sender of that record comesunder the scrutiny by other honest nodes. In Figure 6, the rightmost cell is thedestination cell. This request is propagated from car I to car e through cars band d. Since car A falls within the transmission range of car e, its position canbe verified using the radar of car e. This verified information is then sent backto car I. This verification method works because of the low processing andpropagation time. If the record that is being disputed is from a vehicle veryfar away, the vehicles drop the information instead of challenging it. Unlessmany records are being changed, or some other vehicle tells that vehicle indispute is indeed close by, no request is sent. Global security is based on the
Fig. 6. Message routing among the cells.
fact that the vehicles in the same cell would see and hear almost the sametraffic and road situation, so any modification done by malicious nodes can bedetected by other honest vehicles. These honest vehicles then broadcast thecorrect record and isolate the malicious vehicle.
6 Preventing Sybil Attacks
6.1 Threat Model
The threat model assumed in this work includes three types of attack: theposition attack, the Sybil attack, and the combination of the position attackand the Sybil attack. When radar’s line of sight is blocked, position attacks canhappen. An attacker can launch a position attack by revising position packets,replaying bogus position packets and dropping urgent position packets. Forexample, an attacker may send a fake message created by changing a correct
17

position into false position or inserting a bogus position when the neighbors’radar does not work under certain scenarios. Since the local neighbors andeven the opposite vehicles can not “see” the positions which are pointed bythe fake packets, these illusions of vehicles’ position can give the attackers analternate route to their advantage when the traffic is jammed. Even worse, theattacker can drop all the deceleration alerts from reaching other vehicles in atraffic accident by creating illusions of router vehicles.
The Sybil attack [7] is a well-known harmful attack in VANETs whereby avehicle claims to be several vehicles either at the same time or in succession.The Sybil attack is harmful to network topologies, connections, network band-width consumption, and there are some threats even related to human life. Forexample, a Sybil attacker may give the illusion of 100 vehicles on a one kilome-ter highway. These illusions change the topology of the network dramatically.The real vehicles will try to communicate with these illusion vehicles but willnever receive any acknowledgements from them. The real vehicles retransmitthe packets, which consumes network bandwidth. In some urgent situations,for example rescuing people at an accident site on the highway, the illusionswill slow down the traffic, hampering the rescue vehicles from reaching theaccident site.
The combination of the position attack and Sybil attack is a mixture of thesetwo attacks. The harm of this attack is worse than a single position attack orSybil attack. Moreover, it is harder to prevent.
What makes an attack possible is the following: the local vehicle has no directphysical knowledge of remote vehicle, therefore the local vehicles perceive theremote vehicles only through abstract information. However, this abstractinformation can be forged or modified by attackers. The local vehicles perceivethe illusion of a vehicle if they receive forged abstract vehicle entities.
6.2 Overview
We propose a solution to prevent some forms of Sybil attacks. Our idea is thatif radar works such that it can detect the physical existence of a vehicle, we canuse this physical information to remedy the purely abstract information abouta vehicle. We compute similarity among three kinds of data: radar detections,oncoming traffic reports and neighbors reports. To average these similarities,each similarity has a weight. When radar works, radar detections are moretrustworthy, therefore radar detections have a larger weight; when radar doesnot work, neighbors’ reports have a larger weight. The average position andvelocity will be computed if the similarity is close. A history of the road mapis maintained by storing these average positions and velocities over a period of
18

time. When a query according to position needs to be made, vehicles rebuildthe target vehicle’s map history virtually and make their decision based onthis map.
6.3 Sources of Data
We use three types of data resources: radar detection data, oncoming trafficradar detection data, and neighbors’ reports.
1) Radar Detection Data: Using radar, we can get the relative velocity anddistance from the observer vehicle. We can get the radar detection data bythe following formula:
−→νr = −→νl +−→νre (9)
where −→νr is the detected velocity by radar, −→νl is the local velocity, −→νre is therelative velocity computed from radar. Since the velocity is a vector, we defineapproaching the local vehicle as positive and moving farther from the localvehicle as negative. Similarly, we have the following position formula: xr = xl + xre
yr = yl + yre
(10)
where xr and yr are the x and y coordinates collected by radar, xl and yl arethe local xy axis values, xre and yre are the relative xy axis values obtainedby the Doppler Effect.
2) Oncoming Traffic Data: We have reactively collected data from oncomingtraffic, as described in Sections 3 and 5. We mark the velocity from oncomingtraffic as −→νt , and the position as (xt, yt).
3) Neighbors Data: We collect data proactively and reactively from neighborsin a cell, as described in Section 3. We mark the velocity from oncoming trafficas −→νn, and the position as (xn, yn).
6.4 Pattern Recognition Model
6.4.1 Similarity Computation
Based on classic pattern recognition, we use cosine similarity [13] which com-putes the similarity of two vectors. The physical meaning of the similarity is
19
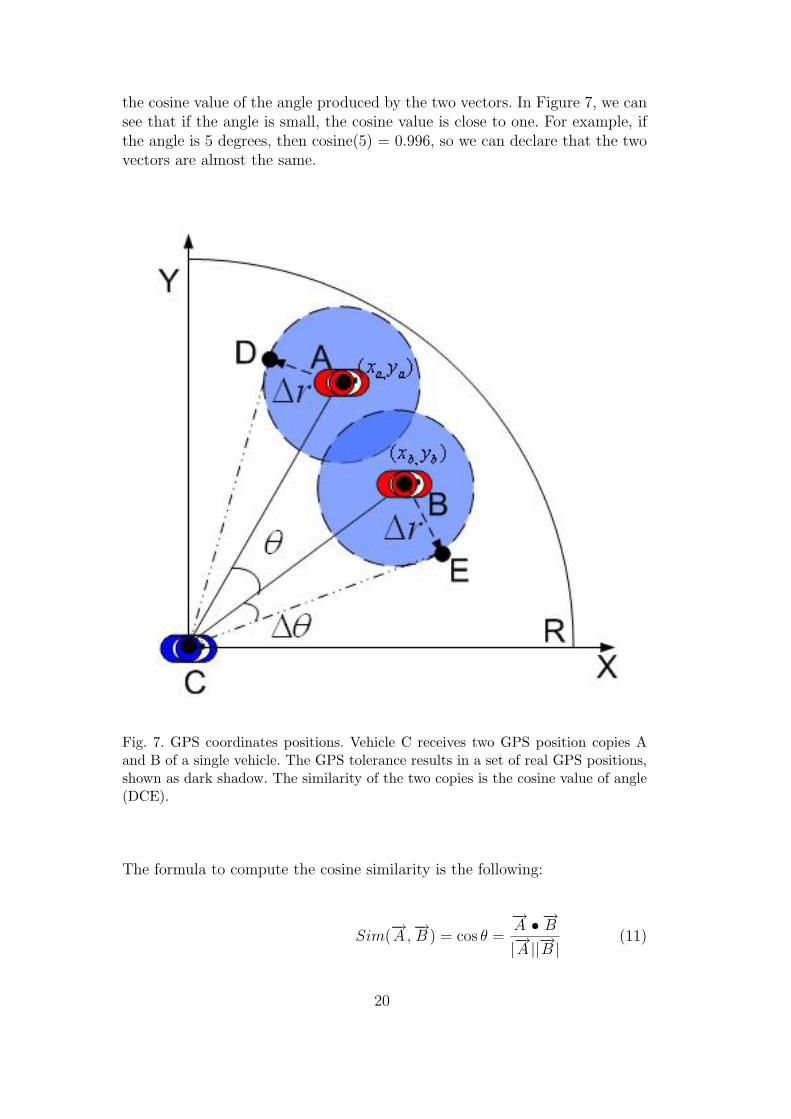
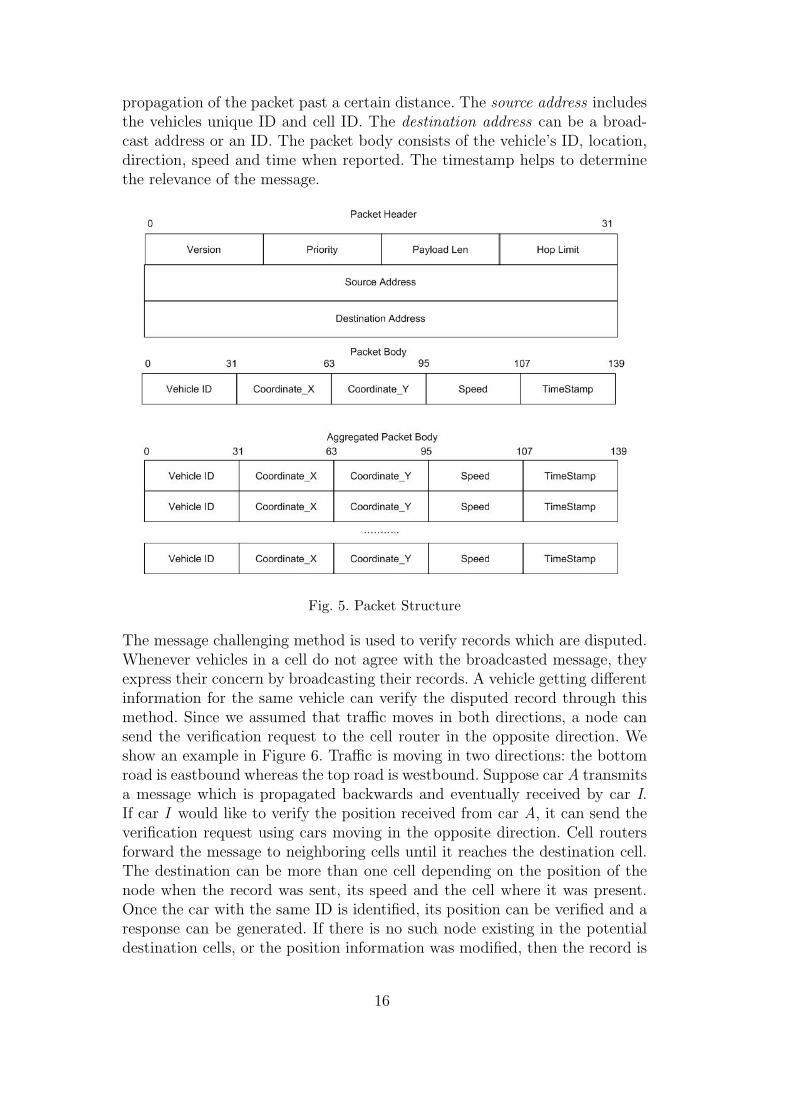
the cosine value of the angle produced by the two vectors. In Figure 7, we cansee that if the angle is small, the cosine value is close to one. For example, ifthe angle is 5 degrees, then cosine(5) = 0.996, so we can declare that the twovectors are almost the same.
Fig. 7. GPS coordinates positions. Vehicle C receives two GPS position copies Aand B of a single vehicle. The GPS tolerance results in a set of real GPS positions,shown as dark shadow. The similarity of the two copies is the cosine value of angle(DCE).
The formula to compute the cosine similarity is the following:
Sim(−→A,−→B ) = cos θ =
−→A • −→B|−→A ||−→B |
(11)
20

When we apply the xy-coordinates to (11), we get:
−→A • −→B|−→A ||−→B |
=x1 ∗ x2 + y1 ∗ y2√x2
1 + y21 ∗
√x2
2 + y22
(12)
Another solution is using a three dimension vectors (−→ν , x, y), if we includevelocity in a vector as well. The formula is:
−→A • −→B|−→A ||−→B |
=x1 ∗ x2 + y1 ∗ y2 + ν1 ∗ ν2√
x21 + y2
1 + ν21 ∗
√x2
2 + y22 + ν2
2
(13)
In (13) we see that the velocity affects the similarity. But we need furtherstudy to find which formula is more appropriate.
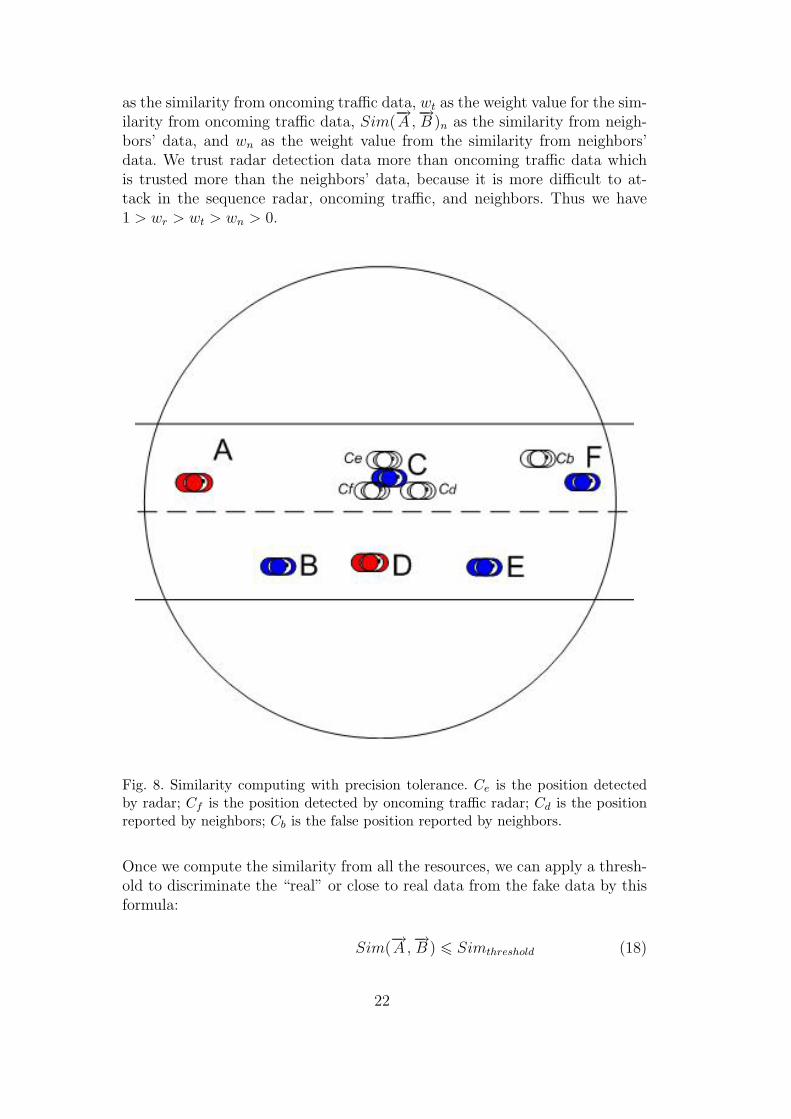
We can get three types of data as described in Section 6.3. Since they are fromdifferent sources of data, the three types of data are not exactly same. Theywill have some precision tolerance, as shown in Figure 8 where Cd, Ce, Cf areclose positions to the vehicle’s real position C, but Cb is not a close position.We can not directly use any one of these data, however we can give themweights wi depending on how much they will contribute to the confidenceof the similarity. When radar works, we weight the radar’s detections morethan neighbors’ reports because radar is more reliable than neighbors’ reports.When radar does not work in some situation, for example the line of sight isblocked by a large truck, neighbors’ report will be given more weight. Sincethe majority of vehicles behave properly, in most cases, neighbors’ reports aretrustworthy. If, at the same time, neighbors are allied to lie and radar doesnot work, using the map history, to be discussed in Section 6.5, may help insome cases. We will study the cases which map history does not help in futurework.
From (11), we can get
Simr = Sim(−→A,−→B )r ∗ wr (14)
Simt = Sim(−→A,−→B )t ∗ wt (15)
Simn = Sim(−→A,−→B )n ∗ wn (16)
Sim(−→A,−→B ) = Simr + Simt + Simn (17)
We mark Sim(−→A,−→B )r as the similarity computed from radar detected data,
wr as the weight value for the similarity from radar detected data, Sim(−→A,−→B )t
21
as the similarity from oncoming traffic data, wt as the weight value for the sim-ilarity from oncoming traffic data, Sim(
−→A,−→B )n as the similarity from neigh-
bors’ data, and wn as the weight value from the similarity from neighbors’data. We trust radar detection data more than oncoming traffic data whichis trusted more than the neighbors’ data, because it is more difficult to at-tack in the sequence radar, oncoming traffic, and neighbors. Thus we have1 > wr > wt > wn > 0.
Fig. 8. Similarity computing with precision tolerance. Ce is the position detectedby radar; Cf is the position detected by oncoming traffic radar; Cd is the positionreported by neighbors; Cb is the false position reported by neighbors.
Once we compute the similarity from all the resources, we can apply a thresh-old to discriminate the “real” or close to real data from the fake data by thisformula:
Sim(−→A,−→B ) 6 Simthreshold (18)
22
The determination of the threshold Simthreshold is part of our future work.Once all data from different sources are determined to be highly similar eachother, we compute the average of these data as in (19).
−−→νavg = 1N
N∑i=1
−→νi
xavg = 1N
N∑i=1
xi
yavg = 1N
N∑i=1
yi
(19)
6.5 Map History
The purpose of map history is to classify new data as “real data” or “fakedata” based on the history of a vehicle. The basic idea is that any vehiclewithout historical consistency is highly suspect.
6.5.1 Map History Overview
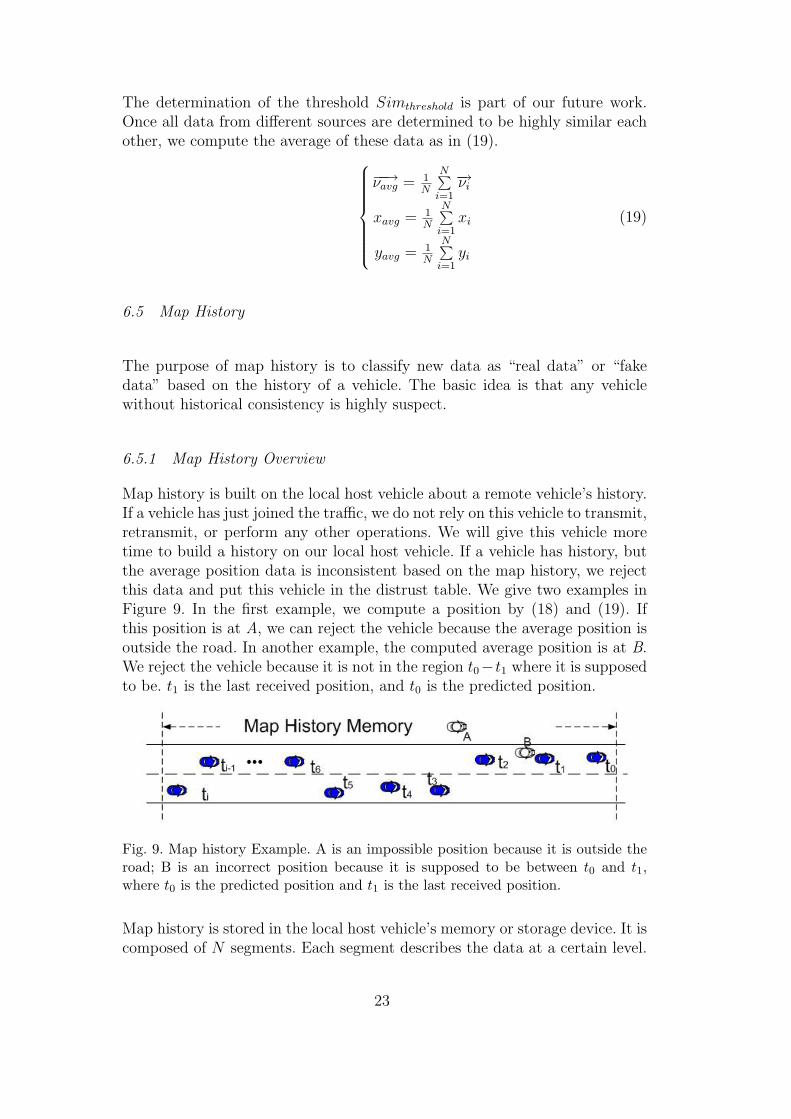
Map history is built on the local host vehicle about a remote vehicle’s history.If a vehicle has just joined the traffic, we do not rely on this vehicle to transmit,retransmit, or perform any other operations. We will give this vehicle moretime to build a history on our local host vehicle. If a vehicle has history, butthe average position data is inconsistent based on the map history, we rejectthis data and put this vehicle in the distrust table. We give two examples inFigure 9. In the first example, we compute a position by (18) and (19). Ifthis position is at A, we can reject the vehicle because the average position isoutside the road. In another example, the computed average position is at B.We reject the vehicle because it is not in the region t0−t1 where it is supposedto be. t1 is the last received position, and t0 is the predicted position.
Fig. 9. Map history Example. A is an impossible position because it is outside theroad; B is an incorrect position because it is supposed to be between t0 and t1,where t0 is the predicted position and t1 is the last received position.
Map history is stored in the local host vehicle’s memory or storage device. It iscomposed of N segments. Each segment describes the data at a certain level.
23

We term each stage as a Stack as shown in Figure 10. For example, Stack Oneincludes records which are collected each second. All the records are processedby the method described in Section 6.4.1 before it is recorded into the Stacks.In one second, a vehicle moves at most 33 meters if we assume the maximumspeed is 75 miles per hour. Therefore, the interval between t0 and t1 is at most33 meters. Because of transient velocity, some intervals are shorter than 33meters. In Figure 10, an overview of the Stack is shown. Stack Two includesrecords which are collected every 10 seconds. Therefore we get more sparselyrecorded positions in Stack Two as shown in Figure 10.
Fig. 10. Map history Overview. Stack One has more frequently collected data: onerecord per second and a shorter time duration, which is dependent on how detailedthe position is recorded in Stack One. Stack Two has a larger interval of timebetween two records which builds a sparser position history.
6.5.2 Filtering Out Impossible Positions
With the map history Stacks and the processed data from Section 6.4.1 inhand, we can separate the “real data” from the “fake data”.
Fig. 11. Screen Vehicles Using Map History. If a vehicle does not fall into the shadedregion, ABCD, it is a suspected vehicle. The circles are based on the vehicle velocityand interval of records.
For each record, we have time, velocity, and position attributes. Subsequent
24
vehicle positions can be described by the following formula:
(x− xi)2 + (y − yi)
2 ≤ γ2
γ = t ∗ νi
0 ≤ ν ≤ vmax
{x, y} ∈ Road
(20)
For any Stack N , we have a predicted record t0 which is given based on themaximum velocity: (x− xi)
2 + (y − yi)2 ≤ (t ∗ vmax)
2
{x, y} ∈ Road(21)
In (20) and (21), xi, yi are the coordinates of record i in any Stack N ; x, yare the coordinates of new data or record; t is the length of sample interval ofStack N ; vmax is the maximum velocity on the road by consulting the digitalmap. We can consult the digital map with the (x, y) coordinates to check if(x, y) is on the road. So far, we can screen all the data by solving (20) and(21). The physical meaning is that if the new data inside the shaded region inFigure 11, we can declare the data acceptable. Otherwise it is not acceptable,and the vehicle will be isolated.
7 Isolating Malicious Vehicles
In this section, we use position security (local security and global security) andmap history security to isolate vehicles with abnormal behavior in some po-sition attacks, some Sybil attacks and some combinations of position attacksand Sybil attacks. To isolate compromised vehicles, all vehicles in a cell main-tain three tables in memory: trust table, question table and distrust table,shown in Figure 12. Each table consists of records indexed by vehicle ID. Anexample record is shown in Figure 13. Each record consists of a set of Stacks.Each Stack contains a map history at a certain level as addressed in Section6.5. All the records which are beyond the timeout limit will be deleted. We arevirtually guaranteed that the trust table will be large and as a consequence,the task of determining a cell leader and routers will be always successful.
Initially, a new vehicle, as an observer, enters the road. It first enters a celland broadcasts a “HELLO” message. The cell leader sends back its ID, the
25

cell routers’ IDs and all the other members’ IDs. When the leader sends in-formation to the observer, members in the cell will hear it. If there is bogusinformation in the message, a member may dispute the leader as we men-tioned in Section 5. The observer places records of the leader and routers intoits trust table and places other members’ records into its question table. Fromthen on, the observer starts to build its own map history. Figure 12 showsthe tables and state transitions. If an observed vehicle behaves normally fora certain period of time, the observer will place it into the trust table. If anobserved vehicle behaves abnormally, the observer will place it into the dis-trust table. Otherwise the vehicle will stay in the current table. Here normalbehavior means the reported position is detected by radar. If not receivingreports from an observed vehicle or not detecting the observed vehicle for awhile by observer’s radar or oncoming traffic radar, the observer will move theobserved vehicle from the trust table to the question table.
Fig. 12. State transitions. State transitions 1, 3, 5, 7: if confirmed by radar oropposite vehicles’ radar, State Transitions 2, 4, 6, 8: if not confirmed by radar oropposite vehicles’ radar
26
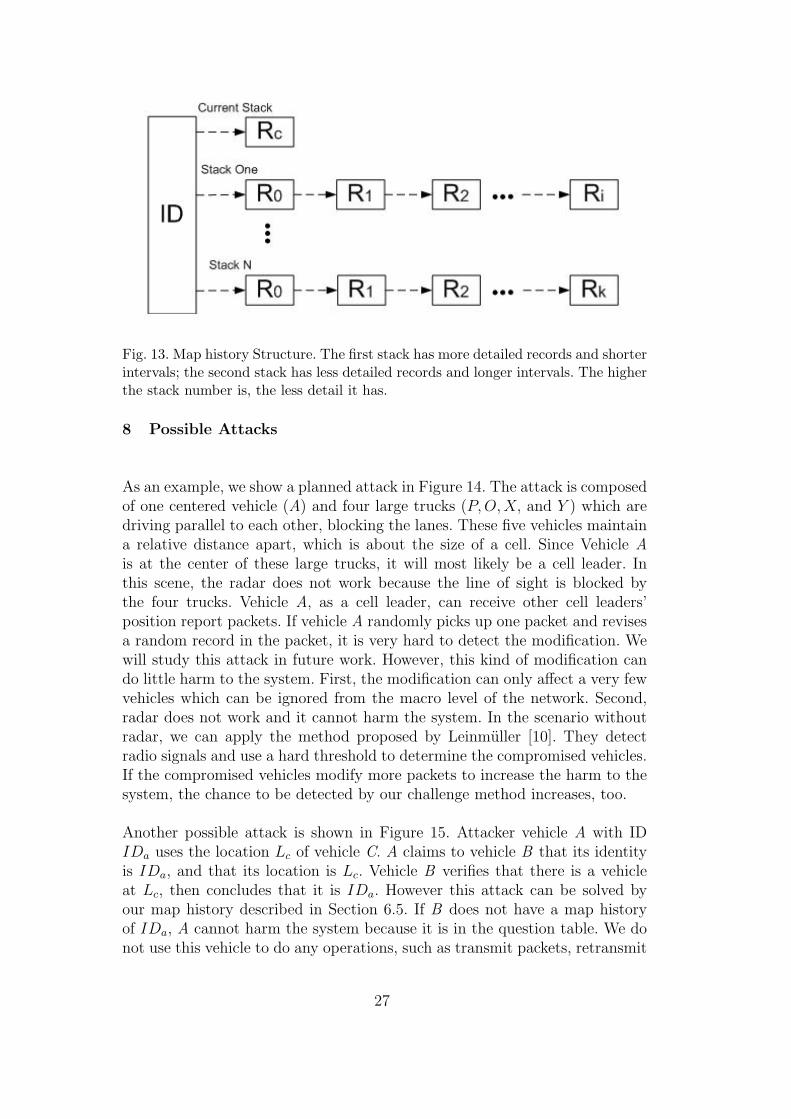
Fig. 13. Map history Structure. The first stack has more detailed records and shorterintervals; the second stack has less detailed records and longer intervals. The higherthe stack number is, the less detail it has.
8 Possible Attacks
As an example, we show a planned attack in Figure 14. The attack is composedof one centered vehicle (A) and four large trucks (P, O, X, and Y ) which aredriving parallel to each other, blocking the lanes. These five vehicles maintaina relative distance apart, which is about the size of a cell. Since Vehicle Ais at the center of these large trucks, it will most likely be a cell leader. Inthis scene, the radar does not work because the line of sight is blocked bythe four trucks. Vehicle A, as a cell leader, can receive other cell leaders’position report packets. If vehicle A randomly picks up one packet and revisesa random record in the packet, it is very hard to detect the modification. Wewill study this attack in future work. However, this kind of modification cando little harm to the system. First, the modification can only affect a very fewvehicles which can be ignored from the macro level of the network. Second,radar does not work and it cannot harm the system. In the scenario withoutradar, we can apply the method proposed by Leinmuller [10]. They detectradio signals and use a hard threshold to determine the compromised vehicles.If the compromised vehicles modify more packets to increase the harm to thesystem, the chance to be detected by our challenge method increases, too.
Another possible attack is shown in Figure 15. Attacker vehicle A with IDIDa uses the location Lc of vehicle C. A claims to vehicle B that its identityis IDa, and that its location is Lc. Vehicle B verifies that there is a vehicleat Lc, then concludes that it is IDa. However this attack can be solved byour map history described in Section 6.5. If B does not have a map historyof IDa, A cannot harm the system because it is in the question table. We donot use this vehicle to do any operations, such as transmit packets, retransmit
27

Fig. 14. A planned attack scenario: four big trucks P , O, X, Y are driving parallelly,vehicle A is always driving near the center of a cell. They keep relative distance.
packets, and report data, etc. If B has a map history of IDa, we can easily toidentify the illusion position of A. A segment of the Stack in the map historyis shown in Figure 16. Which segment is selected depends on Lc. We assumea segment of Stack N is selected. All the vehicles in Figure 16 represent theprevious position of A. We calculate possible next positions of A shown asa shaded region in Figure 16. Since Lc, shown as T0, does not fall into theshaded region, we conclude that A lies. We put A into distrust list to isolateA. Even if Lc happens to fall into shaded region, it can not always fall intothe shaded region because the relative position of vehicles is transient. AndA can not compute the same map history with B because the map historydepends on three sources of data which are collected at a specified situationand a specified time for a specified vehicle.
Fig. 15. A possible Sybil Attack. A obtains C’s position Lc. A claims to victim Bthat its position is Lc, and that its ID is IDa. B detects a vehicle is at Lc thenconcludes that it is the position of A.
28

Fig. 16. A segment of Stack in map history.
9 Simulation Results
In our experiments, we simulated a two-direction 3 km highway with twolanes in each direction. The cell radius was 100 meters, traffic arrival rate was1600 vehicles/hour, mean velocity was 33.3 m/s, and transmission radius was100 meters.Each simulation has some number of compromised, or malicious,vehicles and a single observer vehicle. When the observer enters the simulatedhighway, it initiates a request to find all of the compromised vehicles. Thesimulation terminates when the observer reaches the end of the 3 km highway.
We wanted to investigate the amount of time required to detect a certainnumber of compromised vehicles. In our first set of experiments, we inserted16 compromised vehicles and varied the total number of vehicles on the high-way. Each experiment was run 10 times, and we measured the average amountof time needed to detect the 16 compromised vehicles. As a comparison, weshow in Figure 17, the average amount of time using our cell-based routingas opposed to message flooding, where each node re-broadcasts the receivedmessage. As expected, cell-based routing is more efficient than flooding. Thetime needed to detect the compromised vehicles increases when the number ofvehicles decreases. The reason is that in low density traffic vehicles must phys-ically drive the packet to the next cell if there are no middle nodes availableas routing nodes.
To determine how transmission range affects the time needed to detect mali-cious vehicles, we ran a set of experiments with a 100 m transmission rangeand a set with a 500 m transmission range. The vehicle density was about30 vehicles per kilometer per lane on the highway. The compromised vehicleswere 5% of the total vehicles and were randomly deployed along the highway.In each set of simulations, we varied the length of the highway to investigatethe effect of transmission range. Since the time depends on the number ofintermediate hops, the increased range of transmission would certainly de-crease the time. However, the increased transmission range would increase theprobability of packet collisions. Figure 18 shows the time taken to detect themalicious vehicles with respect to their distance from the vehicle generatingthe verification request. As expected, with a 500 m range, the time is much
29
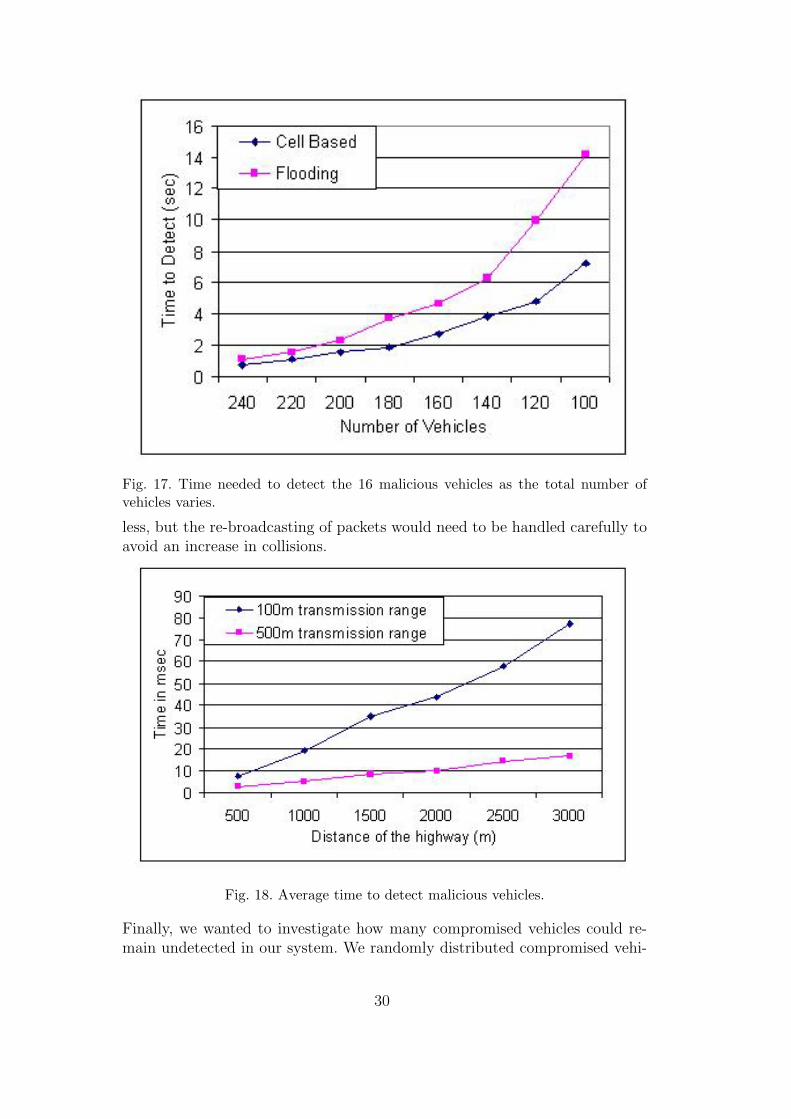
Fig. 17. Time needed to detect the 16 malicious vehicles as the total number ofvehicles varies.
less, but the re-broadcasting of packets would need to be handled carefully toavoid an increase in collisions.
Fig. 18. Average time to detect malicious vehicles.
Finally, we wanted to investigate how many compromised vehicles could re-main undetected in our system. We randomly distributed compromised vehi-
30
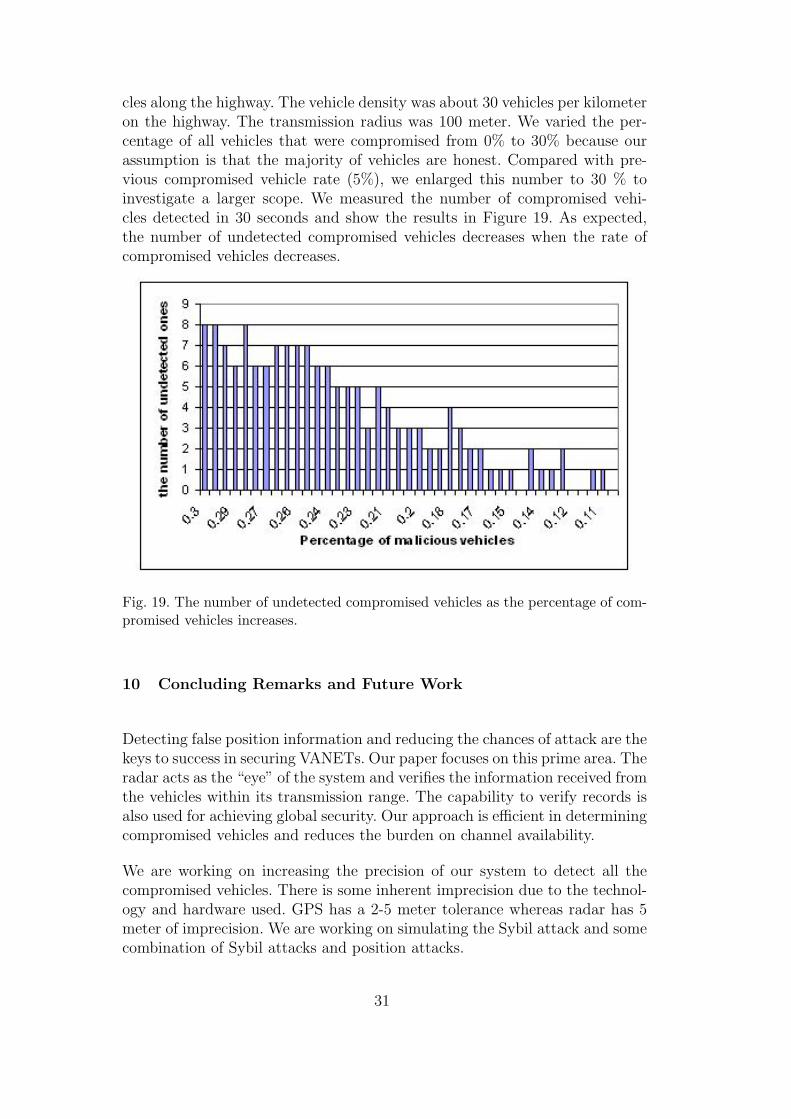
cles along the highway. The vehicle density was about 30 vehicles per kilometeron the highway. The transmission radius was 100 meter. We varied the per-centage of all vehicles that were compromised from 0% to 30% because ourassumption is that the majority of vehicles are honest. Compared with pre-vious compromised vehicle rate (5%), we enlarged this number to 30 % toinvestigate a larger scope. We measured the number of compromised vehi-cles detected in 30 seconds and show the results in Figure 19. As expected,the number of undetected compromised vehicles decreases when the rate ofcompromised vehicles decreases.
Fig. 19. The number of undetected compromised vehicles as the percentage of com-promised vehicles increases.
10 Concluding Remarks and Future Work
Detecting false position information and reducing the chances of attack are thekeys to success in securing VANETs. Our paper focuses on this prime area. Theradar acts as the “eye” of the system and verifies the information received fromthe vehicles within its transmission range. The capability to verify records isalso used for achieving global security. Our approach is efficient in determiningcompromised vehicles and reduces the burden on channel availability.
We are working on increasing the precision of our system to detect all thecompromised vehicles. There is some inherent imprecision due to the technol-ogy and hardware used. GPS has a 2-5 meter tolerance whereas radar has 5meter of imprecision. We are working on simulating the Sybil attack and somecombination of Sybil attacks and position attacks.
31
There are some special cases that will be further studied: 1) When the lineof sight of radar is blocked by obstacles, attackers may launch some Sybilattacks. 2) When a honest vehicle with a long and valid map history is leaving,attackers may launch some Sybil attacks. 3) Cell routers and leaders may bea target of selective attack. 4) The size of map history needs to be studied.
Acknowledgements
We thank Gyanesh Choudhary for helpful suggestions in this work.
References
[1] Car 2 Car Communication Consortium, http://www.car-to-car.org/.
[2] US Department of Transportation, National Highway Traffic SafetyAdministration, Vehicle safety communications consortium, http://www-nrd.nhtsa.dot.gov/pdf/nrd-12/CAMP3/pages/VSCC.htm.
[3] A. Takahashi, N. Asanuma, Introduction of Honda ASV-2 (Advanced SafetyVehicle-Phase 2), in: Proceedings of the IEEE Intelligent Vehicles Symposium,Detroit, USA, 2000, pp. 694–701.
[4] J.-S. Park, U. Lee, S. Y. Oh, M. Gerla, D. S. Lun, Emergency related videostreaming in VANET using network coding, in: Proceedings of the ACMWorkshop on Vehicular Ad Hoc Networks (VANET), Los Angeles, CA, 2006,pp. 102–103.
[5] B. Parno, A. Perrig, Challenges in securing vehicular networks, in: Proceedingsof ACM HotNets, 2005.
[6] R. Mobus, M. Baotic, M. Morari, Multi-Object Adaptive Cruise Control, HybridSystems: Computation and Control 2623 (2003) 359–374.
[7] J. Douceur, The sybil attack, Lecture Notes in Computer Science: RevisedPapers from the First International Workshop on Peer-to-Peer Systems 2429(2002) 251–260.
[8] P. Golle, D. Greene, J. Staddon, Detecting and correcting malicious data inVANETs, in: Proceedings of the ACM Workshop on Vehicular Ad Hoc Networks(VANET), Philadelphia, PA, 2004, pp. 29–37.
[9] T. Leinmuller, E. Schoch, Greedy routing in highway scenarios: The impactof position faking nodes, in: Proceedings of the Workshop on IntelligentTransportation (WIT), 2006.
32

[10] T. Leinmuller, E. Schoch, F. Kargl, C. Maihofer, Improved security ingeographic ad hoc routing through autonomous position verification, in:Proceedings of the ACM Workshop on Vehicular Ad Hoc Networks (VANET),Los Angeles, CA, 2006, pp. 57–66.
[11] M. Raya, J.-P. Hubaux, The security of vehicular ad hoc networks, in:Proceedings of the ACM Workshop on Security of Ad Hoc and Sensor Networks,Alexandria, VA, 2005, pp. 11–21.
[12] T. Leinmuller and E. Schoch and F. Kargl and C. Maihofer, Influence of falsifiedposition data on geographic ad-hoc routing, in: Proceedings of the EuropeanWorkshop on Security and Privacy in Ad hoc and Sensor Networks (ESAS),2005.
[13] S.-T. Yuan, J. Sun, Ontology-based structured cosine similarity in speechdocument summarization, in: Proceedings of the 2004 IEEE/WIC/ACMInternational Conference on Web Intelligence, Washington, DC, USA, 2004,pp. 508–513.
[14] J.-P. Hubaux, S. Capkun, J. Luo, The security and privacy of smart vehicles,IEEE Security and Privacy Magazine 2 (3) (2004) 49–55.
[15] M. Raya, A. Aziz, J.-P. Hubaux, Efficient Secure Aggregation in VANETs, in:Proceedings of the ACM Workshop on Vehicular Ad Hoc Networks (VANET),Los Angeles, CA, 2006, pp. 67–75.
[16] M. Raya, P. Papadimitratos, J.-P. Hubaux, Securing vehicular communications,IEEE Wireless Communications Magazine (2006) 8–15.
[17] S. Capkun, J.-P. Hubaux, Secure positioning of wireless devices with applicationto sensor networks, in: Proceedings of IEEE INFOCOM, Vol. 3, 2005, pp. 1917–1928.
[18] M. G. Kuhn, An asymmetric security mechanism for navigation signals, in:Proceedings of the Workshop on Information Hiding, Toronto, Canada, 2004,pp. 239–252.
[19] F. Armknecht, A. Festag, D. Westhoff, K. Zeng, Cross-layer privacyenhancement and non-repudiation in vehicular communication, in: Proceedingsof the Workshop on Mobile Ad-Hoc Networks (WMAN), Bern, Switzerland,2007.
[20] J. Y. Choi, P. Golle, M. Jakobsson, Tamper-evident digital signatures:Protecting certification authorities against malware, in: Proceedings of theIEEE International Symposium on Dependable, Autonomic and SecureComputing (DASC), 2006, pp. 37–44.
[21] K. Ploßl, T. Nowey, C. Mletzko, Towards a security architecture for vehicular adhoc networks, in: Proceedings of the International Conference on Availability,Reliability and Security (ARES), Washington, DC, USA, 2006, pp. 374–381.
33

[22] F. Dai, J. Wu, Proactive route maintenance in wireless ad hoc networks, in:Proceedings of the IEEE International Conference on Communications (ICC),Vol. 2, 2005, pp. 1236–1240.
[23] N. Sastry, U. Shankar, D. Wagner, Secure verification of location claims, in:Proceedings of the ACM Workshop on Wireless Security (WiSe), San Diego,CA, 2003, pp. 1–10.
[24] T. Suen, A. Yasinsac, Ad hoc network security: Peer identification and au-thentication using signal properties, in: Systems, Man and Cybernetics (SMC)Information Assurance Workshop, 2005, pp. 432–433.
[25] B. Xiao, B. Yu, C. Gao, Detection and localization of Sybil nodes in VANETs,in: Proceedings of the Workshop on Dependability Issues in Wireless Ad HocNetworks and Sensor Networks, Los Angeles, CA, USA, 2006, pp. 1–8.
[26] J. Newsome, E. Shi, D. Song, A. Perrig, The Sybil attack in sensor networks:analysis & defenses, in: Proceedings of International Symposium on InformationProcessing in Sensor Networks (IPSN), Berkeley, CA, 2004, pp. 259–268.
[27] C. Piro, C. Shields, B. N. Levine, Detecting the Sybil attack in mobile adhoc network, in: Proceedings of the International Conference on Security andPrivacy in Communication Networks, 2006, pp. 1–11.
[28] Sensor Technologies and Systems, Forwardlooking vehicle radar system (FLVRS), http://www.sensor-tech.com/sub%20pages/products/AUTOMOTIVE/flvrs.html (2006).
[29] Toyota, Pre-crash safety, http://www.toyota.co.jp/en/about_toyota/in_the_world/pdf2007/safety.pdf (2007).
[30] US Department of Transportation, National Highway Traffic SafetyAdministration, Event data recorders, Federal Motor Vehicle Safety Standards215 Part 49, Code of Federal Regulations Part 563 (2006).
[31] US Department of Transportation,National Highway Traffic Safety Administration, Event Data Recorders Q&As,www.nhtsa.dot.gov/staticfiles/DOT/NHTSA/Rulemaking/Rules/Associated%20Files/EDR_QAs_11Aug2006.pdf (Aug. 2006).
[32] M. Raya, P. Papadimitratos, I. Aad, D. Jungels, J.-P. Hubaux, Eviction ofmisbehaving and faulty nodes in vehicular networks, IEEE Journal on SelectedAreas in Communications 25 (8) (2007) 1557–1568.
[33] Z. J. Haas, A new routing protocol for the reconfigurable wireless networks, in:Proceedings of the IEEE Conference on Universal Personal Communications,Vol. 2, 1997, pp. 562–566.
[34] M. Kasemann, H. Fuler, H. Hartenstein, , M. Mauve, A reactive location servicefor mobile ad hoc networks, Tech. Rep. TR-02-014, Department of ComputerScience, University of Mannheim (2002).
34

[35] F. Picconi, N. Ravi, M. Gruteser, L. Iftode, Probabilistic validation ofaggregated data in vehicular ad-hoc networks, in: Proceedings of the ACMWorkshop on Vehicular Ad Hoc Networks (VANET), Los Angeles, CA, 2006,pp. 76–85.
[36] L. Tian, Y. Zhou, L. Tang, Improving GPS positioning precision by using opticalencoders, in: Proceedings of Intelligent Transportation Systems, Dearborn, MI,2000, pp. 293–298.
35