prototype development for self-cleaning csp...
TRANSCRIPT

Boston University Award # DE-EE0005794
--------------------------- PI: Malay Mazumder CoPI: Mark Horenstein, Nitin Joglekar Students: Jeremy Stark, Daniel Erickson, Fang Hao, Arash Sayyah, Steven Jung, Atri RayChowdhury, John Hudelson, Anne Raymond, Mathew Beardsworth, Daniel Neuman Abengoa Solar Inc. Adam Botts, David Powell, and Diego Arias Sandia National Lab: Cifford Ho and Cheryl Ghanbari
Prototype Development of Self-Cleaning CSP Collectors
1

Project Objectives
Maintain high optical efficiency of CSP systems by keeping solar collectors dust free
Proof-of-concept of Electrodynamic Screens (EDS) for self-cleaning solar concentrators
Prototype EDS-based self-cleaning solar collectors Dust removal efficiency > 90% Cleaning time period < 2 minutes Energy consumption < 0.1% of solar collector production Without requiring any water or manual labor
Complete lab and field evaluations of prototype EDS integrated mirrors in collaboration with Sandia National Lab and Abengoa Solar Inc.

Examples of Dust Deposition
Dust storms severely decrease power output
• Nellis Air Force Base Solar Plant (Nevada) • Currently, panels must be cleaned frequently with water.

Reflectance (CSP) and Transmission (CPV) Losses Reported from Different Plants
4
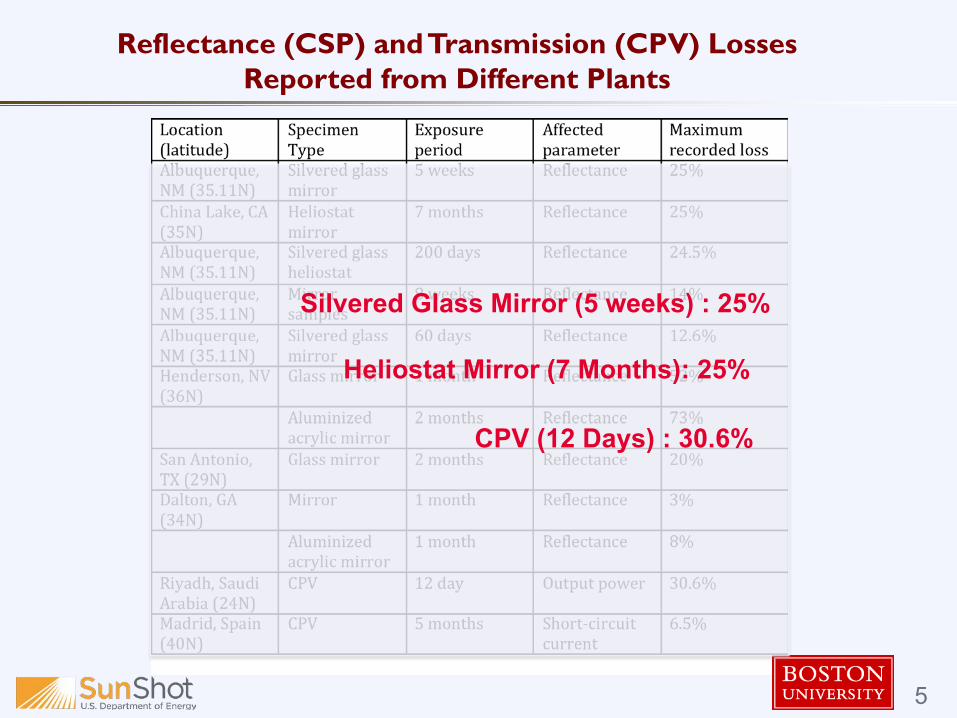
Reflectance (CSP) and Transmission (CPV) Losses Reported from Different Plants
5
Silvered Glass Mirror (5 weeks) : 25%
Heliostat Mirror (7 Months): 25%
CPV (12 Days) : 30.6%
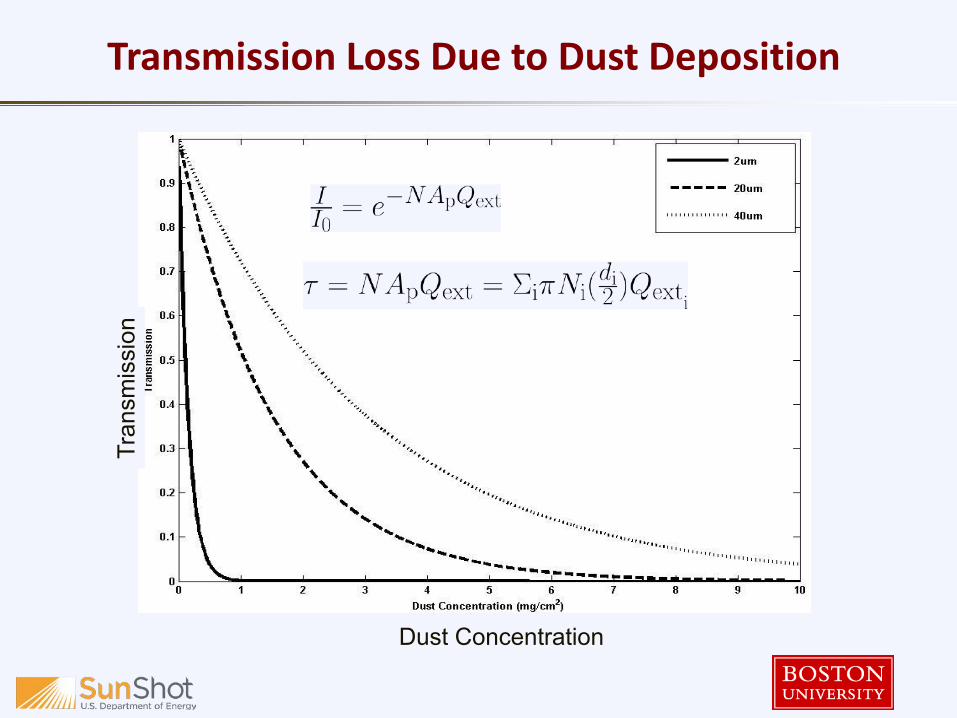
Transmission Loss Due to Dust Deposition
Dust Concentration
Tran
smis
sion
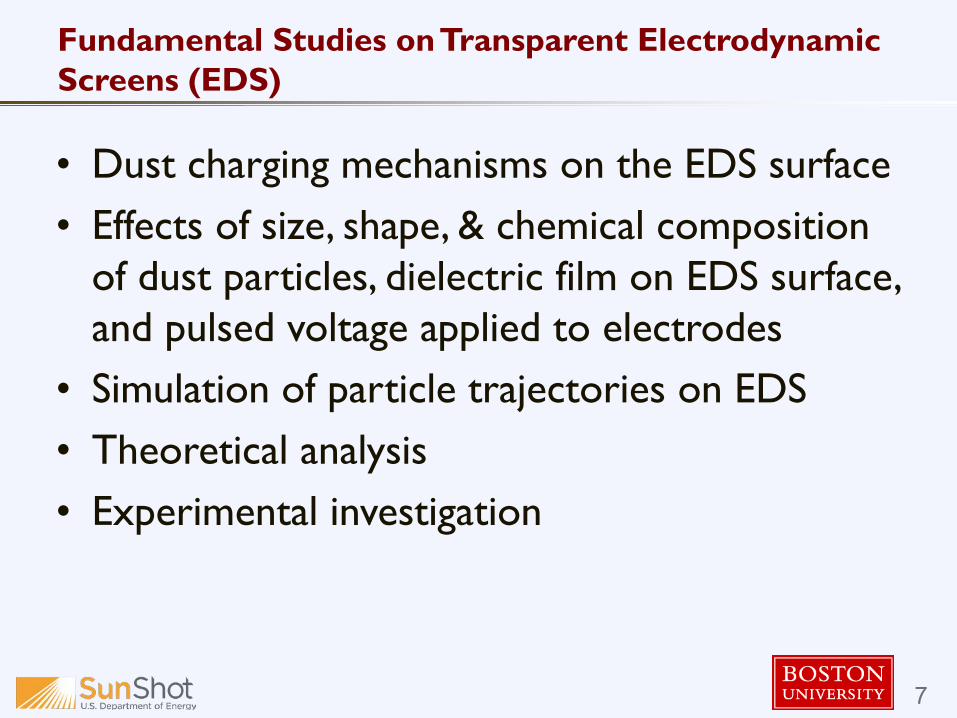
• Dust charging mechanisms on the EDS surface • Effects of size, shape, & chemical composition
of dust particles, dielectric film on EDS surface, and pulsed voltage applied to electrodes
• Simulation of particle trajectories on EDS • Theoretical analysis • Experimental investigation
Fundamental Studies on Transparent Electrodynamic Screens (EDS)
7

Fundamental Studies of EDS Operation
Particle adhesion and removal forces Forces of particle adhesion: Fadh = Fvdw + Fim + FAB + FCB + Fg
Gravitational force: Fg = md g, Van der Waals force, Fvdw = Ad/(12 z2), Capillary force of attraction due to surface tension: Fs = 2πdγcosθ+ 2πdγsl, Image force of adhesion: Fim = q2/(16 π εoεd t2) Repulsive forces for dust removal during EDS operation: Coulomb Repulsive Force: Fc = qdE Dielectrophoretic (DEP) Force Fd= (P∇)E The ratio of maximum repulsion force to the maximum force of
attraction: E(z)max. qmax,/ Fadh (max) = E(z)max. qmax / qmax2/(16 π εoεd t2)]

Ratio of repulsion to adhesion forces
9 (RH <50%)

Methodology and Approach for EDS Use
Solar Panel
Forces:
Particles
Account for all forces on a single particle and compute its trajectory
3-Phase Electrodes
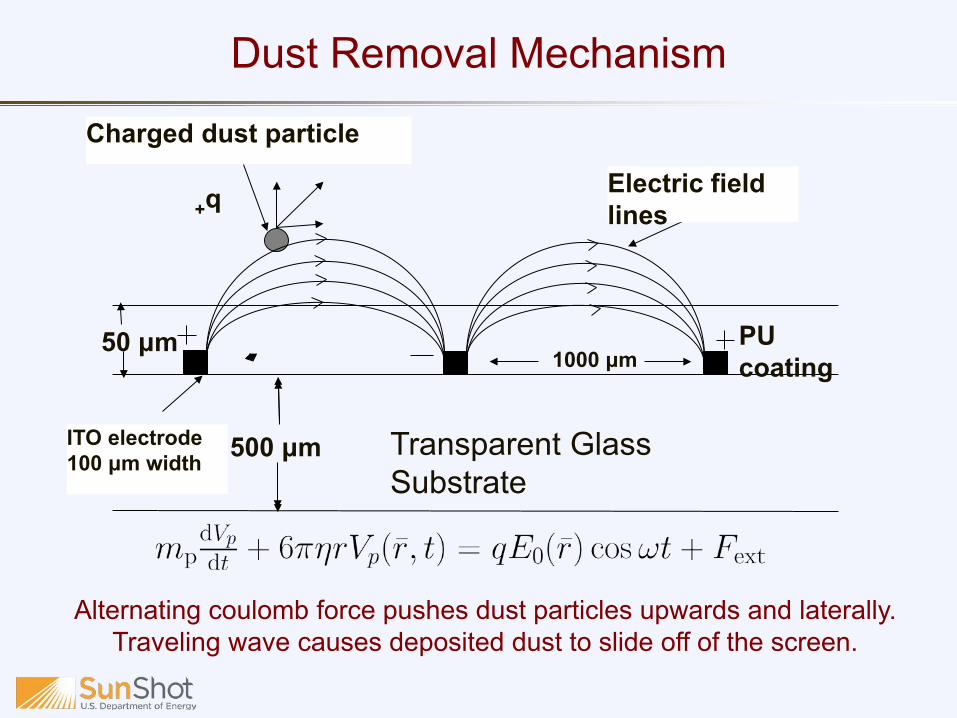
Charged dust particle
+q
Transparent Glass Substrate
1000 μm
500 μm
PU coating
ITO electrode 100 μm width
Electric field lines
Charged dust particle
50 μm
Alternating coulomb force pushes dust particles upwards and laterally. Traveling wave causes deposited dust to slide off of the screen.
Dust Removal Mechanism

Electrodynamic screen integrated with solar-concentrator mirror (1) Fluoropolymer film (2) Thin layer of SiO2
(3) Parallel transparent electrodes (4) Borosilicate glass plate (5) Silver coating of back-surface reflectors
Optical Modeling Analysis (Collaboration with Sandia National Labs)

CPV Optics with EDS
13
Solar Radiation
Fresnel Lens
Power Output
CPV EDS

Reflection efficiency by PU film (50 μm)
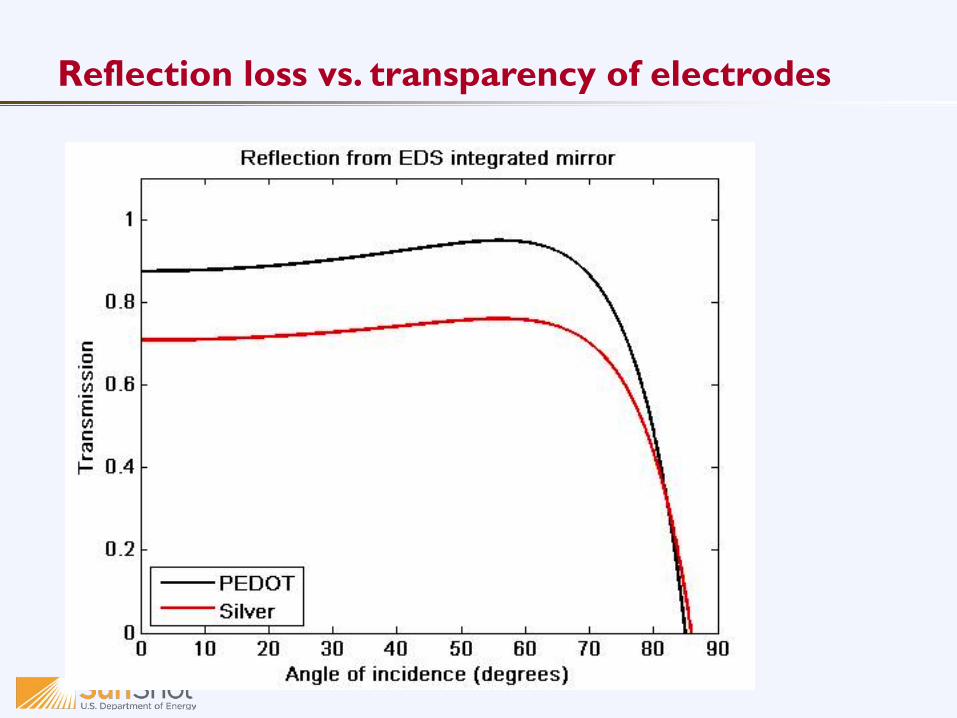
Reflection loss vs. transparency of electrodes
Substrates: Borosilicate glass, Heliostat mirrors, Polymer films
Electrodes: Silver ink, PDOT:PSS, Silver nanowires, AZO
Dielectric Film: Polyurethane, Urethane, ETFE, Tefzel
Dust Samples: Sample dust from different deserts: Mojave Desert, Negev Desert, Gobi Desert, dust samples from Abu Dhabi, Saudi Arabia
Materials being studied
16

Surface treatment of substrates (Borosilicate glass or Second surface mirrors)
Deposition of electrodes – Screen-printing – Ink-jet printing – Photolithography
Application of transparent dielectric film to embed electrodes
Production of power supplies, interconnection to EDS EDS testing for dust removal
Prototype EDS Development

Images of Screen-Printed EDS
18
Finished EDS fabricated with screenprinting Dielectric stop-gap printed over one phase
First screen printing: two electrode phases Third phase printed on the dielectric stop-gap
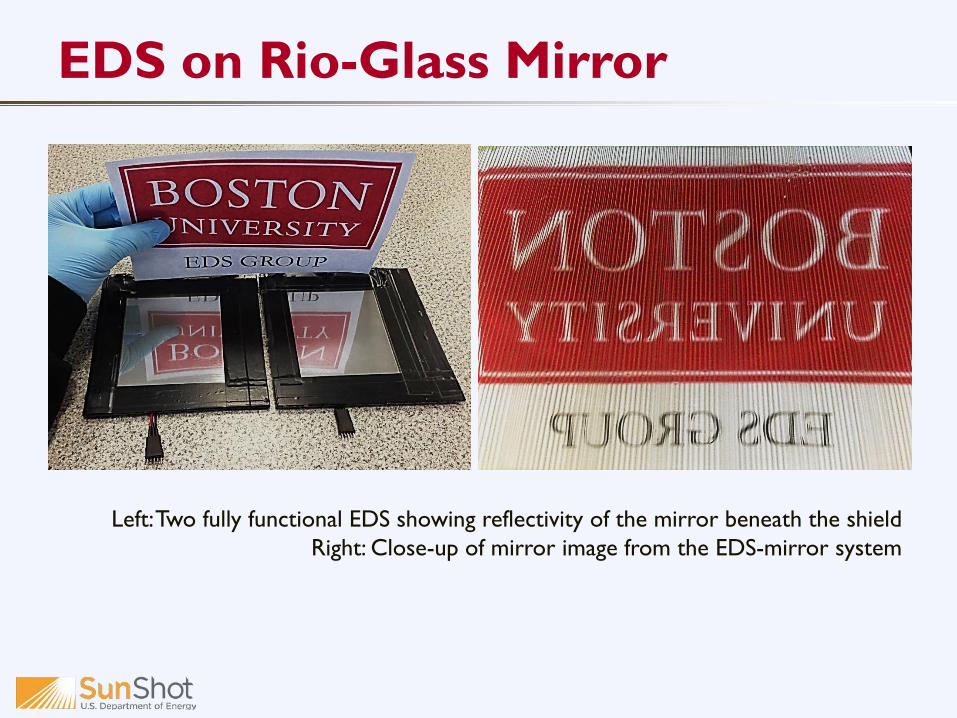
EDS on Rio-Glass Mirror
Left: Two fully functional EDS showing reflectivity of the mirror beneath the shield Right: Close-up of mirror image from the EDS-mirror system

EDS with transparent conducting ink
20

Low Frequency Low-Power Pulsed HV Supply
Power management
• CSP self-powers its own EDS • Cleaning is automatically triggered by dust sensor on panel • Operation for short periods only (not continuous)

Electrostatic Charging of Particles by EDS
22

Surface mass concentration of desert dust on EDS surface
23

EDS Dust Removal Efficiency
24

Water Cleaning vs. EDS Cleaning
25
Efficiency Comparison
EDS
Status Quo
0 Time (days) 180
100%
70% Water Cleaning

EDS Cost Analysis (Collaboration With Abengoa Solar Inc.)
Accomplishments • Development of manufacturing cost module
oCollaboration with Abengoa Solar regarding input parameters
oAddition of power supply to cost module oModule analysis to isolate cost drivers
» Cost driver variation analysis • Operational cost module progress
oGathered data for general EDS operational expression
*EDS prototype module pertains to 15cm square borosilicate substrate

Modeling Overview
27
EDS Cost Model
Manufacturing/Assembly Module Financial Module Operations Module
Purpose: To qualify major cost elements, and provide economic insights on tradeoffs associated with design and operational decisions

Cost Breakdown
Cost Analysis for Prototype Production
28
1
Cost Breakdown
Other Fixed
Tooling
Equip
Energy
Labor
Material
Other Fixed
Equipment
Labor
Material
Sample output of fixed and variable cost breakdown for the manufacturing-cost model
100%
60%
80%
40%
20%
0%

EDS Payback Time Period Analysis Based on estimated EDS cost* per m2
-$14.00
-$12.00
-$10.00
-$8.00
-$6.00
-$4.00
-$2.00
$0.00
$2.00
0 2 4 6 8 10
Tota
l Ben
efit
($)
EDS Lifetime (Years)
Total Benefit vs. EDS lifetime
Data taken from manufacturing cost module estimates

Conclusions Our Studies Show Feasibility of: Production and Evaluation of Self-cleaning CSP Optics Demonstration of Low-cost Self-cleaning Technology to Industry Partners, Investors (Abengoa Solar Inc.) Modeling and Field Testing at Sandia National Labs Partnership with Manufacturing Companies Cost-analysis of prototype production and scale-up Cost-effective application of EDS in CSP, CPV, and PV Optics
Video Demonstration
31

Abengoa Solar Sandia National Laboratories
32
Acknowledgement