proteome analysis of early lineage specification in bovine embryos
TRANSCRIPT
www.proteomics-journal.com Page 1 Proteomics
Received: 02-Jun-2014; Revised: 19-Jul-2014; Accepted: 14-Aug-2014
This article has been accepted for publication and undergone full peer review but has not been through the copyediting,
typesetting, pagination and proofreading process, which may lead to differences between this version and the Version of
Record. Please cite this article as doi: 10.1002/pmic.201400251.
This article is protected by copyright. All rights reserved.
Proteome analysis of early lineage specification in
bovine embryos
Myriam Demant1,a
, Daniela R. Deutsch1,a
, Thomas Fröhlich1,
Eckhard Wolf
1, 2, Georg J.
Arnold1,*
1Laboratory for Functional Genome Analysis (LAFUGA), Gene Center, Ludwig-
Maximilians-Universität München, Munich, Germany
2Chair for Molecular Animal Breeding and Biotechnology, Department of Veterinary
Sciences and Gene Center, Ludwig-Maximilians-Universität München, Munich, Germany
aThese authors contributed equally to this work.
*Corresponding author:
Dr. Georg J. ARNOLD
Laboratory for Functional Genome Analysis LAFUGA,
Gene Center
Ludwig-Maximilians-Universität München,
Feodor-Lynen-Str. 25
D-81377 Munich
Germany
Phone: ++49-89-2180-76825
Fax: ++49-89-2180-76848
E-Mail [email protected]
www.proteomics-journal.com Page 2 Proteomics
This article is protected by copyright. All rights reserved.
Abbreviations
COC, cumulus-oocyte complex; ECS, estrous cow serum; EGA, embryonic genome
activation; ESC, embryonic stem cells; ICM, inner cell mass; IPS, internal pooled standard;
MET, maternal-to-embryonic transition; PG, prostaglandin; ROS, reactive oxygen species;
SOF, synthetic oviduct fluid; TCM, tissue culture medium; TE, trophectoderm;
Keywords
Blastocyst, embryo, iTRAQ, pluripotency, saturation DIGE
Total number of words:
10,150
Abstract
During mammalian embryo development, the zygote undergoes embryonic cleavage in the
oviduct and reaches the uterus at the morula stage, when compaction and early lineage
specification take place. To increase knowledge about the associated changes of the
embryonic protein repertoire, we performed a comprehensive proteomic analysis of in vitro
produced bovine morulae and blastocysts (6 biological replicates), using an iTRAQ-based
approach. A total of 560 proteins were identified of which 502 were quantified. The
abundance of 140 proteins was significantly different between morulae and blastocysts,
among them nucleophosmin (NPM1), eukaryotic translation initiation factor 5A-1 (EIF5A),
receptor of activated protein kinase C 1 (GNB2L1/RACK1) and annexin A6 (ANXA6) with
increased, and glutathione S-transferase mu 3 (GSTM3), peroxiredoxin 2 (PRDX2) and aldo-

www.proteomics-journal.com Page 3 Proteomics
This article is protected by copyright. All rights reserved.
keto reductase family 1 member B1 (AKR1B1) with decreased abundance in blastocysts.
73 % of abundance altered proteins increased, reflecting an increase of translation activity in
this period. This is further supported by an increase in the abundance of proteins involved in
the translation machinery and the synthesis of ATP. Additionally, a complementary 2D
saturation DIGE analysis led to the detection of protein isoforms, e.g., of GSTM3 and
PRDX2, relevant for this period of mammalian development, and exemplarily verified the
results of the iTRAQ approach. In summary, our systematic differential proteome analysis of
bovine morulae and blastocysts revealed new molecular correlates of early lineage
specification and differentiation events during bovine embryogenesis.
1 Introduction
Mammalian embryonic development starts with fertilization of a mature oocyte by a sperm
cell and subsequent formation of a single diploid cell, the zygote. While the zygote travels
through the oviduct towards the uterus, embryonic cleavage begins by mitotic divisions of the
embryonic blastomeres without significant overall growth of the early embryo. The first
obvious differentiation of blastomeres occurs during a process referred to as compaction,
which starts 5 days after fertilization at the so-called morula stage in the bovine system [1].
During compaction, the outer blastomeres of the embryo acquire an apical-basal polarity and
gain a tighter contact to each other by an increase of intercellular adhesions [2, 3]. This
process is accompanied by a loss of pluripotency and resembles the first lineage decision,
leading to the formation of trophectoderm (TE). The TE is a fluid-transporting epithelium
responsible for formation of the blastocoel, a fluid-filled cavity, during blastocyst
www.proteomics-journal.com Page 4 Proteomics
This article is protected by copyright. All rights reserved.
development [4] and resembles the progenitor cells of the embryonic part of the placenta. The
inner blastomeres of the compacted morula form the inner cell mass (ICM), i.e. the
pluripotent progenitor cells of the embryo proper. During further development, a second
lineage decision within the ICM cells results in primitive endoderm (PE) cells, an
extraembryonic lineage forming the yolk sac, and pluripotent epiblast (EPI) cells. The
epiblast differentiates during gastrulation, which gives rise to the 3 primary germ layers
endoderm, mesoderm and neuroectoderm [for review see 5-8]. The transcriptome changes
associated with these early lineage decisions have been extensively studied in the mouse
model. Expression of transcription factor genes necessary for maintenance of pluripotency,
e.g., POU domain, class 5, transcription factor 1 (POU5F1/OCT4) [9], SOX2 [10] and
homeodomain protein NANOG [11], becomes restricted to ICM cells. These restrictions
depend on the reciprocal action of the caudal-related homeobox 2 (CDX2) gene product,
which becomes expressed in TE cells [12-14]. Embryonic stem cells (ESC) derived from the
ICM of a blastocyst have the ability to grow indefinitely while maintaining pluripotency [15].
The expression of pluripotency master regulators during bovine preimplantation embryo
development has recently been investigated [16]. Low levels of POU5F1/OCT4 transcripts
were detected by RT-PCR analysis already in germinal vesicle (GV) oocytes and remained
unchanged until the 8- to 16-cell stage. The highest level of POU5F1/OCT4 expression was
observed at the early morula stage, and a significantly lower level in blastocysts. In situ
hybridization revealed the ubiquitous presence of POU5F1/OCT4 transcripts in the ICM and
TE of Day 7 and Day 8 blastocysts, whereas restriction of expression to the ICM became
apparent in Day 9 blastocysts. SOX2 mRNA was detected in the GV and metaphase II (MII)
oocyte stages, decreased significantly at the 4-cell stage, increased again at the 8- to 16-cell
stage, and reached the highest level of expression in the early morula. During blastocyst
development, the expression of SOX2 decreased and became restricted to the ICM at Day 8 of

www.proteomics-journal.com Page 5 Proteomics
This article is protected by copyright. All rights reserved.
development. NANOG transcripts were first detected in 8- to 16-cell embryos, reached the
highest level at the early morula stage and then slightly declined in blastocysts, where they
were restricted to the ICM. The authors concluded that the earlier ICM specification of
transcripts (and proteins) of SOX2 and NANOG makes them more pertinent candidates of
bovine pluripotent lineage specification than POU5F1/OCT4 [16]. Regarding the
commitment of TE in bovine blastocysts, Berg and coworkers [17] discovered that CDX2
expression is not essential in stages equivalent to mouse blastocysts, but is required later for
TE maintenance. Importantly, CDX2 does not repress POU5F1/OCT4 expression, which may
– at least in part – explain the relatively late restriction of its expression to the ICM of bovine
blastocysts.
Among all OMICS techniques currently available for embryo analyses, transcriptomic
approaches are most popular [18-21]. However, results obtained by the analysis of mRNA
cannot provide reliable information about the corresponding proteome status of a cell, due to,
e.g., post-translational modifications, proteolytic processes, or protein secretion, making
studies at the protein level indispensable [22, 23]. This holds especially true for the analysis
of embryonic stem cells, where alterations in nuclear protein levels observed after
downregulation of NANOG were not accompanied by concordant alterations in the
expression of corresponding mRNAs, thus indicating important roles for translational and
post-translational regulation of ESC fate [24].
Several holistic proteomic studies have targeted mammalian oocytes (for review see [25]),
but so far, only few studies addressing the period of first lineage decisions in embryonic
development have been performed [26-28]. In this manuscript, we describe a holistic
proteome approach addressing the morula to blastocyst transition, an important period during
early embryogenesis due to unique cell differentiation events and partial loss of pluripotency.
www.proteomics-journal.com Page 6 Proteomics
This article is protected by copyright. All rights reserved.
We chose the cow as a model for early human development, because it is increasingly used,
e.g. to study reproductive ageing in women [29, 30] and due to close similarities of the
bovine system to human reproductive biology in females: Both species are monovulatory,
non-seasonal polycyclic [31], and the duration of pregnancy is about 9 months. Moreover, the
kinetic of early bovine embryo development, e.g., the timing of embryonic genome activation
at the 8-cell stage [32, 33], resembles the human situation (major genome activation at the 4-
to 8-cell stage) much closer than the mouse model (major genome activation at the 2-cell
stage) (reviewed in [34]).
We present a comprehensive proteomic analysis of 6 biological replicates from in vitro
produced bovine morulae and blastocysts using an LC-MS/MS iTRAQ-based approach. In
addition, a complementary 2D saturation DIGE analysis led to the detection of abundance
altered isoforms of proteins relevant for this period of mammalian development, and
exemplarily verifies results of the iTRAQ approach.
2 Materials and Methods
2.1. Generation of GV oocytes and embryos
Ovaries were collected from a local slaughterhouse and stored for approximately 3 h in PBS
at 30 °C. To remove blood and debris, ovaries were washed 3 times in PBS at 30 °C.
Cumulus-oocyte complexes (COCs) were obtained by aspirating 2– to 8-mm follicles with a
20-gauge needle and a vacuum pressure of approximately 100 mm Hg. COCs which had at
least 1 layer of compact cumulus cells were selected and denuded mechanically by vortexing
for 4 minutes. Denuded GV oocytes were washed 3 times in PBS + 0.1 % PVP, frozen on dry
www.proteomics-journal.com Page 7 Proteomics
This article is protected by copyright. All rights reserved.
ice and stored at -80 °C until analysis. Embryos were prepared according to the procedure
described by Berg and Brem [35]. In brief, COCs which had at least 1 layer of compact
cumulus cells were selected and washed 3 times in oocyte maturation medium consisting of
tissue culture medium 199 (TCM 199, Minitüb, Tiefenbach, Germany) supplemented with
5 % estrous cow serum (ECS), 0.025 IU/ml b-FSH and 0.0125 IU/ml b-LH (Sioux
Biochemical, IA USA). COCs were transferred to 4-well plates (Nunc, Thermo Scientific,
Rockford, IL, USA) and matured in 400 µl of maturation media for 23 h at 39 °C in a
humidified atmosphere with 5 % CO2 in air. Matured COCs were washed 3 times in
fertilization medium consisting of TL fertilization media (Minitüb) enriched with 6 mg/ml
BSA, 22 µg/ml sodium pyruvate and 10 µg/ml heparin sodium salt. For fertilization, sperm
from the same bull was used in all experiments and frozen-thawed spermatozoa were
prepared by the “swim-up” procedure according to Parrish et al. [36]. About 5x10⁶ sperms
were coincubated with 20 to 40 oocytes in 400 μl fertilization medium for 18 h at 5 % CO2
and 39.0 °C. Presumptive zygotes were mechanically denuded by vortexing for 4 minutes and
washed 3 times in culture medium consisting of synthetic oviduct fluid (SOF, Minitüb)
supplemented with 5 % ECS, 1 % minimum essential medium non-essential amino acids
solution, 4 % basal medium Eagle amino acids solution and 0.36 mg/ml sodium pyruvate,
followed by a transfer to 400 μl droplets of culture medium under mineral oil in 4-well
dishes. Embryos were incubated in a humidified atmosphere with 5 % CO2, 5 % O2, and
90 % N2, at 39 °C. Both compacted and not compacted morulae were collected 5 days post
fertilization when they had at least 32 blastomeres (day of fertilization = day 0). Blastocysts
in the expanded and not-expanded stage were collected 7 days post fertilization when they
showed a blastocoel surrounded by TE and a clearly developed ICM. All embryos were
microscopically evaluated prior to collection and washed 3 times in PBS + 0.1 % PVP before
they were frozen on dry ice in pools of 25 embryos each and stored at -80°C until analysis.
www.proteomics-journal.com Page 8 Proteomics
This article is protected by copyright. All rights reserved.
2.2. Sample preparation and iTRAQ analysis
For iTRAQ analysis, 6 biological replicates of 25 morulae and 25 blastocysts each
(corresponding to 2.25 µg protein each) were lysed in 3.2 µl denaturation buffer (8 M urea,
0.4 M NH4HCO3, pH 8.0) per replicate (0.128 µl per embryo) and homogenized by ice-
cooled sonication for 15 min (Sonorex RK100, Bandelin, Berlin, Germany). To reduce and
block cysteine residues, samples were incubated with 45 mM DTT in 50 mM NH4HCO3 for
30 min at 55 °C, followed by 15 min incubation with 100 mM iodacetamide in 50 mM
NH4HCO3. Samples were diluted to a ratio of 1:8 with 50 mM NH4HCO3 and 5 ng modified
porcine trypsin (Promega) was added per embryo. Samples were incubated overnight at
37 °C, dried in a vacuum centrifuge (vacuum concentrator, Bachofer, Reutlingen, Germany)
and stored at -80 °C until analysis. For iTRAQ-LC-MS/MS analysis, samples containing the
proteins of 25 embryos each were cleaned up by ZipTips (ZipTips µ-C18, Millipore,
Schwalbach) and dried in a vaccum centrifuge (vacuum concentrator, Bachofer). For iTRAQ
labelling, samples were dissolved in 4.2 µl (168 nl per embryo) iTRAQ dissolution buffer
(AB SCIEX, Framingham, MA, USA) and per embryo, 1 % iTRAQ vial content was added
(iTRAQ-4plex kit, AB SCIEX, Framingham, MA, USA; iTRAQ vials contained an
undisclosed concentration of reagent suitable to label 5 to 100 µg of protein). Three
biological replicates of morulae were individually labelled with the iTRAQ label 114 and the
remaining 3 replicates of morulae were individually labelled with the iTRAQ label 116. The
same procedure was performed for labelling the 6 replicates of blastocysts using iTRAQ
labels 115 and 117. The labelled morulae and blastocysts peptides were combined into 3
different pools, so that each pool consisted of 2 biological replicates of morula and blastocyst
and all 4 iTRAQ labels. After 1 h incubation time, samples were dried in a vacuum centrifuge
(vacuum concentrator, Bachofer) and stored at -20 °C until analysis. For 2D-LC MS/MS
www.proteomics-journal.com Page 9 Proteomics
This article is protected by copyright. All rights reserved.
analysis, peptides were SCX prefractionated online using (i) 0, (ii) 10, (iii) 25, (iv) 50, (v)
100 and (vi) 500 mM NH4Cl solutions for elution. Peptides were trapped at 10 µL/min on a
guard column packed with C18 PepMap 100, 5 µm, 300 µm x 5 mm (LC Packings/Dionex,
Idstein, Germany) and separated at a constant flow rate of 260 nL/min by reversed phase
chromatography (ReproSil-Pur 120 C18 AQ, 3 µm bead size, 150 mm column length, 75 µm
i.d., Dr. Maisch, Ammerbuch-Entringen, Germany) with the following gradient: 0–30 % B in
80 min, 30–60 % B in 30 min, 100 % B for 10 min (eluent A: 0.1 % FA, eluent B: 84 %
ACN, 0.1 % FA). The chromatographic system (Ettan MDLC; Amersham Biosciences,
Freiburg) was coupled to an Orbitrap XL instrument (Thermo Scientific, Rockford, IL, USA)
via a distal coated SilicaTip (FS-360-20-10-D-20, New Objective, Woburn, MA, USA) at a
needle voltage of 1.4 kV. The MS method consisted of cycles of 1 full MS scan (Mass range:
300–1800 m/z) followed by 3 data dependent CID and HCD MS/MS scans each with 35 %
collision energy and a dynamic exclusion of 180 s after 2 repeat counts. Each of the 6 SCX
salt fractions was measured twice consecutively with the application of an additional mass
exclusion list containing precursor ion masses of the peptides identified in the preceding runs.
Mass exclusion lists were generated using Proteome Discoverer 1.1 (Thermo Scientific,
Rockford, IL, USA).
2.3. iTRAQ data analysis
The raw data was processed using Proteome Discoverer TM (version 1.4.1.14, Thermo Fisher
Scientific). MS2 spectra were searched with SEQUEST HT and MASCOT search engines
against the Uniprot database version of 5/15/2014 using the following parameters: i) Enzyme:
Trypsin, ii) Fixed modification: Carbamidomethyl (C) and iTRAQ4plex/144.102 Da (K, N-
Terminus), iii) Variable modifications: Oxidation (M), iv) MS tolerance: 10 ppm, v) MS/MS
tolerance: 0.8 Da (for CID spectra) and 20 mmu (for HCD spectra), vi) allow up to 2 missed

www.proteomics-journal.com Page 10 Proteomics
This article is protected by copyright. All rights reserved.
cleavages. Peptide spectra matches (PSM) were validated using percolator based on q-values
at a 1 % FDR [37]. Peptide identifications were grouped into proteins according to the law of
parsimony and filtered to 1 % FDR [38]. Identified proteins were grouped using the “apply
strict maximum parsimony principle” parameter. To quantify iTRAQ ratios, a 20 ppm mass
tolerance of reporter ions and the “Apply Quan Value Corrections” feature in the Reporter
Ions Quantifier node of Proteome Discoverer TM was used. The ratios of 115/114 and
117/116 were calculated, expressed as a median value of the ratios for all quantifiable spectra
of the peptides pertaining to that protein. In a specific case when an even number of peptide
spectra contributed to a given protein ratio calculation, a geometric average of the 2 middle
values was used. All quantification data were exported to Microsoft Office Excel (2010),
which was used for calculation of mean log2 fold changes. For the comparison of morulae
and blastocysts, the calculations of FDR corrected student’s t-test p-values (q-values) and the
generation of a Volcano plot were performed by the R-Software (R Development Core Team,
2011). Proteins which had a q-value of < 0.05 and an average log 2 fold change of ≥ |0.6|
were considered as differentially abundant proteins.
2.4. Sample preparation for 2D Saturation DIGE analyses
For analytical 2D Saturation DIGE gels, 6 biological replicates of 25 morulae and 25
blastocysts each (corresponding to 2.25 µg protein each) were lysed with 4 µL DIGE
denaturation buffer (30 mM tris, 7 M urea, 2 M thiourea, 4 % (w/v) CHAPS, pH 8.0) per
replicate (0.16 µl per embryo). For lysis of GV oocytes used for preparative gels, 0.03 µl
lysis buffer per oocyte was added to pools of 186 to 495 GV oocytes. Samples were
homogenized by ice-cooled sonication for 5 min (Sonorex RK100, Bandelin, Berlin,
Germany) followed by freezing on dry-ice for 5 min. The procedure of sonication and
freezing was repeated 3 times in total. All GV oocyte samples for the preparative gel were
www.proteomics-journal.com Page 11 Proteomics
This article is protected by copyright. All rights reserved.
pooled and the final protein concentration was determined by a standard Bradford assay
according to the manufacturer's protocol (Pierce/Thermo Scientific, Rockford, IL, USA)
before they were stored at -80 °C.
2.5. Labelling of proteins with fluorescent Cyanine (Cy) Dyes for analytical gels
A total of 15 µg internal pooled standard (IPS) was prepared by pooling 1.25 µg protein of
each morula and blastocyst sample which was labelled with Cy3 (CyDye DIGE Fluor, GE
Healthcare). The remaining 1 µg from each sample was labelled with Cy5 (GE Healthcare)
according to the manufacturer’s protocol. In brief, cysteine residues were reduced with
0.5 nmol/µg TCEP and samples were incubated at 37 °C for 1 h in the dark. Cy Dyes were
reconstituted in DMF to give a 2 mM solution and added to the samples in a concentration of
1 nmol/µg protein before incubation at 37 °C for 30 min in the dark. The labelling reaction
was stopped by addition of an equal volume of stop buffer (7 M urea, 2 M thiourea, 4 %
(w/v) CHAPS, 2 % (v/v) pharmalytes, 130 mM DTT).
2.6. Labelling of proteins with fluorescent Cy3 for the preparative gel
A total of 400 µg GV oocyte proteins (corresponding to 4444 GV oocytes) was diluted with
lysis buffer to a final protein concentration of 2 mg/ml. Labelling with Cy3 (GE Healthcare)
was performed according to the manufacturer’s protocol. The labelling reaction was stopped
by addition of an equal volume of stop buffer (7 M urea, 2 M thiourea, 4 % (w/v) CHAPS,
3 % (v/v) pharmalytes, 361 mM DTT).
2.7. Two-dimensional electrophoresis (2D DIGE)
For analytical gels, IEF Immobiline DryStrips pH 4–7, 24 cm (GE Healthcare), were
rehydrated overnight in 450 µl rehydration buffer (13 mM DTT, 7 M urea, 2 M thiourea, 4 %

www.proteomics-journal.com Page 12 Proteomics
This article is protected by copyright. All rights reserved.
(w/v) CHAPS, 1 % (v/v) pharmalytes) using a reswelling tray (GE Healthcare) overlaid with
DryStrip Cover Fluid (GE Healthcare) to prevent evaporation. For each biological replicate, a
total of 0.25 µg of Cy5 labelled morula or blastocyst samples were mixed with 0.25 µg Cy3
labelled IPS. IEF was performed using an Ettan IPGphor (Pharmacia Biotech, Freiburg).
Samples were applied to the first dimension gel using anodic cup loading. Focusing was done
for a total of 38.25 kVh. Prior to SDS-PAGE, IEF strips were equilibrated for 10 min in
15 ml equilibration buffer containing 200 µl saturated bromophenol blue solution.
For preparative gels, IEF Immobiline DryStrips pH 4–7, 24 cm (GE Healthcare), were
rehydrated overnight with the labelled GV oocyte sample. Focusing was performed for
56.5 kVh. Prior to SDS-PAGE, IEF strips were equilibrated for 10 min in 15 ml equilibration
buffer containing 200 µl saturated bromophenol blue solution. 12 % SDS PAA gels (25.5 cm
× 19 cm × 0.1 cm) were casted in an Ettan DALTtwelve gel caster (GE Healthcare), overlaid
with water and polymerized overnight. IPG strips were loaded onto the second dimension
gels and overlaid with 0.5 % w/v agarose in SDS running buffer (25 mM tris, 192 mM
glycine, 0.1 % w/v SDS) and electrophoresis was performed using an Ettan DALTsix
electrophoresis unit (GE Healthcare). Gels were run in groups of 6 with 10 mA per gel for 1 h
followed by 40 mA per gel for 6 h in 1 x SDS running buffer for the anodic chamber and
2 x SDS running buffer for the cathodic chamber.
2.8. Scanning and evaluation of 2D saturation DIGE gels
Gels were scanned using a Typhoon 9400 fluorescence scanner (GE Healthcare), with a
photomultiplier voltage of 670 V and a pixel size of 100 µm. Images were visualized by
scanning with a wavelength of 584 nm and 684 nm for Cy3 and Cy5, respectively. Images
were manually cropped to the same size by the image editor software prior to the evaluation
by the De-Cyder 6.5 software (GE Healthcare). Spots were detected with the software’s

www.proteomics-journal.com Page 13 Proteomics
This article is protected by copyright. All rights reserved.
differential in gel analyses (DIA) tool. The spot detection parameter “estimated number of
spots” was set to 10,000, and spots with a volume lower than 30,000 were excluded. Spot
matching, intergel intensity comparisons and statistical analyses were performed with the
software’s biological variation analysis (BVA) tool. FDR correction for student’s t-test p-
values was applied to give q-values, and spots which met the criteria of q < 0.05 and which
were detected within all gel images were considered as spots of differentially abundant
proteins.
2.9. Identification of differentially abundant protein spots
The preparative gel was scanned by the Typhoon 9400 fluorescence scanner and the
fluorescence image was imported to the SPControl software (Bruker Daltonics, Bremen) used
for set up of the spot picking robot (PROTEINEER spII, Bruker Daltonics). Spots from
differentially abundant proteins were manually assigned and picked by the spot picker. The
gel was rescanned by the Typhoon 9400 fluorescence scanner and controlled for the correct
cut out of spots. The spots were washed 4 times in 50 mM NH4HCO3, and tryptic hydrolysis
was performed overnight at 37 °C in 20 µl 50 mM NH4HCO3 supplemented with 100 ng
modified porcine trypsin (Promega, Wisconsin, USA) per spot. The supernatant was collected
and further extraction of peptides was performed by 10 min treatment with 40 µl 70 % ACN.
The NH4HCO3 and ACN fractions were pooled, evaporated to dryness under vacuum
(vacuum concentrator, Bachofer) and stored at -80 °C until analysis. Peptide solutions
(0.1 %FA) were injected and trapped at 10 µL/min on a guard column packed with C18
PepMap 100, 5 µm, 300 µm x 5 mm (LC Packings/Dionex, Idstein, Germany) and separated
at a constant flow rate of 260 nL/min with a 15 cm separation column (ReproSil-Pur 120 C18
AQ, 3 µm bead size, 75 µm i.d., Dr. Maisch, Ammerbuch-Entringen, Germany) with the
following gradient: 0–60 % B in 30 min, 100 % B for 10 min (eluent A: 0.1 % FA, eluent B:
www.proteomics-journal.com Page 14 Proteomics
This article is protected by copyright. All rights reserved.
84 % ACN and 0.1 % FA). The chromatographic system (Ettan MDLC; Amersham
Biosciences, Freiburg) was coupled to an Orbitrap XL instrument (Thermo Scientific,
Rockford, IL, USA) via a distal coated SilicaTip (FS-360-20-10-D-20, New Objective,
Woburn, MA, USA) at a needle voltage of 1.6 kV. The MS method consisted of cycles of 1
full MS scan (Mass range: 300–1800 m/z) and 5 data dependent MS/MS scans. MS/MS
spectra were generated in the CID cell of the mass spectrometer with 35 % collision energy,
and dynamic exclusion was set to 180 s.
The raw data was processed using Proteome Discoverer TM (version 1.4.1.14, Thermo Fisher
Scientific). MS2 spectra were searched with the MASCOT search engines against the Uniprot
database version of 5/15/2014 using the following parameters: i) Enzyme: Trypsin, ii) Fixed
modification: Carbamidomethyl (C) iii) Variable modification: Oxidation (M), iv) MS
tolerance: 10 ppm, v) MS/MS tolerance: 0.8 Da and vi) allow up to 2 missed cleavages.
Identified proteins were grouped using the “apply strict maximum parsimony principle”
parameter. Only proteins with at least 2 peptides having a MASCOT peptide score of ≥ 30
and and a MASCOT protein score of ≥ 95 were considered as valid identification. Proteins
which are known as common contaminants were not considered.
2.10. Network analysis
For functional annotation clustering and network analysis of proteins, the Cytoscape 3.1.0
plug-ins ClueGO v2.0.8 [39] and CluePedia v1.0.9 [40] were used. GO tree levels 5 to 6 were
displayed with a minimum number of 2 genes per cluster. For statistics, the right-sided
hypergeometric test was used to calculate enrichment for terms and groups according to
either the GO biological process or cellular component. Functional grouping was based on κ-
score (> 0.3) and GO term fusion was activated for redundancy reduction.
www.proteomics-journal.com Page 15 Proteomics
This article is protected by copyright. All rights reserved.
3 Results
3.1. Comparative proteomic analysis of morulae and blastocysts by iTRAQ
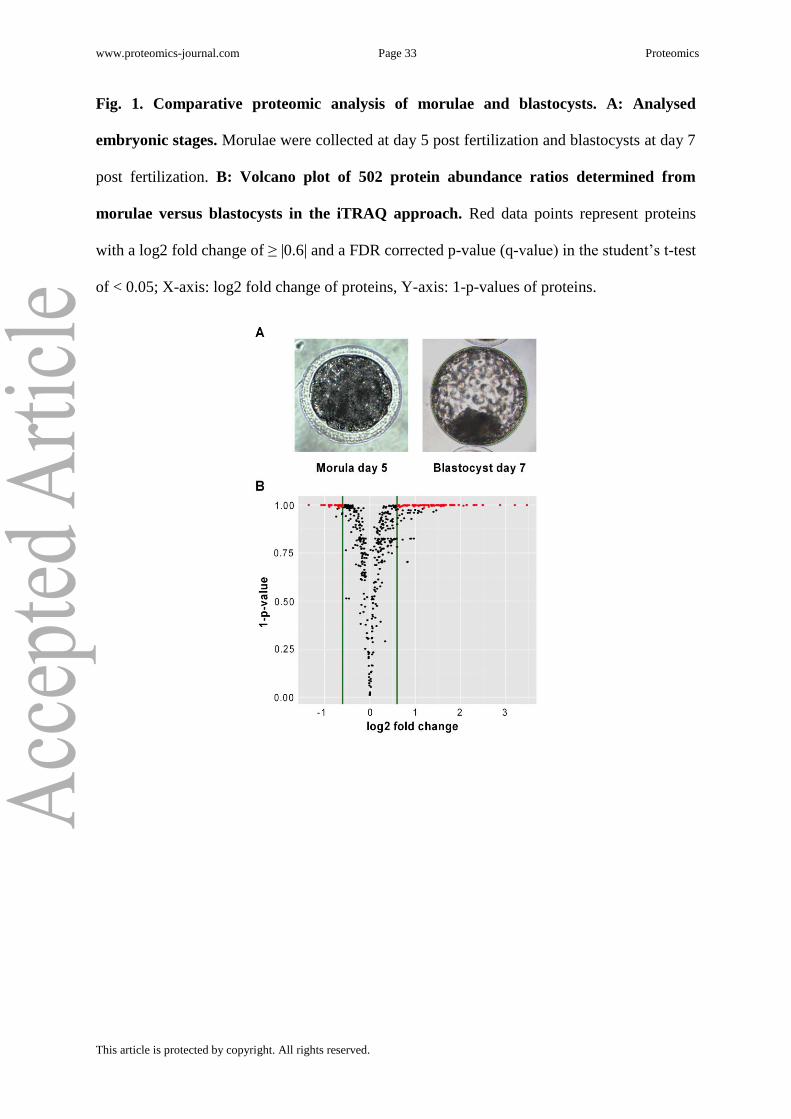
Prior to collection, all embryos were microscopically evaluated (Fig. 1A). Both compacted
and not compacted morulae were collected 5 days post fertilization when they had at least 32
blastomeres. Blastocysts in the expanded and not-expanded stage were collected 7 days post
fertilization when they showed a blastocoel surrounded by TE and a clearly developed ICM.
A simultaneous analysis of the proteomes of morulae and blastocysts was performed by the
4-plex iTRAQ strategy introduced by Ross et al. [41], which had been downscaled to
facilitate the analysis of limited sample amounts. Prefractionation by SCX was applied and
each SCX fraction was split into 2 aliquots which were subsequently analysed by LC-
MS/MS. Manually established exclusion lists were applied to the second run, which
contained precursor masses already identified in the first run. A total of 560 proteins were
identified and 502 were quantified. The complete list of protein IDs can be viewed in
Supplementary Table 1, and their abundance ratios and q-values are illustrated in the Volcano
plot in Fig. 1B. The abundance of 140 proteins was significantly altered between morulae and
blastocysts (log2 fold change ≥ |0.6|, q-value < 0.05), and corresponding ratios are
represented as red data points in Fig. 1B (159 proteins without FDR correction). Protein IDs
of the 25 most significantly abundant proteins, based on q-value calculation, are listed in
Table 1, and the complete list of differently abundant proteins is presented in Supplementary
Table 2.
3.2. Comparative proteomic analysis of morulae and blastocysts by 2D saturation DIGE
A 2D saturation DIGE analysis was performed from 6 biological replicates of morulae and
blastocysts each (Fig. 1A). Inter-gel normalization and comparisons between gels were
facilitated by an IPS. Two 2D gels per biological replicate containing 250 ng IPS (protein

www.proteomics-journal.com Page 16 Proteomics
This article is protected by copyright. All rights reserved.
amount corresponding to less than 3 embryos) and 250 ng sample were analysed.
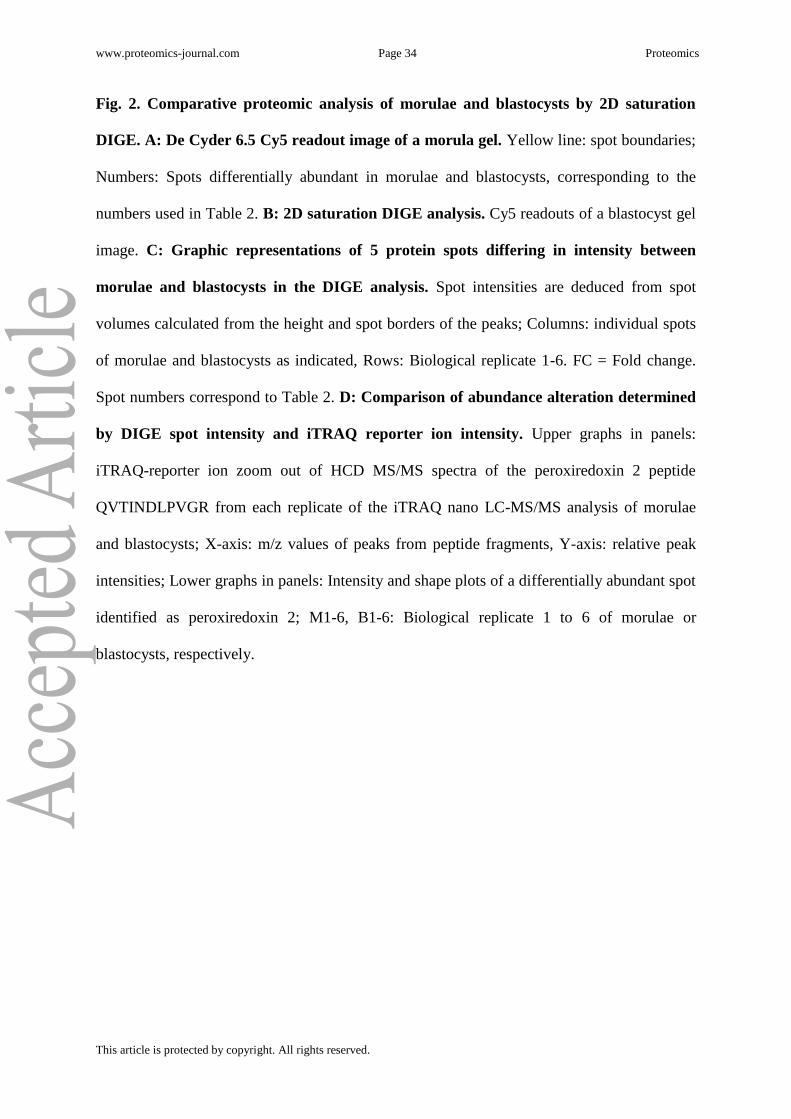
Representative Cy5 gel images of proteins from morulae and blastocysts are shown in Fig.
2A and Fig. 2B, respectively, demonstrating the high separation strength in both dimensions
as well as the absence of over- and under-labelling artefacts.
Image analysis performed by the DeCyder 6.5 software led to the detection of at least 2,948
spot signals per gel, of which 2,024 signals were matched and quantified for all biological
replicates. Hence, the latter can be considered to represent true protein spots rather than
artificial signals. Spot intensity ratios between morulae and blastocysts were determined, and
a FDR correction according to Benjamini and Hochberg [43] was applied to further minimize
the detection of false protein abundance alterations. Proteins were considered as differentially
abundant when corresponding spot ratios led to q-values lower than 0.05 and spots were
detected on all gel images. Using these criteria, a total of 61 protein spots showed differential
intensity, among which 32 spots showed an intensity ratio of log2 fold change ≥ │0.6│. In
Fig. 2A, a Cy 5 morula gel image is depicted in which the spots of differentially abundant
proteins are marked. Fig. 2C illustrates the high reproducibility of quantification throughout
all 6 biological replicates by representative 3D intensity shape plots of differentially abundant
proteins. For MS/MS protein identification from saturation DIGE gels, a preparative gel
containing 400 to 500 microgram labelled protein is mandatory, requiring 4,000 to 5,000
oocytes or embryos. Due to high costs of embryo generation, 4,444 denuded GV oocytes
were used as a source for protein identification. To ensure a comparable running behaviour
between analytical and preparative gels, the GV oocyte protein samples were also labelled
with saturation dyes. The gel spots from the Cy3 readout of the preparative gel were matched
with corresponding positions on the analytical gels (Supplementary Fig. 1). The matching of
differentially abundant protein spots was manually supervised. Spots were picked with a
“spot picking” robot, tryptically digested and analysed by LC-MS/MS. Only proteins which
www.proteomics-journal.com Page 17 Proteomics
This article is protected by copyright. All rights reserved.
were identified with at least 2 peptides (ion score ≥ 30) and a protein score of ≥ 95 were
accepted as correct identifications. In total, 34 out of 61 picked spots were identified, of
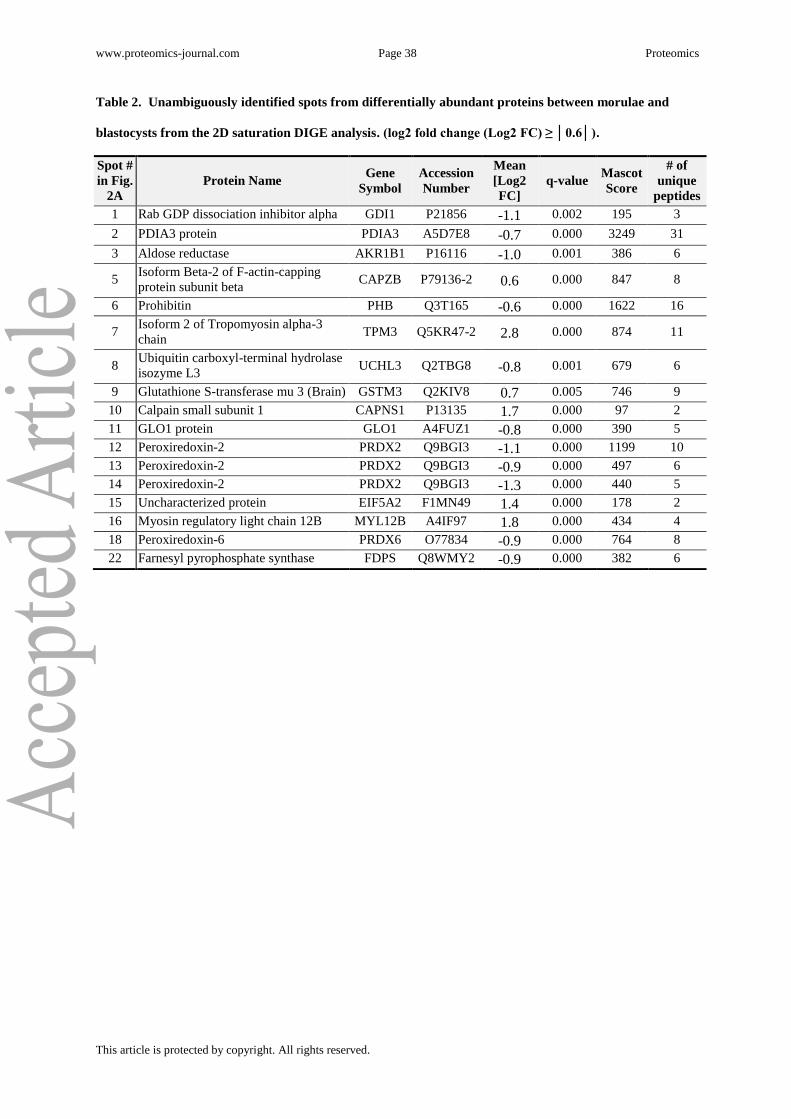
which 18 could be unambiguously assigned to a single protein (17 with log2 fold
change ≥ │0.6│) which are listed in Table 2 and Supplementary Table 3A. Another 11 spots
contained 2 proteins (Supplementary Table 3B) and 5 spots (4 with log2 fold
change ≥ │0.6│) contained 3 or more proteins (Supplementary Table 3C). Eleven proteins
were identified from 2 or more individual spots, indicating the presence of different isoforms
of these proteins. For example, 4 isoforms were detected for aldo-keto reductase family 1
member B1 (AKR1B1) (spot number 3, 20, 21 and 34 listed in Table 2 and Supplementary
Tables 3A to C), 3 each for peroxiredoxin 2 (PRDX2) (spot number 12, 13 and 14 listed in
Table 2 and Supplementary Table 3A) and prohibitin (PHB) (spot number 6, 25 and 26 listed
in Table 2 and Supplementary Tables 3A and B) and 2 for chloride intracellular channel
protein 4 (CLIC4) (spot number 25 and 26 listed in Supplementary Table 3B).
3.3. Comparison of results from the 2D DIGE analysis and from the nano LC-MS/MS
iTRAQ analysis
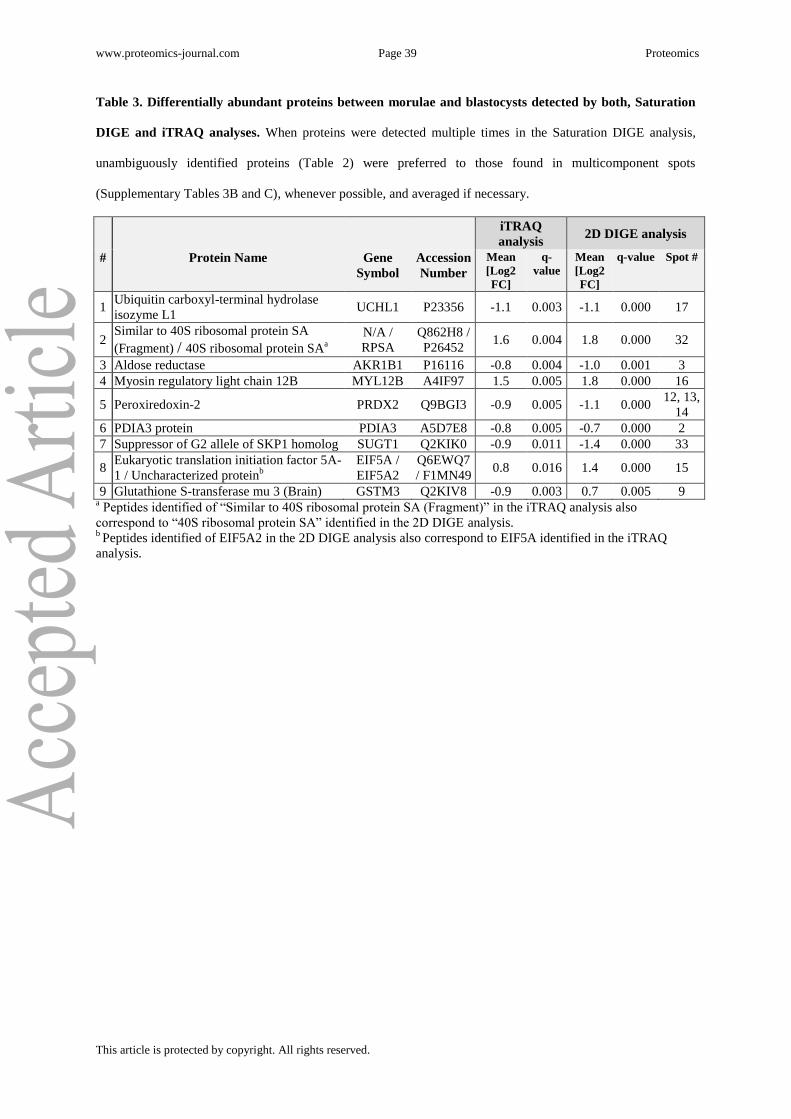
A total of 9 proteins were differentially abundant in both the LC-MS/MS based iTRAQ
analysis and the 2D gel based saturation DIGE analysis. They are listed together with their
log2 fold changes in Table 3. Of these proteins, 8 showed similar abundance alterations in
both approaches and thus verify exemplarily results from the iTRAQ approach. Fig. 2D
shows iTRAQ reporter ion signals in HCD MS/MS spectra of peroxiredoxin 2 peptide
QVTINDLPVGR, and corresponding 3D intensity shape plots from the 2D DIGE protein
spot analysis for all 6 biological replicates. As a single exception, the intensity of 1 protein
spot identified as glutathione S-transferase mu3 (GSTM3) was significantly increased in the
www.proteomics-journal.com Page 18 Proteomics
This article is protected by copyright. All rights reserved.
2D DIGE analysis, whereas in the iTRAQ analysis the majority of the corresponding peptides
indicated a decreased protein abundance.
3.4. Gene ontology analysis of differentially abundant proteins of the iTRAQ and the 2D
DIGE analysis
Significant protein abundance alterations from both the 2D DIGE (log2 fold change ≥ |0.6|, q-
value < 0.05 and unambiguously identified spot) and the iTRAQ analyses (log2 fold
change ≥ |0.6|, q-value < 0.05) were merged, leading to a set of 144 different proteins. Of
those, 105 proteins were more abundant in blastocysts, while 39 proteins had a higher
abundance in morulae. To visualize the putative functional relevance of these changes, the
differentially abundant proteins were subjected to a ClueGO analysis followed by a
CluePedia analysis which grouped the most relevant biological processes in a network with
terms and associated genes (Fig. 3A). Among the proteins increasing in abundance until the
blastocyst stage, this network analysis revealed an enrichment of proteins related to GO
terms, e.g., “translational elongation”, “mRNA metabolic process”, “histone mRNA
metabolic process”, “nucleosome assembly”, “ribosomal small subunit biogenesis”,
“ribonucleoprotein complex assembly”, and “nucleoside diphosphate metabolic process”.
Among the proteins decreasing in abundance until the blastocyst stage, an enrichment was
detected for the terms “intracellular steroid hormone receptor signaling pathway”, “pteridine-
containing compound biosynthetic process”, “cellular response to hydrogen peroxide”,
“response to unfolded protein” and “phosphatidylcholine biosynthetic process”. For insight
into localization of proteins, an additional GO analysis according to “cellular component”
was performed (Fig. 3B) and revealed that the majority of proteins increasing in abundance in
blastocysts is localized in the categories “ribonucleoprotein complex” and “cortical
cytoskeleton”.

www.proteomics-journal.com Page 19 Proteomics
This article is protected by copyright. All rights reserved.
4 Discussion
4.1. General remarks
The proteomes of morula and blastocysts were analysed by the 4-plex iTRAQ strategy
introduced by Ross et al. [41] which enabled a simultaneous analysis of 2 biological
replicates each. The analysis of 6 biological replicates enabled a valid statistical evaluation of
proteins [44]. In total, 140 proteins were found to be differentially abundant between morulae
and blastocysts (Fig. 1B, Table 1 and Supplementary Table 2). An additional proteomic
approach, the complementary 2D saturation DIGE analysis, had previously been
demonstrated by Berendt et al. [42] to facilitate the quantification of more than 2,000 protein
spots from only 500 ng total protein. Likewise, we prepared 2D gels containing 500 ng
protein each (corresponding to 5 embryos) and detected and quantified 2,024 signals in all
gels. In Fig. 2A and Fig. 2B, representative Cy5 gel images from morulae and blastocysts
demonstrate the high separation strength of these gels in both dimensions. As in the iTRAQ
approach, 6 biological replicates for each embryonic stage were generated in individual
experiments and analysed. As demonstrated in Fig. 2C, quantification of protein spots was
highly reproducible and enabled a valid statistical analysis leading to highly significant q-
values even after FDR correction (Table 2). For identification of protein spots, preparative
2D gels containing several hundreds of micrograms protein (corresponding to several
thousands of embryos) are needed. Since the preparation of such high numbers of embryos is
rather time and cost intensive, GV oocytes were used instead. In contrast to quantitative
aspects, the qualitative proteome of GV oocytes compared to embryos is very similar, due to
the large reservoir of proteins in oocytes and the late onset of embryonic genome activation at
the 8-cell stage [33]. Thus, the majority of protein spots in gel images of morulae have

www.proteomics-journal.com Page 20 Proteomics
This article is protected by copyright. All rights reserved.
corresponding spots in oocyte gel images, justifying the substitution of embryo proteins with
oocyte proteins for the qualitative analysis (Supplementary Fig. 1). Seventeen proteins were
unambiguously identified and significantly altered in abundance and 11 proteins were
identified from more than 1 spot. The latter most probably represent different isoforms of the
corresponding proteins, indicated by the shift in corresponding pI values. Among these
proteins are aldo-keto reductase family 1 member B1 (AKR1B1), peroxiredoxin 2 (PRDX2),
prohibitin (PHB), chloride intracellular channel protein 4 (CLIC4) and stomatin-like protein 2
(STOML2).
Successful verification of iTRAQ quantification results by the independent 2D DIGE
saturation approach is evident from Table 3 for 8 proteins, demonstrating high reproducibility
of abundance ratios with both techniques (Fig. 2D). Noteworthy, a single protein spot
identified as glutathione S-transferase mu 3 (GSTM3), increased by a log2 fold change of 0.7
in the 2D DIGE analysis, was decreased in abundance by a log2 fold change of 0.9 in the
iTRAQ analysis. A possible reason could be the existence of at least 4 different isoforms of
GSTM3 as previously detected in a 2D gel-based analysis of bovine GV and in vitro matured
MII oocytes [42], where it was referred to as “similar to GSTM5”. Polymorphism of the
GSTM gene cluster is well documented [45, 46] and we hypothesise that other GSTM3
isoforms escaped quantification in morulae or blastocysts due to limit of detection. Thus, the
GSTM3 abundance ratio determined in the 2D gel approach represents a correct value for the
abundance increase of the specific isoform detected there, while the iTRAQ value indicates
the overall decrease in GSTM3 abundance.
4.2. Proteome analysis of morulae and blastocysts reflects increasing translation and
proliferation during the morula to blastocyst transition
www.proteomics-journal.com Page 21 Proteomics
This article is protected by copyright. All rights reserved.
Embryogenesis is characterized by a gradual degradation of maternally inherited messenger
RNAs and initiation of embryonic transcription and translation during the maternal-to-
embryonic transition (MET), which takes place at about the 8-cell stage in the bovine system
[47-49]. The enhanced translation and proliferation after the MET is reflected in the proteome
analysis between morulae and blastocysts on several levels: (i)- 73 % of all differentially
abundant proteins from the iTRAQ analysis are increased in blastocysts (Fig. 1B); (ii)- GO
analysis of proteins with increased abundance in blastocysts (Fig. 3A) reveals a large group
of proteins related to macromolecular complex assembly and biogenesis (GO term
“ribonucleoprotein complex assembly”) as well as to RNA metabolic processes (GO terms
“histone mRNA metabolic process” and “mRNA metabolic process”); (iii)- proteins related
to the GO term “nucleosome assembly” are increased in abundance in blastocysts (Fig. 3A)
and mirror the rising number of cell nuclei during embryo development; (iv)- 21 proteins
related to the GO term “cortical cytoskeleton” are increased in abundance in blastocysts (Fig.
3B), which may reflect cell proliferation and differentiation; (v)- proteins related to ATP
production and metabolism, GO terms “cellular respiration” in Fig. 3A and “mitochondrial
proton-transporting ATP synthase complex, catalytic core F(1)” in Fig. 3B, are increased in
abundance in the blastocyst stage. The latter is consistent with a finding of Thompson et al.,
who demonstrated that ATP production starts to increase with compaction of the morula and
peaks at the blastocysts stage to support increased protein synthesis [50, 51]. In the GO
clustering of proteins increased in abundance in blastocysts, more than 40 proteins are
assigned to translation (GO term “translational elongation”) (Fig. 3A). Among them are
proteins responsible for translation initiation like receptor of activated protein kinase C 1
(GNB2L1/RACK1), eukaryotic translation initiation factor 5A-1 (EIF5A), and
nucleophosmin (NPM1). Evident from the iTRAQ approach, GNB2L1/RACK1, a ribosomal
protein, is increased in blastocysts by a log2 fold change of 1.5 (number 18 in Table 1). It
www.proteomics-journal.com Page 22 Proteomics
This article is protected by copyright. All rights reserved.
recruits activated protein kinase C to the ribosome, leading to the stimulation of translation
by phosphorylation of EIF6. Besides, it regulates several processes such as cell spreading, the
establishment of focal adhesions and cell–cell contacts [52]. EIF5A, increased in blastocysts
by a log2 fold change of 0.8 (number 52 in Supplementary Table 2), is a marker for
proliferation and important for the onset of DNA replication [53]. NPM1, which directs the
nuclear export of ribosomal subunits leading to increased rates of protein synthesis [54], is
increased by a log2 fold change of 1.4 in blastocysts (number 87 in Supplementary Table 2).
NPM1 is also involved in cell proliferation [55], which is coherent with ongoing cell
divisions during blastocyst development. Interestingly, NPM1 was recently found to be
involved in embryonic stem cell (ESC) maintenance and ESC fate determination. It was
shown to form complexes with OCT4, SOX2 and NANOG [56], which are essential factors
for maintenance of pluripotency [57] and are involved in the first lineage decisions.
Downregulation of NPM1 mRNA was shown to cause mesoderm and ectoderm
differentiation [56]. Thus, the increase of NPM1 in blastocysts may suppress a too early
differentiation of embryonic cells into different germ layers.
4.3. Annexin A6 (ANXA6) and aldose reductase (AKR1B1), 2 promising candidates in
molecular studies of the morula to blastocyst transition
An interesting protein during the ongoing blastocyst development is annexin A6. It was found
at increased abundance in blastocysts vs. morulae by a log2 fold change of 2.1 in the iTRAQ
analysis (number 16 in Table 1). As reviewed by Grewal et al. [58], this protein has several
functions and could play important roles in preimplantation embryonic development. It (i)
provides a scaffold to form membrane-bound multifactorial signalling complexes, (ii) is able
to regulate transient membrane-actin cytoskeleton interactions during endocytosis, (iii)
www.proteomics-journal.com Page 23 Proteomics
This article is protected by copyright. All rights reserved.
stabilises the protein/lipid composition during membrane microdomain formation, and (iv)
regulates secretory events.
Another important protein in our dataset is aldose reductase (AKR1B1), which was supposed
to act as a major prostaglandin (PG) synthase in the endometrium during early pregnancy in
the pig [59]. Madore and coworkers [60] also speculated AKR1B1 to be involved in PG
synthesis in bovine endometrium, especially PG F2 alpha (PGF2α) which is important for
luteolysis and termination of pregnancy. We detected a decrease of AKR1B1 protein
abundance (log2 fold change of about -0.9) in blastocysts in both the iTRAQ (number 16 in
Supplementary Table 2) and the 2D DIGE approach (spot number 3 in Table 2). AKR1B1
mRNA has been detected in bovine in vitro produced embryos by Dode and coworkers [61]
and expression of AKR1B1 mRNA has been associated with failures in pregnancy
establishment or resorption of the embryo [62], demonstrating its vital role in embryogenesis.
4.4. The reduction of redox enzymes may alter HIF dependent gene regulation
In the group of proteins showing decreased abundance in blastocysts, proteins associated with
“cellular response to hydrogen peroxide” were found (Fig. 3A). It is known that the embryo
possesses several antioxidant systems which have 2 main functions: fine-tuning of reactive
oxygen species (ROS) levels for signalling purposes, and protection from oxidative stress
[63]. Concerning the signalling aspects of fine tuning ROS levels, a hypothesis would be that
this alters gene regulation over a transcription factor family, the hypoxia inducible factors
(HIFs). HIFs regulate gene expression depending on the redox state of the cell and ROS
levels, leading to up-regulation of a variety of genes which are, beside others, involved in
energy metabolism and cell proliferation [64]. Since these processes are vital for early
embryonic development, it is possible that the reduction of redox enzymes in blastocysts is
required for HIF induced gene regulation via ROS species. This hypothesis is supported by
www.proteomics-journal.com Page 24 Proteomics
This article is protected by copyright. All rights reserved.
Harvey et al. who supposed that HIF activation might be important for bovine in vitro
embryos to adapt to a reduced oxygen environment [64]. Moreover, within the group of redox
enzymes, the PRDX isoforms 1, 2, 4 (number 26, 13 and 32, respectively, in Supplementary
Table 2) and 6 (spot number 18 in Table 2) were found to be decreased by a log2 fold change
between -0.7 and -1.3 in blastocysts. Peroxiredoxin enzymes are ubiquitously present in
various cell types and contain a conserved cysteine residue in the N-terminal region that is
the primary site of oxidation. Mammalian cells express 6 isoforms of PRDX (PRDX1 to 6)
which remove low levels of peroxides produced as a result of normal cellular metabolism
[65]. An abundance alteration of PRDX3 during in vitro maturation of bovine oocytes has
previously been observed [42], already indicating the involvement of this enzyme class in
developmental processes. Furthermore, PRDX mRNA expression was previously quantified
in early bovine embryos of different developmental stages [63]. While this analysis revealed
the existence of PRDX1 and 5 transcripts in all analysed stages (from oocyte to blastocyst),
PRDX4 mRNA was never detected in single embryos and PRDX2, 3 and 6 transcripts could
not be detected in 9- to 16-cell embryos. The authors suggested a complete degradation of
stored maternal PRDX2, 3 and 6 transcripts prior to the major embryonic genome activation,
which occurs between the 8-cell and the 16-cell stage. In contrast to the increase of PRDX6
mRNA at the blastocyst stage [63], our analysis demonstrated a decrease of PRDX6 protein
abundance. Furthermore, we were able to detect PRDX4 protein, while no PRDX4 transcripts
were detected in single embryos by Leyens and coworkers [63]. For both PRDX4 and 6, this
could be due to translation before the studied developmental stages. Furthermore, for
PRDX6, enhanced protein degradation may also be possible.
In summary, our study provides the first systematic differential proteome analysis of bovine
morulae and blastocysts, revealing new molecular correlates of early lineage specification
and differentiation events during bovine embryogenesis.

www.proteomics-journal.com Page 25 Proteomics
This article is protected by copyright. All rights reserved.
Acknowledgements
We thank Maria-Dorothee Faust for excellent assistance and embryo generation, as well as
other members of our laboratories for helpful discussions.
This work was supported by EU FP 7 (“Plurisys” HEALTH-F4-2009-223485 granted to the
Ludwig-Maximilians-University, Munich) and the Deutsche Forschungsgemeinschaft (GRK
1029 and FOR 1041 (both granted to Georg J. Arnold and Eckhard Wolf). EW is a member of
COST Action BM1308 “Sharing Advances on Large Animal Models (SALAAM)”.
The authors have declared no conflict of interest.
5 References
[1] Van Soom, A., Boerjan, M. L., Bols, P. E., Vanroose, G., et al., Timing of compaction
and inner cell allocation in bovine embryos produced in vivo after superovulation. Biol
Reprod 1997, 57, 1041-1049.
[2] Johnson, M. H., Ziomek, C. A., The foundation of two distinct cell lineages within the
mouse morula. Cell 1981, 24, 71-80.
[3] Tosti, E., Dynamic roles of ion currents in early development. Mol Reprod Dev 2010, 77,
856-867.
[4] Watson, A. J., Barcroft, L. C., Regulation of blastocyst formation. Front Biosci 2001, 6,
D708-730.
[5] Schrode, N., Xenopoulos, P., Piliszek, A., Frankenberg, S., et al., Anatomy of a
blastocyst: cell behaviors driving cell fate choice and morphogenesis in the early mouse
embryo. Genesis (New York, N.Y. : 2000) 2013, 51, 219-233.
www.proteomics-journal.com Page 26 Proteomics
This article is protected by copyright. All rights reserved.
[6] Stephenson, R. O., Rossant, J., Tam, P. P., Intercellular interactions, position, and polarity
in establishing blastocyst cell lineages and embryonic axes. Cold Spring Harb Perspect Biol
2012, 4.
[7] Wang, H., Dey, S. K., Roadmap to embryo implantation: clues from mouse models. Nat
Rev Genet 2006, 7, 185-199.
[8] Pauklin, S., Pedersen, R. A., Vallier, L., Mouse pluripotent stem cells at a glance. J Cell
Sci 2011, 124, 3727-3732.
[9] Nichols, J., Zevnik, B., Anastassiadis, K., Niwa, H., et al., Formation of pluripotent stem
cells in the mammalian embryo depends on the POU transcription factor Oct4. Cell 1998, 95,
379-391.
[10] Avilion, A. A., Nicolis, S. K., Pevny, L. H., Perez, L., et al., Multipotent cell lineages in
early mouse development depend on SOX2 function. Genes Dev 2003, 17, 126-140.
[11] Chambers, I., Colby, D., Robertson, M., Nichols, J., et al., Functional expression cloning
of Nanog, a pluripotency sustaining factor in embryonic stem cells. Cell 2003, 113, 643-655.
[12] Niwa, H., Toyooka, Y., Shimosato, D., Strumpf, D., et al., Interaction between Oct3/4
and Cdx2 determines trophectoderm differentiation. Cell 2005, 123, 917-929.
[13] Ralston, A., Rossant, J., Cdx2 acts downstream of cell polarization to cell-autonomously
promote trophectoderm fate in the early mouse embryo. Dev Biol 2008, 313, 614-629.
[14] Strumpf, D., Mao, C. A., Yamanaka, Y., Ralston, A., et al., Cdx2 is required for correct
cell fate specification and differentiation of trophectoderm in the mouse blastocyst.
Development (Cambridge, England) 2005, 132, 2093-2102.
[15] Evans, M. J., Kaufman, M. H., Establishment in culture of pluripotential cells from
mouse embryos. Nature 1981, 292, 154-156.

www.proteomics-journal.com Page 27 Proteomics
This article is protected by copyright. All rights reserved.
[16] Khan, D. R., Dube, D., Gall, L., Peynot, N., et al., Expression of pluripotency master
regulators during two key developmental transitions: EGA and early lineage specification in
the bovine embryo. PLoS One 2012, 7, e34110.
[17] Berg, D. K., Smith, C. S., Pearton, D. J., Wells, D. N., et al., Trophectoderm lineage
determination in cattle. Dev Cell 2011, 20, 244-255.
[18] Graf, A., Krebs, S., Zakhartchenko, V., Schwalb, B., et al., Fine mapping of genome
activation in bovine embryos by RNA sequencing. Proc Natl Acad Sci U S A 2014.
[19] Wang, Q. T., Piotrowska, K., Ciemerych, M. A., Milenkovic, L., et al., A genome-wide
study of gene activity reveals developmental signaling pathways in the preimplantation
mouse embryo. Dev Cell 2004, 6, 133-144.
[20] Zeng, F., Baldwin, D. A., Schultz, R. M., Transcript profiling during preimplantation
mouse development. Dev Biol 2004, 272, 483-496.
[21] Hamatani, T., Carter, M. G., Sharov, A. A., Ko, M. S., Dynamics of global gene
expression changes during mouse preimplantation development. Dev Cell 2004, 6, 117-131.
[22] Hansson, J., Krijgsveld, J., Proteomic analysis of cell fate decision. Curr Opin Genet
Dev 2013, 23, 540-547.
[23] Schwanhausser, B., Busse, D., Li, N., Dittmar, G., et al., Global quantification of
mammalian gene expression control. Nature 2011, 473, 337-342.
[24] Lu, R., Markowetz, F., Unwin, R. D., Leek, J. T., et al., Systems-level dynamic analyses
of fate change in murine embryonic stem cells. Nature 2009, 462, 358-362.
[25] Virant-Klun, I., Krijgsveld, J., Proteomes of animal oocytes: What can we learn for
human oocytes in the fertilization programme? Biomed Res Int 2014, 2014, 856907.
[26] Cortezzi, S. S., Garcia, J. S., Ferreira, C. R., Braga, D. P., et al., Secretome of the
preimplantation human embryo by bottom-up label-free proteomics. Anal Bioanal Chem
2011, 401, 1331-1339.

www.proteomics-journal.com Page 28 Proteomics
This article is protected by copyright. All rights reserved.
[27] Jensen, P. L., Grondahl, M. L., Beck, H. C., Petersen, J., et al., Proteomic analysis of
bovine blastocoel fluid and blastocyst cells. Syst Biol Reprod Med 2014.
[28] Jensen, P. L., Beck, H. C., Petersen, J., Hreinsson, J., et al., Proteomic analysis of human
blastocoel fluid and blastocyst cells. Stem Cells Dev 2013, 22, 1126-1135.
[29] Malhi, P. S., Adams, G. P., Mapletoft, R. J., Singh, J., Superovulatory response in a
bovine model of reproductive aging. Anim Reprod Sci 2008, 109, 100-109.
[30] Malhi, P. S., Adams, G. P., Singh, J., Bovine model for the study of reproductive aging
in women: follicular, luteal, and endocrine characteristics. Biol Reprod 2005, 73, 45-53.
[31] Adams, G. P., Pierson, R. A., Bovine model for study of ovarian follicular dynamics in
humans. Theriogenology 1995, 43, 113-120.
[32] Braude, P., Bolton, V., Moore, S., Human gene expression first occurs between the four-
and eight-cell stages of preimplantation development. Nature 1988, 332, 459-461.
[33] Memili, E., Dominko, T., First, N. L., Onset of transcription in bovine oocytes and
preimplantation embryos. Mol Reprod Dev 1998, 51, 36-41.
[34] Graf, A., Krebs, S., Heininen-Brown, M., Zakhartchenko, V., et al., Genome activation
in bovine embryos: Review of the literature and new insights from RNA sequencing
experiments. Anim Reprod Sci 2014.
[35] Berg, U., Brem, G., In vitro production of bovine blastocysts by in vitro maturation and
fertilization of oocytes and subsequent in vitro culture. Reprod Domest Anim 1989, 24, 134-
139.
[36] Parrish, J. J., Susko-Parrish, J. L., Leibfried-Rutledge, M. L., Critser, E. S., et al., Bovine
in vitro fertilization with frozen-thawed semen. Theriogenology 1986, 25, 591-600.
[37] Brosch, M., Yu, L., Hubbard, T., Choudhary, J., Accurate and sensitive peptide
identification with Mascot Percolator. J Proteome Res 2009, 8, 3176-3181.
www.proteomics-journal.com Page 29 Proteomics
This article is protected by copyright. All rights reserved.
[38] Nesvizhskii, A. I., Aebersold, R., Interpretation of shotgun proteomic data: the protein
inference problem. Mol Cell Proteomics 2005, 4, 1419-1440.
[39] Bindea, G., Mlecnik, B., Hackl, H., Charoentong, P., et al., ClueGO: a Cytoscape plug-
in to decipher functionally grouped gene ontology and pathway annotation networks.
Bioinformatics (Oxford, England) 2009, 25, 1091-1093.
[40] Bindea, G., Galon, J., Mlecnik, B., CluePedia Cytoscape plugin: pathway insights using
integrated experimental and in silico data. Bioinformatics (Oxford, England) 2013, 29, 661-
663.
[41] Ross, P. L., Huang, Y. N., Marchese, J. N., Williamson, B., et al., Multiplexed protein
quantitation in Saccharomyces cerevisiae using amine-reactive isobaric tagging reagents. Mol
Cell Proteomics 2004, 3, 1154-1169.
[42] Berendt, F. J., Frohlich, T., Bolbrinker, P., Boelhauve, M., et al., Highly sensitive
saturation labeling reveals changes in abundance of cell cycle-associated proteins and redox
enzyme variants during oocyte maturation in vitro. Proteomics 2009, 9, 550-564.
[43] Hsueh, H. M., Chen, J. J., Kodell, R. L., Comparison of methods for estimating the
number of true null hypotheses in multiplicity testing. J Biopharm Stat 2003, 13, 675-689.
[44] Karp, N. A., Lilley, K. S., Design and analysis issues in quantitative proteomics studies.
Proteomics 2007, 7 Suppl 1, 42-50.
[45] Jain, M., Kumar, S., Lal, P., Tiwari, A., et al., Role of GSTM3 polymorphism in the risk
of developing esophageal cancer. Cancer Epidemiol Biomarkers Prev 2007, 16, 178-181.
[46] Alexander, M., Karmaus, W., Holloway, J. W., Zhang, H., et al., Effect of GSTM2-5
polymorphisms in relation to tobacco smoke exposures on lung function growth: a birth
cohort study. BMC Pulm Med 2013, 13, 56.
www.proteomics-journal.com Page 30 Proteomics
This article is protected by copyright. All rights reserved.
[47] Frei, R. E., Schultz, G. A., Church, R. B., Qualitative and quantitative changes in protein
synthesis occur at the 8-16-cell stage of embryogenesis in the cow. J Reprod Fertil 1989, 86,
637-641.
[48] Meirelles, F. V., Caetano, A. R., Watanabe, Y. F., Ripamonte, P., et al., Genome
activation and developmental block in bovine embryos. Anim Reprod Sci 2004, 82-83, 13-20.
[49] Memili, E., First, N. L., Developmental changes in RNA polymerase II in bovine
oocytes, early embryos, and effect of alpha-amanitin on embryo development. Mol Reprod
Dev 1998, 51, 381-389.
[50] Thompson, J. G., Partridge, R. J., Houghton, F. D., Cox, C. I., Leese, H. J., Oxygen
uptake and carbohydrate metabolism by in vitro derived bovine embryos. J Reprod Fertil
1996, 106, 299-306.
[51] Thompson, J. G., Sherman, A. N., Allen, N. W., McGowan, L. T., Tervit, H. R., Total
protein content and protein synthesis within pre-elongation stage bovine embryos. Mol
Reprod Dev 1998, 50, 139-145.
[52] Nilsson, J., Sengupta, J., Frank, J., Nissen, P., Regulation of eukaryotic translation by the
RACK1 protein: a platform for signalling molecules on the ribosome. EMBO reports 2004, 5,
1137-1141.
[53] Hanauske-Abel, H. M., Slowinska, B., Zagulska, S., Wilson, R. C., et al., Detection of a
sub-set of polysomal mRNAs associated with modulation of hypusine formation at the G1-S
boundary. Proposal of a role for eIF-5A in onset of DNA replication. FEBS letters 1995, 366,
92-98.
[54] Maggi, L. B., Jr., Kuchenruether, M., Dadey, D. Y., Schwope, R. M., et al.,
Nucleophosmin serves as a rate-limiting nuclear export chaperone for the Mammalian
ribosome. Mol Cell Biol 2008, 28, 7050-7065.
www.proteomics-journal.com Page 31 Proteomics
This article is protected by copyright. All rights reserved.
[55] Okuwaki, M., The structure and functions of NPM1/Nucleophsmin/B23, a
multifunctional nucleolar acidic protein. J Biochem 2008, 143, 441-448.
[56] Johansson, H., Simonsson, S., Core transcription factors, Oct4, Sox2 and Nanog,
individually form complexes with nucleophosmin (Npm1) to control embryonic stem (ES)
cell fate determination. Aging 2010, 2, 815-822.
[57] Chen, L., Daley, G. Q., Molecular basis of pluripotency. Hum Mol Genet 2008, 17, R23-
27.
[58] Grewal, T., Koese, M., Rentero, C., Enrich, C., Annexin A6-regulator of the EGFR/Ras
signalling pathway and cholesterol homeostasis. Int J Biochem Cell Biol 2010, 42, 580-584.
[59] Seo, H., Choi, Y., Shim, J., Yoo, I., Ka, H., Comprehensive analysis of prostaglandin
metabolic enzyme expression during pregnancy and the characterization of AKR1B1 as a
prostaglandin F synthase at the maternal-conceptus interface in pigs. Biol Reprod 2014, 90,
99.
[60] Madore, E., Harvey, N., Parent, J., Chapdelaine, P., et al., An aldose reductase with 20
alpha-hydroxysteroid dehydrogenase activity is most likely the enzyme responsible for the
production of prostaglandin f2 alpha in the bovine endometrium. J Biol Chem 2003, 278,
11205-11212.
[61] Dode, M. A., Dufort, I., Massicotte, L., Sirard, M. A., Quantitative expression of
candidate genes for developmental competence in bovine two-cell embryos. Mol Reprod Dev
2006, 73, 288-297.
[62] El-Sayed, A., Hoelker, M., Rings, F., Salilew, D., et al., Large-scale transcriptional
analysis of bovine embryo biopsies in relation to pregnancy success after transfer to
recipients. Physiol Genomics 2006, 28, 84-96.
[63] Leyens, G., Knoops, B., Donnay, I., Expression of peroxiredoxins in bovine oocytes and
embryos produced in vitro. Mol Reprod Dev 2004, 69, 243-251.

www.proteomics-journal.com Page 32 Proteomics
This article is protected by copyright. All rights reserved.
[64] Harvey, A. J., Armant, D. R., Bavister, B. D., Nichols, S. M., Brenner, C. A., Inner cell
mass localization of NANOG precedes OCT3/4 in rhesus monkey blastocysts. Stem Cells
Dev 2009, 18, 1451-1458.
[65] Rhee, S. G., Chae, H. Z., Kim, K., Peroxiredoxins: a historical overview and speculative
preview of novel mechanisms and emerging concepts in cell signaling. Free Radic Biol Med
2005, 38, 1543-1552.
www.proteomics-journal.com Page 33 Proteomics
This article is protected by copyright. All rights reserved.
Fig. 1. Comparative proteomic analysis of morulae and blastocysts. A: Analysed
embryonic stages. Morulae were collected at day 5 post fertilization and blastocysts at day 7
post fertilization. B: Volcano plot of 502 protein abundance ratios determined from
morulae versus blastocysts in the iTRAQ approach. Red data points represent proteins
with a log2 fold change of ≥ |0.6| and a FDR corrected p-value (q-value) in the student’s t-test
of < 0.05; X-axis: log2 fold change of proteins, Y-axis: 1-p-values of proteins.
www.proteomics-journal.com Page 34 Proteomics
This article is protected by copyright. All rights reserved.
Fig. 2. Comparative proteomic analysis of morulae and blastocysts by 2D saturation
DIGE. A: De Cyder 6.5 Cy5 readout image of a morula gel. Yellow line: spot boundaries;
Numbers: Spots differentially abundant in morulae and blastocysts, corresponding to the
numbers used in Table 2. B: 2D saturation DIGE analysis. Cy5 readouts of a blastocyst gel
image. C: Graphic representations of 5 protein spots differing in intensity between
morulae and blastocysts in the DIGE analysis. Spot intensities are deduced from spot
volumes calculated from the height and spot borders of the peaks; Columns: individual spots
of morulae and blastocysts as indicated, Rows: Biological replicate 1-6. FC = Fold change.
Spot numbers correspond to Table 2. D: Comparison of abundance alteration determined
by DIGE spot intensity and iTRAQ reporter ion intensity. Upper graphs in panels:
iTRAQ-reporter ion zoom out of HCD MS/MS spectra of the peroxiredoxin 2 peptide
QVTINDLPVGR from each replicate of the iTRAQ nano LC-MS/MS analysis of morulae
and blastocysts; X-axis: m/z values of peaks from peptide fragments, Y-axis: relative peak
intensities; Lower graphs in panels: Intensity and shape plots of a differentially abundant spot
identified as peroxiredoxin 2; M1-6, B1-6: Biological replicate 1 to 6 of morulae or
blastocysts, respectively.

www.proteomics-journal.com Page 35 Proteomics
This article is protected by copyright. All rights reserved.

www.proteomics-journal.com Page 36 Proteomics
This article is protected by copyright. All rights reserved.
Fig. 3. CluePedia analyses of proteins significantly altered in abundance between the
morula and the blastocyst stage. In the functionally grouped networks, terms and their
associated genes (coloured in red) are linked based on к score (≥ 0.3). Edge thickness
indicates the association strength. Node size corresponds to the statistical significance for
each term. Green colour indicates an abundance increase during ongoing development, blue
colour indicates an abundance decrease during development. A: Network analysis
according to the GO term “biological process”. B: Network analysis according to the
GO term “cellular component”.

www.proteomics-journal.com Page 37 Proteomics
This article is protected by copyright. All rights reserved.
Tables
Table 1. Top 25 proteins differentially abundant between morulae and blastocysts detected by iTRAQ-
LC-MS/MS analysis. Selection of proteins is based on q-value. FC = fold change.
# Protein Name Gene Name Accession
Number
Molecular
Weight
[kDa]
Mean
[Log2
FC]
q-
value*
1 Bisphosphoglycerate mutase BPGM F1MX69 30.1 -1.3 0.001
2 Transketolase TKT A7E3W4 64.8 1.6 0.003
3 Histone H3 LOC531990 E1BGN3 15.4 2.3 0.003
4 Histone H1.2 HIST1H1C P02253 21.3 2.3 0.003
5 Histone H4 (Fragment)
G3X807 10.9 2.4 0.003
6 Ubiquitin carboxyl-terminal hydrolase
isozyme L1 UCHL1 P23356 28.3 -1.1 0.003
7 Inositol polyphosphate 1-phosphatase INPP1 P21327 43.9 -0.9 0.003
8 Glutathione S-transferase mu 3 (Brain) GSTM3 Q2KIV8 26.8 -0.9 0.003
9 Myosin light polypeptide 6 MYL6 P60661 16.9 1.7 0.003
10 60S ribosomal protein L13 RPL13 Q56JZ1 24.3 1.8 0.003
11 40S ribosomal protein S5 RPS5 Q5E988 22.9 1.8 0.003
12 Similar to ribosomal protein L30
(Fragment) Q862D6 15 2.0 0.003
13 Creatine kinase B-type CKB Q5EA61 42.7 2.9 0.003
14 Uncharacterized protein NCL E1B8K6 77.8 1.5 0.003
15 Heterogeneous nuclear ribonucleoprotein
U (Scaffold attachment factor A) HNRNPU A2VDN7 90.4 1.1 0.003
16 Annexin A6 ANXA6 P79134 75.9 2.1 0.004
17 Histone H2B HIST1H2BM F1MUD2 13.9 2.5 0.004
18 Guanine nucleotide-binding protein
subunit beta-2-like 1 GNB2L1 P63243 35.1 1.5 0.004
19 LIM and SH3 domain protein 1 LASP1 Q3B7M5 29.7 2.0 0.004
20 Annexin A2 ANXA2 P04272 38.6 2.5 0.004
21 Uncharacterized protein HSPA6 F1MWU9 70.9 -1.0 0.004
22 L-lactate dehydrogenase A chain LDHA P19858 36.6 -0.8 0.004
23 Peroxiredoxin-1 PRDX1 Q5E947 22.2 -0.7 0.004
24 D-dopachrome decarboxylase DDT A5PK65 12.9 0.8 0.004
25 Alpha-actinin 1 ACTN1 A4ZZF8 102.8 1.0 0.004
*FDR corrected student’s t-test p-value
www.proteomics-journal.com Page 38 Proteomics
This article is protected by copyright. All rights reserved.
Table 2. Unambiguously identified spots from differentially abundant proteins between morulae and
blastocysts from the 2D saturation DIGE analysis. (log2 fold change (Log2 FC) ≥ │0.6│).
Spot #
in Fig.
2A
Protein Name Gene
Symbol
Accession
Number
Mean
[Log2
FC]
q-value Mascot
Score
# of
unique
peptides
1 Rab GDP dissociation inhibitor alpha GDI1 P21856 -1.1 0.002 195 3
2 PDIA3 protein PDIA3 A5D7E8 -0.7 0.000 3249 31
3 Aldose reductase AKR1B1 P16116 -1.0 0.001 386 6
5 Isoform Beta-2 of F-actin-capping
protein subunit beta CAPZB P79136-2 0.6 0.000 847 8
6 Prohibitin PHB Q3T165 -0.6 0.000 1622 16
7 Isoform 2 of Tropomyosin alpha-3
chain TPM3 Q5KR47-2 2.8 0.000 874 11
8 Ubiquitin carboxyl-terminal hydrolase
isozyme L3 UCHL3 Q2TBG8 -0.8 0.001 679 6
9 Glutathione S-transferase mu 3 (Brain) GSTM3 Q2KIV8 0.7 0.005 746 9
10 Calpain small subunit 1 CAPNS1 P13135 1.7 0.000 97 2
11 GLO1 protein GLO1 A4FUZ1 -0.8 0.000 390 5
12 Peroxiredoxin-2 PRDX2 Q9BGI3 -1.1 0.000 1199 10
13 Peroxiredoxin-2 PRDX2 Q9BGI3 -0.9 0.000 497 6
14 Peroxiredoxin-2 PRDX2 Q9BGI3 -1.3 0.000 440 5
15 Uncharacterized protein EIF5A2 F1MN49 1.4 0.000 178 2
16 Myosin regulatory light chain 12B MYL12B A4IF97 1.8 0.000 434 4
18 Peroxiredoxin-6 PRDX6 O77834 -0.9 0.000 764 8
22 Farnesyl pyrophosphate synthase FDPS Q8WMY2 -0.9 0.000 382 6
www.proteomics-journal.com Page 39 Proteomics
This article is protected by copyright. All rights reserved.
Table 3. Differentially abundant proteins between morulae and blastocysts detected by both, Saturation
DIGE and iTRAQ analyses. When proteins were detected multiple times in the Saturation DIGE analysis,
unambiguously identified proteins (Table 2) were preferred to those found in multicomponent spots
(Supplementary Tables 3B and C), whenever possible, and averaged if necessary.
iTRAQ
analysis 2D DIGE analysis
# Protein Name Gene
Symbol
Accession
Number
Mean
[Log2
FC]
q-
value
Mean
[Log2
FC]
q-value Spot #
1 Ubiquitin carboxyl-terminal hydrolase
isozyme L1 UCHL1 P23356 -1.1 0.003 -1.1 0.000 17
2 Similar to 40S ribosomal protein SA
(Fragment) / 40S ribosomal protein SAa
N/A /
RPSA
Q862H8 /
P26452 1.6 0.004 1.8 0.000 32
3 Aldose reductase AKR1B1 P16116 -0.8 0.004 -1.0 0.001 3
4 Myosin regulatory light chain 12B MYL12B A4IF97 1.5 0.005 1.8 0.000 16
5 Peroxiredoxin-2 PRDX2 Q9BGI3 -0.9 0.005 -1.1 0.000 12, 13,
14
6 PDIA3 protein PDIA3 A5D7E8 -0.8 0.005 -0.7 0.000 2
7 Suppressor of G2 allele of SKP1 homolog SUGT1 Q2KIK0 -0.9 0.011 -1.4 0.000 33
8 Eukaryotic translation initiation factor 5A-
1 / Uncharacterized proteinb
EIF5A /
EIF5A2
Q6EWQ7
/ F1MN49 0.8 0.016 1.4 0.000 15
9 Glutathione S-transferase mu 3 (Brain) GSTM3 Q2KIV8 -0.9 0.003 0.7 0.005 9 a Peptides identified of “Similar to 40S ribosomal protein SA (Fragment)” in the iTRAQ analysis also
correspond to “40S ribosomal protein SA” identified in the 2D DIGE analysis. b Peptides identified of EIF5A2 in the 2D DIGE analysis also correspond to EIF5A identified in the iTRAQ
analysis.